
Abstract
The American Academy of Pediatrics recommends that parents read with their children early and often and limits on screen-based media. While book sharing may benefit attention in children, effects of animated content are controversial, and the influence of either on attention networks has not previously been studied. This study involved functional magnetic resonance imaging (fMRI) of three separate active-task scans composed of similar 5-min stories presented in the same order for each child (audio → illustrated → animated), followed by assessment of comprehension. Five functional brain networks were defined a priori through literature review: dorsal attention network (DAN), ventral attention network (VAN), language (L), visual imagery (VI), and visual perception (VP). Analyses involved comparison of functional connectivity (FC) within- and between networks across formats, applying false discovery rate correction. Twenty-seven of 33 children completed fMRI (82%; 15 boys, 12 girls; mean 58 ± 8 months old). Comprehension of audio and illustrated stories was equivalent and lower for animation (p < 0.05). For illustration relative to audio, FC within DAN and VAN and between each of these and all other networks was similar, lower within-L, and higher between VI-VP, suggesting reduced strain on the language network using illustrations and imagery. For animation relative to illustration, FC was lower between DAN-L, VAN-VP, VAN-VI, L-VI, and L-VP, suggesting less focus on narrative, reorienting to imagery, and visual-language integration. These findings suggest that illustrated storybooks may be optimal at this age to encourage integration of attention, visual, and language networks, while animation may bias attention toward VP.
Introduction
The American Academy of Pediatrics (AAP) recommends that parents begin reading to their children soon after birth, citing enduring cognitive, social-emotional, and neurobiological benefits (AAP Council on Early Childhood, 2014). The AAP also recommends limits on screen-based media, citing an array of developmental and health risks with early and excessive use, including problems with attention and executive function (Lillard et al., 2015; Swing et al., 2010). More recently, the World Health Organization released even more aggressive recommendations for children under age 5 years, citing a need to study the impact of screen-based compared to interactive activities such as storytelling (World Health Organization, 2019). Screen-based media is ubiquitous in children's lives (AAP Council on Communications and Media, 2016; Rideout, 2017) and has added unprecedented dimensions to story sharing, including cartoons and “enhanced” animated content (Parish-Morris et al., 2013). There is conflicting evidence regarding cognitive-behavioral effects of such features in children (Chiong et al., 2012; Parish-Morris et al., 2013; Reich et al., 2016; Strouse and Ganea, 2017a,b), although their influence on underlying brain networks has not been studied. This represents a major gap in evidence at this critical stage in development, when plasticity is high and neural connections are reinforced through experiences and practice (Hebb, 1949; Kolb et al., 2017; Romeo et al., 2018). Improved understanding of neurobiological mechanisms underlying how story content is processed in children has potential to inform existing and future research on brain development and the reinforcement of guidelines on one hand and the applications of intervention programs such as dialogic reading on the other (Lever and Senechal, 2011; Twait et al., 2019).
As reading is a relatively new invention (Horowitz-Kraus and Hutton, 2015), children are not born with a brain network supporting this ability (Dehaene et al., 2015; Horowitz-Kraus and Hutton, 2015). Instead, language, visual, and executive networks are integrated in response to reading exposure and practice (Dehaene et al., 2015; Horowitz-Kraus and Hutton, 2015). While some networks mature early (e.g., primary auditory and visual; Power et al., 2010), those for higher-order skills, including attention, exhibit protracted development (Gogtay et al., 2004; Power et al., 2010). Shared book reading provides opportunities for the application of attentional skills, from joint attention in infancy (Bus et al., 1995; Farrant, 2012) through goal-directed focus for longer texts (Roberts et al., 2015). By contrast, proposed mechanisms of negative effects of screen time include inadequate practice of self-regulation skills (AAP Council on Communications and Media, 2016; Brzozowska and Sikorska, 2016; Lillard and Peterson, 2011).
There are two distinct attention networks involved with multimodal processing in the human brain (Petersen and Posner, 2012; Vossel et al., 2014). The dorsal attention network (DAN) supports “top-down,” goal-directed focus (Farrant and Uddin, 2015; Vossel et al., 2014), and the ventral attention network (VAN) supports “bottom-up” reorienting to unexpected yet contextually relevant external (e.g., audio-visual; Macaluso, 2010) or internal (e.g., imagery; Zimmer, 2008) stimuli (Corbetta et al., 2008; Farrant and Uddin, 2015; Petersen and Posner, 2012; Vossel et al., 2014). The basic structure of the DAN and VAN is present by age 2 years and stabilized by adolescence (Grayson and Fair, 2017; Lewis et al., 2018), shaped by environmental factors (Grayson and Fair, 2017; Petersen and Posner, 2012; Rohr et al., 2018), notably cognitive stimulation in the home (Farrant and Uddin, 2015; Knudsen, 2004). They are linked through dynamic coupling (Vossel et al., 2014; Wu et al., 2015), capacity increasing with age and development (Petrican et al., 2017; Rohr et al., 2018). Each is functionally connected with language and visual networks, including the putative “Visual Word Form Area” in the fusiform gyrus that is highly involved with reading mastery (de Diego-Balaguer et al., 2016; Saygin et al., 2016; Vogel et al., 2012). Increased functional connectivity (FC) within the DAN is associated with greater selective attention or focus (Rohr et al., 2017) and performance on-task (Fritz et al., 2007), including supporting language comprehension (Kristensen et al., 2013; Wang and Holland, 2014; Yue et al., 2013). The VAN serves as a gatekeeper, determining if unexpected/distracting stimuli are consistent with task goals, but is inhibited by high working memory load (Corbetta et al., 2008; Klemen et al., 2010; Vossel et al., 2014).
FC analysis using blood oxygen level-dependent fMRI (BOLD fMRI) is a powerful means to explore brain networks during cognitive states or tasks (Bastos and Schoffelen, 2015) and comparison between them (Bray et al., 2015; Di et al., 2013). Sparse recent studies have described greater FC between DAN and other functional networks associated with better performance on tasks supported by these networks, including visual and language tasks (Jung et al., 2018; Meehan et al., 2017). Similarly, greater FC involving VAN and other functional networks has been interpreted as higher task-switching involving the task-related network (Domakonda et al., 2019). The aim of this study was to apply BOLD fMRI to explore differences in FC involving the DAN, VAN, visual, and language networks in preschool-age children during stories presented in audio, illustrated, and animated format. This builds on a recently published related analysis suggesting optimal integration of functional networks supporting language, imagery, and learning for illustration relative to other story formats described as a “Goldilocks Effect,” where audio may be “too cold,” animation “too hot,” and illustration “just right” at this age (Hutton et al., 2018). We hypothesized that during the animated story, FC would be maximal between the DAN and visual perception (VP) network attributable to greater focus on visual stimuli (Buchel and Friston, 1997; Parks and Madden, 2013) and that VAN engagement would be muted, attributable to high visual processing load (“load theory of cognitive control”; Lavie et al., 2004; Vossel et al., 2014). By contrast, we hypothesized higher FC between the DAN, language, and imagery networks during the other, less-visually-stimulating formats, reflecting reorienting of focus to language and imagery modulated by higher FC involving the VAN (Chun et al., 2011).
Materials and Methods
Participants
This study involved healthy preschool-age children recruited through advertisement at our institution. Exclusion criteria included prematurity before 38 weeks, developmental delay, bilingual/non-English speaking household, kindergarten attendance, and standard contraindications to magnetic resonance imaging (MRI). Written informed consent was obtained from a parent for each child, families were compensated for time and travel, and our study was approved by the Cincinnati Children's Hospital Institutional Review Board.
MRI and preprocessing
MRI was performed using a 3T Philips Ingenia scanner with a 32-channel head coil and Avotec audiovisual system. For fMRI, BOLD-weighted scans covering the entire brain with voxel size 2.5 × 2.5 × 3.5 mm were acquired using multiband acquisition, with repetition time/echo time = 597/30 ms. Details of play- based acclimatization techniques used before MRI are described by Vannest et al. (2014). All children were awake and nonsedated during MRI, alertness monitored with a visual eye-tracking system. Our protocol involved a T1-weighted anatomical scan lasting ∼6 min and four BOLD fMRI sequences lasting ∼5 min each (resting state and three active tasks). Resting state data were used for data-driven parcellation of a priori-defined network masks into optimal functionally homogenous regions of interest (ROIs), described below.
MRI preprocessing was performed with SPM12 software (v6685) and the CONN toolbox (Whitfield-Gabrieli and Nieto-Castanon, 2012). T1-weighted images were processed using SPM12's Unified Segmentation Algorithm to obtain tissue probability maps (gray matter, white matter, and cerebrospinal fluid), as well as the forward deformation matrix, describing the subject-specific nonlinear translation to standardized space. BOLD data were temporally realigned and unwarped, coregistered to anatomical images, and normalized to standardized space. ROI time series were taken as the simple mean of BOLD signals extracted from the unsmoothed functional data (as is standard for ROI analyses in Conn) from all voxels within each ROI extent (see Functional Brain Network Definition and Parcellation section below for details on ROI definitions). Further temporal whitening was achieved by regression of the zero- and first-order derivatives of the framewise motion parameters, as well as the first five principle components of the BOLD signals extracted from each of the white matter and cerebrospinal fluid compartments. Finally, residual BOLD data were bandpass filtered (at Conn's default window: 0.008–0.09 Hz) to eliminate confounds from signal drift, as well as cardiac and respiratory artifact.
Framewise realignment parameters were fed into the artifact detection tool, and frames with composite movement >1 mm or global mean intensity z-score less than ±6 were demarcated as outliers and scrubbed from the analyses. Importantly, framewise motion parameters did not significantly differ between task states, either with or without outlier frames included (Supplementary Table S1). To ensure that our choice of motion thresholds were adequate in controlling for motion induced correlations, we computed correlations between FC strength and three different quality control (QC) metrics (average composite motion, average absolute change in global signal, and number of scrubbed frames) for each of 130,816 different voxel–voxel pairs (from 512 voxels uniformly distributed over a gray matter mask) for each of our four scan conditions. The rationale here is that if motion-induced correlations persist in the data, this would manifest as positive correlations between voxel–voxel FC and summary measures of subject motion. Accordingly, we performed 12 two-tailed, one-sample t-tests (3 QC metrics × 4 conditions) of the null hypothesis that the mean of the 130,816 correlations was equal to 0; all 12 null hypotheses failed to be rejected (p > 0.05, uncorrected). Similarly, we performed 9 two-tailed, two-sample t-tests (for each QC metric, between each pair of story conditions) testing the null hypothesis that the mean of the 130,816 correlations was equal between two given conditions. Again, all null hypotheses failed to be rejected (p > 0.05, uncorrected).
fMRI story protocol
Our fMRI protocol involved three different children's storybooks lasting ∼5 min each (294 ± 6 sec), presented without interruption in three formats (audio → audio + illustration → animation), separated by 3-min pauses. We developed this protocol to address concerns regarding excessive motion and confusion/anxiety with traditional fMRI block designs in children and to present an “ecological” task comparable to real-world story presentation (Hasson et al., 2010). A different story was used for each format to address the potential confound of repeated exposure to narrative content rendering later trials less difficult or interesting. The order of story presentation was the same for each child, to address potential visual priming effects and concerns that animation exposure can negatively influence cognitive function during subsequent tasks at this age (Lillard and Peterson, 2011). Children were asked if they had read or seen any of the three stories before, to confirm no pre-exposure.
The stories used were published picture books by the same author intended to be read aloud, nonrhymed, and similar in lexical, syntactic, and semantic content, with Lexile® difficulty level from 460 to 490 (MetaMetrics, Durham, NC). Narrative for the audio (The Sand Castle Contest) and illustrated (Andrew's Loose Tooth) stories was downloaded with permission from the author's website (
Immediately following MRI, children were asked three questions per story regarding factual content, whether they could hear the story well (1 = yes, 2 = no), and how interesting it was (1 = very, 2 = kind of, 3 = not very). Responses were compared between formats using two-tailed t-tests.
Functional brain network definition and parcellation
Five functional brain networks were defined using literature review, emphasizing meta-analyses and connectivity-based research involving children (Table 1). These were as follows: DAN (Brissenden et al., 2016; Corbetta and Shulman, 2002; Petersen and Posner, 2012; Vossel et al., 2014), VAN (Corbetta and Shulman, 2002; Petersen and Posner, 2012; Vossel et al., 2014), VP (Calhoun et al., 2001), VI (higher-order visual processing not requiring visual input; Daselaar et al., 2010; Mechelli et al., 2004), and language, particularly higher-order phonological, syntactic, and semantic processing (Binder et al., 2009; Price 2012). Each was in terms of neurological Brodmann areas (BA) or anatomically delineated structures (e.g., hippocampus; Diedrichsen et al., 2009).
A Priori Defined Functional Brain Networks
Functional brain networks defined a priori as neurological BA or anatomical names using the Harvard-Oxford Functional Brain or Automated Anatomical Labeling Atlas. Primary references for each network are included in parentheses. The number in the right column is the number of areas (nodes) for the respective network derived applying the parcellation approach described in Craddock et al. (2012). All networks are bilateral, with the exception of the VAN, which is right lateralized.
BA, Brodmann areas; DAN, dorsal attention network; L, language; VAN, ventral attention network; VI, visual imagery; VP, visual perception.
Given reliance of available atlases largely on adult subjects and functional heterogeneity described for some areas (e.g., BA 37 for VP and VI; the “Visual Word Form Area”; McCandliss et al., 2003), we refined our ROI using a data-driven parcellation approach described in Craddock et al. (2012) using publicly available code accessed from the GitHub website. First, the preprocessed functional data from the resting state were smoothed with an 8 mm Gaussian kernel and masked to each of our networks of interest. Then for each of these networks, a normalized cut spectral clustering algorithm was applied to generate subject-specific voxel-wise similarity matrices which were in turn averaged together before being clustered into N preliminary ROIs per network where N was chosen such that resultant ROIs were 2.14 mL in volume on average. Finally, the networks were refined to eliminate functionally incongruous ROIs that resulted from the inclusion of very large BA in the initial network definitions; connectivity matrices were generated for each network using the resting state data; and ROIs with median connectivity strength (Fisher transformed r) of <0.15 across all subjects were discarded. Using this approach, 214 ROIs were defined across the five a priori networks.
FC analysis
The CONN toolbox was used for all first-level FC analyses of each story format (Whitfield-Gabrieli and Nieto-Castanon, 2012). Custom MATLAB-based programming was then incorporated to explore second-level FC within and between networks. Because we hypothesized format-dependent differences at the network level, we computed aggregate FC measures, calculated as the mean of the pair-wise, Fisher-transformed, bivariate correlation coefficients, for all ROIs within or between networks. Average network FC was then compared between story formats using two-tailed, paired t-tests, with α = 0.05 and applying false discovery rate (FDR) correction for multiple comparisons (15 within- and between-network comparisons). Significant results at the network level were explored using post hoc analyses, where ROI-level connections within and between networks were tested between story formats using two-tailed, paired t-tests, again with α = 0.05 and applying FDR correction for multiple comparisons (N × M comparisons for post hoc analyses between two networks, where N and M are the number of ROIs in each network involved, or (N 2 – N)/2 for post hoc analyses within one network. The number of ROIs for each network is listed in Table 1).
Results
Demographics
Thirty-three children arrived for their visit, and 27 (82%) completed fMRI (15 boys, 12 girls; mean 58 ± 8 months, range 44–71; all Caucasian). Fifty-six percent of mothers were college graduates, 26% graduate level, 15% high school, and 4% below high school. Fifteen percent reported household income under $50,000/year, 33% $50,000–$100,000/year, and 52% over $100,000/year. All children and parents denied having read or seen any of the three stories before.
Story post-tests
Fourteen children completed story post-tests, attributable to these being added midway through the study. All reported being able to hear each story equally well, and there was no significant difference in interest. Mean comprehension scores were 81% for audio (±33%), 70% for illustration (±22%), and 50% for animation (±33%), significantly different for audio > animation (p < 0.05), marginally significant for illustration > animation (p < 0.1), and not significant for audio > illustration.
FC for resting state and individual story formats
One-sample t-tests showed that within-network FC was significantly (p < 0.05 FDR corrected), variably, positive for all networks in each story format and during resting state, suggesting network coherence. Similarly, between-network FC was significantly (p < 0.05 FDR corrected), more variably, positive in all formats for all network pairs, with the exception of VP-L and VP-VAN, which were marginally positive for audio and illustrated formats but not for rest or animation. No within-network or between-network FC was associated with differences in gender (p > 0.05, two-tailed two-sample t-test), maternal education (p > 0.05, Pearson correlation), or income (p > 0.05, Spearman rank correlation) in any of the three story formats.
FC differences between story formats
Comparisons of within- and between-network FC changes across story formats are summarized in Figure 1 and Table 2. Three-dimensional renderings and ROI-level descriptions of significant FC differences elucidated through post hoc tests are provided in Figures 2 –4. The significance threshold for all FC comparisons was p < 0.05 (FDR corrected).
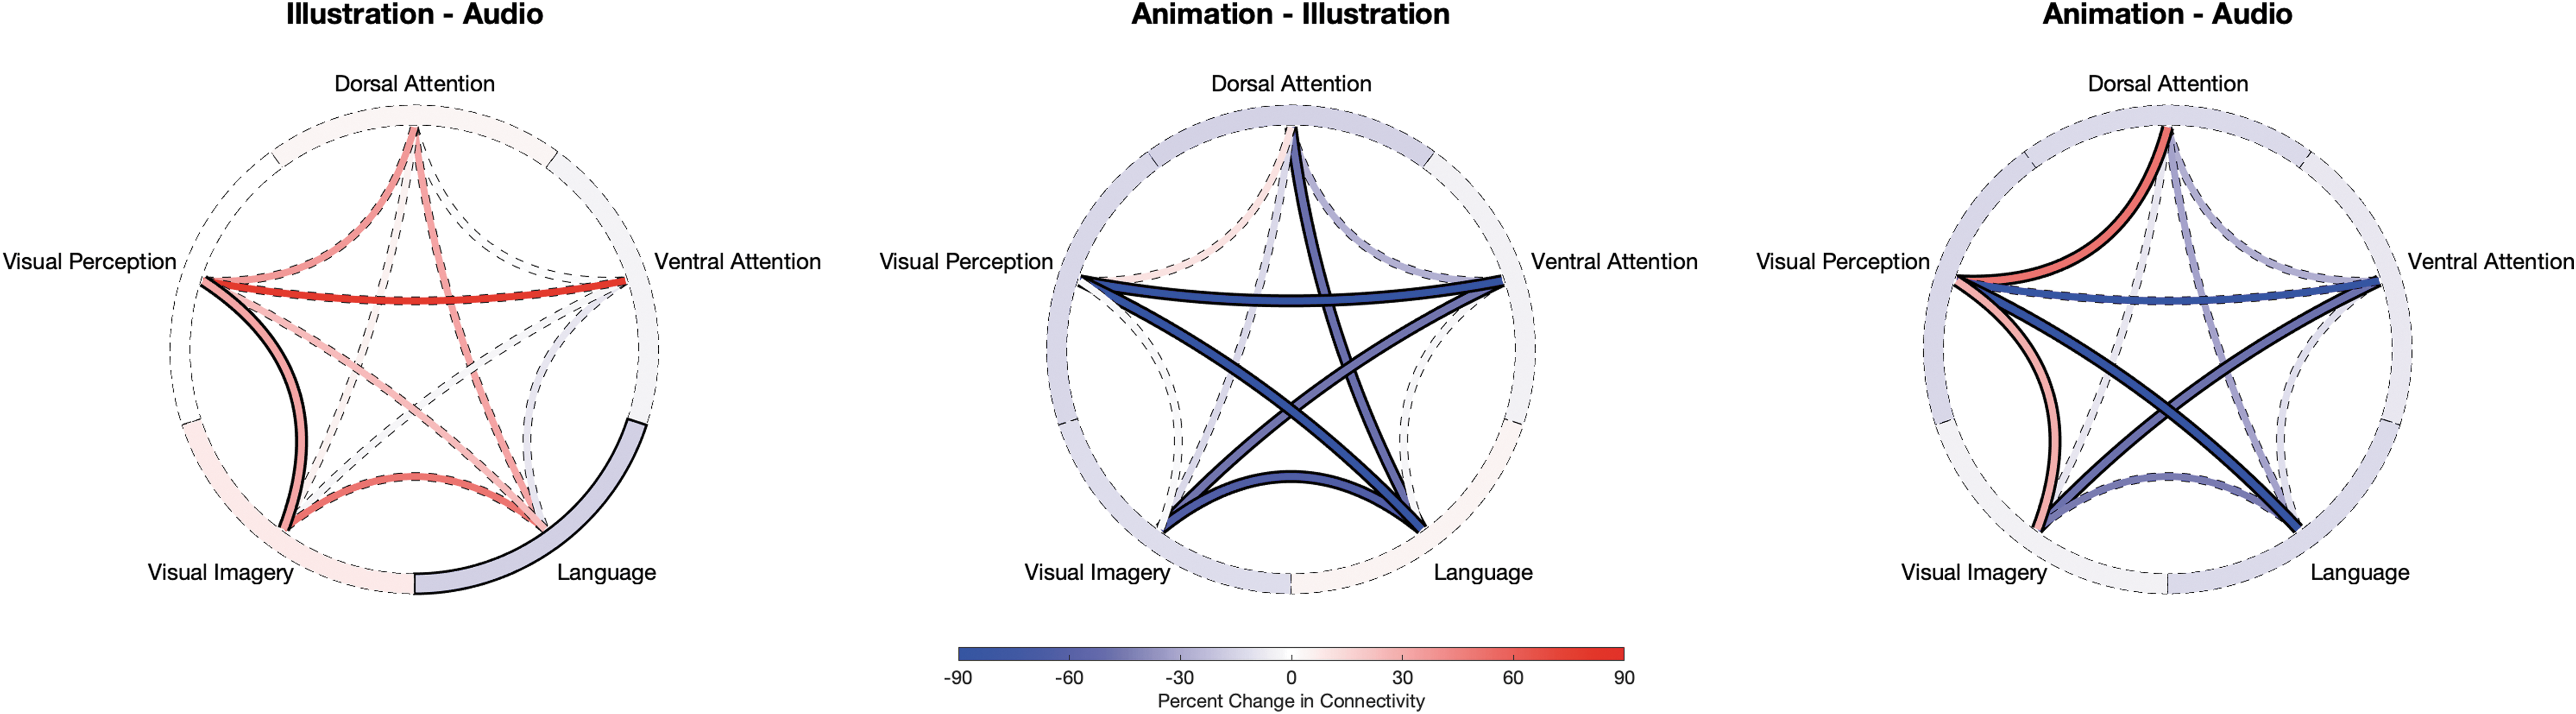
Comparison of within- and between-network FC changes between story formats. Connectivity wheels show the percent change in FC within and between networks, for audio, illustrated, and animated format. For each wheel, the “tread” represents within-network FC and the “spokes” represent between-network FC, applying FDR correction (p < 0.05). Solid lines reflect statistically significant differences, with red reflecting increased FC and blue reflecting decreased FC. There were significant changes in illustration relative to audio (decreased within-L; increased between VI-VP), animation relative to illustration (decreased between DAN-L, VAN-VI, VAN-VP, L-VI, L-VP), and animation relative to audio (increased between DAN-VP, VI-VP; decreased between L-VP, VAN-VI). DAN, dorsal attention network; FC, functional connectivity; FDR, false discovery rate; L, language; VAN, ventral attention network; VI, visual imagery; VP, visual perception.
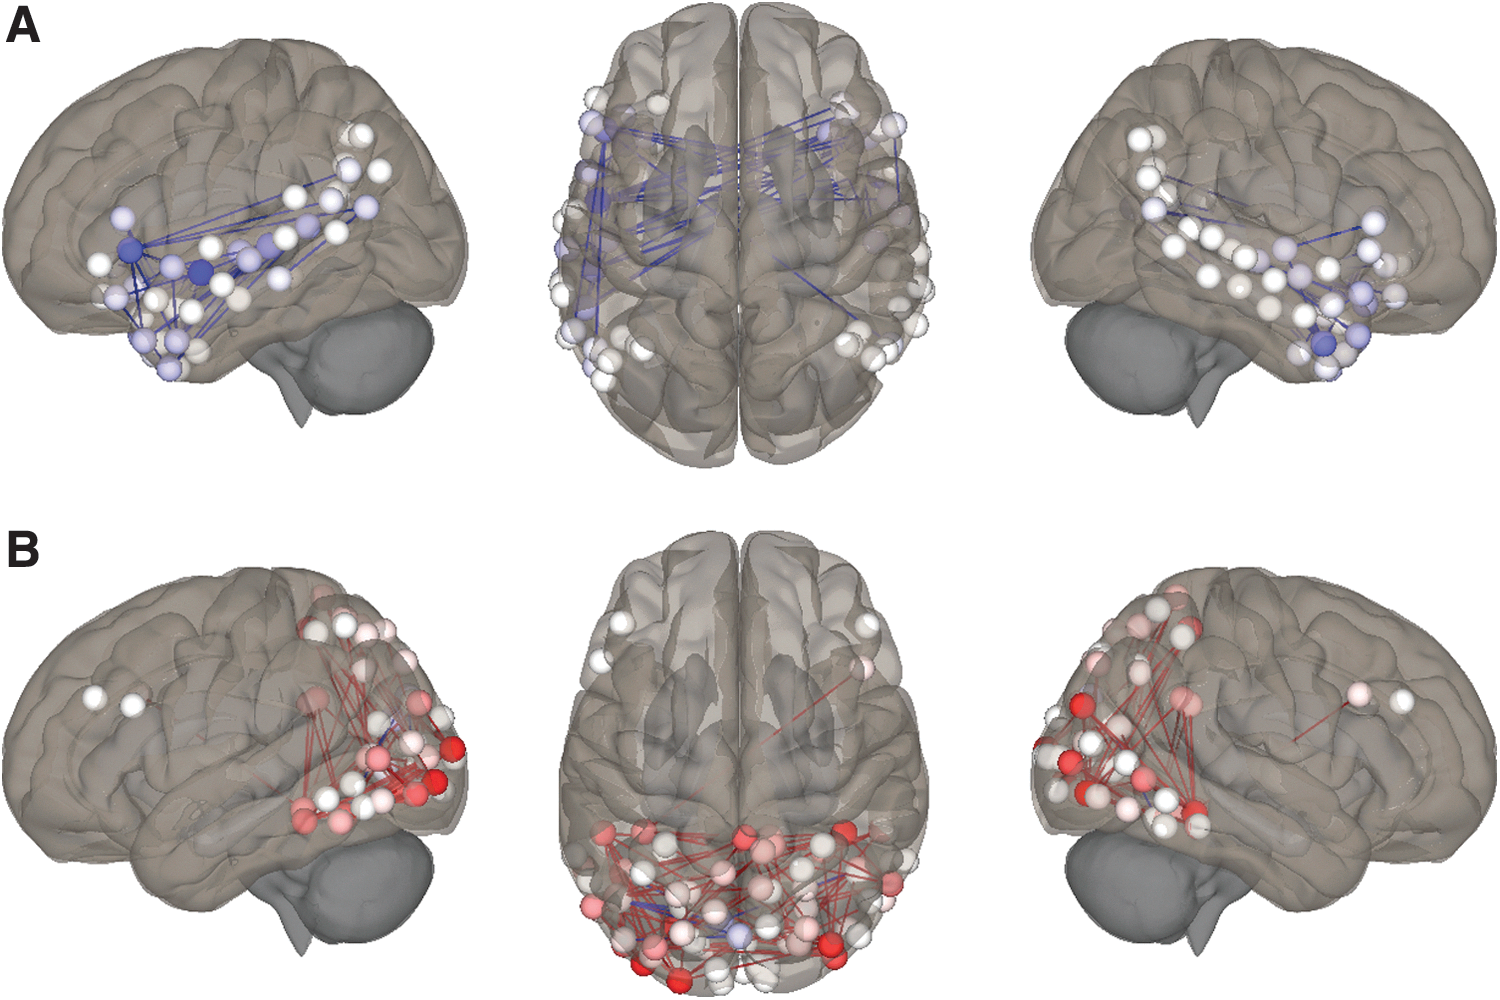
Post hoc analyses investigating ROI-level changes in FC in illustrated format relative to audio.
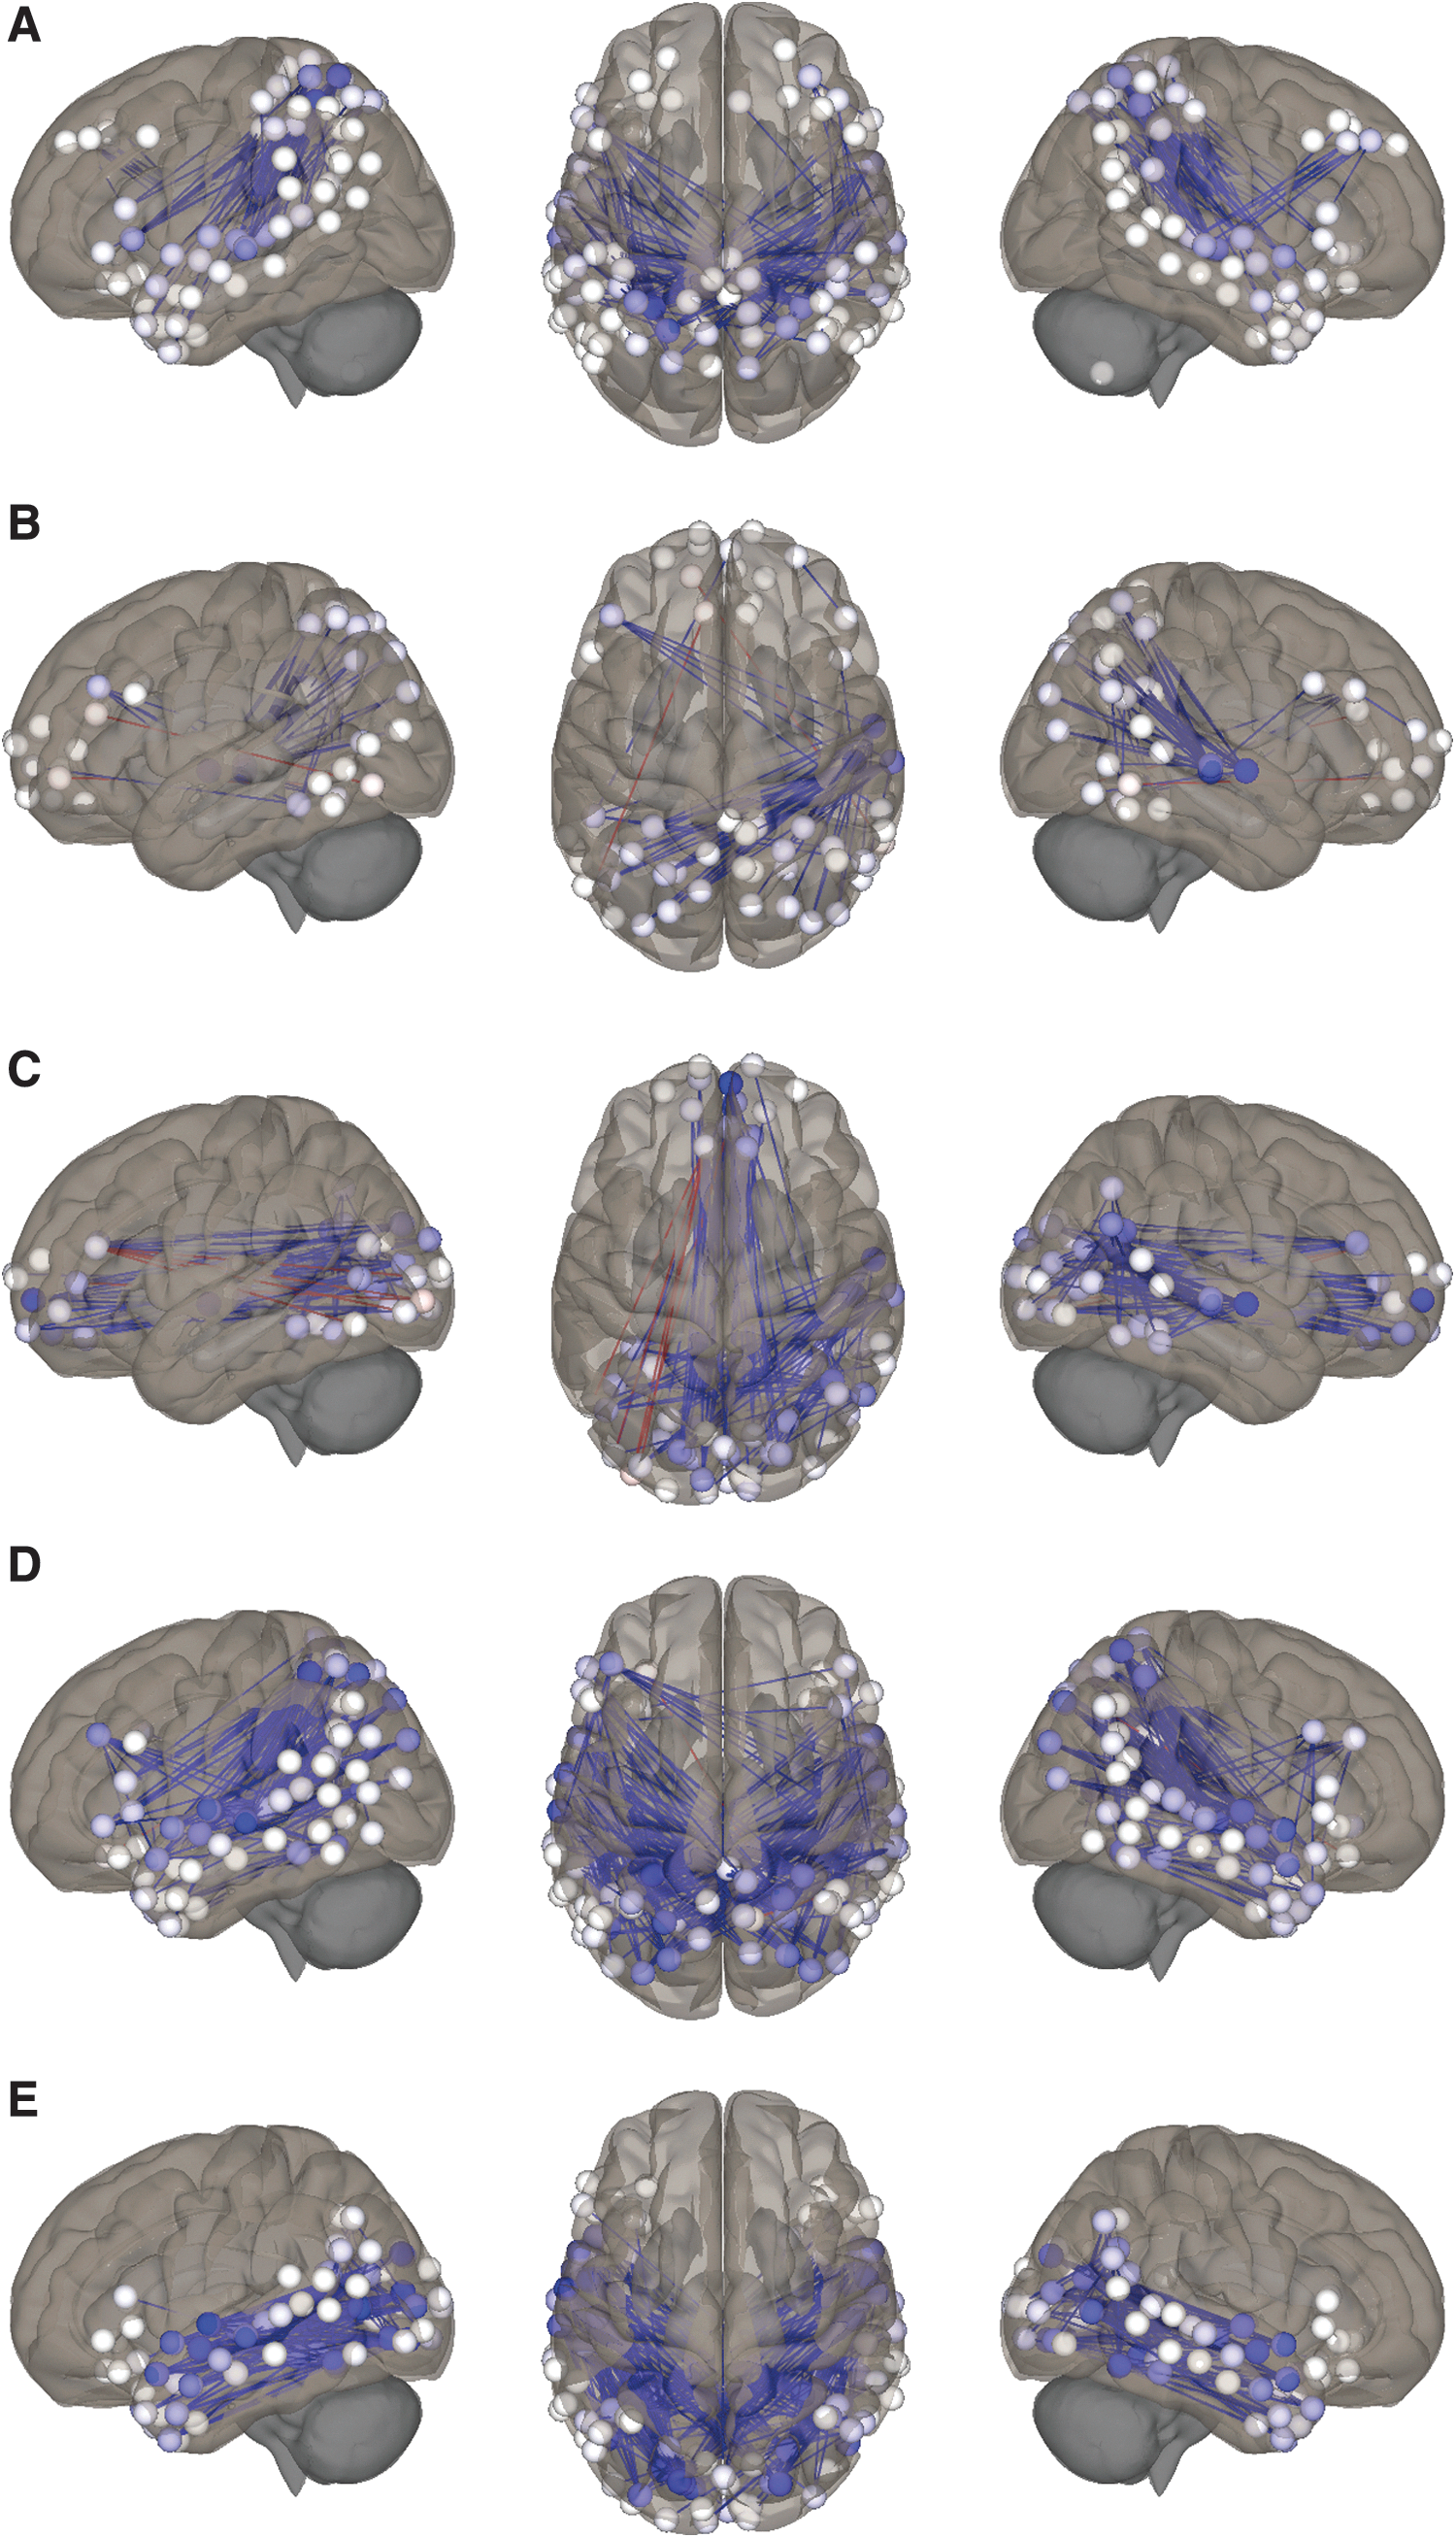
Post hoc analyses investigating ROI-level changes in FC in animated format relative to illustration.
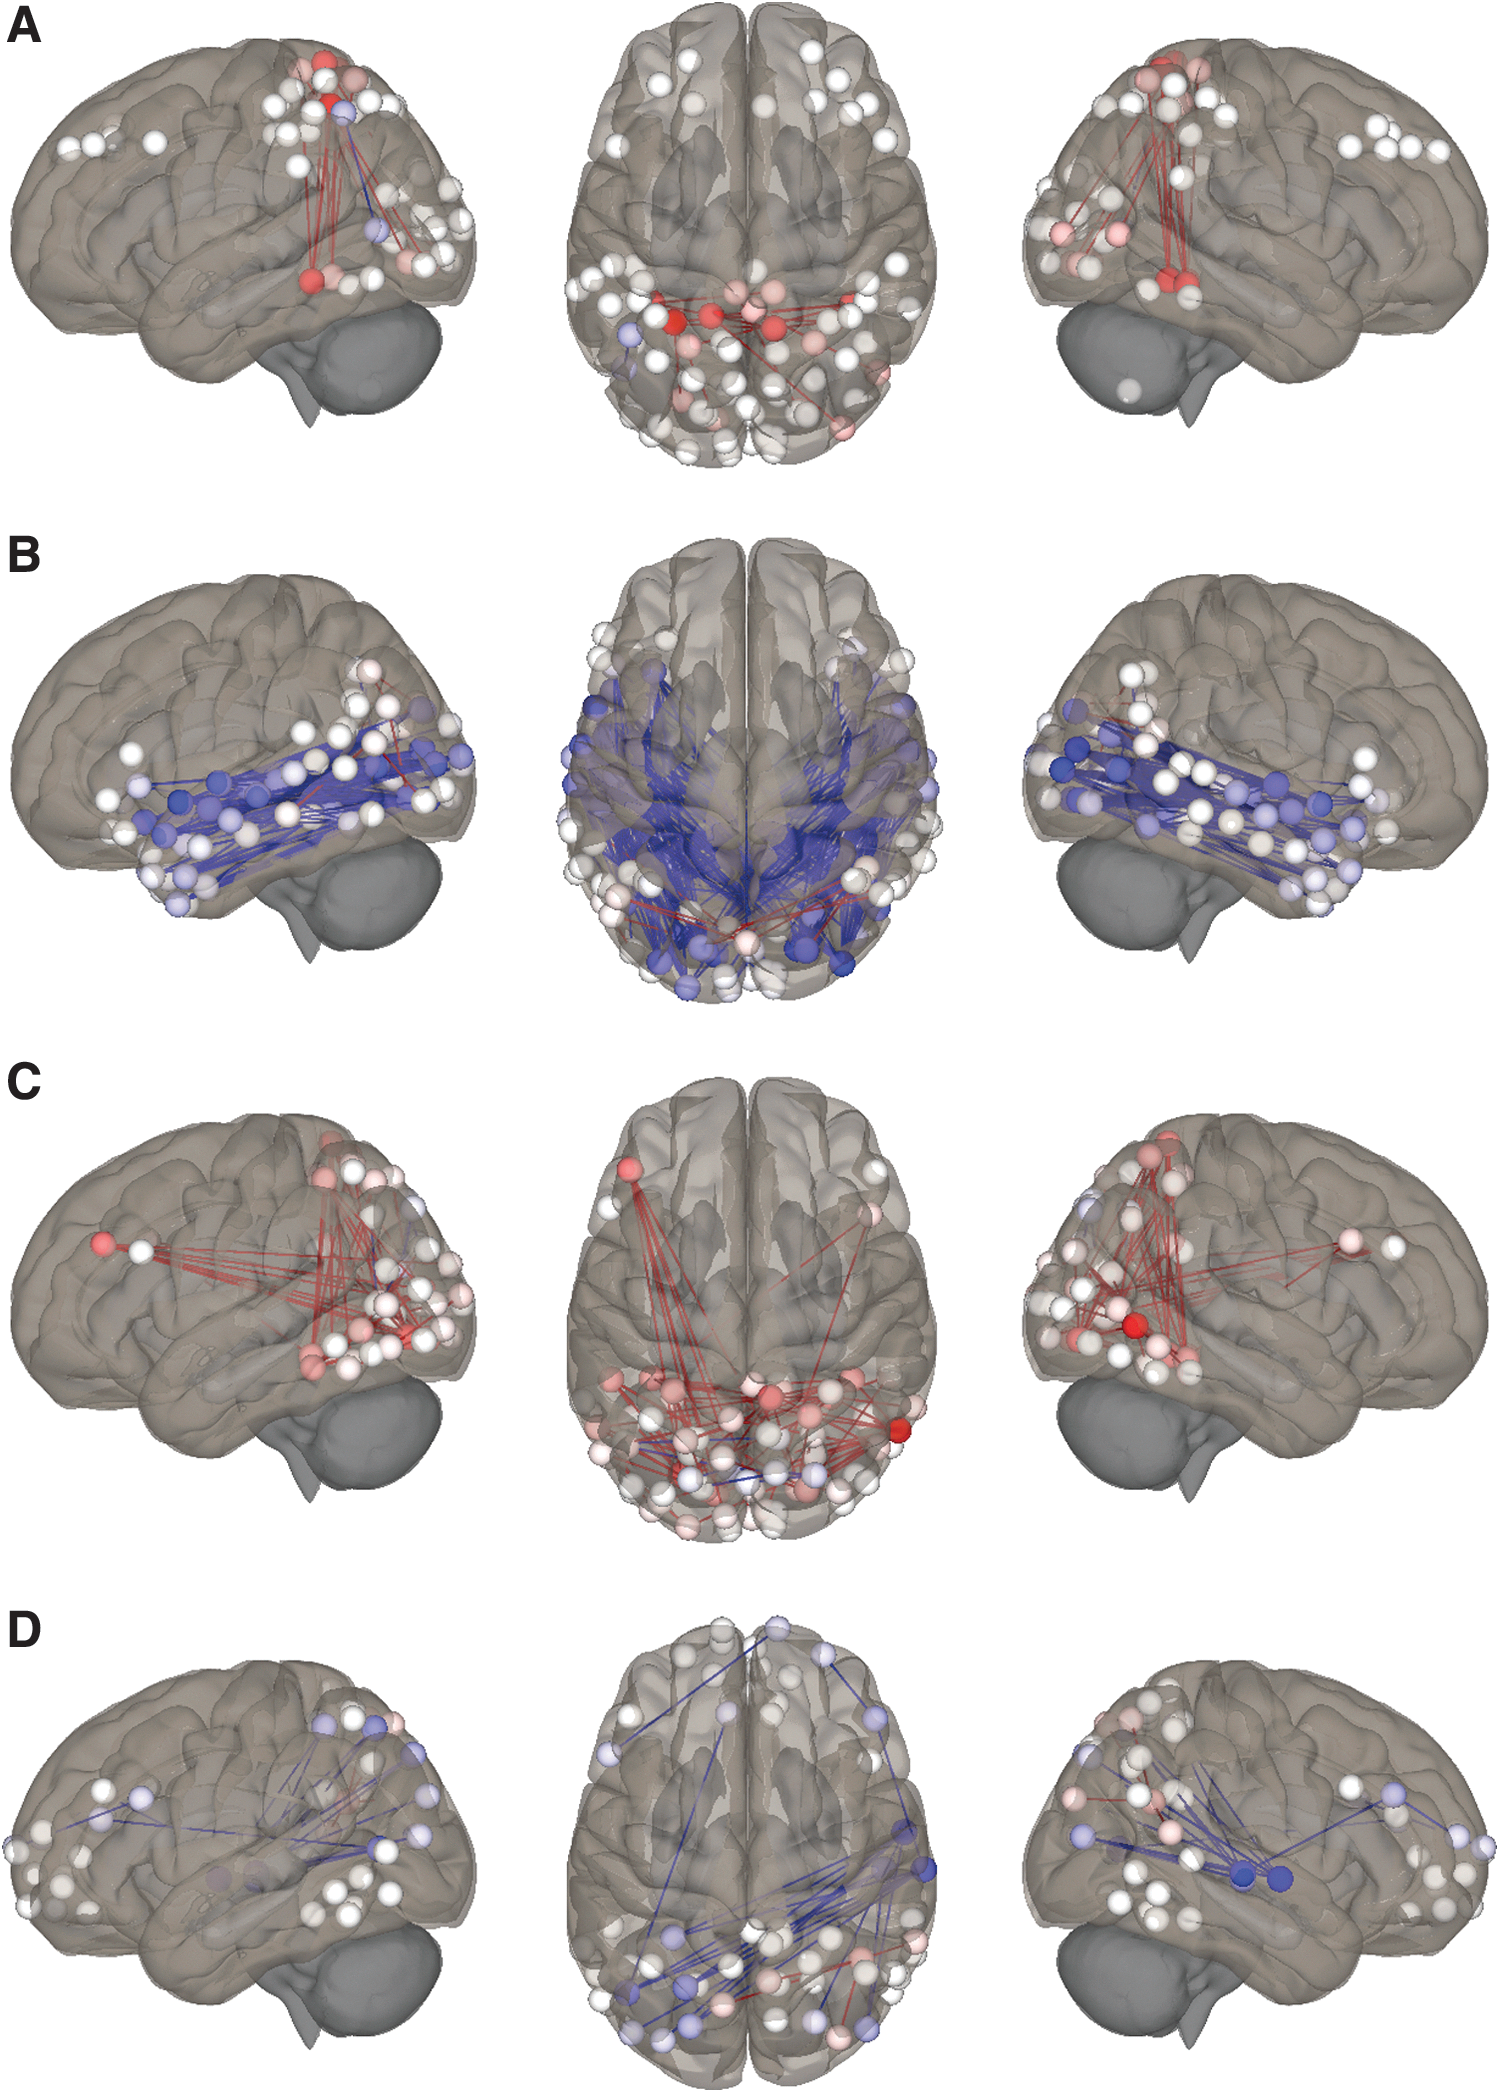
Post hoc analyses investigating ROI-level changes in FC in animated format relative to audio.
Summary of Significant Functional Connectivity Changes for Each Story Format Contrast
Significant changes in FC within and between networks for each story format contrast surviving false discovery rate correction (p < 0.05), detailed by post hoc tests. Bold values reflect % decreased FC, and those in italics reflect % increased FC. Columns show involved networks, average change in FC, the percentage of possible connections significantly altered, percentage of positive and negative changes, and percentage involving left, right, and cross-hemispheric connections.
FC, functional connectivity.
Illustration relative to audio
For illustration relative to audio, there were no significant differences in FC involving DAN or VAN, although FC was marginally higher between DAN-L, DAN-VP, and VAN-VP. As shown in Figure 1, FC was significantly lower within-L (−17%) and significantly higher between VI and VP (32%). Table 2 and Figure 2 summarize the results of the post hoc analyses testing individual ROI–ROI connections underlying these network-level changes between illustration and audio states.
Animation relative to illustration
As shown in Figure 1, for animation relative to illustration, FC was significantly lower between DAN-L (−49%), VAN-VI (−47%), VAN-VP (−105%, positive to negative), VI-L (−63%), and VP-L (−110%, positive to negative). Table 2 and Figure 3 summarize the results of the post hoc analyses testing individual ROI-ROI connections underlying these network-level changes between animation and illustration states.
Animation relative to audio
As shown in Figure 1, for animation relative to audio, FC was significantly higher between DAN-VP (51%) and VI-VP (29%) and lower between VAN-VI (−48%) and L-VP (−113%, positive to negative). Table 2 and Figure 4 summarize the results of the post hoc analyses testing individual ROI–ROI connections underlying the network-level changes between animation and audio states.
Discussion
“Shared reading” is an interactive reading experience that occurs when children join in or share the reading of a book, guided and supported by a grown-up caregiver (adapted from
The major role of the DAN is the maintenance of “top-down” focus on, or biasing of sensory processing toward, task-relevant stimuli (Petersen and Posner, 2012; Vossel et al., 2014). Greater DAN engagement is associated with enhanced cognitive performance, including visual processing (Parks and Madden 2013) and language comprehension (Kristensen et al., 2013; Wang and Holland, 2014; Yue et al., 2013). Consistent with our hypothesis, FC between the DAN and VP network was increased for animation relative to audio, reasonably attributable to focus on continuous, highly-stimulating visual content (Fig. 4). By contrast, FC between DAN-VP was only marginally increased for illustration relative to audio, likely reflecting lower perceptual demands for static pictures. As DAN capacity is finite, maximal FC between DAN-VP during animation may reflect less focus available for nonvisual aspects of the story. This is consistent with the “load theory of selective attention and cognitive control” (Lavie et al., 2004), where high perceptual load strains processing capacity and reduces potential to redirect to competing stimuli. This similarly aligns with our finding of sharply lower FC between DAN-L in animated format relative to illustration (−49%; Fig. 3), fueled by decreases involving superior temporal regions, core components of the classical Wernicke–Geschwind language network (Vannest et al., 2009).
Paradoxically, FC was higher between DAN-L for illustration relative to audio, a potential driver for our finding of lower FC within the language network for this contrast (−17%; Fig. 2). Diffused bilateral activation in language (especially frontal) areas during audio story listening is well-described in children, interpreted as reflecting difficulty or strain (Holland et al., 2007). Increased FC between attention and language networks has been associated with increased comprehension in children (Kristensen et al., 2013; Wang and Holland, 2014). As the within-L decrease for illustration relative to audio involved fewer cross-hemispheric connections, particularly from right frontal areas (Fig. 2), we interpret this finding as reduced workload afforded by pictures and imagery, in turn reflected by higher FC between VP and VI (32%; Fig. 2; Whittingstall et al., 2014). In educational literature, this is referred to as “scaffolding,” where age-appropriate support incrementally assists a child with task mastery (Crain-Thoreson and Dale, 1999; McDonough et al., 2011; Wood et al., 1976). Interestingly, despite ample visual content, in addition to marginally lower FC between DAN-L, there was no significant reduction in FC within the language network for animation relative to audio. As greater engagement of the DAN is associated with higher task performance (Rohr et al., 2017; Wen et al., 2012), altogether these findings suggest that illustrated format may be optimal to encourage efficient network integration and processing relative to the other formats at this age. It is intriguing that higher DAN engagement during illustration was divided between visual and language networks, possibly attributable to story processing requiring integration of visual, language, and other inputs (Chun et al., 2011).
The VAN is a gatekeeper for the reorienting of attention to unexpected, yet task-relevant multimodal stimuli (Corbetta et al., 2008). Our finding of marginally higher FC between VAN-VP for illustration relative to audio may reflect reorienting to pictures during the narrative, while reorientation to visual imagery (VAN-VI) was equivalent between these formats. By contrast, sharply lower FC between VAN-VI (−47%) and VAN-VP (−105%) for animated format relative to illustration (Fig. 3), and between VAN-VI (−48%; Fig. 4) relative to audio, may reflect less capacity to reorient away from fast-moving visual content during animation due to its highly stimulating nature (Lavie et al., 2004). Decreased recruitment of and reorientation toward imagery is also suggested by sharply lower FC between VI and L in the animated state relative to illustration concentrated in superior and anterior temporal language areas (−63%; Fig. 3) and marginally lower relative to audio. These findings are consistent with our hypothesis and the “gatekeeper” role of the VAN (Vossel et al., 2014), as pictures and imagery are critical components of illustrated storybooks (imagery for audio) that must be dynamically integrated with language to support comprehension, compared to animated content largely requiring perception. Mechanistically, it is reasonable to speculate that during an illustrated story the child may be primarily focused on the narrative (DAN-L), yet able to efficiently reorient to moderately-stimulating illustrations and imagery through the VAN, thereby providing visual scaffolding for the language network. During audio format the child may be similarly able to dynamically reorient to imagery (VAN-VI), yet imagery alone may provide suboptimal support for the language network at this age, attributable to limited lexical knowledge and/or efficiency of retrieval (Holland et al., 2007; Xiao et al., 2015).
The DAN and VAN do not act in isolation, but dynamically interact to maintain focus yet efficiently reorient to task-relevant stimuli (Vossel et al., 2014). That FC within and between the DAN and VAN was similar between formats is consistent with the “agnostic” nature of these networks, responsive to various content, including audio-visual, memories, and feelings (Petersen and Posner, 2012; Vossel et al., 2014). Why FC involving the VAN was broadly lower during animation relative to the other story formats is a critical question, given the prevalence of animated content marketed to children. Rapidly-moving visual stimuli requiring intense focus, exemplified by such content, have been found to overload working memory and suppress the VAN (Vossel et al., 2014), consistent with the load theory of selective attention and cognitive control (Lavie et al., 2004). Preschool-age children are particularly vulnerable to cognitive overload, given that working memory and other executive functions are not yet mature (Knudsen, 2004; Rohr et al., 2018). It is possible that the level of visual processing required by the animated story in this study may have strained working memory capacity in its preschool-age subjects, suppressing VAN engagement and biasing the DAN toward VP. By contrast, especially during the illustrated story, reorientation (using VAN) and allocation of focus (using DAN) appeared more balanced. This finding is consistent with the appeal of illustrated storybooks at this age (Gambrell and Jawitz, 1993), encouraging the child to flexibly allocate attention to pictures, imagery, and other aspects of story sharing, thereby providing scaffolding for language. While speculative, applying the maxim, “neurons that fire together, wire together” (Hebb, 1949), such integrative, child-centered practice may reinforce connections applicable to increasingly complex literacy tasks (e.g., books without pictures), while at least some types of animation may not afford such opportunities or reinforce less favorable connections (AAP Council on Communications and Media, 2016; Christakis et al., 2009; Lillard et al., 2015).
Our study has limitations. Our sample involved Caucasian, largely higher-socioeconomic status children, although brain network dynamics seem unlikely to be influenced by race, and income and education did not significantly influence our results. The stories used were by the same author with a particular style, and our findings may not apply to other styles. Similarly, those of our animated story may not generalize to other animated content. We view these as worthwhile trade-offs, providing consistency for important narrative variables (e.g., pace, style, and reading level) across formats. The stories used were different, presented in the same order for each child. However, this design eliminated the confound of repeat exposure to the same story, while gradually increasing visual content minimized visual priming effects and concerns about the potential of animated content to negatively affect performance on subsequent tasks at this age (Lillard and Peterson, 2011; Lillard et al., 2015). Our comprehension assessment was brief and involved basic factual content, although this level of recall is appropriate for preschool-age children. While equivalent between audio and illustration, comprehension scores were lower for animation, a potential confound not applied in our analyses to preserve statistical power, although this difference aligns with negative comprehension effects described for this age (Chiong et al., 2012; Ross et al., 2016) and our hypotheses. Shared reading during MRI is not feasible. However, audio and animation were presented akin to the real world (headphones and screen), and we suspect that even more favorable differences between illustrated and other formats would manifest on a parent's lap. Our analyses were limited to five functional networks, although these were determined using a hypothesis-driven approach that increased statistical power. Our networks were defined in terms of functionally heterogeneous BA, yet refined through an established parcellation approach (Craddock et al., 2012). With the exception of DAN, these networks did not involve subcortical or cerebellar structures, which also play important roles in language and other cognitive functions (Choi et al., 2012; Guell et al., 2018; Hwang et al., 2017; Schmahmann et al., 2019), warranting inclusion in future and more comprehensive research.
Our study also has important strengths. Our fMRI paradigm involved continuous story presentation akin to the real world, resulting in a high success rate in very young children. Our analyses involved an innovative, connectivity-based approach affording comparisons of functional networks in aggregate and at the ROI level, which aligns with the current shift away from modular views of brain function toward network-level analyses (Sporns, 2013). Our hypothesis was in the context of cited benefits of shared reading (National Early Literacy Panel, 2008) and concerns about animated content (AAP Council on Communications and Media, 2016; Chiong et al., 2012; Lillard et al., 2015; Ma and Birken, 2017; Parish-Morris et al., 2013). While preliminary, our findings provide mechanistic insights into these issues and AAP recommendations (AAP Council on Communications and Media, 2016; AAP Council on Early Childhood, 2014) and raise questions for further research in terms of readiness of functional brain networks. Importantly, they also build on related work underscoring the longtime appeal of illustrated stories for young children to provide a “just right” level of scaffolding for language, imagination, and learning, during a dynamic span of brain development (Hutton et al., 2018). Longitudinal studies involving comprehensive behavioral measures are needed to explore whether short-term effects observed in these studies result in sustained differences in attention and other networks and emergent literacy skills that they support. These are critical questions given the rapid rise of technologies transforming how stories are shared with young children.
Conclusions
This study revealed substantial differences in connectivity of attention, visual, and language brain networks in preschool-age children during stories presented in audio, illustrated, and animated format. Illustration was associated with connectivity patterns suggesting balanced application and reorienting of focus, integration of imagery, and support for the language network. While attentional dynamics was similar between audio and illustration, connectivity patterns during audio suggested suboptimal support for the language network, likely through limited capacity for imagery. Possibly by taxing working memory, animation was associated with sharply decreased connectivity supporting reorienting of attention and integration of visual and language networks, and focus biased toward VP. As brain networks underlying higher-order skills are dependent on practice during early childhood, these findings suggest that illustrated format may be optimal to promote balanced network dynamics at this age, particularly relative to animation. While preliminary, they provide novel neurobiological context for AAP reading and screen time recommendations and raise questions for further research.
Footnotes
Acknowledgments
The authors thank Christy Banks for coordinating recruitment and administration of our functional magnetic resonance imaging protocol. The authors thank Robert Munsch for his writing and storytelling and permission to use audio and video versions used in this research. The authors finally thank the Thrasher Research Fund for their support of early-career investigators and this work. This study was funded by a grant from the Thrasher Research Fund (Hutton) with additional support through a Ruth L. Kirschstein National Research Service Award (Hutton).
Author Disclosure Statement
No competing financial interests exist.
Supplementary Material
Supplementary Table S1
References
Supplementary Material
Please find the following supplemental material available below.
For Open Access articles published under a Creative Commons License, all supplemental material carries the same license as the article it is associated with.
For non-Open Access articles published, all supplemental material carries a non-exclusive license, and permission requests for re-use of supplemental material or any part of supplemental material shall be sent directly to the copyright owner as specified in the copyright notice associated with the article.