
Abstract
Latest developments in magnetic resonance imaging (MRI) hardware and software have significantly improved image acquisition for functional MRI (fMRI) techniques, including resting-state fMRI (rsfMRI). Specifically, with improvements in gradient and radiofrequency coils and advances in pulse sequence designs, functional images with higher spatiotemporal resolution can be achieved. However, while smaller voxel size has the benefit of resolving finer brain structures, it also decreases voxel-wise signal-to-noise ratio (SNR) and, subsequently, temporal SNR (tSNR), which is critical for the sensitivity of fMRI. Although the improved temporal resolution allows more image frames to be collected per unit time, the ability to detect brain activity by using the high spatiotemporal fMRI has not been fully characterized. Here, we aimed to evaluate the effects of spatial smoothing, scan length, sample size, seed size, and location on resting-state functional connectivity (rsFC) and tSNR by using data from the human connectome project. Results from this analysis show an important effect of smoothing on the rsFC strength (correlation values between the seed and the target) as well as on the tSNR. In contrast, while rsFC strength is not affected by sample size, the standard error decreases with the increasing number of participants, therefore improving the detection power for larger samples. Scan length and seed size seem to have a moderate effect on rsFC strength. Finally, seed location has an important impact on rsFC maps, as rsFC strength from cortical seeds seems higher than from sub-cortical seeds. In summary, our findings show that the choice of parameters can be critical for an rsfMRI study.
Introduction
Most recent cutting-edge developments in magnetic resonance imaging (MRI), in both hardware and software, have provided a significant advance in data acquisition. More specifically, gradient coils that can reach up to 100 mT/m improve spatial resolution, 32-channel head receiver coils improve signal-to-noise ratio (SNR), and echo-planar imaging (EPI) sequences with the capability of simultaneous slice acquisition (Feinberg et al., 2010; Moeller et al., 2010; Nunes et al., 2006) increase temporal resolution by using shorter repetition time (TR). A variety of MR techniques, including resting-state functional MRI (rsfMRI), benefit substantially from these technical advances. The improved temporal resolution (e.g., sub-seconds per image volume) provides one the opportunity to collect more images per unit time, and to reduce the contribution of physiological noise. The improved spatial resolution allows one to resolve finer structures in the brain, and to reduce the signal dropout from those brain areas that are strongly affected by susceptibility artifacts (Bellgowan et al., 2006). Particularly, high spatial resolution in rsfMRI may allow more accurate information on resting-state functional connectivity (rsFC) related to small-scale brain structures.
However, while a reduction of image voxel may have the benefit of resolving finer brain structures, it also reduces the SNR and, consequently, the temporal SNR (tSNR). A multi-channel MRI receiver helps mitigate the SNR loss (Bellgowan et al., 2006), but the impact of the significant loss of voxel-wise SNR due to the reduced voxel size on the sensitivity of the rsfMRI has not been fully characterized. High spatiotemporal resolution functional data, collected by the human connectome project (HCP), utilized four long rsfMRI runs, 14.4 min each, and a large sample size, 1200 participants, to compensate for the SNR loss induced by the high-resolution data (Uğurbil et al., 2013). Excellent results have been obtained with sub-sets of this dataset, as for example, using 40 participants and close to 30 min of rsfMRI data, when evaluating mostly cortical areas (Tomasi et al., 2016), or using 100 participants and near to 60 min of rsfMRI data, when subcortical areas were relevant (Caparelli et al., 2017). Consequently, there has been a growing interest in implementing this higher spatiotemporal resolution protocol for data acquisition at numerous research sites. However, typical fMRI studies collect far less data than the HCP (e.g., only one rsfMRI run, 5–15 min, on 20–40 participants). Thus, it is not clear whether data collected using these parameters will have sufficient power in detecting brain activity, mainly on subcortical areas where the SNR is low.
To address the specific question regarding the detection power of blood oxygen-level dependent (BOLD) signal in rsFC when using high-resolution data in a typical sample size (20–40 participants) and short rsfMRI runs (5–15 min), we examined the effects of different levels of spatial smoothing, scan duration, sample size, seed size, and location on rsFC and tSNR, using rsfMRI data from the HCP. FC maps were calculated for each analysis parameter considering cortical and sub-cortical seeds. A whole-brain connectivity analysis as well as a region-of-interest (ROI)-based analysis were performed and compared. Our main findings show a significant increase in rsFC strength and tSNR with increasing smoothing, whereas scan duration and seed size had a less prominent effect. The sample size, on the other hand, has a strong effect on the variance but not the rsFC strength, where an increased number of participants decreases the standard error (SE) and, therefore, improves the significance of results. In addition, seed location has a significant impact on rsFC. Finally, based on our current findings, a set of study parameters is suggested to achieve detection power of BOLD signal in rsfMRI studies.
Methods
Subjects
A dataset of 100 adult healthy volunteers (46 males and 54 females; age range 22 to 36 years; mean age 29.4 ± 3.6 years) was used in this analysis. This dataset was obtained through the Open Access Agreement and was randomly selected through the 100-unrelated option from the WU-Minn Consortium HCP (WU-Minn HCP 500 Subjects + MEG2 Data Release). The HCP has an online database that is publicly available and a detailed description of their standard operating procedures is available at the WU-Minn HCP 500 Subjects + MEG2 Data Release: Reference Manual Appendix IV. The Office of Human Subjects Research Protection (OHSRP) at the NIH approved the use of the HCP dataset.
Data acquisition
A 3 Tesla Skyra Siemens system with a 32-channel head coil, a customized SC72 gradient insert (100 mT/m), and a customized body transmit coil was used to acquire the MRI dataset. rsfMRI data were acquired by using a multi-band (MB) gradient-echo EPI sequence (Moeller et al., 2010; Uğurbil et al., 2013) (TE/TR 33.1/720 msec, image resolution 2 mm isotropic, 72 oblique-axial slices, 1200 images/rsfMRI run, MB acceleration factor = 8, BW = 2290 Hz/Pix). Four rsfMRI runs were acquired on two different days (two runs per day alternating phase encoding direction, right-to-left [RL] and left-to-right [LR], between runs); just one run, the RL, was used in the current analysis. A T1-weighted magnetization-prepared rapid gradient echo (3D-MPRAGE) sequence was used to acquire the anatomical images with a 0.7-mm isotropic resolution. Both imaging sequences, anatomical and functional, covered the entire brain.
Data analysis
Preprocessing
Initial preprocessing was applied to the dataset by the HCP consortium. Anatomical images were distortion corrected, co-registered and averaged across runs, anterior commissure-posterior commissure registered, brain extracted, B1 bias field corrected, and normalized to Montreal Neurological Institute (MNI) space. rsfMRI underwent gradient distortion correction, motion correction, registration to the T1-weighted image, spatial normalization to the MNI standard space, 4D global mean-based intensity normalization, B1 bias field correction, independent component analysis-based artifact removal, and whole brain masked (Glasser et al., 2013).
Local data processing was performed by using AFNI (Cox, 1996) and MATLAB (The MathWorks, Inc., Natick, MA). Preprocessed rsfMRI runs had the first four EPI volumes removed to ensure signal equilibrium, followed by band-pass filtering (0.01–0.10 Hz) to minimize instrument-induced drifts (Foerster et al., 2005) and physiological noise (Cordes et al., 2001). Multi-linear regression with the six time-varying realignment parameters was performed to minimize motion-related fluctuations in the MRI signals. The first three principal components (using principal component analysis) of white matter (WM) and cerebrospinal fluid (CSF) signals were also regressed out to help remove non-neuronal-induced signal fluctuations (Chai et al., 2012; Lund et al., 2006). The WM and CSF masks were generated by segmenting the preprocessed high-resolution anatomical images using SPM8 (Ashburner and Friston, 2005) and down-gridding the obtained masks to the same resolution as the preprocessed functional data. Individual subject rsfMRI time series were smoothed (full width at half maximum [FWHM] = 2, 3, or 4 mm) to improve SNR (Smith, 2003), and they were censored for time points that exceed a frame-wise displacement threshold >0.5 mm and the root mean square variance across voxels (DVARS) >0.5% (Power et al., 2012). Time series with an excessive number of time points censored (more than 30%) were discarded.
For each participant, two sub-runs were generated from the original 14.4 min scan, one with 5-min duration (the first 418 images) and another with 10-min duration (the first 835 images). Due to excessive censoring, two subjects contributed data only for the 5-min run category, resulting in 98 participants for the 14.4 and 10-min runs and 100 for the 5-min run. The acceptable runs had an average of 8 ± 19 (mean ± standard deviation [SD]) time points discarded per subject for the 5-min run, 13 ± 29 time points discarded for the 10-min run, and 23 ± 46 time points discarded for the 14.4-min run.
FC maps
Seed-based, voxel-wise correlation was used to calculate the FC maps, using the following seeds: (1) the left centromedial (CML) (55 voxels [440 mm3]) subdivision of the amygdala (Caparelli et al., 2017); (2) the left and right amygdala (AMYL and AMYR), respectively (left: 201 voxels [1608 mm3] and right: 189 voxels [1512 mm3]); and (3) three spheres in the posterior cingulate cortex (PCC—MNI coordinates: 0, −45, 31), with radii of 3 mm (19 voxels [152 mm3]), 5 mm (81 voxels [648 mm3]), and 7.3 mm (203 voxels [1624 mm3]), respectively. Partial correlation was used to regress out the potential signal contribution from the other two subdivisions of the amygdala, laterobasal, and superficial (Caparelli et al., 2017), when using the CML seed; for all other seeds, full correlation was applied. Correlations were calculated for all voxels within a gray-matter mask. The correlation coefficients were then converted to z-score by using the Fisher's r-to-z transformation. For each seed, FC maps were calculated for the different spatial smoothing levels (FWHM = 2, 3, or 4 mm) and scan durations (5, 10, or 14.4 min), except for two PCC seeds (spheres of 3 and 7.3-mm radii), where only the smoothing level of 4-mm FWHM and scan length of 14.4-min were used.
One-sample t-tests were performed independently on the FC maps generated for each seed and analysis condition (smoothing, scan duration, seed size). Analysis of variance (ANOVA) by using a linear mixed-effects modeling approach (3dLME) (Chen et al., 2013) and pairwise t-tests as a post hoc analysis were carried to evaluate the effect of seed size (one-way ANOVA), considering the three ROI sizes for the PCC and to evaluate the effect of spatial smoothing and scan length (two-way ANOVA) for the PCC (5 mm radius) and amygdala seeds. Results for the voxel-wise analyses were corrected for multiple comparisons by using 3dClustSim, based on Monte Carlo simulations (Ward, 2000), using the new approach for estimating a non-Gaussian spatial autocorrelation function (ACF) (Cox et al., 2017); statistical significance was set for pun corrected < 0.001 and p corrected < 0.05.
Temporal SNR
Images used for the tSNR calculation had the preprocessing applied by the HCP consortium; then, they were censored to remove images with excessive motion and smoothed with the different spatial smoothing levels (FWHM = 2, 3, or 4 mm). Sub-runs of 5 and 10 min were also generated on these data from the 14.4-min run for each participant. tSNR values were then calculated for each participant and for the different analysis conditions (spatial smoothing, scan length), and one-sample t-tests were performed independently for each analysis condition. A two-way ANOVA was also performed to evaluate the effect of spatial smoothing and scan length on the tSNR. Further, the rate of tSNR change, due to either spatial smoothing or scan duration, was evaluated by displaying the slope of change for each voxel.
ROI analysis
An ROI analysis was carried out to evaluate, more quantitatively, changes in functional connectivity and tSNR values, between the PCC and medial prefrontal cortex (MPFC) and between the amygdala and insula, caused by the different spatial soothing, scan lengths, sample sizes, and seed sizes. The average FC strength was extracted from the FC maps generated by using the three different PCC-seed sizes (sphere: 3, 5, or 7.3-mm radius) at an ROI located at the MPFC (MNI: −6, 54, 0). It was also extracted at the right insula (INR; MNI: 37, −6, 14) from the FC maps generated by using the AMYR as a seed, and at the left insula (INL; MNI: −37, −6, 14) from the FC maps generated by using the AMYL as a seed. All target ROIs (in the MPFC and insula) were 5-mm radius spheres. tSNR values were extracted at the targets (MPFC and insula [R, L]) and at the amygdala and PCC seeds (all 5-mm radius) as well.
Sub-sample generation
Sub-samples of N (20, 40, and 60) subjects were generated, with replacement, either for the subject's FC strength, averaged in the ROI, or for the subject's tSNR ROI values, from the original sample of ALL (98 [14.4 and 10-min runs] or 100 [5 min run]) participants, through 100 permutations for each sub-sample category. For example, the sub-sample of 20 subjects was randomly extracted from the original sample 100 times, resulting in 100 samples of 20 subjects. The mean FC strength (subject's FC strength, previously averaged in the ROI, now averaged across subjects), M(i), and SD(i), was calculated 100 times, (i = 1, .., 100), for each N (20, 40, 60) and each spatial smoothing value (FWHM = 2, 3, or 4 mm) and each scan length (5, 10, or 14.4 min). As a result, there are two possible approaches for the calculation of the final SE: (1) SE is taken as the average SE(i) (mean SE), where SE(i) = SD(i)/(N)1/2; and (2) SE is taken as SD/(100)1/2, where SD is the standard deviation of the 100 M(i) values (the 100 M(i) values have as a final average, M, and SD).
Power analysis
Effect sizes were calculated for each preprocessing condition (smoothing level and scan length) for each N (20, 40, 60) and for ALL (98/100) participants. Effect size was defined as a measure of distance from 0 expressed in SD units (mean FC strength/SD) and is analogous to Cohen's d. A power analysis was carried out by using GPower (Faul et al., 2009), for a one-sample t-test (difference from constant), where the sensitivity was evaluated to compute the required effect size for each sub-sample. The required effect sizes for each sub-sample were then compared with current values to evaluate whether a sub-sample in each specific condition of smoothing and scan length reaches the desired power of 0.8 (α = 0.05, two-tail).
Results
Voxel-wise analysis
Voxel-wise analysis shows the resting-state functional connectivity maps calculated for each condition of spatial smoothing, scan length, seed location, and size and correlation method (partial or full).
Spatial smoothing and scan length
Figure 1 shows the FC maps of the AMYL, as a function of scan length and spatial smoothing. It is observed that FC strength across subjects becomes less significant when scan length is shorter and/or spatial smoothing is smaller. Reduction of FC was more prominent when using partial correlation and a smaller seed, such as the CML subdivision of the amygdala (Supplementary Fig. S1-top) when compared with FC for the AMYL under the same conditions (Supplementary Fig. S1-bottom). A larger extent of FC strength for the CML is shown in Supplementary Figure S1A, when using 4 mm of smoothing and almost 60 min of rsfMRI data (four 14.4 min runs combined), as previously published (Caparelli et al. 2017). As scan duration decreases, the reduction in the FC strength is remarkable, as shown for just one rsfMRI run (14.4 min—Supplementary Fig. S1B) or even a fraction of it (5 min—Supplementary Fig. S1C), particularly when low spatial smoothing is used (5 min/2 mm (FWHM)—Supplementary Fig. S1D).
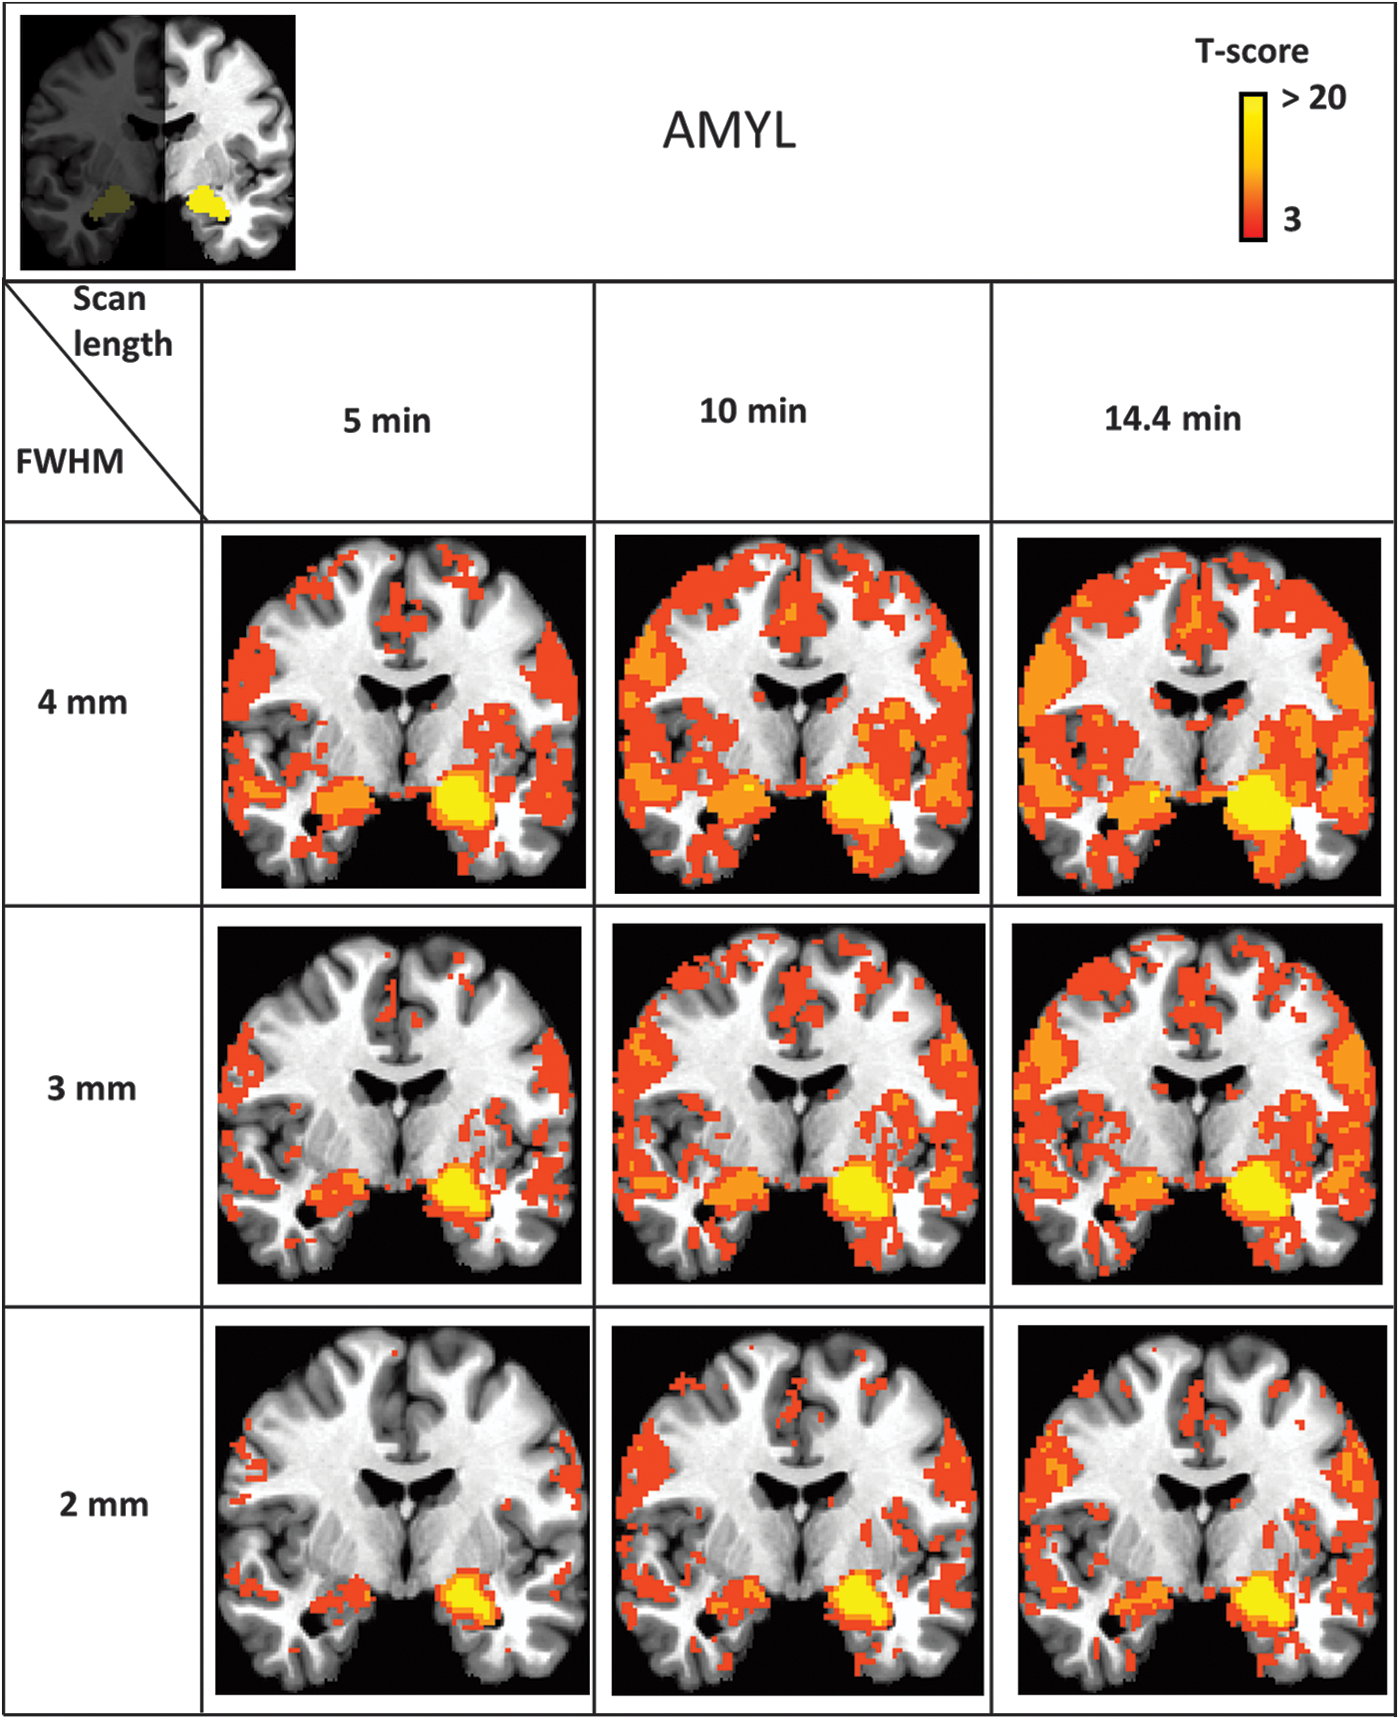
Function connectivity pattern for the AMYL seed (full correlation, one sample t-tests), for the different scan lengths (5, 10, 14.4 min) and smoothing levels (FWHM = 2, 3, 4 mm), ALL = 98 (14.4 and 10 min runs) or 100 (5-min run) participants; p uncorrected < 0.001, p corrected < 0.05; MNI standard space; radiological convention. AMYL, left amygdala; FWHM, full width at half maximum; MNI, Montreal Neurological Institute.
Similar results were observed for the other seeds, the AMYR and the PCC, as shown in Supplementary Figure S2. A stronger dependence of the FC pattern with the scan length and spatial smoothing is seen for the amygdala, compared with the PCC seed, since in the latter this dependence is less evident.
Direct comparisons for the effects of spatial smoothing and scan length on the FC maps generated by these three seeds are shown in Supplementary Figure S3. Results from a two-way (spatial smoothing by scan length) ANOVA shows a much stronger main effect of spatial smoothing than of scan length for all seeds; no interaction between these factors was observed. Post hoc analyses suggest that the main effects are mostly driven by the difference between data smoothed with 4 mm and those smoothed with 2 mm (Supplementary Fig. S3C). No such effect is obvious for the difference in scan length.
Seed size
The effect of different seed sizes on FC maps was also evaluated. The FC strength between PCC and the connected areas increases with the size of the seed (Fig. 2), resulting in a significant main effect of seed size (Supplementary Fig. S4A). For brain regions that are anticorrelated with the PCC, such as the anterior insula and inferior frontal areas, their magnitude of connection with the seed increases (stronger anticorrelation) with larger seeds (Supplementary Fig. S4B–D).
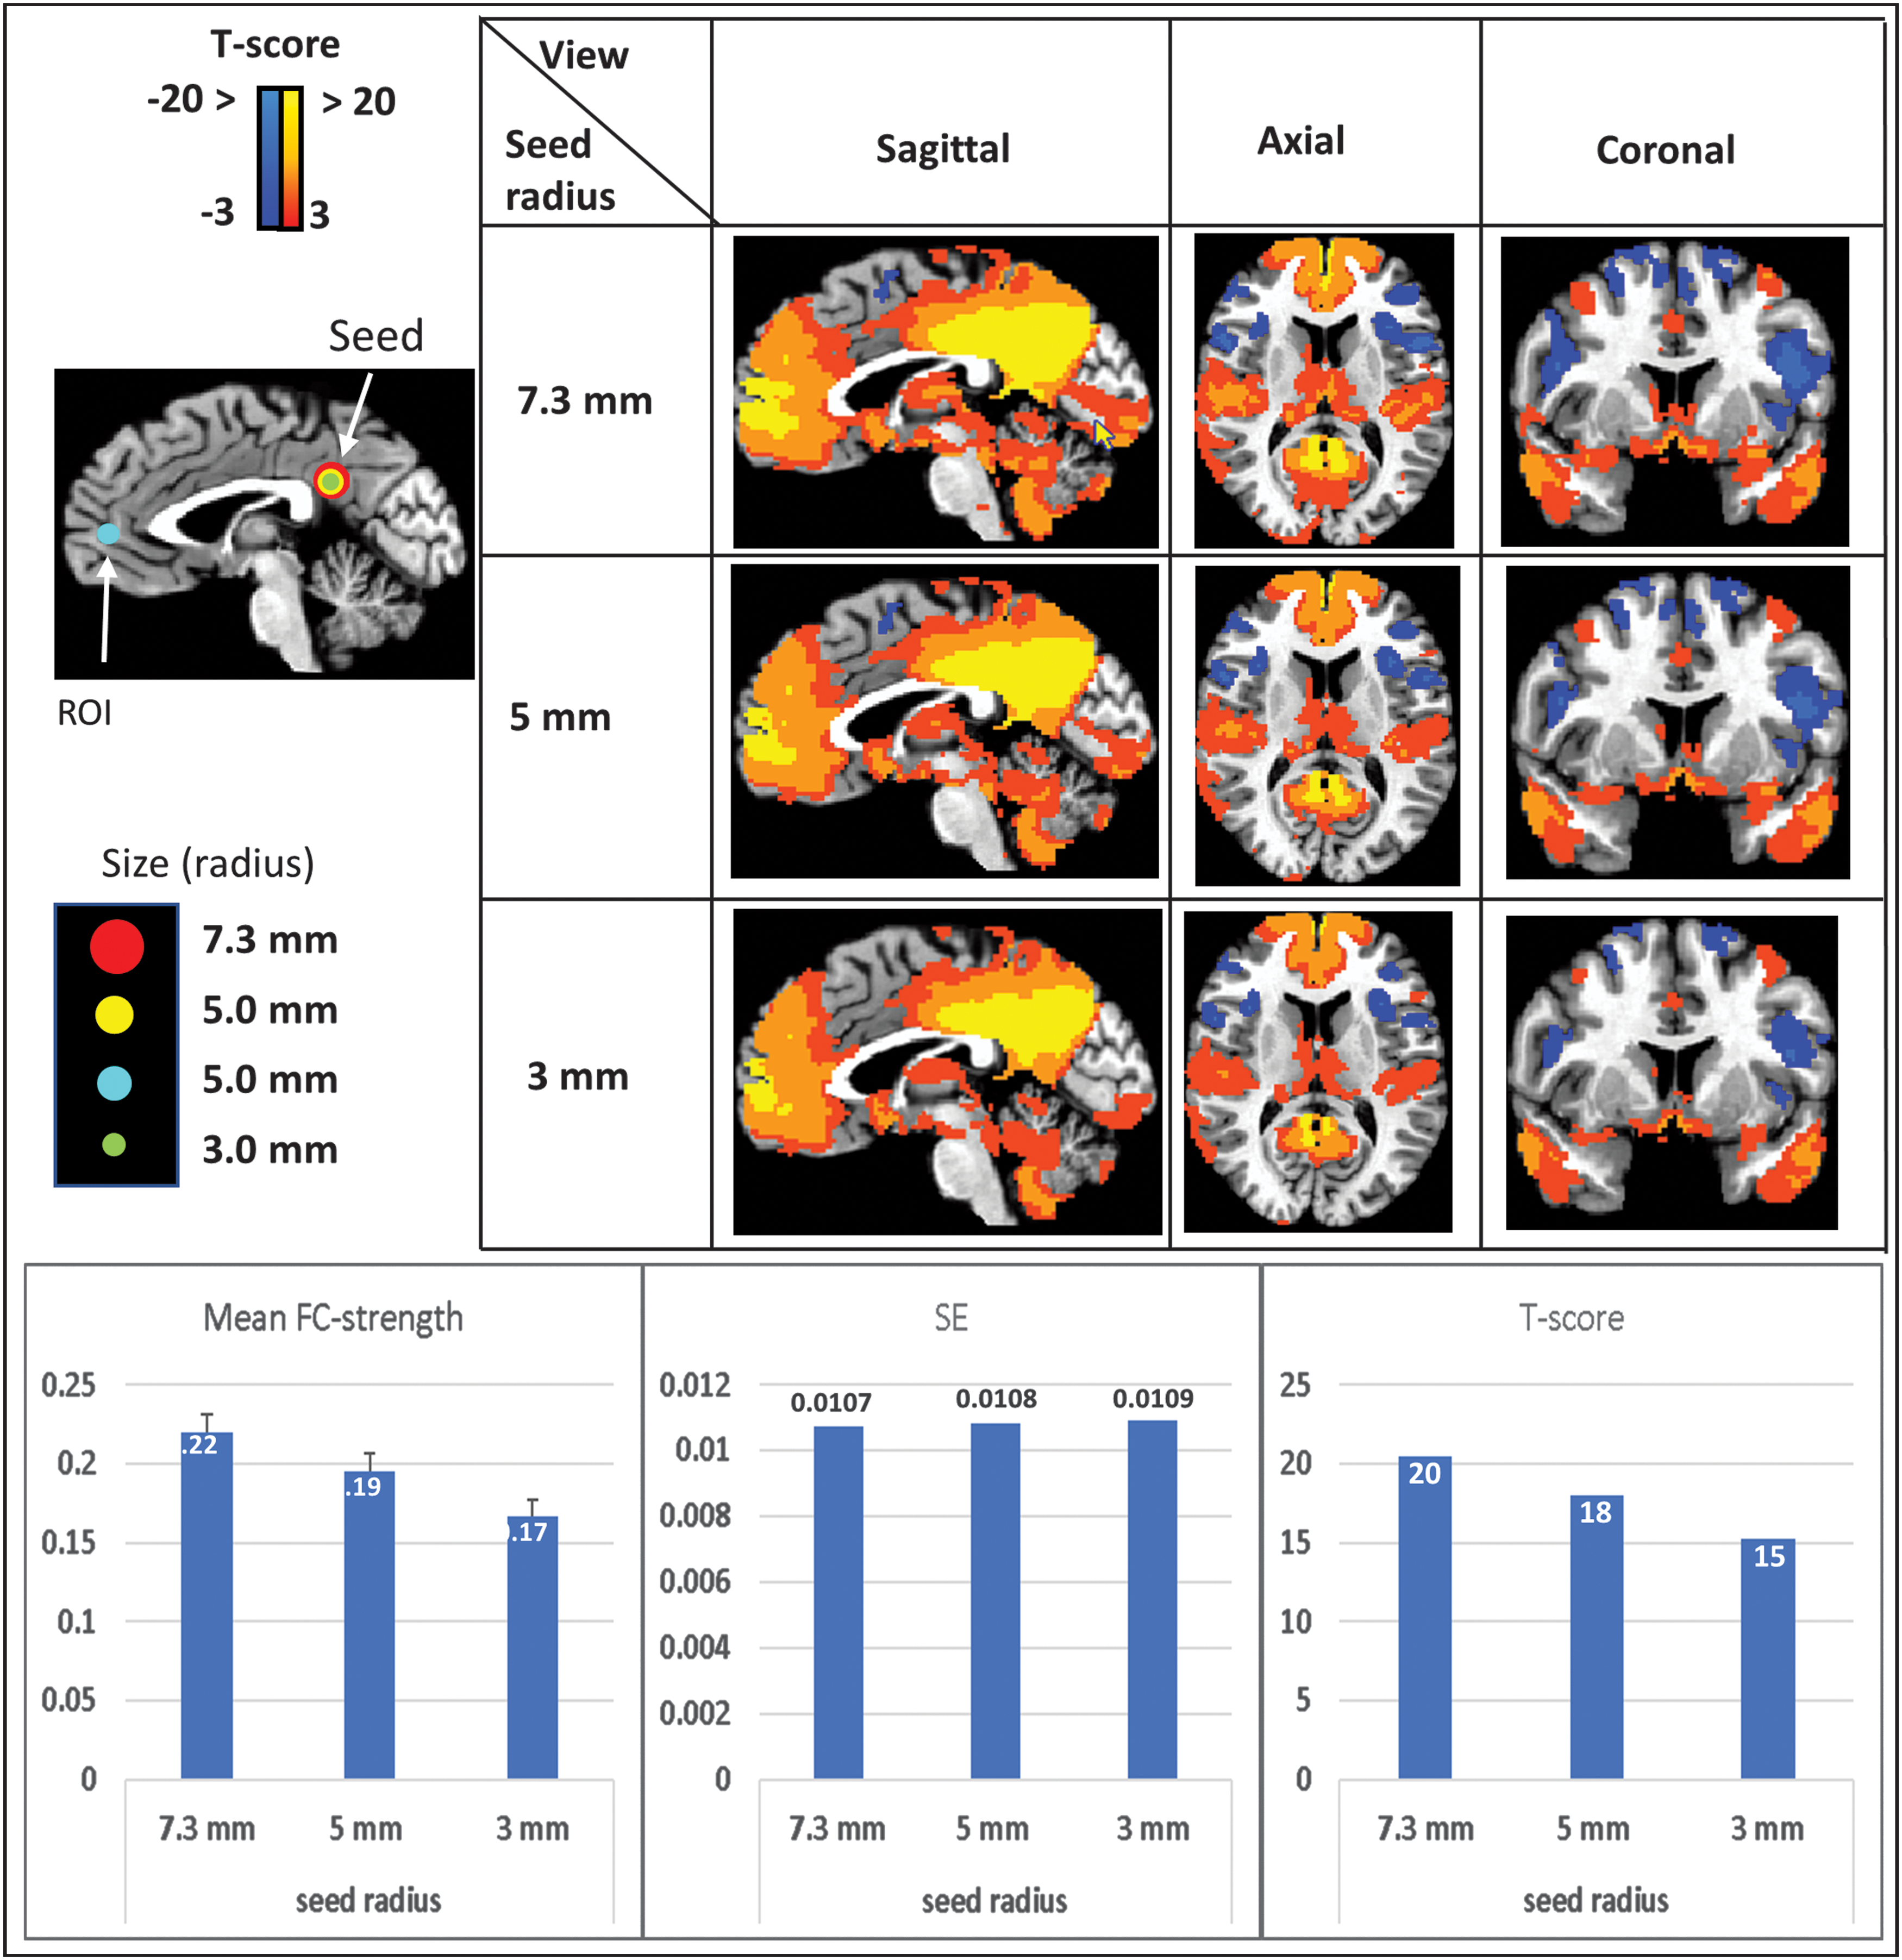
FC pattern for the PCC seed for the different seed sizes (sphere: 7.3, 5, 3 mm radius, full correlation), 98 participants, 4-mm smoothing, 14.4-min rsfMRI run, one sample t-test; p uncorrected < 0.001, p corrected < 0.05; MNI standard space; radiological convention. ROI analysis in the MPFC, t-score = mean FC-strength/SE. Error bars shows the SE. FC, functional connectivity; MPFC, medial prefrontal cortex; PCC, posterior cingulate cortex; ROI, region-of-interest; rsfMRI, resting-state functional magnetic resonance imaging; SE, standard error.
ROI analysis
ROI analysis was conducted to obtain a more quantitative evaluation on the dependence of FC strength with spatial smoothing, scan length, seed size, ROI and seed location, and number of participants.
ROI analysis between the PCC and MPFC shows an increase in mean FC strength between these two regions with an increase in seed size, but with a slight increase in the SE, leading to a consequential increase in t-score (t-score = mean FC strength/SE), when including the entire population and using an FWHM = 4 mm of spatial smoothing and a 14.4-min scan length (Fig. 2).
The increase in FC strength between PCC and MPFC is primarily affected by the spatial smoothing and much less affected by scan length, for the whole dataset (Fig. 3). Similar effects are shown in the ROI analyses between AMYL(R) and INL(R) (Supplementary Fig. S5-top), although the absolute FC strength and t-score seem to be lower between these regions compared with those between PCC and MPFC (Fig. 3 and Supplementary S5-top).
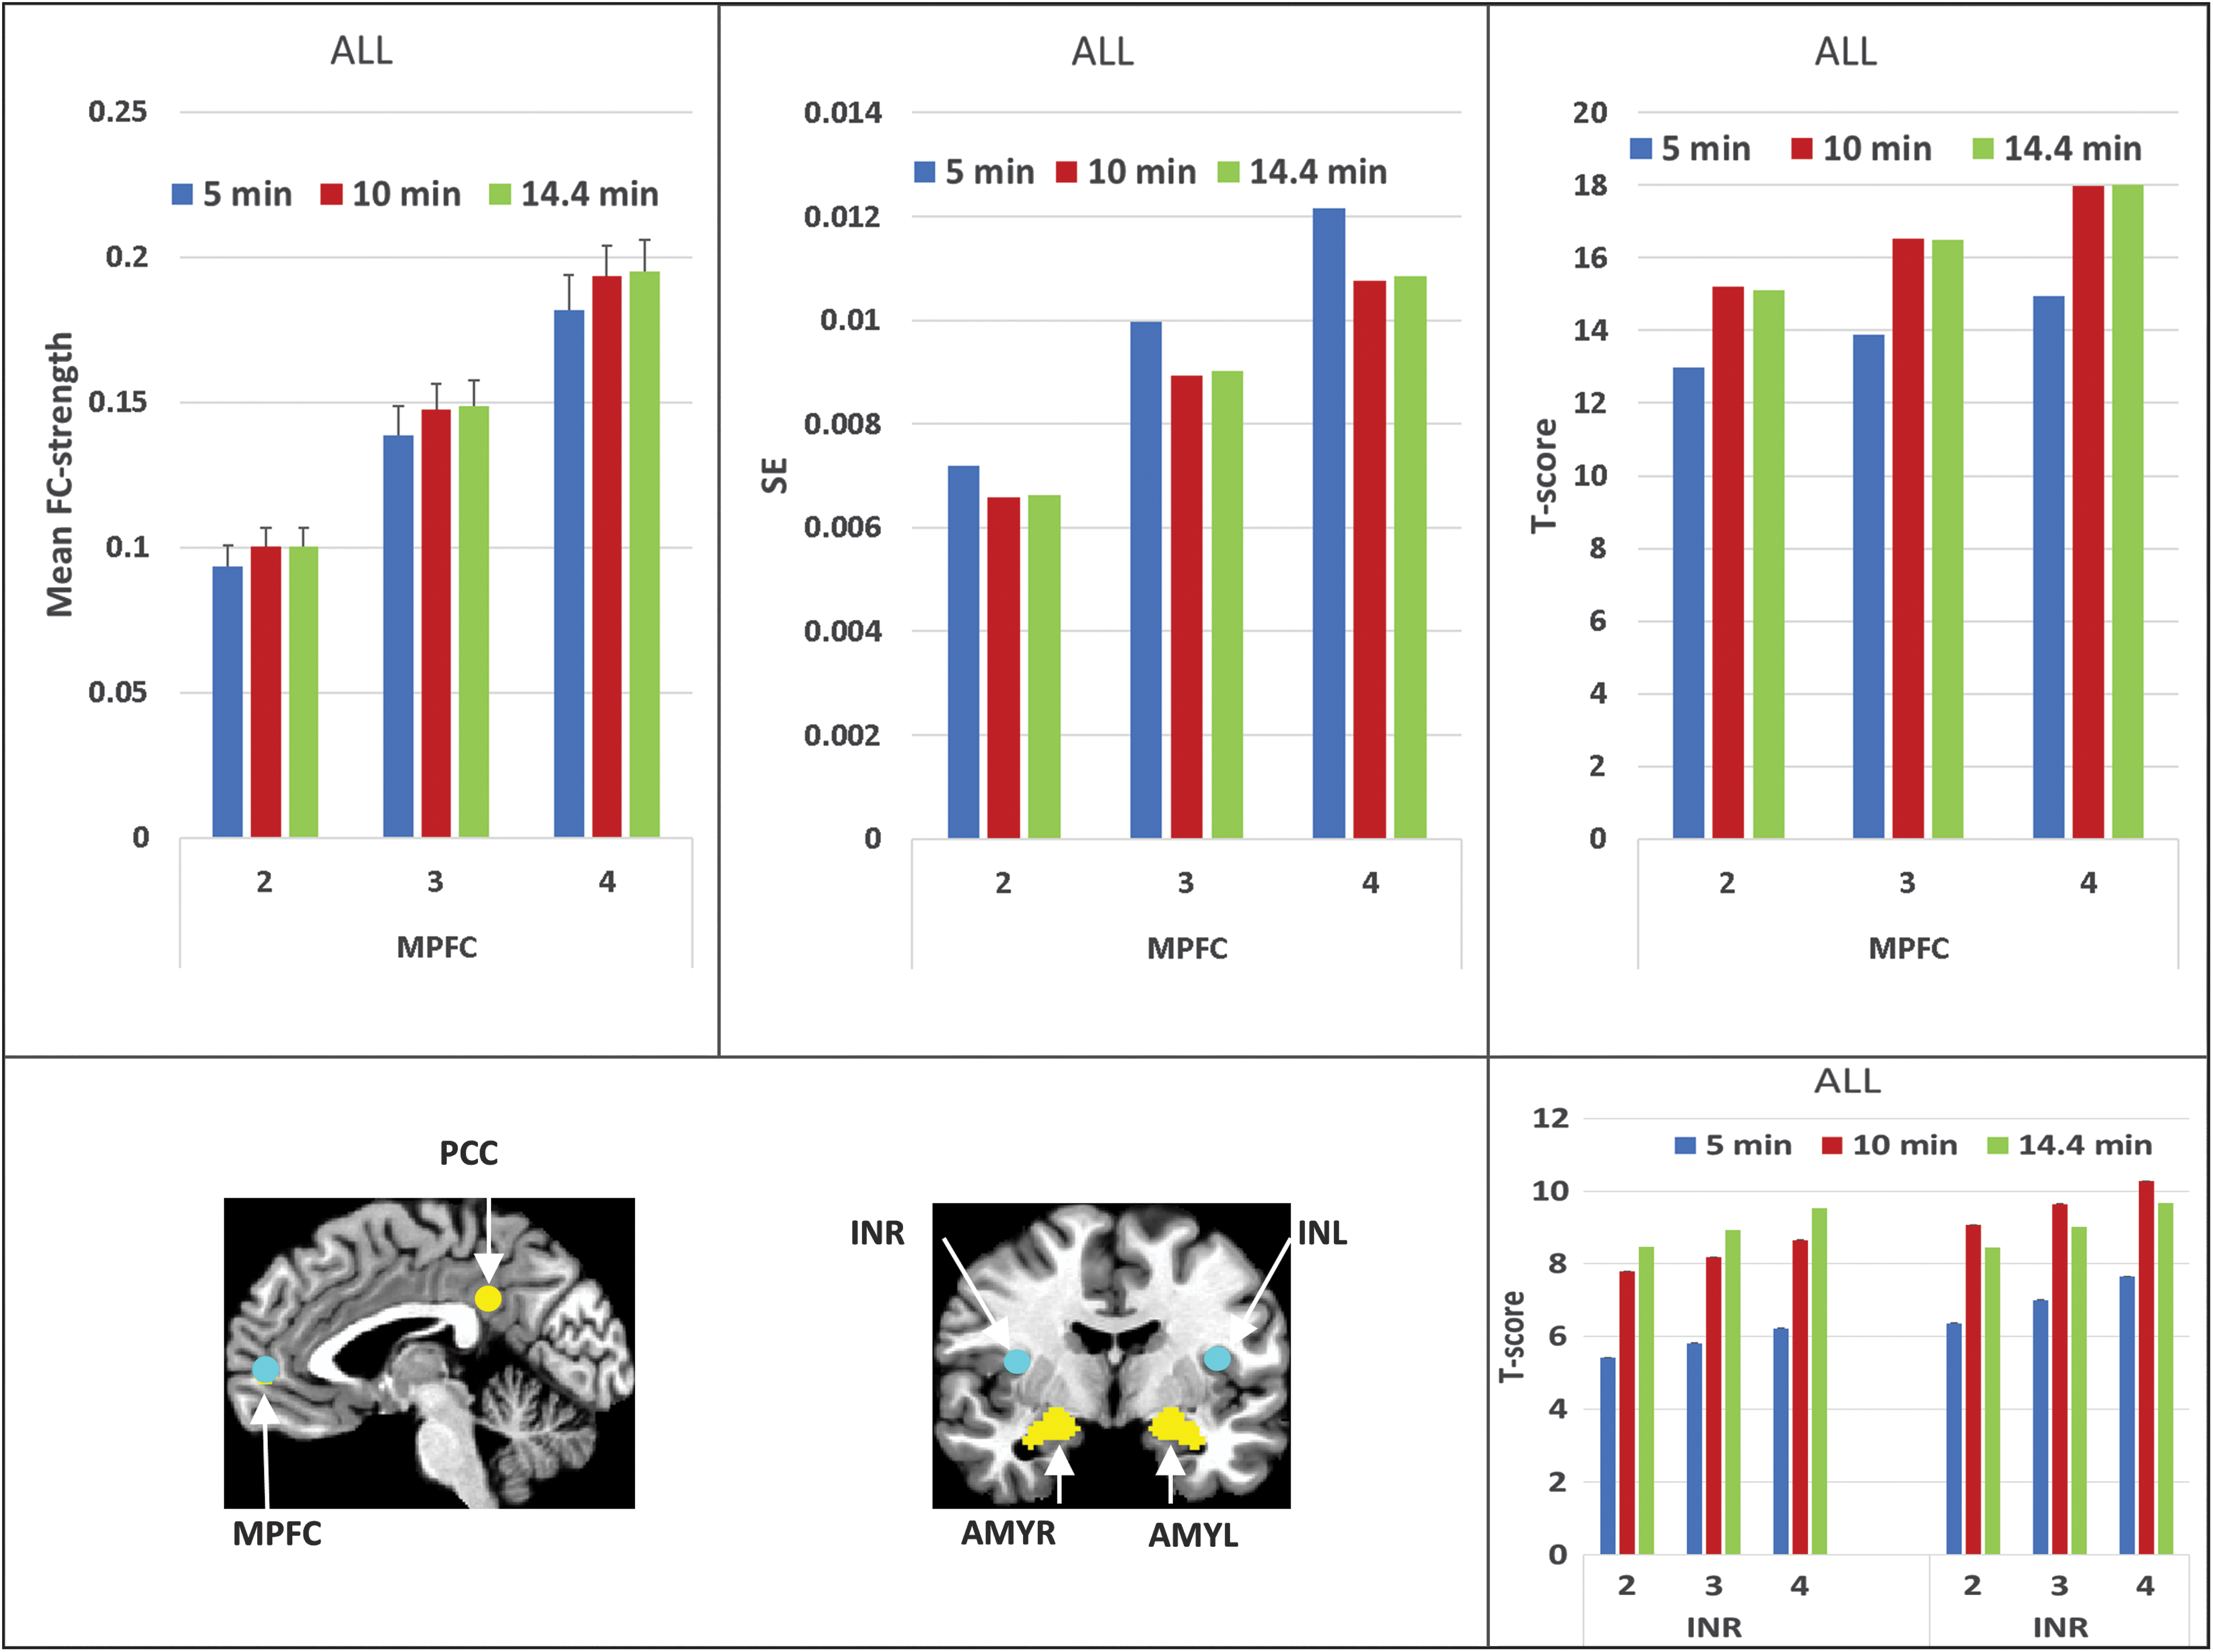
ROI analysis for ALL = 98 (14.4 and 10-min runs) or 100 (5-min run) participants, at MPFC. Absolute values are displayed for different smoothing values (x-axis: 2, 3, 4 mm) and different scan lengths (5, 10, 14.4 min); t-score = mean FC-strength/SE. Error bars shows the SE. t-Score is displayed for INL(R). Cyan: ROI location, yellow: seed location. AMYR, right amygdala; INL, left insula; INL(R), left(right) insula; INR, right insula.
The effect of sample size on FC is shown in Supplementary Figures S5 and S6. While FC strength is little affected by the number of participants, the SE decreases and, consequently, the t-score increases with a larger sample size (Supplementary Fig. S5). Here, the effect of spatial smoothing seems to become secondary when compared with the effect of the sample size for the t-scores, a result that is independent of the approach used to calculate the SE (Supplementary Fig. S5 approach #1 and Supplementary Fig. S6 approach #2).
Relative differences between conditions, shown in Table 1, reveal that, while the FC strength increases with spatial smoothing (around 90%) the SE increases as well (66%), leading to a slight increase in t-score (about 15%). On the other hand, the difference in scan length has a slight effect on FC strength (about 7%), but with a greater decrease in SE (between 10% and 32%, depending on the brain area), leading to an increase in t-score that is higher for the sub-cortical seed (MPFC: 19%, Insula: 54% [R] and 31% [L]). Conversely, although sample size has little effect on the FC strength (about 1%), there is a marked decrease of the SE with increasing sample size (about −54%) that results in a substantial increase of the t-score (about 118%). Note that, although changes in SE due to spatial smoothing and scan length were driven by changes in SD, the decrease of SE due to an increase in the sample size was solely driven by the factor 1/(N)1/2, since the SD is mostly unaffected by changes in sample size (Supplementary Table S1). Finally, the two approaches to calculate SE gave comparable values, as shown in Supplementary Table S2.
Relative Differences of the Mean Functional Connectivity-Strength, SE (Mean SE = Average SE(i) [Approach #1]) and t-Score of the Absolute Values Displayed in Supplementary Figure S5
Bold indicates the session heads. Italics indicate the average of the sessions.
ALL = 98 (14.4 and 10 min runs) or 100 (5 min run). For example, at the first row of the table the relative difference (14 min −5 min)/5 min means FC strength (14 min) − FC-strength (5 min)/FC strength (5 min), where FC strength (14 min) and FC strength (5 min) were extracted for ALL ppts averaged across different smoothing condition. The relative difference of FC strength is displayed for each ROI (MPFC, INR, INL).
acr., across; FC, functional connectivity; INL, left insula; INR, right insula; MPFC, medial prefrontal cortex; ppt, participant; ROI, region-of-interest; smth, smooth.
Power analysis
Figure 4 and Supplementary Table S3 show the effect size (mean FC strength/SD) for the FC between PCC and MPFC (PCC-MPFC) and between the left and right amygdala and the left and right insula (AMYL-INL, AMYR-INR), under various conditions (spatial smoothing, scan length, and number of participants), with the effect size threshold to reach significance (Power = 80%, α = 0.05). Supplementary Table S3 highlights in red those sub-samples and conditions in which the effect size did not reach significance and in yellow those effect size values that are border line (slightly above the threshold).
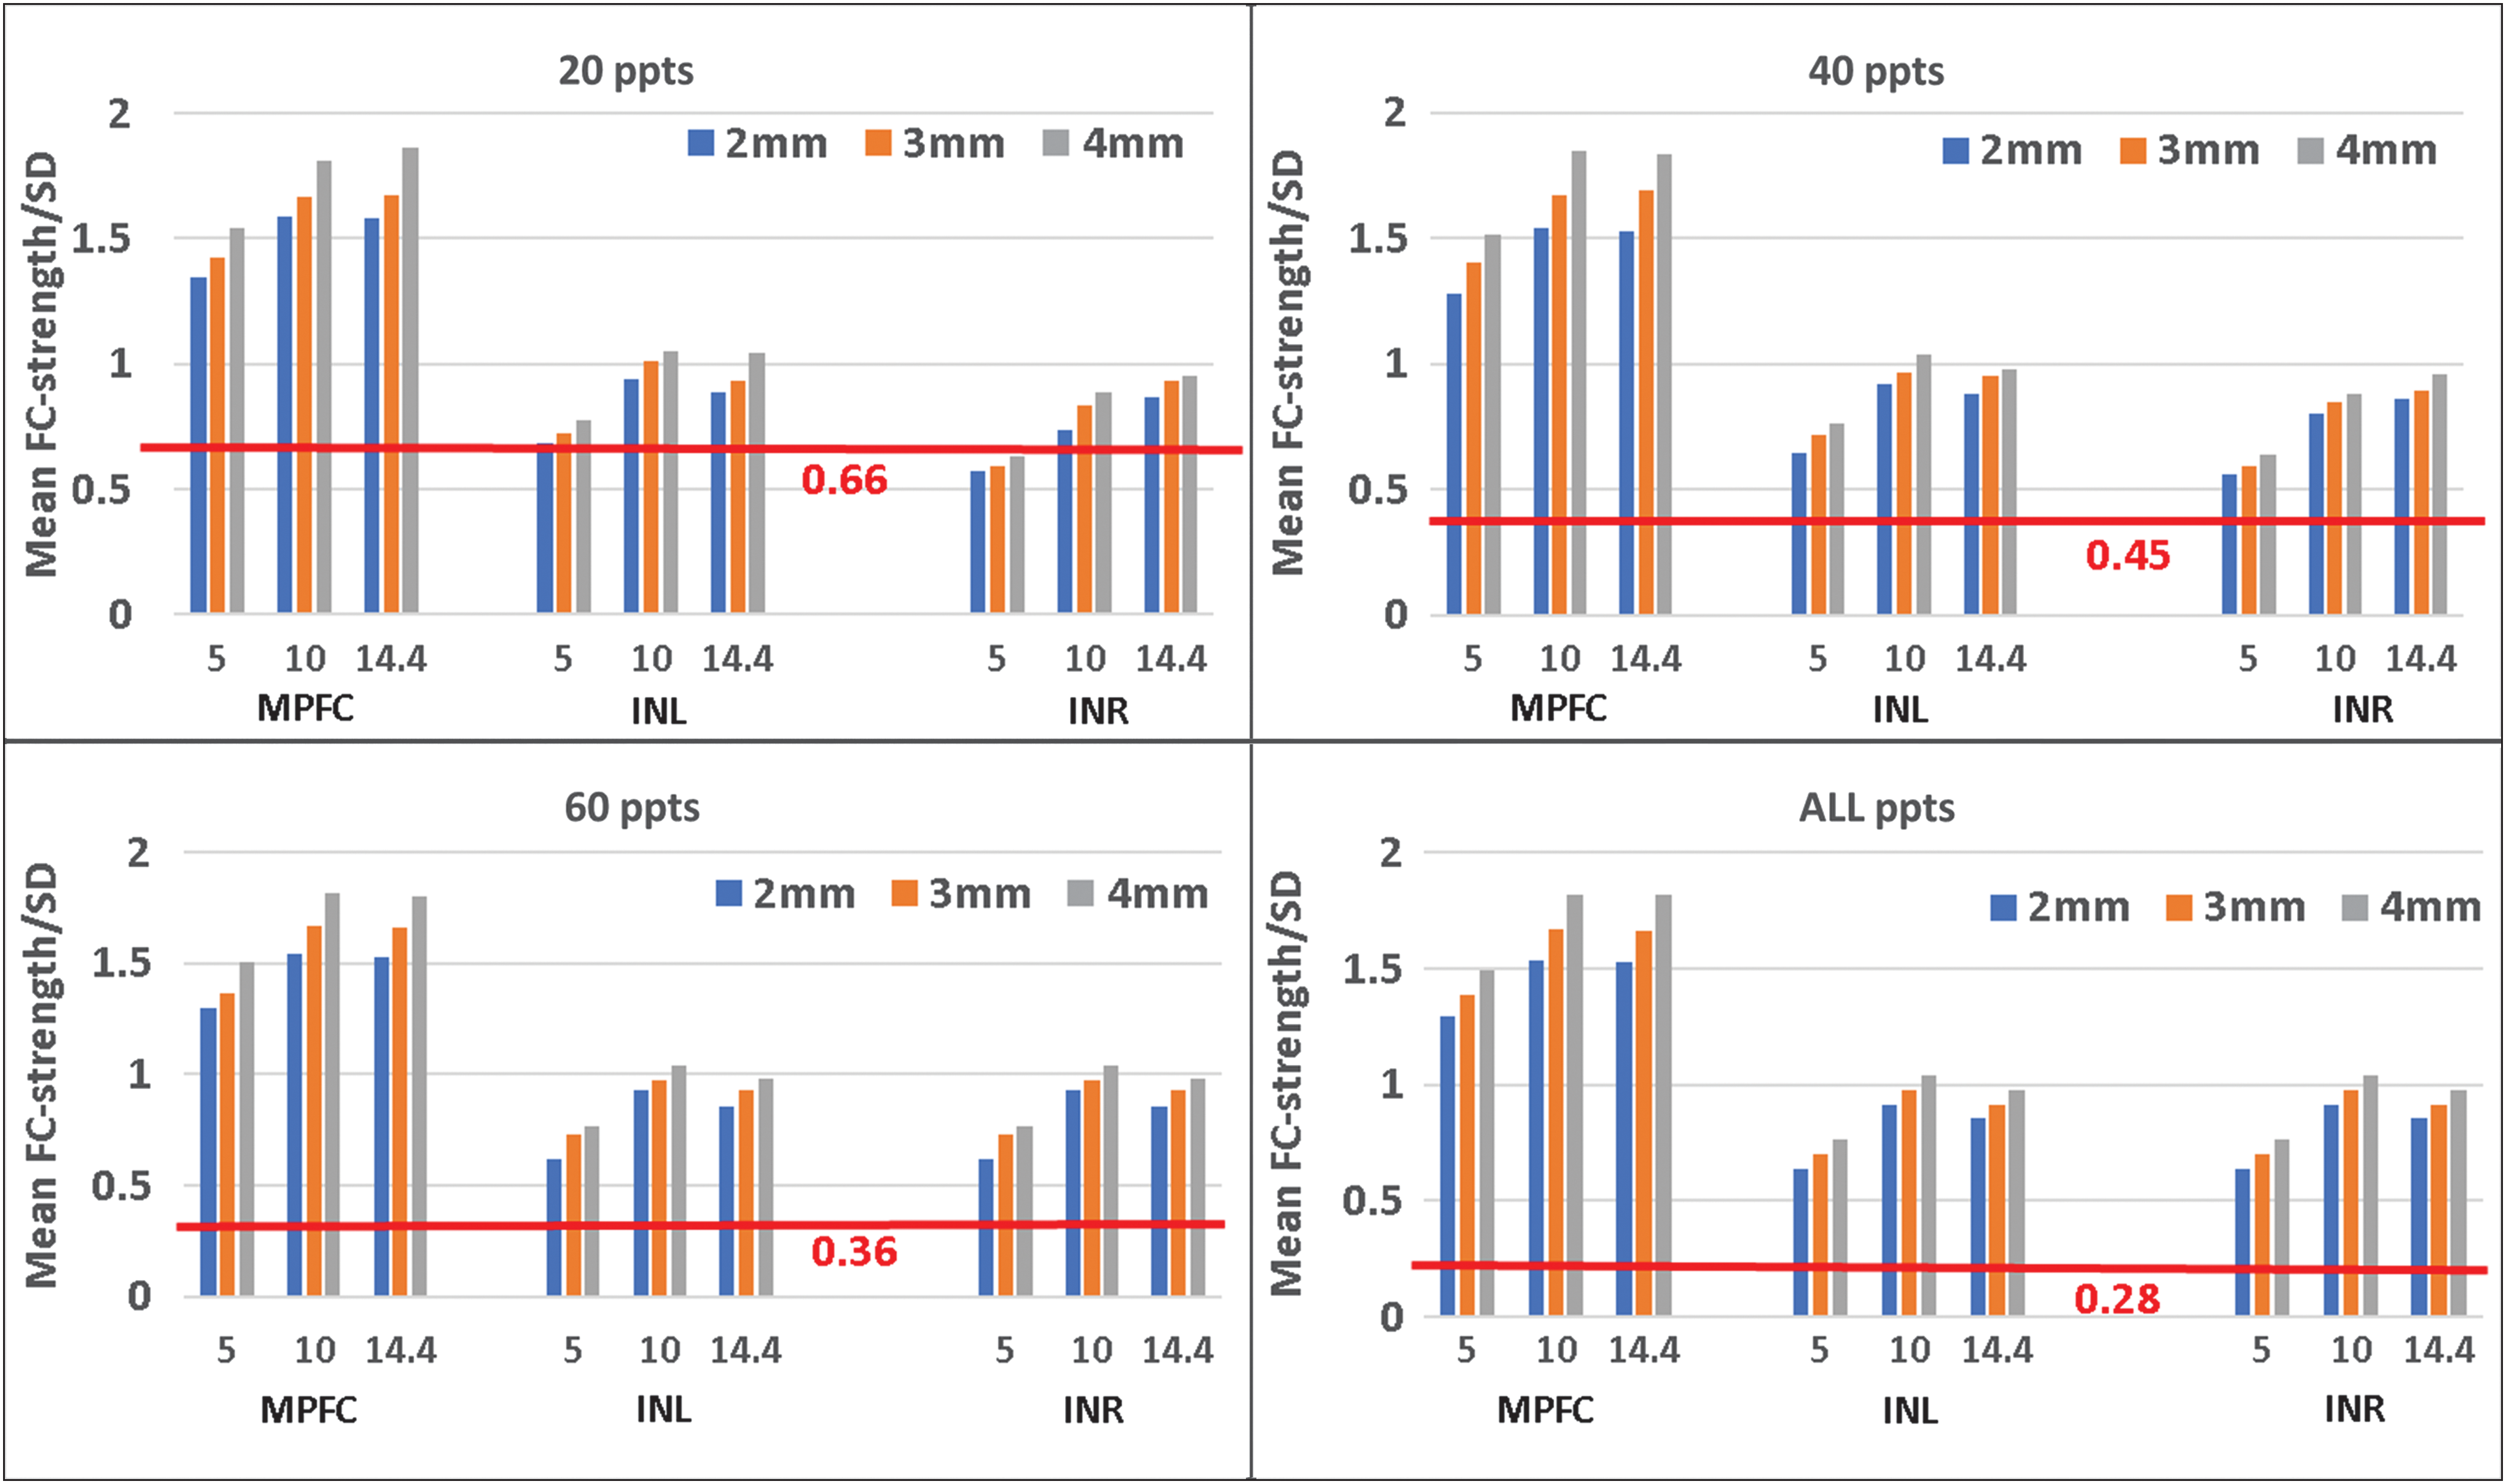
Effect size (mean FC strength/SD) values for the different smoothing levels (2, 3, 4 mm), scan lengths (5, 10, 14.4 min) and number of participants (ppts = 20, 40, 60, ALL). For the sub-groups (ppts = 20, 40, 60), the SD was calculated by using approach #1, SD = mean [SD(i)], with i = 1…100. For ALL = 98 (14.4 and 10 min runs) or 100 (5 min run) participants, the SD reflects the variability of the mean FC strength across the population. Minimum effect size to reach significance (Power = 80%, α = 0.05) is shown in red for their respective sample size. SD, standard deviation.
The results show that while, for the PCC-MPFC circuitry, the FC strength reaches the needed power for significance for all sub-samples of 20, 40, and 60 participants, all scan lengths (5, 10, and 14.4 min) and spatial smoothing of 2, 3, and 4 mm FWHM, for the amygdala-insula (AMY-IN) connections, the results are quite different. The AMY-IN FC shows that a sample size of at least 40 participants is necessary to reliably measure this circuit if short runs, such as 5-min duration, are considered. However, if a very low level of smoothing is desired, such as FWHM = 2 mm, then a 10-min scan may also compromise the statistical power of the results.
tSNR results
Whole-brain tSNR is shown as a function of spatial smoothing and scan length in Figure 5, in which lower tSNR in subcortical areas compared with cortical areas is observed. The effect of spatial smoothing on tSNR was stronger than the effect of scan length, as shown in Supplementary Figure S7. Although the effect of scan length does not seem to be as strong as the effect of smoothing level, its major effect occurs in occipital and parietal areas, where tSNR decreases with increasing scan length (Supplementary Fig. S8). Mean tSNR at the seeds (PCC, AMYL, and AMYR) and at the ROIs (MPFC, INL, and INR) are also plotted in Supplementary Figure S8, showing basically no effect of scan length on those areas but a clear increase with increased smoothing level. Finally, there is no effect of number of participants on the tSNR (Supplementary Fig. S9).
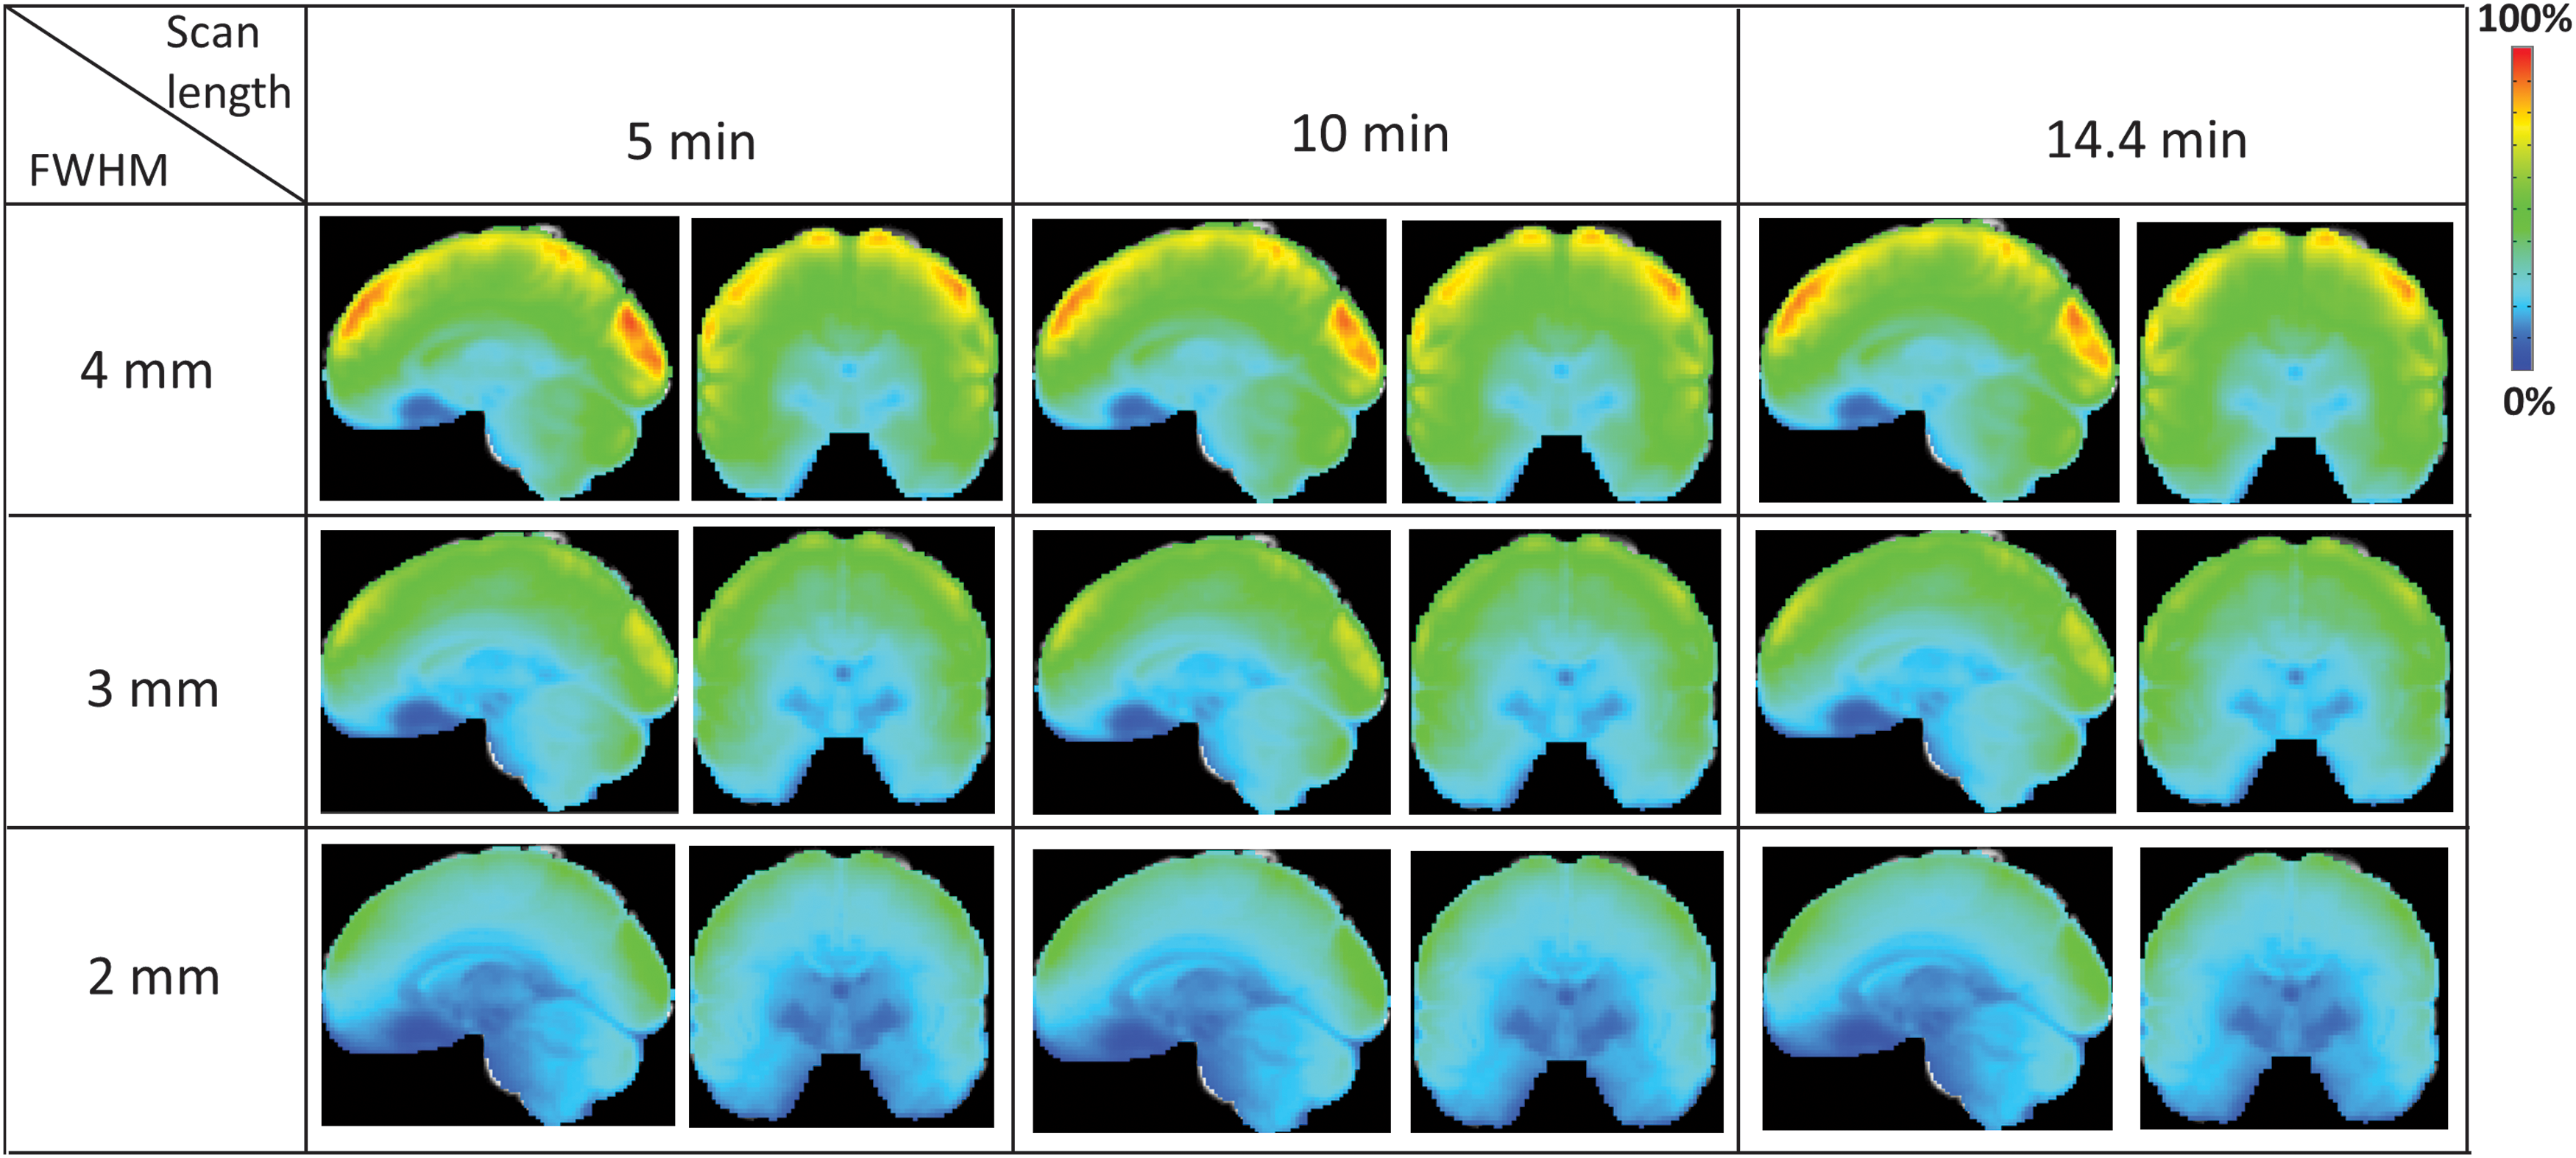
tSNR maps averaged across ALL = 98 (14.4 and 10-min runs) or 100 (5 min run) participants for the different smoothing levels (FWHM = 2, 3, 4 mm) and scan lengths (5, 10, 14.4 min). tSNR, temporal signal-to-noise ratio.
Discussion
An extensive data analysis considering different parameters, such as spatial smoothing, scan length, sample size, seed size, and location, has been carried out in this study, using a high spatiotemporal resolution fMRI dataset, to provide a comprehensive assessment of their effects on resting-state functional connectivity and tSNR. There are few published studies that have evaluated the effects of these parameters in rsfMRI, but, in most of the works, these parameters have been evaluated independently, and not necessary on high temporal resolution fMRI data, giving just a partial view of their effects on rsFC and tSNR. For example, whereas Murphy and colleagues (2007) studied the effect of scan duration on tSNR, the influence of spatial resolution and smoothing on the detectability of rsfMRI was examined by Molloy et al. (2014). This latter study used data with three different spatial resolutions (in-plane resolution: 3.50 × 3.50 mm2, 2.33 × 2.33 mm2, 1.75 × 1.75 mm2; slice thickness: 3.5 mm), and although a different smoothing level was used for each data resolution, they were applied to achieve the same level of smoothness (FWHM: 5.5 mm). As a result, they observed that there was no significant difference in functional connectivity as a function of actual resolution after smoothing.
In this study, we observed that spatial smoothing is the main parameter to be considered during data analysis, to achieve sufficient detection power of BOLD signal. Therefore, when the sample size is moderate (20–40), it may not be advantageous to collect data with a high spatial resolution, since the low voxel-wise SNR due to the small voxel size (without smoothing) would result in low tSNR, particularly in brain regions with low RF coil sensitivity, such as subcortical regions.
The number of participants did not affect the rsFC strength or tSNR, but it did affect SE, increasing the statistical values. This is unsurprising, as this finding is predicted by the Central Limit theorem in a sample distribution (Watt and van den Berg, 2002): “Given a population P with mean M and standard deviation SD, any sub-samples of size N, where N < P, when sample with replacement, will compose a sampling distribution of means. The mean value of this distribution m will be the same mean value as the population mean, m = M, and the standard error the distribution = SD/N 1/2.” Our results clearly follow this theorem (i.e., Table 1 and Supplementary Table S1).
The scan length also had some effects on the rsFC results. Although it slightly affected the rsFC strength and tSNR, on the chosen ROIs, its major effect was on the SE, leading to a significant impact on the t-score. In most of the cases, the SE and t-score of 10 and 14.4 min scans were significantly different from those of 5 min, with the differences between the 10 and 14.4-min scans less clear. It is important to note here that, due to the high temporal resolution of the data, even the shortest run (5 min) has a large number of images (418) and that the 10-min run, which starts to show acceptable power, has 835 images. It may suggest that at least about 800 images are needed to reach reasonable power, when using a set of high spatiotemporal resolution data. This finding is in agreement with a previous work, in which, with a voxel size of ∼10 mm3 at 3T and a corresponding tSNR of ∼50, the required number of time points that guarantees detection of signal changes of 1% is about 860 (Murphy et al., 2007). Therefore, our results show that detection power in rsfMRI is affected not only by the length of the scan but also by the number of samples, as previously verified by Birn and colleagues (2013), who have shown, in their work, that “functional connectivity estimates computed by considering only every other data point of a 6, 12, or 24-minute scan length were less reliable than the full 6, 12, 24-minute acquisitions, but were more reliable than full 3, 6, and 12-minute scan lengths, even though the number of time points was the same.” On the other hand, it is interesting to notice how tSNR decreases with the increase in scan length on more posterior cortical areas (Supplementary Figs. S7 and S8), which might be associated with some variability on the coil sensors over time, maybe due to heating, that is detected by the closest brain areas.
The effect of seed size on rsFC was also evaluated in this study, and it impacted the rsFC maps, as observed in Figure 2 and Supplementary S4. The increase of the seed volume had a significant effect on the rsFC strength, but the effect on SE was less clear, resulting in an increase of significance of functional connectivity directly related to an effect size change (ROI results in Fig. 2). Even the smallest seed provided a reasonable rsFC map (Fig. 2), probably because the seed was in a cortical area, which still has a good tSNR (Fig. 5).
Seed location has also a strong impact on rsFC when using high-resolution data. Generally, sub-cortical seeds seem to be more affected, particularly with a low spatial smoothing level and a short scan duration, than seeds in the cortical areas (Figs. 1 and 4, Supplementary Figs. S1-bottom, S2-left, S3 and Supplementary Table S3). This result is explained by the tSNR drop-off observed when going from cortical to subcortical areas (Fig. 5). This finding is supported by a previous work showing that reproducibility in rsfMRI is poor on subcortical regions (Noble et al., 2017). Besides, the dependence of the functional connectivity strength, SE, and t-statistic on the seed size and amount of spatial smoothing depended on the size of the functional area being investigated. For example, for a relatively small structure such as the amygdala, higher levels of smoothing could be averaging in other functional areas (particularly if levels of smoothing greater than 4 mm would be used). On the other hand, for larger regions such as the posterior cingulate, averaging would serve to reduce noise, resulting in higher functional connectivity strength.
Overall, our findings suggest that high spatiotemporal resolution data can be used to evaluate rsFC with a 10- or 15-min rsfMRI scan and a sample size of about 40 participants. This is supported by Noble and colleagues (2017), who showed the need to have at least 12-min rsfMRI runs to reach reasonable (fair) results on FC when evaluating the test
In this work, we focused on understanding how some of the postprocessing parameters, such as, spatial smoothing, seed size, and location, affect the detection power of BOLD signal in rsFC results, when using high-resolution data, but with a more restricted sample size of either short scan lengths (5–15 min) or modest number of participants (20–60). For these purposes, it was sufficient to use data from a set of 100 participants, with just one 15-min run of rsfMRI per participant, since this choice provided all the data needed for the proposed evaluation. Other factors that could affect rsFC results, such as intra-subject variability or data acquired with different scanners and/or acquisition parameters, were not considered here. Although the effects of some of these variables on rsFC have been previously explored (Renvall et al., 2014; Smith et al., 2005; Triantafyllou et al., 2005, 2006), future work on this line would be recommended. Finally, since our results were restricted to a single group, the sample sizes reported here do not translate to sample sizes and need to detect group differences or behavioral correlations. We hope that this work would lead to future investigation of group differences as well. Meanwhile, we expect that this work would serve as a guide of experimental design and image processing for those centers that are acquiring a state-of-the-art MRI machine. We hope that the current findings may help those centers decide the imaging sequence and parameters to maximize the quality of their research studies.
Conclusions
High spatiotemporal resolution rsfMRI data are within the reach of neuroscience investigators utilizing state-of-the-art MRI technologies. However, some limitations are still imposed on the acquired data if the ideal set of parameters is not chosen and the appropriated postprocessing steps are not taken. Here, we carefully analyzed some common parameters for data acquisition and data processing used in resting-state functional connectivity and revealed their advantages and limitations. Based on the analysis, appropriate parameters can be chosen for specific studies. Therefore, this work provides guidance for the use of high-resolution rsfMRI data, according to the parameters adopted in the study design and data processing.
Footnotes
Author Disclosure Statement
No competing financial interests exist.
Funding Information
This work was supported by the National Institute on Drug Abuse Intramural Research Program. Data were provided by the Human Connectome Project, WU-Minn Consortium (Principal Investigators: David Van Essen and Kamil Ugurbil; 1U54MH091657) funded by the 16 NIH Institutes and Centers that support the NIH Blueprint for Neuroscience Research; and by the McDonnell Center for Systems Neuroscience at Washington University.
Supplementary Material
Supplementary Figure S1
Supplementary Figure S2
Supplementary Figure S3
Supplementary Figure S4
Supplementary Figure S5
Supplementary Figure S6
Supplementary Figure S7
Supplementary Figure S8
Supplementary Figure S9
Supplementary Table S1
Supplementary Table S2
Supplementary Table S3
References
Supplementary Material
Please find the following supplemental material available below.
For Open Access articles published under a Creative Commons License, all supplemental material carries the same license as the article it is associated with.
For non-Open Access articles published, all supplemental material carries a non-exclusive license, and permission requests for re-use of supplemental material or any part of supplemental material shall be sent directly to the copyright owner as specified in the copyright notice associated with the article.