
Abstract
The extended amygdala has been implicated as a critical region in the neurocircuitry underlying anxiety. The circuitry of the extended amygdala, including the central (CeA) and basolateral (BLA) nuclei of the amygdala and the bed nucleus of the stria terminalis (BNST), has been well defined in nonhuman animals; however, much less is known about the roles and interactions of these structures in humans given their small size. Therefore, this study used high-resolution 7-Tesla magnetic resonance imaging to define, compare, and contrast functional connectivity (FC) of these structures in 57 neurologically healthy young adults. In addition, FC was investigated in relation to self-reported measures of anxiety and intolerance of uncertainty, a key feature of anxiety. Results of the FC analysis of each of the nuclei largely replicated previous work. Conjunction analyses showed that nuclei of the extended amygdala shared FC with hippocampal, cingulate, medial prefrontal, and subgenual cortices. Comparison of seed-to-voxel time series correlation maps demonstrated that compared with the BNST, the CeA and BLA were more strongly coupled with parahippocampal, temporal, fusiform, and occipital gyri. Relative to the CeA and BLA, the BNST was more strongly coupled with the anterior caudate and anterior cingulate cortex. Finally, trait anxiety and intolerance of uncertainty were not robustly related to FC of the extended amygdala at rest. Results of this study extend previous work to provide more clarity of the nuances of extended amygdala resting FC and its relationship with anxiety.
Introduction
Research into the neurocircuitry underlying anxiety has implicated the extended amygdala as a region that is critical in fear and threat processing (Davis and Whalen, 2001; Davis et al., 2010; Fox and Shackman, 2017). In particular, the extended amygdala is important for organizing defensive responses to potential threat (Fox and Shackman, 2017; Klumpers et al., 2017). The efficient coordination of this response is critical to reducing anxiety in response to novel and uncertain situations (Davis and Whalen, 2001; Grupe and Nitschke, 2013). Characterizing the basic functional connectivity (FC) of this threat and fear processing network is necessary to understand how dysfunction within the network can result in anxiety symptoms and states.
Tracer studies with rodents have delineated the differential roles and connectivity of key regions within the extended amygdala, including the central (CeA) and basolateral (BLA) nuclei of the amygdala, and the bed nucleus of the stria terminalis (BNST) (Alheid, 2003; Alheid and Heimer, 1988; Fox et al., 2015; Gungor and Pare, 2016; Stamatakis et al., 2014). The CeA is believed to be responsible for conditioned fear responses and perception of fear stimuli, whereas the BLA is believed to be responsible for tracking stimulus associations (Calhoon and Tye, 2015; Davis et al., 2010; Grupe and Nitschke, 2013). Although the extended amygdala nuclei are all responsive to threat, the time course of responsivity varies (McMenamin et al., 2014). Both the CeA and BLA have been shown to mediate phasic responses to threat or “fear,” whereas the BNST may be more involved in sustained responses, sometimes considered “anxiety” (Alvarez et al., 2011; Lebow and Chen, 2016). One model of the interaction of these structures suggests sensory inputs to the BLA project to the CeA and BNST whereby the response to threat is generated via downstream targets, including the thalamus and prefrontal cortices (Davis et al., 2010; Fox et al., 2015; Gungor and Pare, 2016).
Although this circuitry has been well defined in nonhuman animals, less is known about the differential roles and interactions of these structures in humans. Specifically, FC of the BNST and subnuclei of the amygdala in humans has not been well characterized, as the small size of these subcortical structures makes them difficult to examine with standard magnetic resonance imaging (MRI) techniques. Given recent advances in the spatial resolution of MRI, researchers have begun to detail the structural and functional connections of the extended amygdala in humans (Avery et al., 2014; Gorka et al., 2018; Oler et al., 2012; Tillman et al., 2018). These studies have helped to advance the understanding of anxiety circuitry in humans; however, there are still many nuances within this neural circuitry that have yet to be described. For example, CeA and BNST connectivity has been shown to be conserved across several species (Oler et al., 2012); however, a comparison of their connectivity has shown that these structures have similar, but differential functional roles in the context of anxiety such that the CeA is more activated under “fear” states, whereas activity of the BNST is more akin to “anxiety” states (Alvarez et al., 2011; Fox et al., 2015; Lebow and Chen, 2016; Torrisi et al., 2018).
Although this distinction of the role of CeA and BNST has been clarified, the BLA has also been shown to play a critical role in anxiety neurocircuitry in nonhuman animals (Stamatakis et al., 2014; Wassum and Izquierdo, 2015; Yang and Wang, 2017); however, it has not been studied to the same extent as the CeA. Moreover, elucidating the distinct roles of these structures may help to inform the neural substrates underlying specific features of anxiety, such as intolerance of uncertainty (Grupe and Nitschke, 2013; Morriss et al., 2015, 2016), which may rely preferentially on particular neural circuits in this complex system.
Therefore, this study utilized high-resolution 7-Tesla MRI to replicate prior work that has characterized resting FC of the BNST and CeA in humans (Avery et al., 2014; Gorka et al., 2018; Torrisi et al., 2015) and extends this research to also include FC of the BLA. In addition, this study also aimed at evaluating the overlapping and differential FC among the extended amygdala at high resolution. Finally, this study also serves as a preliminary investigation into the FC of the extended amygdala as it relates to indices of trait anxiety and intolerance of uncertainty, a core feature of most anxiety disorders (Grupe and Nitschke, 2013; Morriss et al., 2015, 2016).
Methods
Participants
Fifty-seven undergraduate students from the University of Wisconsin-Milwaukee participated in this study (12 males, 45 females; Mage = 22.2, SDage = 3.62; 56% Caucasian, 14% Asian or Pacific Islander, 12% African American, 12% Hispanic, 4% Other). Inclusion criteria included being right-handed, more than 18-years-old, and English-speaking. Exclusion criteria included history of neurologic disorder, history of psychosis or bipolar disorder, head trauma, current use of antipsychotics, anticonvulsants or mood stabilizers, and any contraindications to MRI including metal in the body, pregnancy, or claustrophobia. The study was approved by the University of Wisconsin Milwaukee and the Medical College of Wisconsin Institutional Review Boards. According to the Declaration of Helsinki, participants provided written informed consent and were paid for their participation in the study.
Anxiety-related measures
Trait anxiety was assessed by using the 20-item self-report State-Trait Anxiety Inventory-Trait (STAI-T) (Spielberger et al., 1983). The STAI-T has been shown to be internally consistent and reliable (Spielberger et al., 1983). Average STAI-T scores in this sample (MSTAI-T = 36.92, SDSTAI-T = 7.93, RangeSTAI-T = 20–56) were below the proposed clinical significance threshold of 39–40 (Julian, 2011). Higher scores on the STAI-T indicate greater anxiety.
Intolerance of uncertainty was assessed by using the 27-item self-report Intolerance of Uncertainty Scale (IUS) (Buhr and Dugas, 2002). This scale assesses an individual's disposition toward uncertainty, with higher scores indicating greater intolerance to uncertainty. Each item can be rated on a scale from 1 to 5; thus, scores can range from 27 to 135. Participants in this study had relatively moderate intolerance of uncertainty (MIUS = 59.19, SDIUS = 16.75, RangeIUS = 31–99).
MRI acquisition
MR images were collected on a 7-Tesla MR950 General Electric scanner. High-resolution T1-weighted whole-brain anatomical images were acquired in an axial orientation (repetition time = 8.012 ms, echo time = 3.784 ms, inversion time = 1050 ms, flip angle = 5°, field of view = 220 mm, slice thickness = 0.8 mm, matrix = 276 × 276, voxel resolution = 0.43 × 0.43 × 0.80 mm).
For the resting-state scans, participants were instructed to stay awake and blink normally while presented with a white fixation cross on a black background. An 8-min single-shot gradient-echo planar image (EPI) sequence was used for the resting-state scan (192 volumes, repetition time [TR] = 2500 ms, echo time = 24 ms, flip angle = 73°, field of view = 220 mm, matrix = 224 × 224, number of excitations = 1, slice thickness = 1.8 mm, 30 axial slices with 0 mm gap, voxel resolution = 0.859 × 0.859 × 1.80 mm). To optimize the spatial resolution advantages of the 7-Tesla, EPI scans were acquired with partial coverage of the brain. Coverage was determined for each individual participant such that the top of the insula was covered by the most superior slices and the hippocampus was covered by the most inferior slices. See Figure 1 for coverage of a representative participant. An additional single-volume EPI scan with reverse-phase encoding polarity was collected for distortion correction in the EPI preprocessing pipeline.
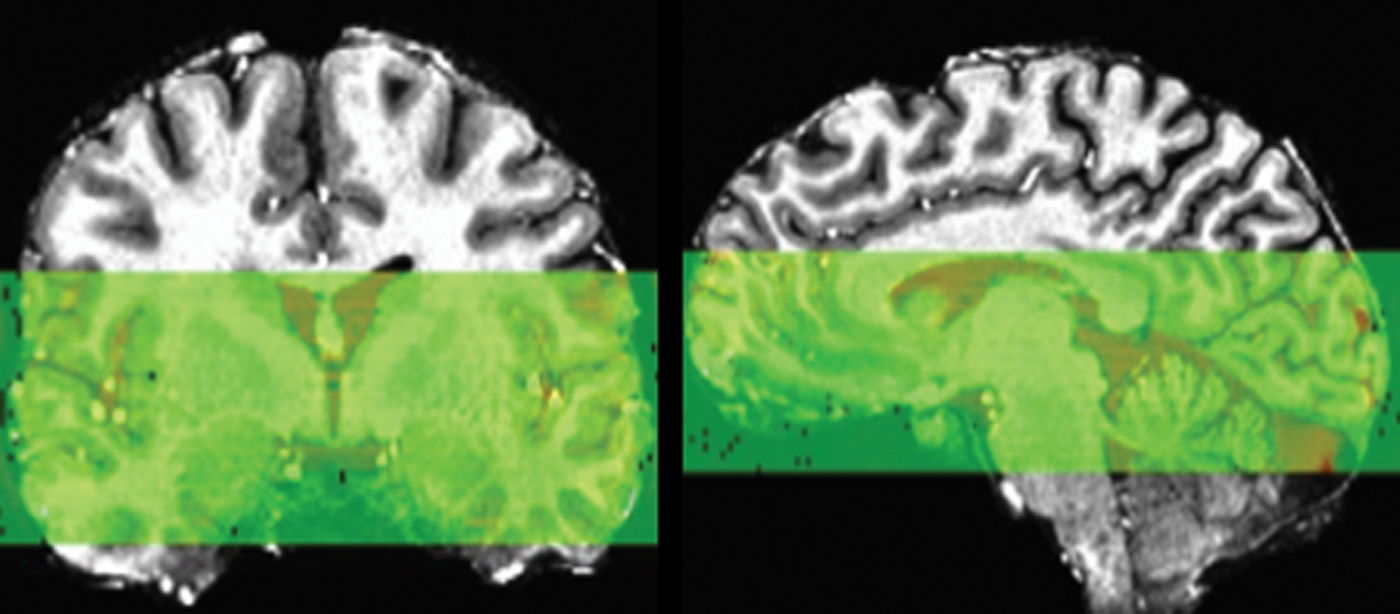
EPI partial acquisition coverage for representative participant. EPI, echo planar image. Color images are available online.
Image preprocessing
Tissue segmentation for each individual's anatomy was completed in FreeSurfer version 6.0 (Fischl, 2012). Preprocessing and analysis of the resting-state functional MRI (fMRI) were performed by using the ANATICOR (Jo et al., 2010) processing pipeline in AFNI (Cox, 1996). ANATICOR removes unwanted signals from white matter and ventricles by using eroded white matter and ventricle masks extracted from FreeSurfer to reduce any partial volume effects in the gray matter signals.
The first three TRs were removed from the EPI to remove pre-steady state artifacts. The remaining volumes were despiked, and slice time was corrected to the first EPI volume. Given the greater sensitivity to distortions at ultra-high field, EPI and reverse polarity scans were warped to a middle space for distortion correction. This method of distortion correction reduces overall warping by creating a middle ground between functional images, whereas most other methods warp one functional image entirely to the space of another. Functional volumes were then co-registered to the first functional volume and aligned to the anatomy. The anatomy and EPI were then warped to MNI space (MNI152) for group analysis. In accordance with the previous work that we aimed at replicating (Avery et al., 2014; Gorka et al., 2018; Torrisi et al., 2018), EPI were spatially smoothed with a kernel up to 3.6 mm by using 3dBlurToFWHM.
Six head motion parameters and their derivatives, a bandpass filter (0.01–0.1 Hz), and the time series from eroded ventricle masks were included as nuisance regressors and projected out of the final dataset. In addition, one censor file was included into the regression that excluded outlying TRs based on two criteria. The first outlying TRs were ones where more than 10% of voxels in the brain were outliers. These voxels were the ones whose values exceeded a certain mean absolute deviation scaled by the number of TRs in the run from the detrended data. Thus, TRs where more than 10% of the voxels exceeded this threshold were flagged as outlying TRs. In addition, TRs were also deemed outlying due to excessive motion, if the frame-to-frame Euclidean norm motion derivative was greater than 0.3 mm. Three participants' (three females) data were excluded from final analysis as more than 15% of TRs exceeded the motion derivative threshold, resulting in a final sample size of 54 (Gorka et al., 2018; Torrisi et al., 2015). Final correlation datasets were r-to-z transformed. Amygdala subnuclei (CeA and BLA) ROIs were defined by the MNI atlas constructed by Tyszka and Pauli (2016). The BLA mask, in particular, was created by combining the basolateral and lateral nuclei segmentations as defined by Tyszka and Pauli (2016) to remain consistent with the typical size and location of the BLA as reported in the literature (Roy et al., 2009). The BNST was defined by the segmentation mask created by Theiss and colleagues (2017) (see Fig. 2 for mask placement). For all seed regions, average time series were extracted and left and right hemispheres were combined into a single mask. White matter voxels, identified through the ANATICOR process, were removed from ROIs to ensure they did not overlap.
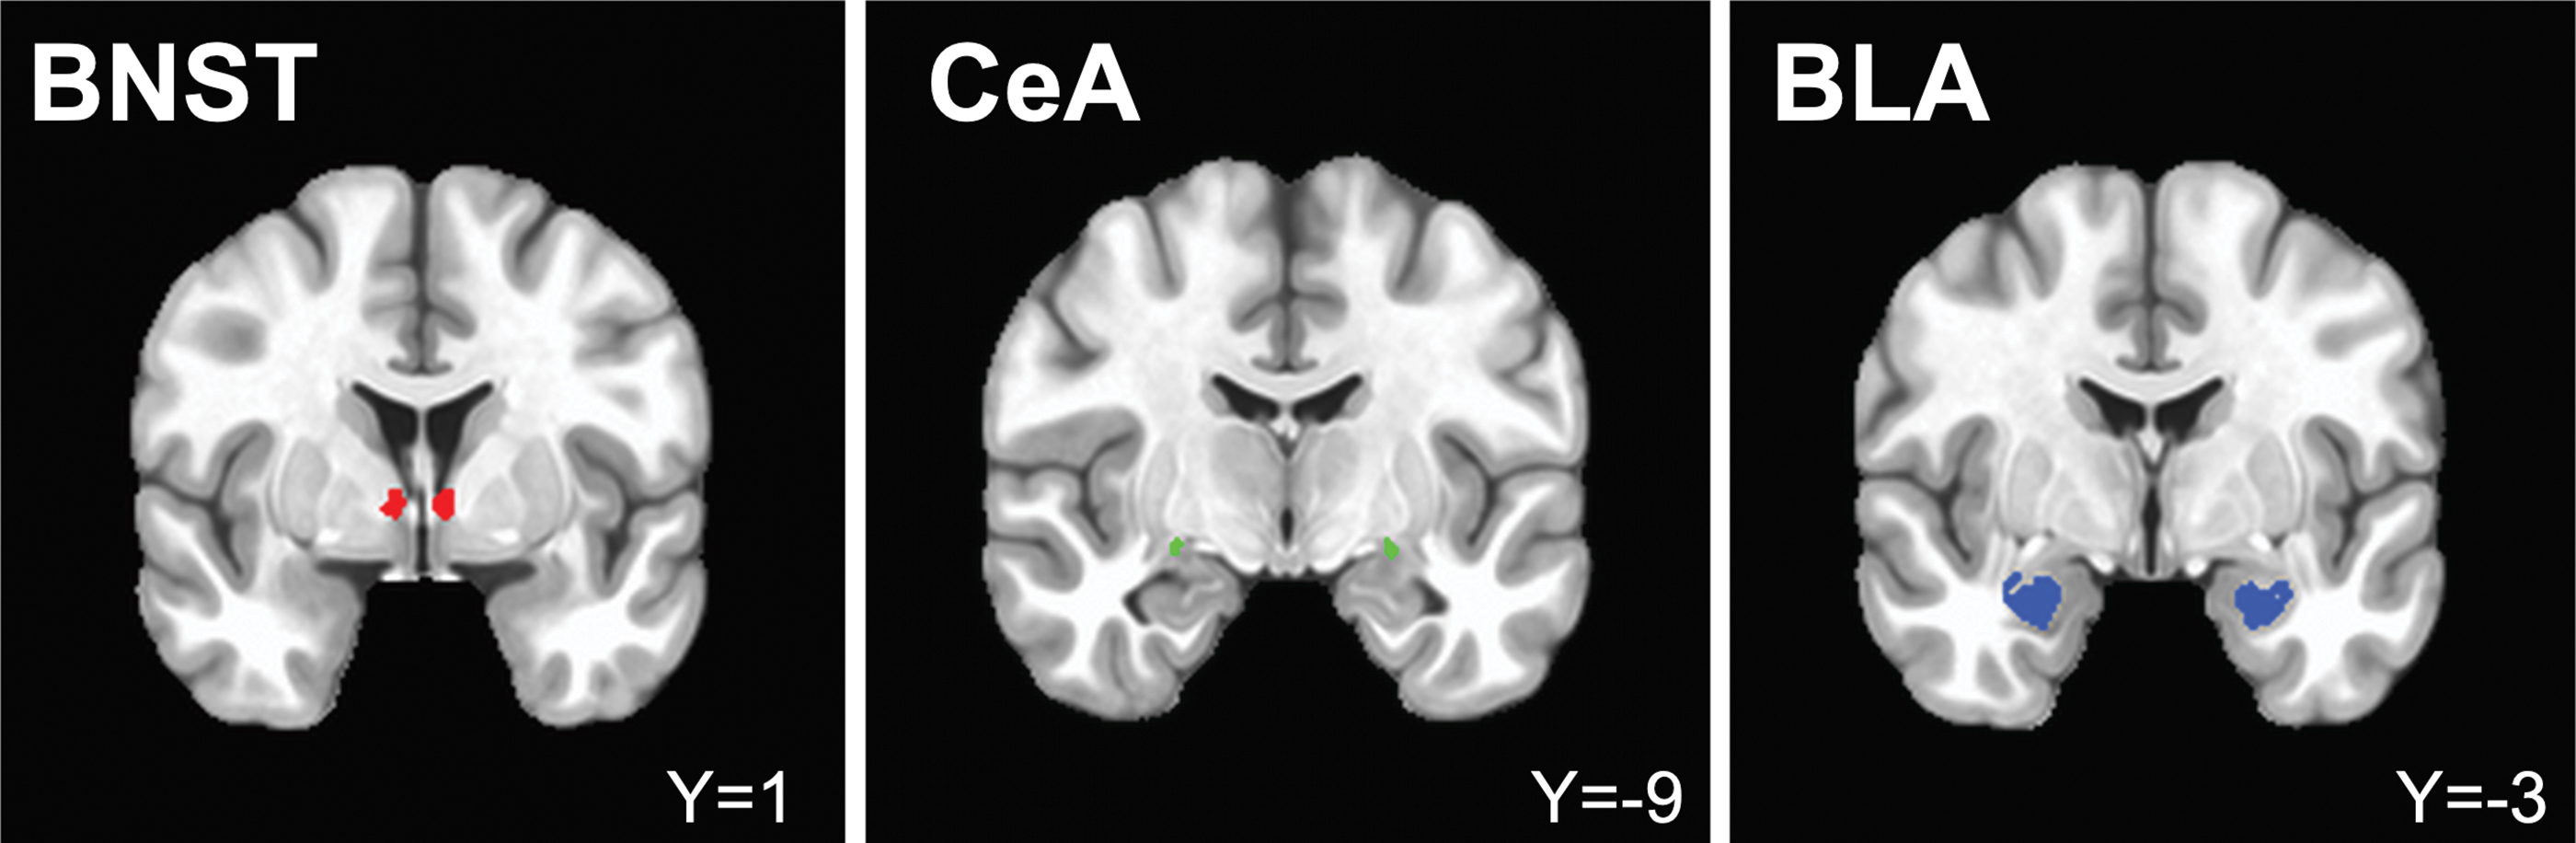
BNST mask from Theiss and colleagues (2017). CeA and BLA masks from Tyszka and Pauli (2016), respectively. All masks overlaid on standard MNI template (MNI152), left = right. BLA, basolateral amygdala; BNST, bed nucleus of the stria terminalis; CeA, central amygdala. Color images are available online.
Resting-state fMRI analysis
First, to understand the functional relationships among the ROIs, pairwise correlations of each participant's seed time series were calculated and then averaged across the sample. On average, the BNST and BLA (r = 0.05) and the BNST and CeA (r = 0.06) were not highly correlated; however, the BLA and CeA were highly correlated (r = 0.31). The nature of this high correlation is to be expected given the spatial proximity of these nuclei; however, they should be taken into consideration with respect to the rest of the findings.
Given the high correlation between BLA and CeA time series across the sample, an analysis of covariance (ANCOVA) was modeled by using AFNIs 3dMVM with the seeds as repeated measures (Chen et al., 2014). For each seed ROI, correlations between average seed time series and the time series of every other voxel in the brain were assessed while controlling for effects of the other two seeds of interest. Given the disproportionate number of females in the sample, gender was also included in the model as a covariate.
To identify regions with overlapping FC among the ROIs, a conjunction analysis was performed by combining, using “AND” logic, the binarized statistical maps output from the ANCOVA for each combination of the seed ROIs (Gorka et al., 2018). Next, to identify distinct regions of FC among the ROIs, post hoc pairwise comparisons of the statistical maps for each combination of the seed ROIs were also assessed (Gorka et al., 2018). Estimated blur of the final EPI dataset was calculated in AFNI with 3dFWHMx, and average auto correlation function parameters were entered into 3dClustSim to determine thresholds to correct for multiple comparisons (voxel-wise p < 0.0005, and cluster thresholds p < 0.05, k > 216).
Finally, to examine anxiety correlations, STAI-T and IUS scores were also included in the ANCOVA as covariates and assessed with respect to each seed in post hoc tests. For consistency, results of this analysis were thresholded by using the same corrections as cited earlier (voxel-wise p < 0.0005, and cluster thresholds p < 0.05, k > 216).
Results
FC of ROIs
Bed nucleus of the stria terminalis
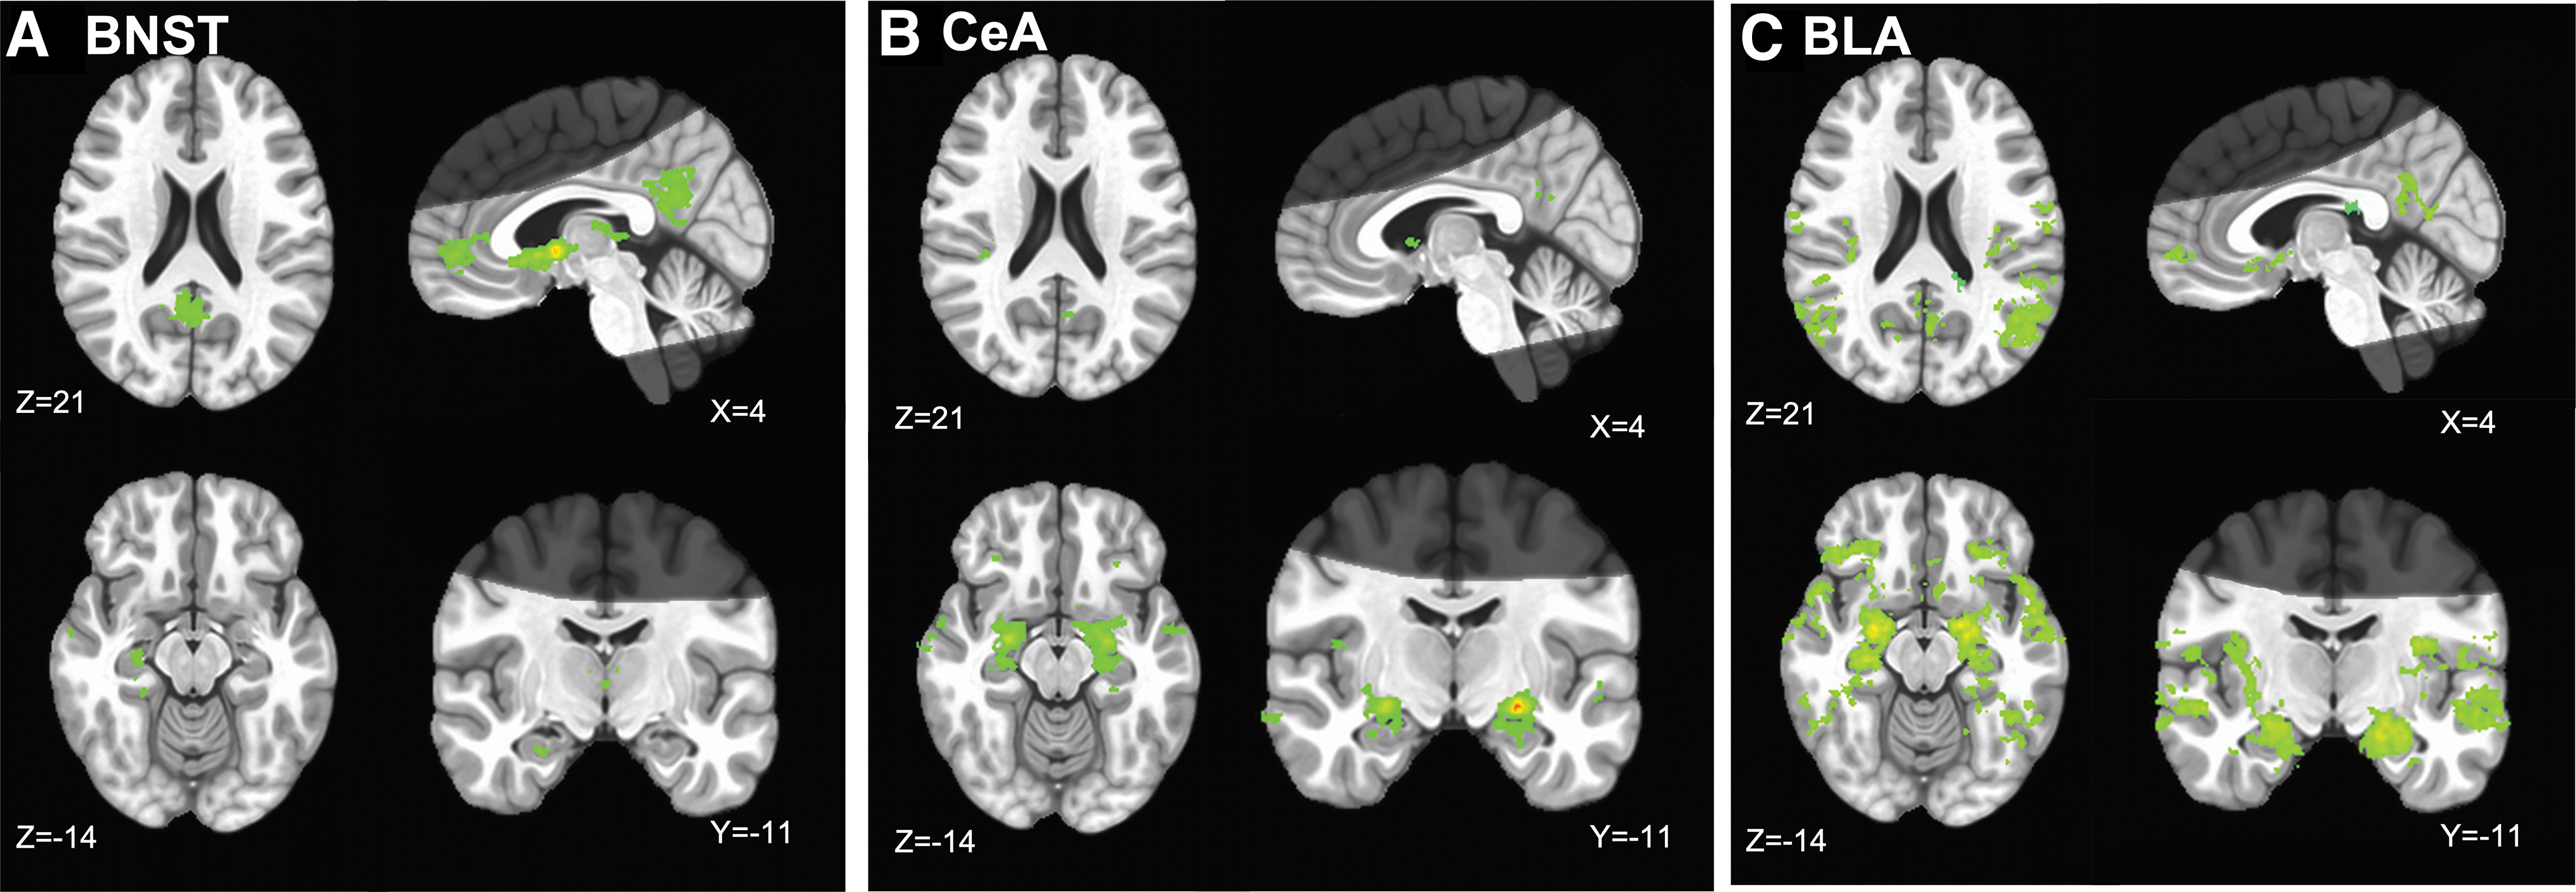
Results of the FC analysis with BNST as a seed indicated that the majority of connectivity was along midline structures, including the posterior cingulate cortex, cuneus, medial frontal cortex, subgenual and anterior cingulate cortex, thalamus, caudate head, parahippocampal gyrus, and middle temporal gyri (Fig. 3A). These results largely replicated prior BNST connectivity studies (Avery et al., 2014, 2016; Gorka et al., 2018; Torrisi et al., 2015). A complete list of significant clusters can be found in Supplementary Table S1.
Functional connectivity of
Central amygdala
Results of the FC analysis with the CeA as a seed indicated more widespread connectivity than the BNST. Clusters of connectivity were spread through the whole amygdala and most of the hippocampal cortices. In addition, there was connectivity throughout the temporal and occipital gyri, insular, cingulate, medial frontal cortices, and cuneus (Fig. 3B and Supplementary Table S2). These results replicated previous work (Gorka et al., 2018).
Basolateral amygdala
Results of the FC analysis with the BLA as a seed indicated more widespread connectivity than the BNST and CeA. Clusters of connectivity were spread through the whole amygdala and most of the hippocampal cortices. In addition, there was connectivity throughout the temporal poles, insular, cingulate, and medial frontal cortices, as well as posterior temporal and occipital gyri, and bilateral claustrum (Fig. 3C and Supplementary Table S3).
Conjunction analyses
CeA and BNST
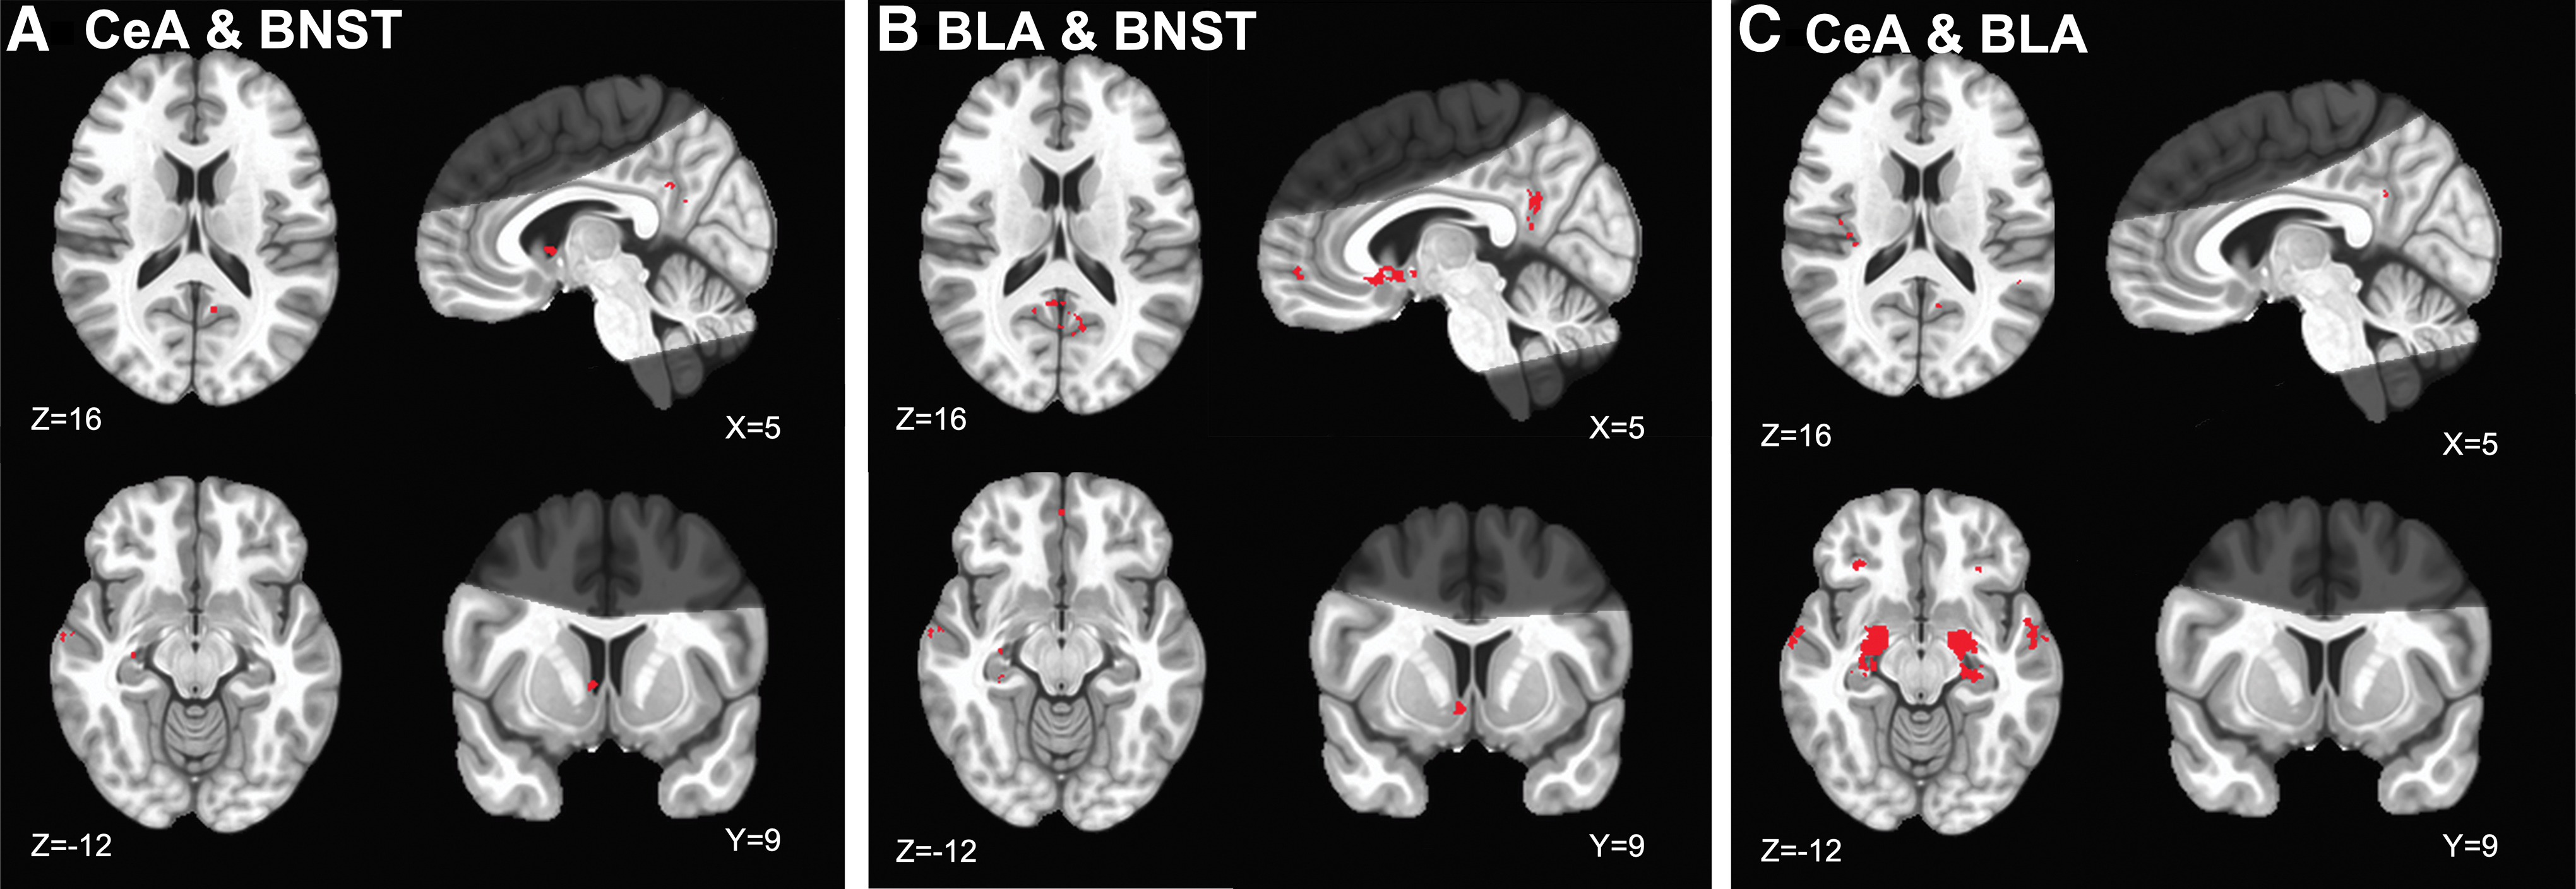
Results of the conjunction analysis showed shared connectivity of the CeA and BNST in several cortical and subcortical regions. Of note, the two regions shared FC along midline structures, including the posterior cingulate cortex, anterior cingulate, right parahippocampal gyrus, right caudate, and middle temporal gyri (Fig. 4A and Supplementary Table S4). These results somewhat replicate the findings of Gorka and colleagues (2018).
Functional connectivity conjunction maps of
BLA and BNST
Results of the conjunction analysis showed shared connectivity of the BLA and BNST in several cortical and subcortical regions. The two regions shared FC with the bilateral posterior cingulate cortex, left medial frontal gyrus, right parahippocampal gyrus, bilateral anterior cingulate, and left caudate (Fig. 4B and Supplementary Table S5).
CeA and BLA
Results of the conjunction analysis demonstrated that the CeA and BLA shared more widespread connectivity throughout the brain, relative to either region's shared connectivity with the BNST. Specifically, the two amygdala nuclei shared FC in the frontal lobe in inferior frontal gyri, and right claustrum. In the temporal lobe, the two nuclei shared connectivity with the bilateral superior, middle, and inferior temporal gyri. There was overlapping connectivity in the parietal lobe with the insula, and uncus. Finally, subcortical structures that showed shared connectivity included bilateral parahippocampal gyri and lentiform nuclei (Fig. 4C and Supplementary Table S6).
FC differences between seed ROI
CeA versus BNST
Compared with the CeA, the BNST was more strongly coupled with the bilateral caudate and inferior frontal gyri. Compared with the BNST, the CeA was more strongly coupled with bilateral parahippocampal gyri. Table 1 lists coordinates and statistics for peak voxels in surviving clusters. See Figure 5A for results. These results are consistent with the findings of Gorka and colleagues (2018).
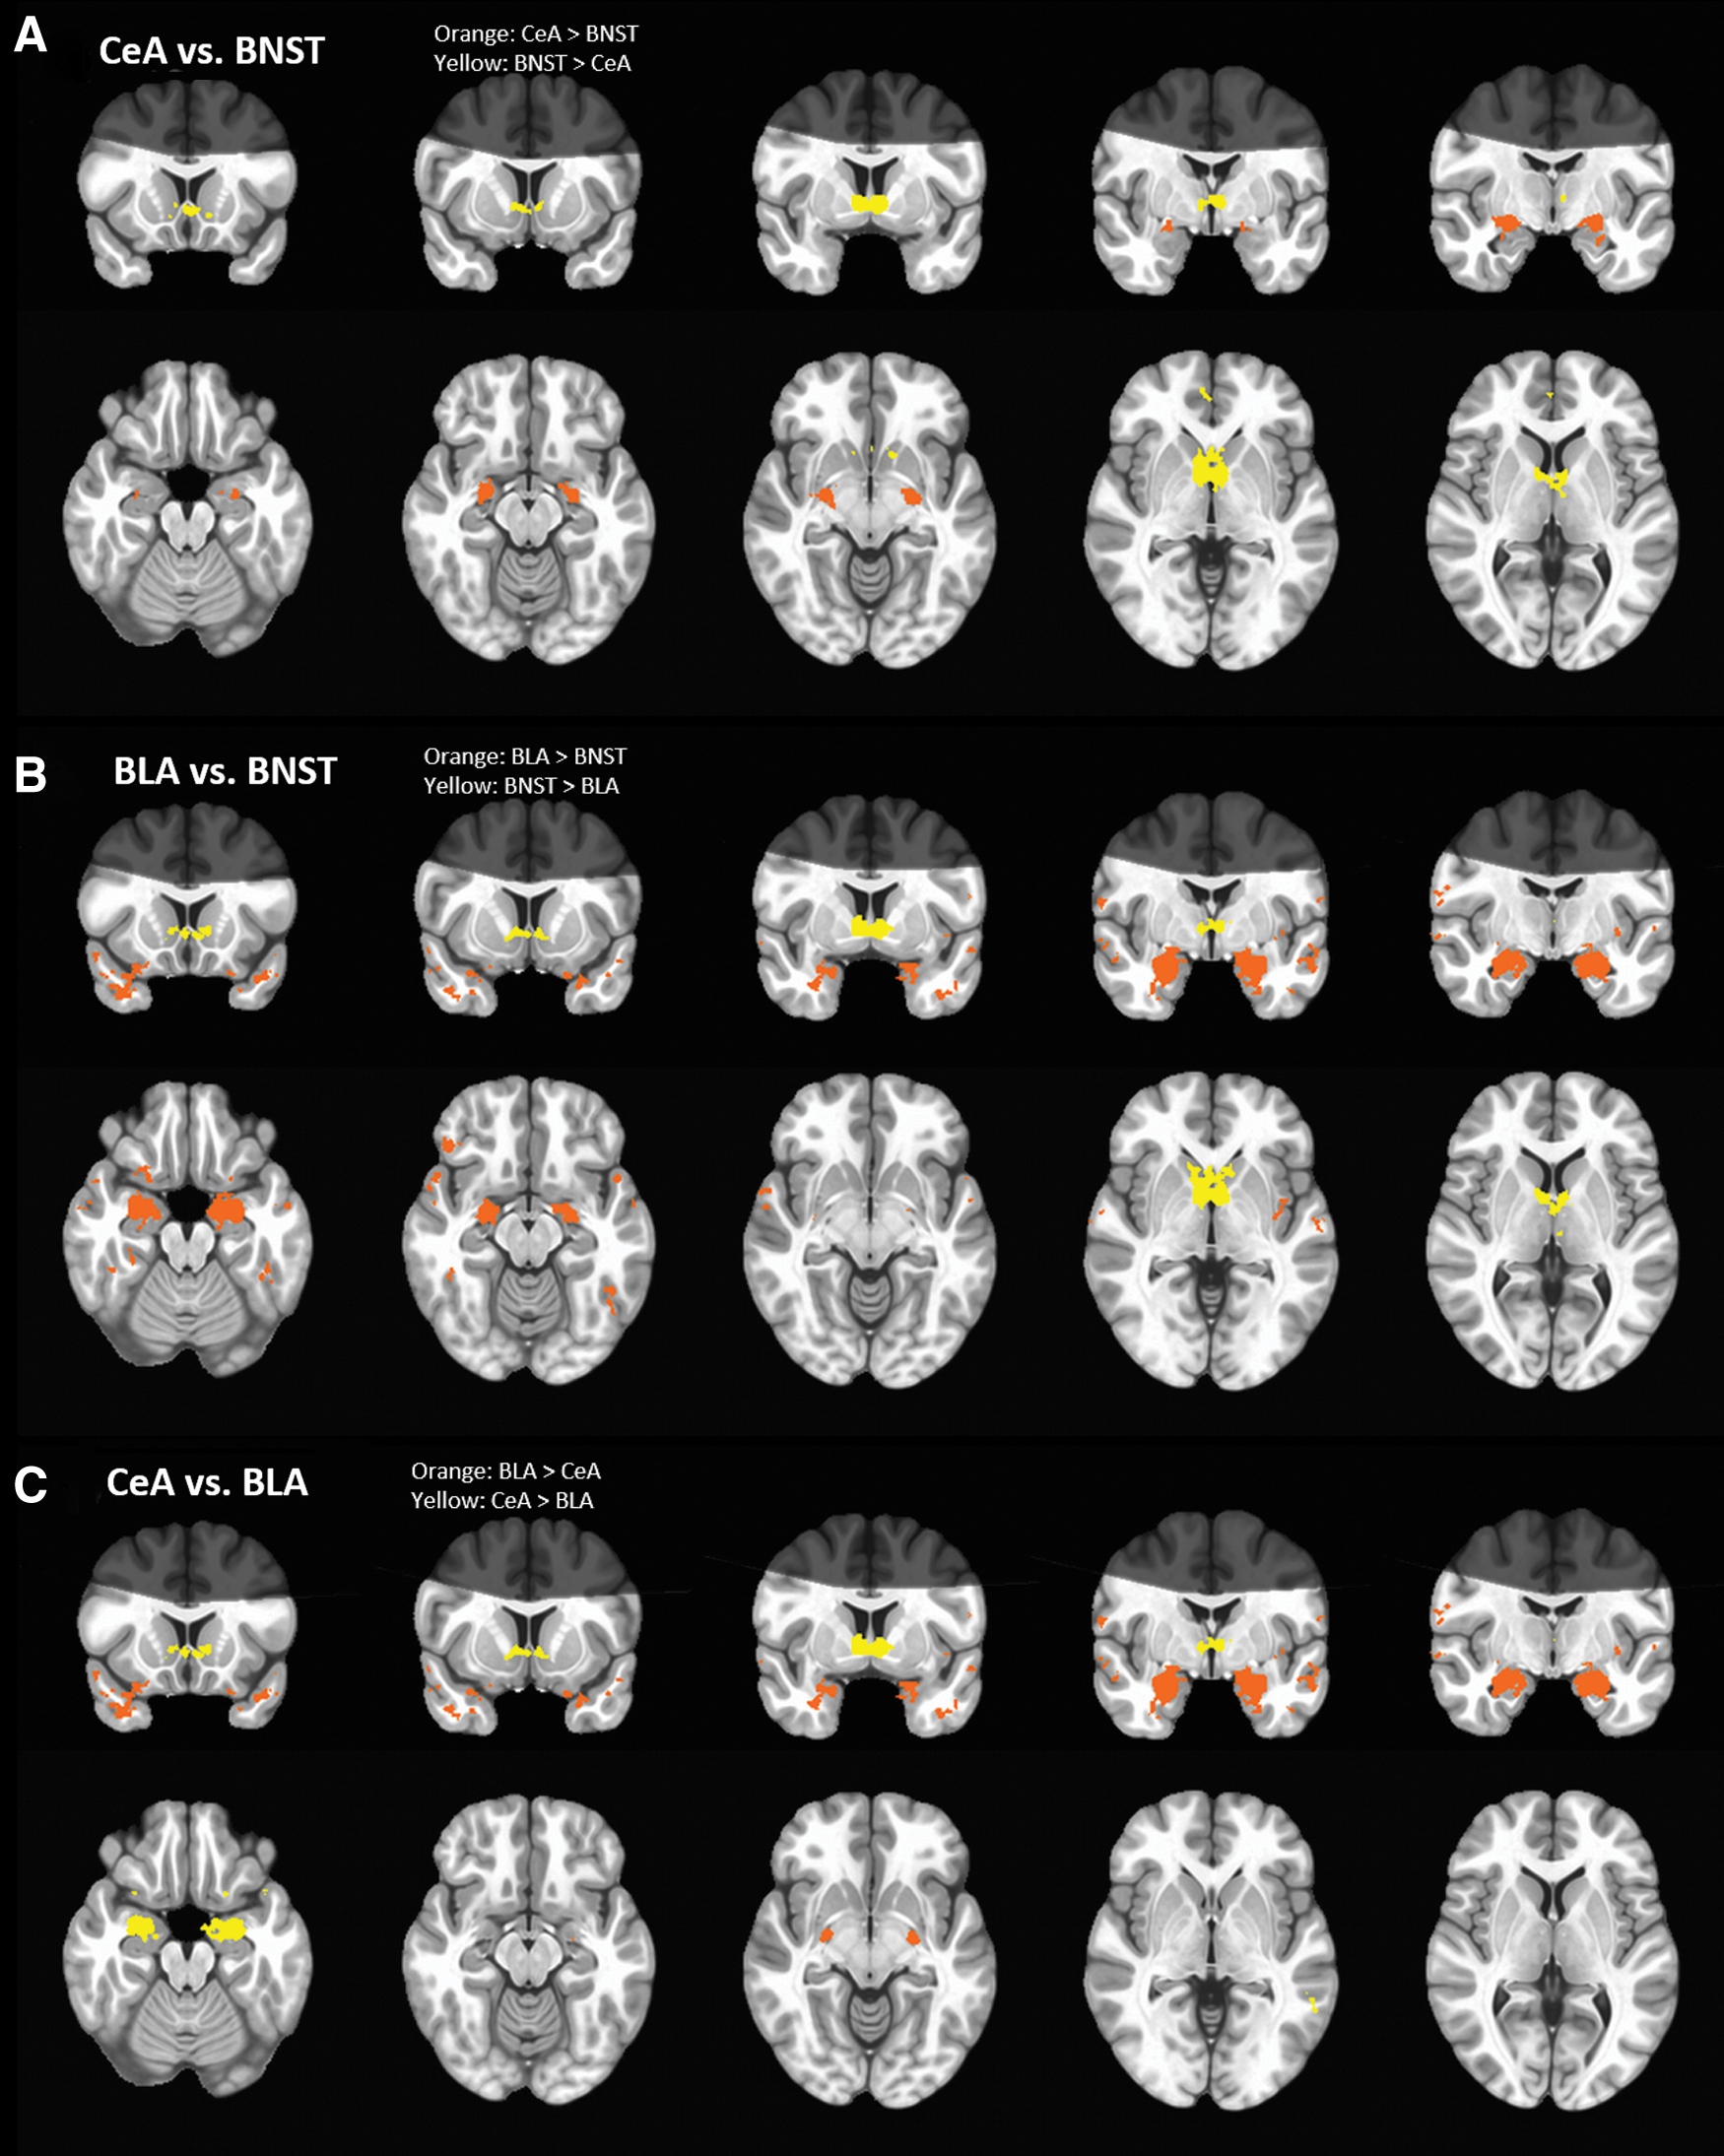
Maps of
Coordinates of Peak Voxels for Bed Nucleus of the Stria Terminalis Versus Central Amygdala Functional Connectivity
BNST, bed nucleus of the stria terminalis; CeA, central amygdala.
BLA versus BNST
Similar to comparisons with the CeA, compared with the BLA the BNST was more strongly coupled with the bilateral anterior cingulate and thalamus. Compared with the BNST, the BLA was more strongly coupled with parahippocampal, temporal gyri, and fusiform gyri. Table 2 lists coordinates and statistics for peak voxels in surviving clusters. See Figure 5B for results.
Coordinates of Peak Voxels for Bed Nucleus of the Stria Terminalis Versus Basolateral Amygdala Functional Connectivity
BLA, basolateral amygdala.
CeA versus BLA
Compared with the BLA, the CeA was more strongly coupled with regions of the parahippocampal gyrus, bilateral superior temporal gyri, left middle temporal gyri, and left inferior frontal gyri. Compared with the CeA, the BLA was more strongly coupled with the left amygdala, bilateral middle and superior temporal gyri, and the left inferior frontal gyrus. Table 3 lists coordinates and statistics for peak voxels in surviving clusters. See Figure 5C for results.
Coordinates of Peak Voxels for Central Amygdala Versus BLA Functional Connectivity
FC and trait anxiety
Lower trait anxiety was related to greater FC of the CeA and left middle frontal gyrus (−51, 36.8, −1.5; t = −4.89, 256 voxels; Fig. 6). No other correlations with STAI-T survive voxel-wise and cluster thresholding in relation to the FC of the BNST or BLA.

STAI correlations with CeA connectivity. Cool colors indicate regions where greater CeA and left middle frontal gyrus (−51, 36.8, −1.5; t = −4.89, 256 voxels) connectivity was related to lower STAI scores. All images overlaid on standard MNI template at voxel-wise threshold p < 0.005 (k > 216, p < 0.05, left = right). STAI, State-Trait Anxiety Inventory. Color images are available online.
FC and intolerance of uncertainty
No correlations with IUS survive voxel-wise and cluster thresholding in relation to FC of any of the seed regions.
Discussion
The extended amygdala is important for the detection, evaluation, and response to potential threat in the environment (Fox and Shackman, 2017; Grupe and Nitschke, 2013; Tillman et al., 2018). Dysfunction of this region has been well documented in affective neuroscience and in anxiety disorders (Sarkheil et al., 2018; Sladky et al., 2018; Sprooten et al., 2017). However, animal models of anxiety have shown differential roles and connectivity within subcomponents of the extended amygdala, and these differences have not been as well characterized in humans (Fox et al., 2015; Gungor and Pare, 2016; Jennings et al., 2013; Kalin et al., 2005; Oler et al., 2012; Stamatakis et al., 2014). Overall, the findings of this study replicate much of the extant literature in both humans and animals demonstrating the functional connections of the extended amygdala. Importantly, our findings noted some key differences in the unique and shared connectivity of amygdala subdivisions, as well as their associations with anxiety-related constructs. These findings, discussed in detail next, contribute to work aiming at disentangling the differential roles of these circuits in anxiety-relevant processes.
Basic connectivity of the extended amygdala
Bed nucleus of the stria terminalis
The FC of the BNST reported here replicates the findings of several other resting-state fMRI studies that show connectivity with prefrontal and paracingulate cortices, thalamus, and basal ganglia structures primarily including the caudate (Avery et al., 2014, 2016; Gorka et al., 2018; Lebow and Chen, 2016; Sprooten et al., 2017; Stamatakis et al., 2014; Torrisi et al., 2015). The cingulate cortices, thalamus, and caudate all play an important role in the processing of emotional information and the appraisal of threat (Kalin et al., 2005; Szekely et al., 2017). This connectivity of emotion regulation circuitry is believed to allow the BNST to accumulate incoming information and assign valence for the organism to respond accordingly (Lebow and Chen, 2016). The BNST, in particular, is also believed to be critical in monitoring temporal uncertainty even when it is certain that a given event will occur (Goode and Maren, 2017). This theory would lend itself to the observation of sustained activity of the BNST when presented with threat, supporting its involvement in anxiety-like states as opposed to fear states (Alvarez et al., 2011; Lebow and Chen, 2016; McMenamin et al., 2014; Sladky et al., 2018).
Central amygdala
The FC of the CeA reported here largely replicates previous work (Gorka et al., 2018; Oler et al., 2012; Roy et al., 2009). The CeA was functionally connected to the rest of the amygdala, hippocampus, and throughout the cortex, including frontal, cingulate, insular, and temporal cortices. This extensive connectivity of the CeA is largely with key structures in the emotion-processing network (Engman et al., 2016; Gorka et al., 2018; Torrisi et al., 2018). This widespread connectivity is believed to result in the convergence of sensory information in the CeA, allowing the organism to evaluate and respond to stimuli in the environment (Engman et al., 2016; Janak and Tye, 2015; LeDoux, 2007).
Basolateral amygdala
The FC of the BLA reported here closely resembles the anatomical connectivity reported in animal studies, including connectivity to hippocampal, medial frontal, posterior cingulate, insular, and temporal cortices (Stamatakis et al., 2014; Wassum and Izquierdo, 2015; Yang and Wang, 2017). Notably, BLA connectivity with orbitofrontal and prefrontal cortices, as well as the insula, are well conserved across species and, here, are also demonstrated to be functionally connected in humans (Stamatakis et al., 2014). Both of these circuits have been reported to be important in acquiring Pavlovian associations, as well as in appetitive conditioning (Stamatakis et al., 2014; Wassum and Izquierdo, 2015). The BLA is believed to encode outcome-specific reward information in salient environments, and it continuously updates outcome values whether positive or negative (Fiuzat et al., 2017; Janak and Tye, 2015; LeDoux, 2007; Stamatakis et al., 2014; Wassum and Izquierdo, 2015).
Overlap and differentiation of FC of the extended amygdala
Results of this study largely replicate previous work showing distinct yet overlapping connectivity of the BNST and amygdala nuclei (Bienkowski and Rinaman, 2013; Brinkmann et al., 2018; Gorka et al., 2018; Hrybouski et al., 2016; Klumpers et al., 2017; Oler et al., 2012; Stamatakis et al., 2014; Torrisi et al., 2015). Generally, the nuclei of the extended amygdala share significant connectivity, as demonstrated in the conjunction analysis, to hippocampal, cingulate, and frontal cortices, and subgenual cortex/nucleus accumbens. This shared connectivity is indicative of how integrated and coordinated this network is (Bienkowski and Rinaman, 2013; Davis et al., 2010; Gorka et al., 2018; Jalbrzikowski et al., 2017; Oler et al., 2012).
The robust shared connectivity of the extended amygdala with the hippocampus and associated cortices in this study is supported by previous work that has shown extensive connections of these nuclei with the hippocampal formation (Gorka et al., 2018; Yang and Wang, 2017). The hippocampus is important for encoding context in contextual fear conditioning paradigms, and neuronal projections from the hippocampus to the amygdala are believed to modulate amygdala activity in the expression of fear (Davis et al., 2010; Maren et al., 2013; Padilla-Coreano et al., 2016). Dense connections between these regions have also been shown to be important in the retrieval of fear memories (Maren et al., 2013; Padilla-Coreano et al., 2016).
Extended amygdala nuclei also shared connectivity with frontal, cingulate, and subgenual cortices. These findings are also consistent with previous work that has shown how frontal cortices can modulate fear responses coordinated by the extended amygdala (Alvarez et al., 2011; Felix-Ortiz et al., 2016; Fox et al., 2015; Jalbrzikowski et al., 2017). These top-down signals from frontal cortices reduce anxiety symptoms and are believed to signal safety, rather than threat, in the environment (Alvarez et al., 2011; Felix-Ortiz et al., 2016; Fox et al., 2015; Greenberg et al., 2013; Likhtik et al., 2014). Therefore, the robust connectivity of extended amygdala nuclei demonstrated in this study is consistent with previous work that has shown clear connectivity throughout medial temporal lobe and frontal cortices that serve the same threat processing network.
Contrary to previous research, this study did not find overlapping connectivity of extended amygdala nuclei with midbrain structures such as the periaqueductal grey (PAG), which may, in part, be due to the constraints of the field of view in our partial acquisition (Gorka et al., 2018; Tillman et al., 2018; Torrisi et al., 2015).
Although there were many regions that exhibited shared FC, there were also many notable differences in the FC of extended amygdala nuclei. We found more widespread connectivity with the amygdala than the BNST. This result is consistent with animal tracer studies that found that the amygdala was connected to broader high-level cortical and sensory systems whereas the BNST was more connected to striatal regions that are important for motor control (Bienkowski and Rinaman, 2013; Brinkmann et al., 2018; Engman et al., 2016; Hortensius et al., 2016; Tillman et al., 2018; Torrisi et al., 2018), which the current study demonstrated with connectivity of the BNST and caudate. Widespread afferent projections from higher level cortical and sensory systems converging in the CeA are believed to aid in the response generation to environmental threat (Bienkowski and Rinaman, 2013; Hortensius et al., 2016; Jalbrzikowski et al., 2017; Sladky et al., 2018). This consolidated information is then passed onto the BNST in a top-down manner (Bienkowski and Rinaman, 2013; Brinkmann et al., 2018; Sladky et al., 2018). Klumpers and colleagues (2017) note this distinction in function between the BNST and amygdala such that the BNST was most active when anticipating a shock compared with the amygdala, which was most active in response to a shock presentation. As demonstrated here and in previous work, the differential connectivity between the BNST and amygdala may underlie the behavioral and functional distinctions between these structures (Buff et al., 2017; Klumpers et al., 2017).
Previous research has hypothesized that compared with the amygdala the BNST should be more functionally connected to the hippocampus (Gorka et al., 2018); however, the results of this study do not support this hypothesis. One possible explanation for this lack of finding is that the situationally driven differential response between the amygdala and BNST may not be apparent under resting-state conditions.
Another notable difference in connectivity is that the BLA is more functionally connected to the insula than the CeA, relative to the BNST. The insula has been implicated in sensorimotor, social-emotional processing, and attention and salience processing (Roy et al., 2009; Uddin et al., 2017). Although these functions serve many purposes, the evidence of the insula's role in these processes, along with its connectivity to the BLA, may support the role that the BLA plays in tracking stimulus outcome associations (Fiuzat et al., 2017; Fox et al., 2015; Janak and Tye, 2015; LeDoux, 2007; Stamatakis et al., 2014; Wassum and Izquierdo, 2015). In contrast, connectivity of the CeA and insula may be less robust, as the CeA is believed to receive the already integrated sensory information from the BLA and to subsequently generate a response using downstream targets such as basal ganglia and frontal cortices (Calhoon and Tye, 2015; Davis et al., 2010; Grupe and Nitschke, 2013).
Correlations with anxiety
Although it is important to characterize the FC of key components of anxiety-related networks, the ultimate goal is to understand where dysfunction in this network leads to symptoms so that clinicians can provide more informed treatments to those with anxiety disorders. This study thus aimed at correlating FC of the extended amygdala with two self-report measures of traits that are associated with heightened risk for clinical anxiety. However, the results do not indicate any clear association of extended amygdala nuclei in relation to trait anxiety or intolerance of uncertainty. The only result that survived correction was that lower trait anxiety was related to greater connectivity of the CeA and the left middle frontal gyrus. This result is consistent with previous work that has established the role of a frontolimbic pathway in emotion regulation (Ball et al., 2013; Fitzgerald et al., 2017; Makovac et al., 2016). In particular, the prefrontal cortex is believed to exert top-down control over the amygdala to regulate emotional responses and anxiety (Ball et al., 2013; Dong et al., 2019; Etkin et al., 2009; Fitzgerald et al., 2017; Goossen et al., 2019; Makovac et al., 2016; Urry et al., 2006). Despite this finding being consistent with previous work, the lack of other correlations with anxiety measures is rather surprising in comparison to previous work using resting-state fMRI methods in anxious samples (Etkin et al., 2009; Goossen et al., 2019). Possible explanations for the discrepancies in findings are discussed next.
Limitations
This study is not without limitation. First, this study had only partial coverage of the brain for the EPI acquisition. Although this allowed us to optimize the signal and resolution from the regions of greatest interest to this study, we were unable to examine connectivity of the BNST or amygdala with superior frontal, parietal, and occipital cortices. We also chose to smooth our functional data to enhance signal-to-noise ratio; however, given the small size of the ROIs and their close spatial proximity, this may have impacted our results. In addition, these results demonstrate FC at rest and not during a task that provokes activity of relevant networks. Therefore, connectivity discussed here and in previous work should be re-examined under task-based experimental designs that more directly target anxiety circuitry.
The results of FC with anxiety measures should be carefully considered. The current sample was a nonclinical one, and although there was sufficient variability in STAI and IUS scores, the average level of anxiety was below clinical thresholds. In addition, participants were not excluded for medications including antidepressants or anxiolytics that have known mechanisms of action within the extended amygdala nuclei. These data were also not recorded as part of this study, so it is possible that results were influenced by medication use. The sample was also predominantly female, and findings may not generalize as well to males. Finally, the findings reported may be a result of Type 1 error due to the multiple comparisons made between the three ROIs (CeA, BLA, and BNST) and two self-report measures (STAI and IUS).
Conclusions
Using high-resolution fMRI, this study highlights the nuances of resting-state FC of the BNST, BLA, and CeA, all key structures of the extended amygdala. Our findings build on previous work by directly comparing connectivity of all three structures. The results described here largely replicate nonhuman animal and human studies investigating these structures, although it is clear that there remain discrepancies in the literature (e.g., extended amygdala connectivity with PAG and midbrain structures) that still need to be addressed. Optimization of fMRI acquisition and implementation of task-based work will help clarify the inconsistencies reported in the field. Future high-resolution work should utilize the whole-brain field of view in the fMRI acquisition to ensure a comprehensive analysis of extended amygdala connectivity. Defining and clarifying the nuances of FC within the threat-processing network will aid in an understanding of the processes that underlie anxiety symptoms and disorders.
Footnotes
Author Disclosure Statement
No competing financial interests exist.
Funding Information
The current work was supported by the Daniel M. Soref Charitable Trust through the Center for Imaging Research at the Medical College of Wisconsin.
Supplementary Material
Supplementary Table S1
Supplementary Table S2
Supplementary Table S3
Supplementary Table S4
Supplementary Table S5
Supplementary Table S6
References
Supplementary Material
Please find the following supplemental material available below.
For Open Access articles published under a Creative Commons License, all supplemental material carries the same license as the article it is associated with.
For non-Open Access articles published, all supplemental material carries a non-exclusive license, and permission requests for re-use of supplemental material or any part of supplemental material shall be sent directly to the copyright owner as specified in the copyright notice associated with the article.