
Abstract

In the October 2019 issue of Brain Connectivity (vol. 9 no. 8; 627–637), the article titled High-Resolution Resting-State Functional Connectivity of the Extended Amygdala, by Weis et al. requires correction.
In the original article, the sign of the X and Y coordinates were incorrectly reported in Tables 1-3, in Supplemental Tables 1-6, and in the labels for Figures 2, 3, 4 and 6. The labels of the brain regions reported in these tables are correct and the values of the coordinates are correct, however the sign (positive or negative) for the X and Y planes were flipped. This error in no way changes the results or anything about the content of the paper.
Table 1 originally appeared as:
Coordinates of Peak Voxels for Bed Nucleus of the Stria Terminalis Versus Central Amygdala Functional Connectivity
BNST, bed nucleus of the stria terminalis; CeA, central amygdala.
Table 1 has now been updated to correctly reflect the presentation of data (see values in bold):
Coordinates of Peak Voxels for Bed Nucleus of the Stria Terminalis Versus Central Amygdala Functional Connectivity
BNST, bed nucleus of the stria terminalis; CeA, central amygdala.
Table 2 originally appeared as:
Coordinates of Peak Voxels for Bed Nucleus of the Stria Terminalis Versus Basolateral Amygdala Functional Connectivity
BLA, basolateral amygdala.
Table 2 has now been updated to correctly reflect the presentation of data (see values in bold):
Coordinates of Peak Voxels for Bed Nucleus of the Stria Terminalis Versus Basolateral Amygdala Functional Connectivity
BLA, basolateral amygdala.
Table 3 originally appeared as:
Coordinates of Peak Voxels for Central Amygdala Versus BLA Functional Connectivity
Table 3 has now been updated to correctly reflect the presentation of data (see values in bold):
Coordinates of Peak Voxels for Central Amygdala Versus BLA Functional Connectivity
Figure 2 label originally appeared as:

BNST mask from Theiss and colleagues (2017). CeA and BLA masks from Tyszka and Pauli (2016), respectively. All masks overlaid on standard MNI template (MNI152), left = right. BLA, basolateral amygdala; BNST, bed nucleus of the stria terminalis; CeA, central amygdala. Color images are available online.
and has now been updated to correctly reflect the presentation of data:

BNST mask from Theiss and colleagues (2017). CeA and BLA masks from Tyszka and Pauli (2016), respectively. All masks overlaid on standard MNI template (MNI152), left = right. BLA, basolateral amygdala; BNST, bed nucleus of the stria terminalis; CeA, central amygdala. Color images are available online.
Figure 3 label originally appeared as:

Functional connectivity of
and has now been updated to correctly reflect the presentation of data:

Functional connectivity of
Figure 4 label originally appeared as:

Functional connectivity conjunction maps of
and has now been updated to correctly reflect the presentation of data:

Functional connectivity conjunction maps of
Figure 6 label originally appeared as:
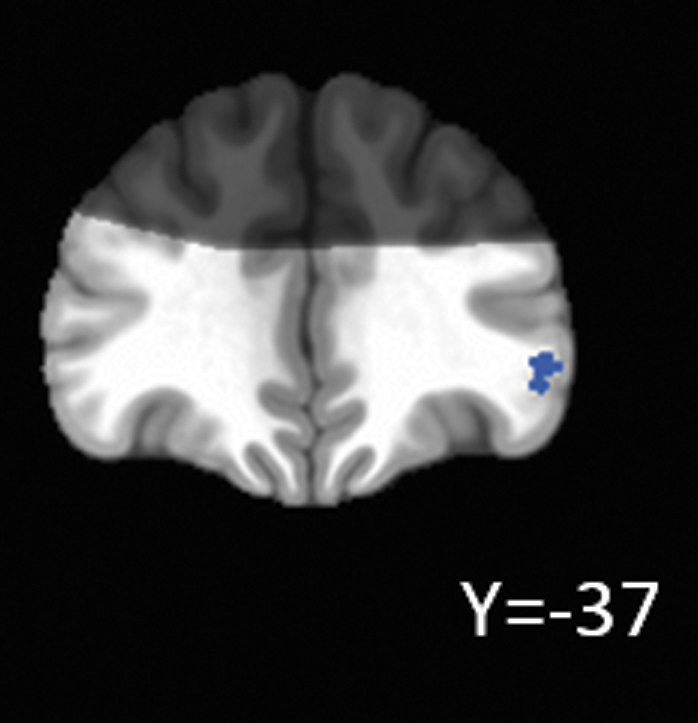
STAI correlations with CeA connectivity. Cool colors indicate regions where greater CeA and left middle frontal gyrus (51, −36.8, −1.5; t = −4.89, 256 voxels) connectivity was related to lower STAI scores. All images overlaid on standard MNI template at voxel-wise threshold p < 0.005 (k > 216, p < 0.05, left = right). STAI, State-Trait Anxiety Inventory. Color images are available online.
and has now been updated to correctly reflect the presentation of data:

STAI correlations with CeA connectivity. Cool colors indicate regions where greater CeA and left middle frontal gyrus (−51, 36.8, −1.5; t = −4.89, 256 voxels) connectivity was related to lower STAI scores. All images overlaid on standard MNI template at voxel-wise threshold p < 0.005 (k > 216, p < 0.05, left = right). STAI, State-Trait Anxiety Inventory. Color images are available online.
Supplementary Table 1 originally appeared as:
Coordinates of Peak Voxels for Bed Nucleus of the Stria Terminalis Functional Connectivity
Supplementary Table 1 has now been updated to correctly reflect the presentation of data (see values in bold):
Coordinates of Peak Voxels for Bed Nucleus of the Stria Terminalis Functional Connectivity
Supplementary Table 2 originally appeared as:
Coordinates of Peak Voxels for Central Amygdala Functional Connectivity
Supplementary Table 2 has now been updated to correctly reflect the presentation of data (see values in bold):
Coordinates of Peak Voxels for Central Amygdala Functional Connectivity
Supplementary Table 3 originally appeared as:
Coordinates of Peak Voxels for Basolateral Amygdala Functional Connectivity
Supplementary Table 3 has now been updated to correctly reflect the presentation of data (see values in bold):
Coordinates of Peak Voxels for Basolateral Amygdala Functional Connectivity
Supplementary Table 4 originally appeared as:
Coordinates of Peak Voxels for Central Amygdala and Bed Nucleus of the Stria Terminalis Conjunction Analysis
Supplementary Table 4 has now been updated to correctly reflect the presentation of data (see values in bold):
Coordinates of Peak Voxels for Central Amygdala and Bed Nucleus of the Stria Terminalis Conjunction Analysis
Supplementary Table 5 originally appeared as:
Coordinates of Peak Voxels for Basolateral Amygdala and Bed Nucleus of the Stria Terminalis Conjunction Analysis
Supplementary Table 5 has now been updated to correctly reflect the presentation of data (see values in bold):
Coordinates of Peak Voxels for Basolateral Amygdala and Bed Nucleus of the Stria Terminalis Conjunction Analysis
Supplementary Table 6 originally appeared as:
Coordinates of Peak Voxels for Central Amygdala and Basolateral Amygdala Conjunction Analysis
Supplementary Table 6 has now been updated to correctly reflect the presentation of data (see values in bold):
Coordinates of Peak Voxels for Central Amygdala and Basolateral Amygdala Conjunction Analysis
The online version has been corrected to reflect these changes. The authors apologize for the error.