
Abstract
Autism spectrum disorders (ASDs) have been linked to atypical communication among distributed brain networks. However, despite decades of research, the exact nature of these differences between typically developing (TD) individuals and those with ASDs remains unclear. ASDs have been widely studied using resting-state neuroimaging methods, including both functional magnetic resonance imaging (fMRI) and electroencephalography (EEG). However, little is known about how fMRI and EEG measures of spontaneous brain activity are related in ASDs. In the present study, two cohorts of children and adolescents underwent resting-state EEG (n = 38 per group) or fMRI (n = 66 ASD, 57 TD), with a subset of individuals in both the EEG and fMRI cohorts (n = 17 per group). In the EEG cohort, parieto-occipital EEG alpha power was found to be reduced in ASDs. In the fMRI cohort, blood oxygen level-dependent (BOLD) power was regionally increased in right temporal regions and there was widespread overconnectivity between the thalamus and cortical regions in the ASD group relative to the TD group. Finally, multimodal analyses indicated that while TD children showed consistently positive relationships between EEG alpha power and regional BOLD power, these associations were weak or negative in ASDs. These findings suggest atypical links between alpha rhythms and regional BOLD activity in ASDs, possibly implicating neural substrates and processes that coordinate thalamocortical regulation of the alpha rhythm.
Introduction
Autism spectrum disorders (ASDs) are neurodevelopmental disorders defined behaviorally by social communication deficits and the presence of restricted/repetitive patterns of behavior or interest (American Psychiatric Association, 2013). It is at present estimated that 1 in 59 eight-year olds in the United States is on the autism spectrum (Baio et al., 2018). However, the neurobiological basis of these disorders remains poorly understood. Research clarifying the nature of brain differences in ASDs may improve treatment and diagnostic strategies and is therefore a high priority.
Over the past several decades, interest in brain functioning in ASDs has grown rapidly. Studies using functional magnetic resonance imaging (fMRI) and electroencephalography (EEG) to examine neural activity in vivo comprise the majority of this literature. While fMRI research broadly supports atypical coordination (i.e., functional connectivity [FC]) across distributed brain networks in ASDs, there have been mixed and sometimes conflicting reports of underconnectivity and overconnectivity involving numerous regions and functional networks (Di Martino et al., 2014; Hull et al., 2016). However, findings of atypical thalamocortical circuitry have been relatively consistent, with multiple studies reporting overconnectivity between the thalamus and sensorimotor cortical regions (Cerliani et al., 2015; Nair et al., 2015; Woodward et al., 2017). These findings are further supported by evidence of structural thalamic differences in ASDs (Schuetze et al., 2016). Much like the fMRI literature, EEG studies have produced mixed results with respect to both power and coherence across a range of frequencies (O'Reilly et al., 2017; Wang et al., 2013). Despite these inconsistencies, one of the best replicated findings in ASDs is decreased power in the alpha frequency band (i.e., 8–12 Hz) at rest (Chan et al., 2007; Dawson et al., 1995; Keehn et al., 2017; Murias et al., 2007; Sheikhani et al., 2012; Tierney et al., 2012).
To date, there has been little progress relating findings across modalities in ASDs (Mash et al., 2018), and it is at present unknown how reports of reduced EEG alpha power and atypical thalamocortical activity may be associated. While EEG directly measures postsynaptic potentials (Niedermeyer et al., 2011; Heller and Volegov, 2014), fMRI detects the blood oxygen level-dependent (BOLD) signal, an indirect measure of neural activity influenced by vascular and metabolic factors (Hillman, 2014). Therefore, measures of magnitude (i.e., power) and synchronicity (i.e., FC) derived from different modalities may reflect neuronal communication in fundamentally different ways. Studies combining both modalities in the same individuals allow for joint analysis and direct comparison between EEG and fMRI results.
In typically developing (TD) adults, a large body of simultaneous EEG-fMRI work has consistently demonstrated that spontaneous EEG alpha power is positively associated with thalamic BOLD activity (Bridwell et al., 2013; de Munck et al., 2007; Goldman et al., 2002) and negatively related to cortical BOLD activity (Bridwell et al., 2013; Goldman et al., 2002; Laufs et al., 2003; Olbrich et al., 2009). The relationship between EEG alpha power and BOLD FC is less well established; however, there is some evidence that increased EEG alpha power is associated with reduced anticorrelation (i.e., less negative correlations) between the thalamic and cortical regions (Allen et al., 2018; Scheeringa et al., 2012). Multimodal imaging research in ASDs remains very limited. To our knowledge, only two small EEG-fMRI studies in ASDs have been published, both of which explored neural processing during auditory and language processing tasks using concurrent EEG-fMRI (Hames et al., 2016; Jochaut et al., 2015). While these efforts provide first glimpses of potential links between electrophysiological and hemodynamic measures during task performance in ASDs, they cannot speak to unimodal resting-state findings involving EEG alpha power and thalamocortical networks.
To our knowledge, there are at present no published resting-state EEG-fMRI studies of ASDs. However, established relationships between thalamocortical networks and EEG alpha power in typical development described above provide a compelling direction for future ASD research combining EEG and fMRI. Although there are advantages to simultaneous data acquisition, this procedure is often lengthy and uncomfortable. This is especially problematic for children with developmental disorders. Separately acquired EEG-fMRI data cannot speak to concurrent fluctuations in regional BOLD activity/coordination and EEG alpha power within individuals. However, these data may still provide important insight into multimodal relationships between individuals.
To investigate links between separately acquired EEG and fMRI, suitable summary measures for EEG alpha power, BOLD activity, and BOLD FC must be selected. EEG alpha power can be averaged over an acquisition period to yield a specific value for each participant. Calculating a single representative BOLD value over an entire scan period for an individual, on the contrary, is challenging as BOLD units are arbitrary and only relative BOLD activity changes can be interpreted meaningfully. Therefore, spontaneous BOLD activity (i.e., power) is best summarized by the amplitude of low-frequency fluctuations (ALFF) (Zang et al., 2007), a measure that captures power in BOLD frequencies typically around 0.01–0.1 Hz. ALFF is often reported together with fractional ALFF (fALFF), that is, the ratio between low-frequency power and total power of all frequencies (Zou et al., 2008); ALFF tends to have better test/retest reliability, whereas fALFF is considered more robust to non-neuronal artifact (Zuo et al., 2010). However, ALFF/fALFF has only played a minimal role in the ASD neuroimaging literature to date. A few relevant studies have reported varying findings, from broadly increased ALFF (Supekar et al., 2013) to regionally increased fALFF in right frontal and temporal regions (Di Martino et al., 2014) and decreased fALFF in occipital regions (Di Martino et al., 2014; Itahashi et al., 2015).
The primary aims of this study were to (1) clarify previous unimodal EEG and fMRI findings in ASDs described above and (2) establish interindividual relationships between EEG alpha power and thalamic activity, cortical activity, and thalamocortical FC in a sample of adolescents with and without ASDs.
Materials and Methods
Participants
Resting-state EEG was collected from 76 individuals (38 ASD, 38 TD), ages 7–18 years. Groups did not significantly differ with respect to age, handedness, sex, nonverbal IQ, or EEG length after preprocessing (Table 1). None of the TD participants was taking psychotropic medications or had any documented history of psychiatric or developmental disorders. In the ASD group, medication status was documented for 23 of 38 individuals. Of these, six reported taking psychotropic medications.
EEG Sample Characteristics
Values are presented as mean (SD), range.
ADOS, Autism Diagnostic Observation Schedule; ASD, autism spectrum disorder; EEG, electroencephalography; FSIQ, full-scale IQ; NVIQ, nonverbal IQ; RMSD, root mean-squared displacement; RRB, restricted/repetitive behavior; SC, social communication; SD, standard deviation; TD, typically developing; VIQ, verbal IQ.
fMRI data were separately acquired from 123 individuals (66 ASD, 57 TD), ages 6–18 years. ASD and TD groups did not significantly differ with respect to age, handedness, sex, nonverbal IQ, or root mean-squared displacement (RMSD; i.e., in-scanner head motion) (Table 2). As in the EEG sample, none of the TD participants was taking psychotropic medications or had any documented history of psychiatric or developmental disorders. In the ASD group, 23 individuals reported taking psychotropic medications, 37 were unmedicated, and medication status was undocumented for 6 individuals.
fMRI Sample Characteristics
Values are presented as mean (SD), range.
fMRI, functional magnetic resonance imaging.
A subset of participants underwent fMRI and EEG acquisition within 3 months of one another (22 ASD, 25 TD, ages 12–17 years; Table 3). Four individuals with ASDs and six TD individuals were excluded from multimodal analyses due to excessive fMRI artifacts. One individual with ASD was excluded due to an incidental finding on MRI. Two additional TD individuals were excluded from the multimodal sample to improve matching and to maintain equal sample sizes. The final EEG-fMRI sample consisted of 17 individuals per group with high-quality data in both modalities. Of these participants, 6 ASD participants were prescribed medications and the remaining 11 were unmedicated. All available medication and comorbidity data are summarized in Supplementary Table S1.
EEG-fMRI Imaging Sample Characteristics
Values are presented as mean (SD), range.
Across all samples, ASD diagnoses were confirmed based on the Autism Diagnostic Interview–Revised (ADI-R) (Lord et al., 1994), the Autism Diagnostic Observation Schedule-Generic (ADOS-G) (Lord et al., 2000), or Autism Diagnostic Observation Schedule, Second Edition (ADOS-2) (Gotham et al., 2007), and expert clinical judgment according to DSM-5 (Diagnostic and Statistical Manual of Mental Disorders, Fifth Edition) criteria. The Wechsler Abbreviated Scales of Intelligence (WASI) (Wechsler, 1999) or Wechsler Abbreviated Scales of Intelligence, Second Edition (WASI-II) (Wechsler, 2011) was administered to all participants. Informed assent and consent were obtained from all participants and caregivers in accordance with the University of California, San Diego, and San Diego State University Institutional Review Boards.
Electroencephalography
Acquisition
Continuous EEG was recorded using a Biosemi ActiveTwo system with 68 Ag/AgCl active electrodes. Sixty-four electrodes were mounted in an elastic cap according to locations in the modified International 10–20 system. Remaining electrodes were placed below the right eye, on the outer canthus of the left eye (to monitor blinks and saccades), and over the left and right mastoids (reference). EEG data were recorded at a sampling rate of 256 Hz, and direct current (DC) offsets were kept below 25 mV at all channels. Participants completed 6 min of eyes-open EEG, during which a black central fixation crosshair was presented on a gray background. Participants were instructed to relax, remain as still as possible, and look at the crosshair.
Data processing
Data were processed in EEGLAB (Delorme and Makeig, 2004), high-pass filtered at 1 Hz, and rereferenced to the grand average. Independent component analysis (ICA) was applied using the Fieldtrip toolbox (Oostenveld et al., 2011). Each participant's component activations were first visually inspected for motor artifact, and noisy segments were manually rejected. Component activations and their scalp maps were then examined to identify ocular artifacts, and artifact-contaminated components were removed (Jung et al., 2000a,b). Finally, noisy channels were excluded and replaced as missing values. After preprocessing, all participants had at least 2 min of remaining data for subsequent analyses (Tables 1 and 3). For each channel, a fast Fourier transform (EEGLab's spectopo) was applied to continuous (unepoched) data to determine the magnitude of power at frequencies ranging from 0.25 to 128 Hz, at 0.25 Hz increments. The spectral power values were converted from decibels to microvolts squared (μV2).
Alpha power analysis
Alpha power, expressed as μV2, was extracted from and averaged across parieto-occipital (Oz, POz, O1, O2, PO3, PO4) electrodes. There is strong evidence that peak alpha frequency varies substantially between individuals (Haegens et al., 2014), shifts throughout childhood and adolescence (Cragg et al., 2011; Miskovic et al., 2015), and may differ between ASDs and typical development (Dickinson et al., 2018; Edgar et al., 2015). Therefore, it has been recommended that alpha frequency windows be individually defined for each participant (Klimesch, 1999). For this study, the alpha peak was defined as the local maximum of the average parieto-occipital power spectrum between 7 and 13 Hz. Because the alpha rhythm is most prominent in posterior regions (Britton et al., 2016), only parieto-occipital electrodes were used to optimize signal-to-noise ratio and improve peak estimates. Parieto-occipital alpha power (referred to henceforth as “alpha power”) was then extracted from the 4-Hz window surrounding this midpoint (e.g., an alpha window of 7–11 Hz for a participant with an alpha peak at 9 Hz). For participants with no clear alpha peak (n = 7, all ASD), a standard window of 8–12 Hz was applied. Individual alpha peaks ranged from 7.5 to 12.5 Hz and did not differ significantly between groups (ASD mean [SD] = 9.76 [0.87] Hz, TD mean [SD] = 9.80 [0.73] Hz, p = 0.82).
Absolute and relative parieto-occipital alpha power were compared between groups using two-sample t-tests with degrees of freedom adjusted for unequal variances (using Satterthwaite's approximation). These group analyses were repeated on an unmedicated subsample of ASD participants and a matched TD group. To ensure that findings were not primarily due to differences in individual alpha windows, a standard alpha window of 8–12 Hz was compared with our method described above for calculating alpha windows. Absolute parieto-occipital alpha power calculated using a standard alpha window was highly correlated with the individualized window method (r = 0.99, p < 0.00001; Supplementary Fig. S1).
Functional magnetic resonance imaging
Acquisition
Imaging data were acquired on a GE 3T MR750 scanner with an 8-channel head coil at the Center for Functional MRI (University of California, San Diego). High-resolution structural images were acquired with a standard FSPGR T1-weighted sequence (TR: 8.108 ms, TE: 3.172 ms, flip angle: 8°; FOV 256 mm; 1 mm3 resolution; 172 slices). Functional T2*-weighted images were acquired using a single-shot, gradient-recalled, echo-planar imaging pulse sequence (TR: 2000 ms; TE: 30 ms; flip angle: 90°; 3.4 mm isotropic resolution; FOV: 220 mm; matrix: 64 × 64; 42 axial slices). One 6-min 10-sec resting-state scan was obtained consisting of 185 whole-brain volumes. The first five volumes were discarded to account for T1-equilibration effects. Subjects were instructed to fixate on a cross projected onto the middle of a screen, viewed through a mirror in the bore, and to “Let your mind wander, relax, but please stay as still as you can–do not fall asleep.” Compliance with instructions to remain still and awake was monitored via video recording.
Data processing
Functional images were processed using Analysis of Functional NeuroImages software (AFNI v17.2.07) (Cox, 1996), FMRIB Software Library (FSL; v5.0) (Smith et al., 2004), and FreeSurfer (Dale et al., 1999; Fischl, 2012; Fischl et al., 1999). Images were slice-time corrected and each functional volume was registered to the middle time point of the scan to adjust for motion via rigid-body realignment as implemented in AFNI. Field map correction was applied to minimize distortions due to magnetic field inhomogeneity. The functional images were registered to the anatomical scan via FSLs FLIRT (Jenkinson and Smith, 2001). Anatomical and functional images were resampled to 3 mm isotropic voxels and standardized to the atlas space of the Montreal Neurological Institute (MNI) template using FSLs nonlinear registration tool (FNIRT). AFNIs 3dBlurToFWHM was used to smooth functional images to a Gaussian full-width at half-maximum (FWHM) of 6 mm. fMRI time series were highpass filtered at 0.008 Hz using a second-order Butterworth filter, which was also applied to the 10 nuisance regressors (see further in this section).
Given the known impact of motion on BOLD correlations (Power et al., 2014), additional measures were taken to correct for motion. The mean signal from ventricles and white matter masks (obtained from FreeSurfer segmentation of T1-weighted structural image and eroded by one voxel) as well as six motion parameters (obtained from rigid-body realignment) and their first temporal derivatives were regressed from the signal. Residuals from nuisance regression were used for all subsequent FC analyses. RMSD, an estimate of head motion across all time points, was calculated for each participant. Framewise displacement (FD) was calculated as a volume-by-volume measure of motion. Time points with >0.5 mm FD as well the two subsequent time points were censored. Time series fragments with <10 consecutive time points remaining after censoring were also excluded. Minimal censoring was performed (ASD mean = 2.8% censored, TD mean = 2.2% censored), and groups did not differ with respect to the number of remaining time points (Table 2). All structural and functional data were visually inspected at every preprocessing stage by at least two blinded reviewers to ensure acceptable data quality.
For ALFF and fALFF analyses, data were processed as above with the exception of highpass filtering and censoring, to preserve the full time series and range of frequencies. In FC analyses, minimal censoring was necessary in both groups (averages of 2.8% for ASD and 2.2% for TD). Therefore, including these few outlier time points for ALFF/fALFF analyses is unlikely to affect findings, which summarize the entire time series. Bandpass filtering was applied for ALFF analyses in the subsequent analysis steps (described below).
Performing global signal regression (GSR) to remove global noise from resting-state fMRI time series is controversial, and a consensus has not been reached (Liu et al., 2017; Murphy and Fox, 2017; Power et al., 2017a,b; Uddin, 2017). While the global BOLD signal at least partially reflects physiological artifact (Power et al., 2017b), it also contains neural information (Fox et al., 2009; Schölvinck et al., 2010). We matched ASD and TD groups on motion, included only participants with high-quality data, and used white matter and cerebrospinal fluid regressors, which have been shown to contain physiological artifact as well, for denoising. GSR was therefore not performed to avoid potential removal of true neuronal signal.
Amplitude of low-frequency fluctuations
All 96 cortical regions (Supplementary Table S2) and the thalamus from the Harvard–Oxford Atlas (Bohland et al., 2009) were used as regions of interest (ROIs). This relatively coarse parcellation minimized the computational burden of the present brain-wide analysis. Furthermore, an anatomical parcellation avoids potential confounds related to the greater inter- and intraindividual variability of functional atlases (Salehi et al., 2019), which may be especially problematic when studying clinical groups. ALFF and fALFF were extracted from each ROI using AFNIs 3dRSFC (Taylor and Saad, 2013), with a frequency range of 0.008–0.08 Hz specified for ALFF.
Functional connectivity
FC was assessed between the left and right thalamus and all ipsilateral cortical ROIs, given the predominantly ipsilateral connectivity between the thalamus and cerebral cortex (Jones, 2007). Average timecourses were extracted from each ROI using AFNIs 3dmaskave. Pearson correlations were calculated between ipsilateral thalamus and cortical ROIs and then transformed to Fisher's z values.
Analysis approach
Groups were compared on fMRI measures (i.e., ALFF, fALFF, and thalamocortical FC) at two levels of analysis. (1) To reduce the dimensionality of the data while preserving broad regional patterns of interest, multilevel modeling (MLM) was conducted separately for six mutually exclusive ROI groups in the left and right hemispheres (frontal, limbic, somatomotor, temporal, parietal, occipital; Supplementary Table S2), which included all 96 cortical ROIs. For example, group differences in ALFF were examined for all left frontal ROIs nested within subjects, all left limbic ROIs nested within subjects, and so on, for all six ROI groups in both hemispheres (Supplementary Fig. S2). In other words, for these models, each participant had one observation for diagnosis (ASD or TD), and n observations (where n = number of ROIs) for ALFF. Degrees of freedom for each multilevel model were calculated as follows: (number of participants × number of nested ROIs) − number of model parameters. This approach both reduces the number of comparisons and accounts for nonindependence of multiple ROIs within each participant. (2) Following MLM, post hoc analyses were conducted at the single ROI-level to characterize group differences in finer detail. For ALFF, fALFF, and thalamocortical FC, two-sample t-tests were conducted for each individual cortical ROI and the thalamus, with degrees of freedom adjusted for unequal variances. ROI-level analyses were repeated for an unmedicated subsample of ASD participants and a matched TD group.
Multimodal analyses
For the 34 individuals described above with both EEG and fMRI data (Table 3), multimodal analyses were conducted. First, the relationship between absolute EEG alpha power and ALFF, which is considered more comparable with absolute EEG power than fALFF (Luchinger et al., 2012), was examined. Furthermore, ALFF demonstrates better test/retest reliability than fALFF, and is therefore a more appropriate measure for evaluating between-subjects relationships (Zuo et al., 2010). As in fMRI-only analyses, effects of interest were examined with both MLM and at the single ROI level. MLM was conducted for each of the six groups of ROIs (as above) to determine the effect of diagnostic status, alpha power, and their interaction on ALFF. Sex and nonverbal IQ were not well matched between multimodal groups and were therefore included as covariates. As described above for fMRI MLM, each participant had one observation for each predictor and covariate, and n observations (where n = number of ROIs) for ALFF. At the ROI level, analogous general linear models were used to examine these effects for each individual cortical ROI and the thalamus.
Finally, the relationship between alpha power and thalamocortical connectivity was explored. As in the multimodal ALFF analysis, MLM was conducted for each ROI group with thalamocortical FC (Fisher's z) as the dependent variable. General linear models were also run at the ROI level, as described above.
Multiple comparison approach
The analyses described above involve numerous comparisons among cortical ROIs. Traditional approaches to multiple comparison correction rely on conservative adjustments to significance values (i.e., p-values), with the goal of reducing type 1 error or false discovery rate. However, p-values are influenced by data precision, which is closely tied to sample size. Therefore, particularly in smaller samples, inferences based on p-values alone may lead to erroneous conclusions (c.f. Schmidt and Rothman, 2014). Alternatively, hierarchical models (i.e., MLM) have been proposed to account for multiple comparisons without the adjustment of p-values (Gelman et al., 2012), and have demonstrated specific utility in neuroimaging (Friston and Penny, 2003; Friston et al., 2002). To balance between more liberal (i.e., uncorrected p-values for ROI analyses) and conservative approaches (i.e., corrections using MLM), we present results from MLM, followed up with uncorrected ROI-level comparisons to describe patterns driving MLM findings. Therefore, individual comparisons are best interpreted with caution, and in the context of MLM results.
Results
EEG analyses
In the full sample with resting-state EEG data, the ASD group showed reduced absolute [t(60.41) = 2.74, p = 0.008] and relative [t(73.42) = 3.83, p < 0.001] power in the alpha frequency band (Fig. 1). Groups did not differ with respect to alpha peak frequency [t(58.40) = −0.23, p = 0.82]. In a supplemental analysis of only unmedicated ASD participants and a matched TD subgroup (n = 17 per group), similar differences were found in both absolute power [t(27.17) = −2.22, p = 0.04] and relative alpha power [t(31.30) = −2.39, p = 0.02; Supplementary Fig. S3], and there were no significant group differences for alpha peak frequency [t(30.13) = 1.24, p = 0.23].
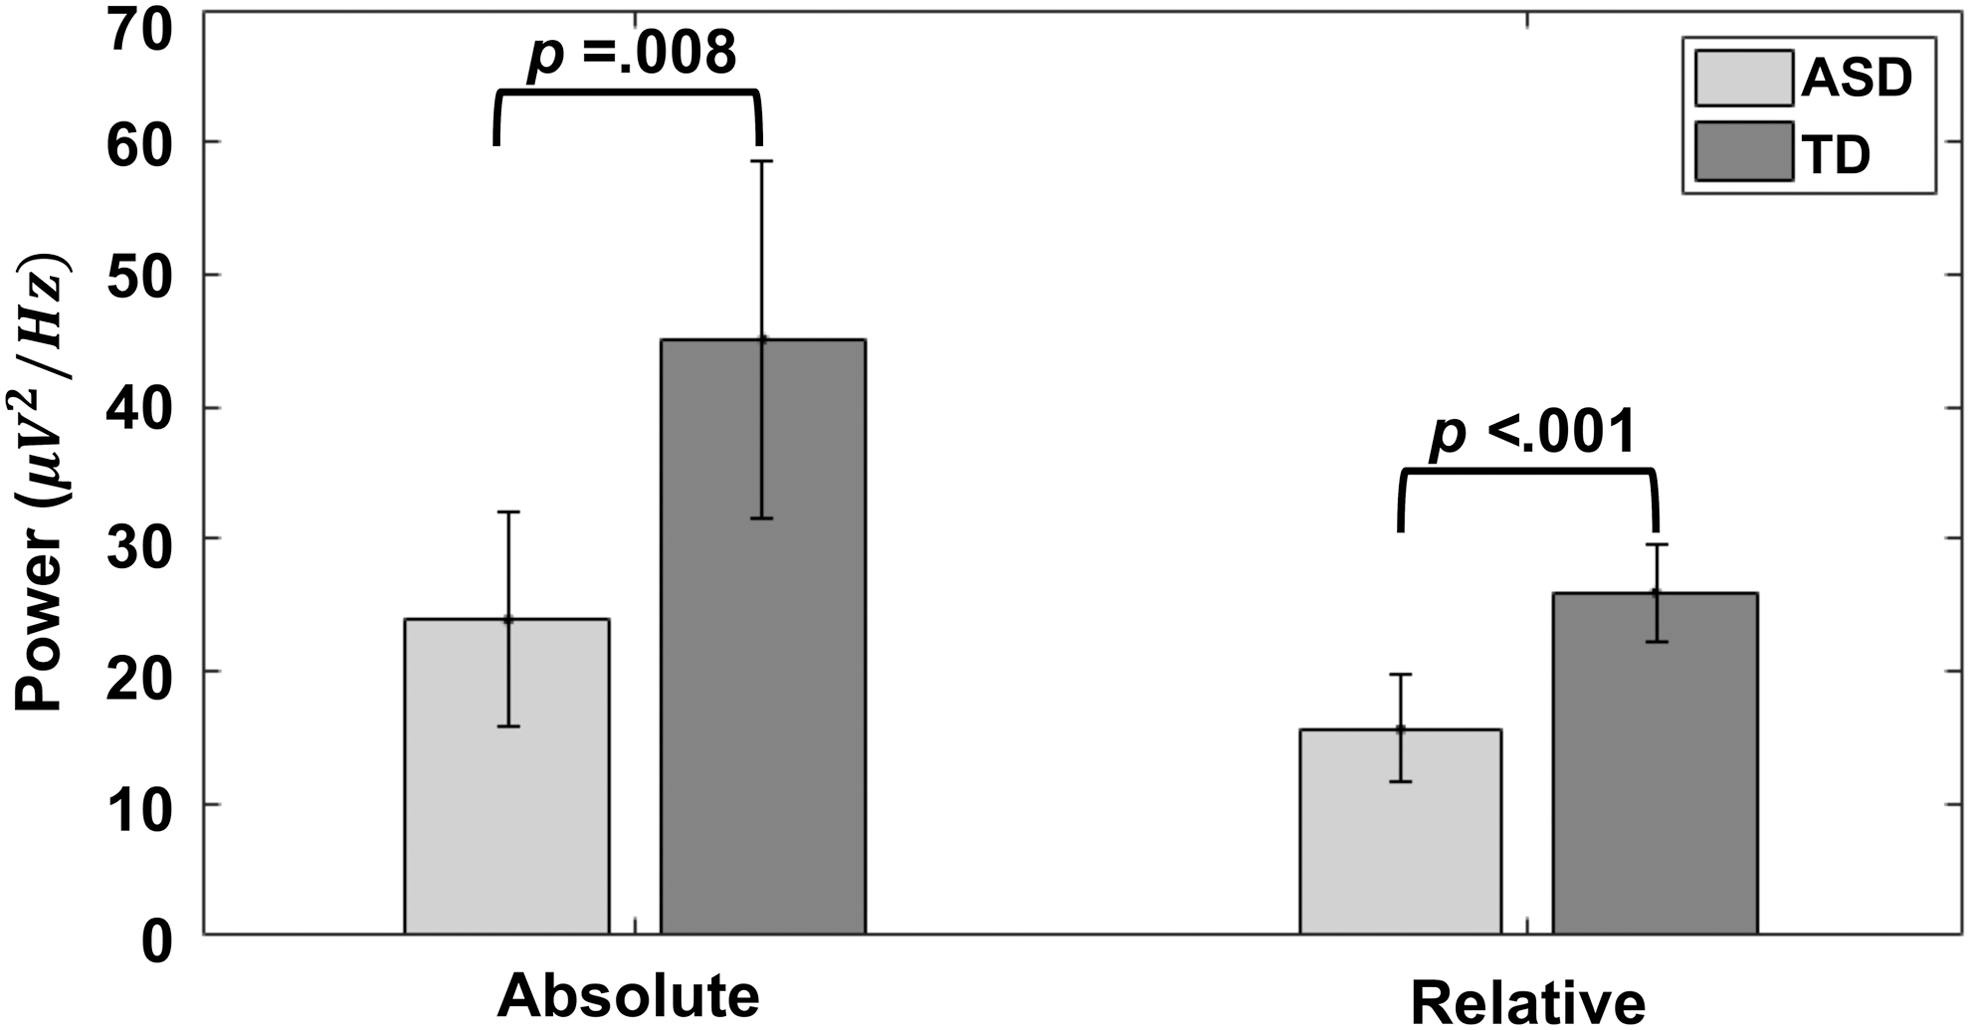
Group differences in EEG alpha power. Bars show absolute and relative alpha power averaged across participants in each group. Both absolute power and relative alpha power are smaller in the ASD group than the TD group. ASD, autism spectrum disorder; EEG, electroencephalography; TD, typically developing.
fMRI analyses
MLM indicated increased fALFF (ASD > TD) in right temporal regions [t(1843) = 2.45, p = 0.01; Supplementary Table S3]. In ROI-level analyses, ALFF was increased in ASDs in both the anterior [t(108.50) = 2.58, p = 0.01] and posterior [t(116.52) = 2.00, p = 0.048] segments of the right middle temporal gyrus, and fALFF was increased in ASDs in 12 temporal and occipital ROIs spanning both hemispheres (p range = 0.002–0.046; Fig. 2A and Supplementary Table S4). Finally, at the ROI level, there were no group differences in ALFF or fALFF in the thalamus (both p > 0.70).
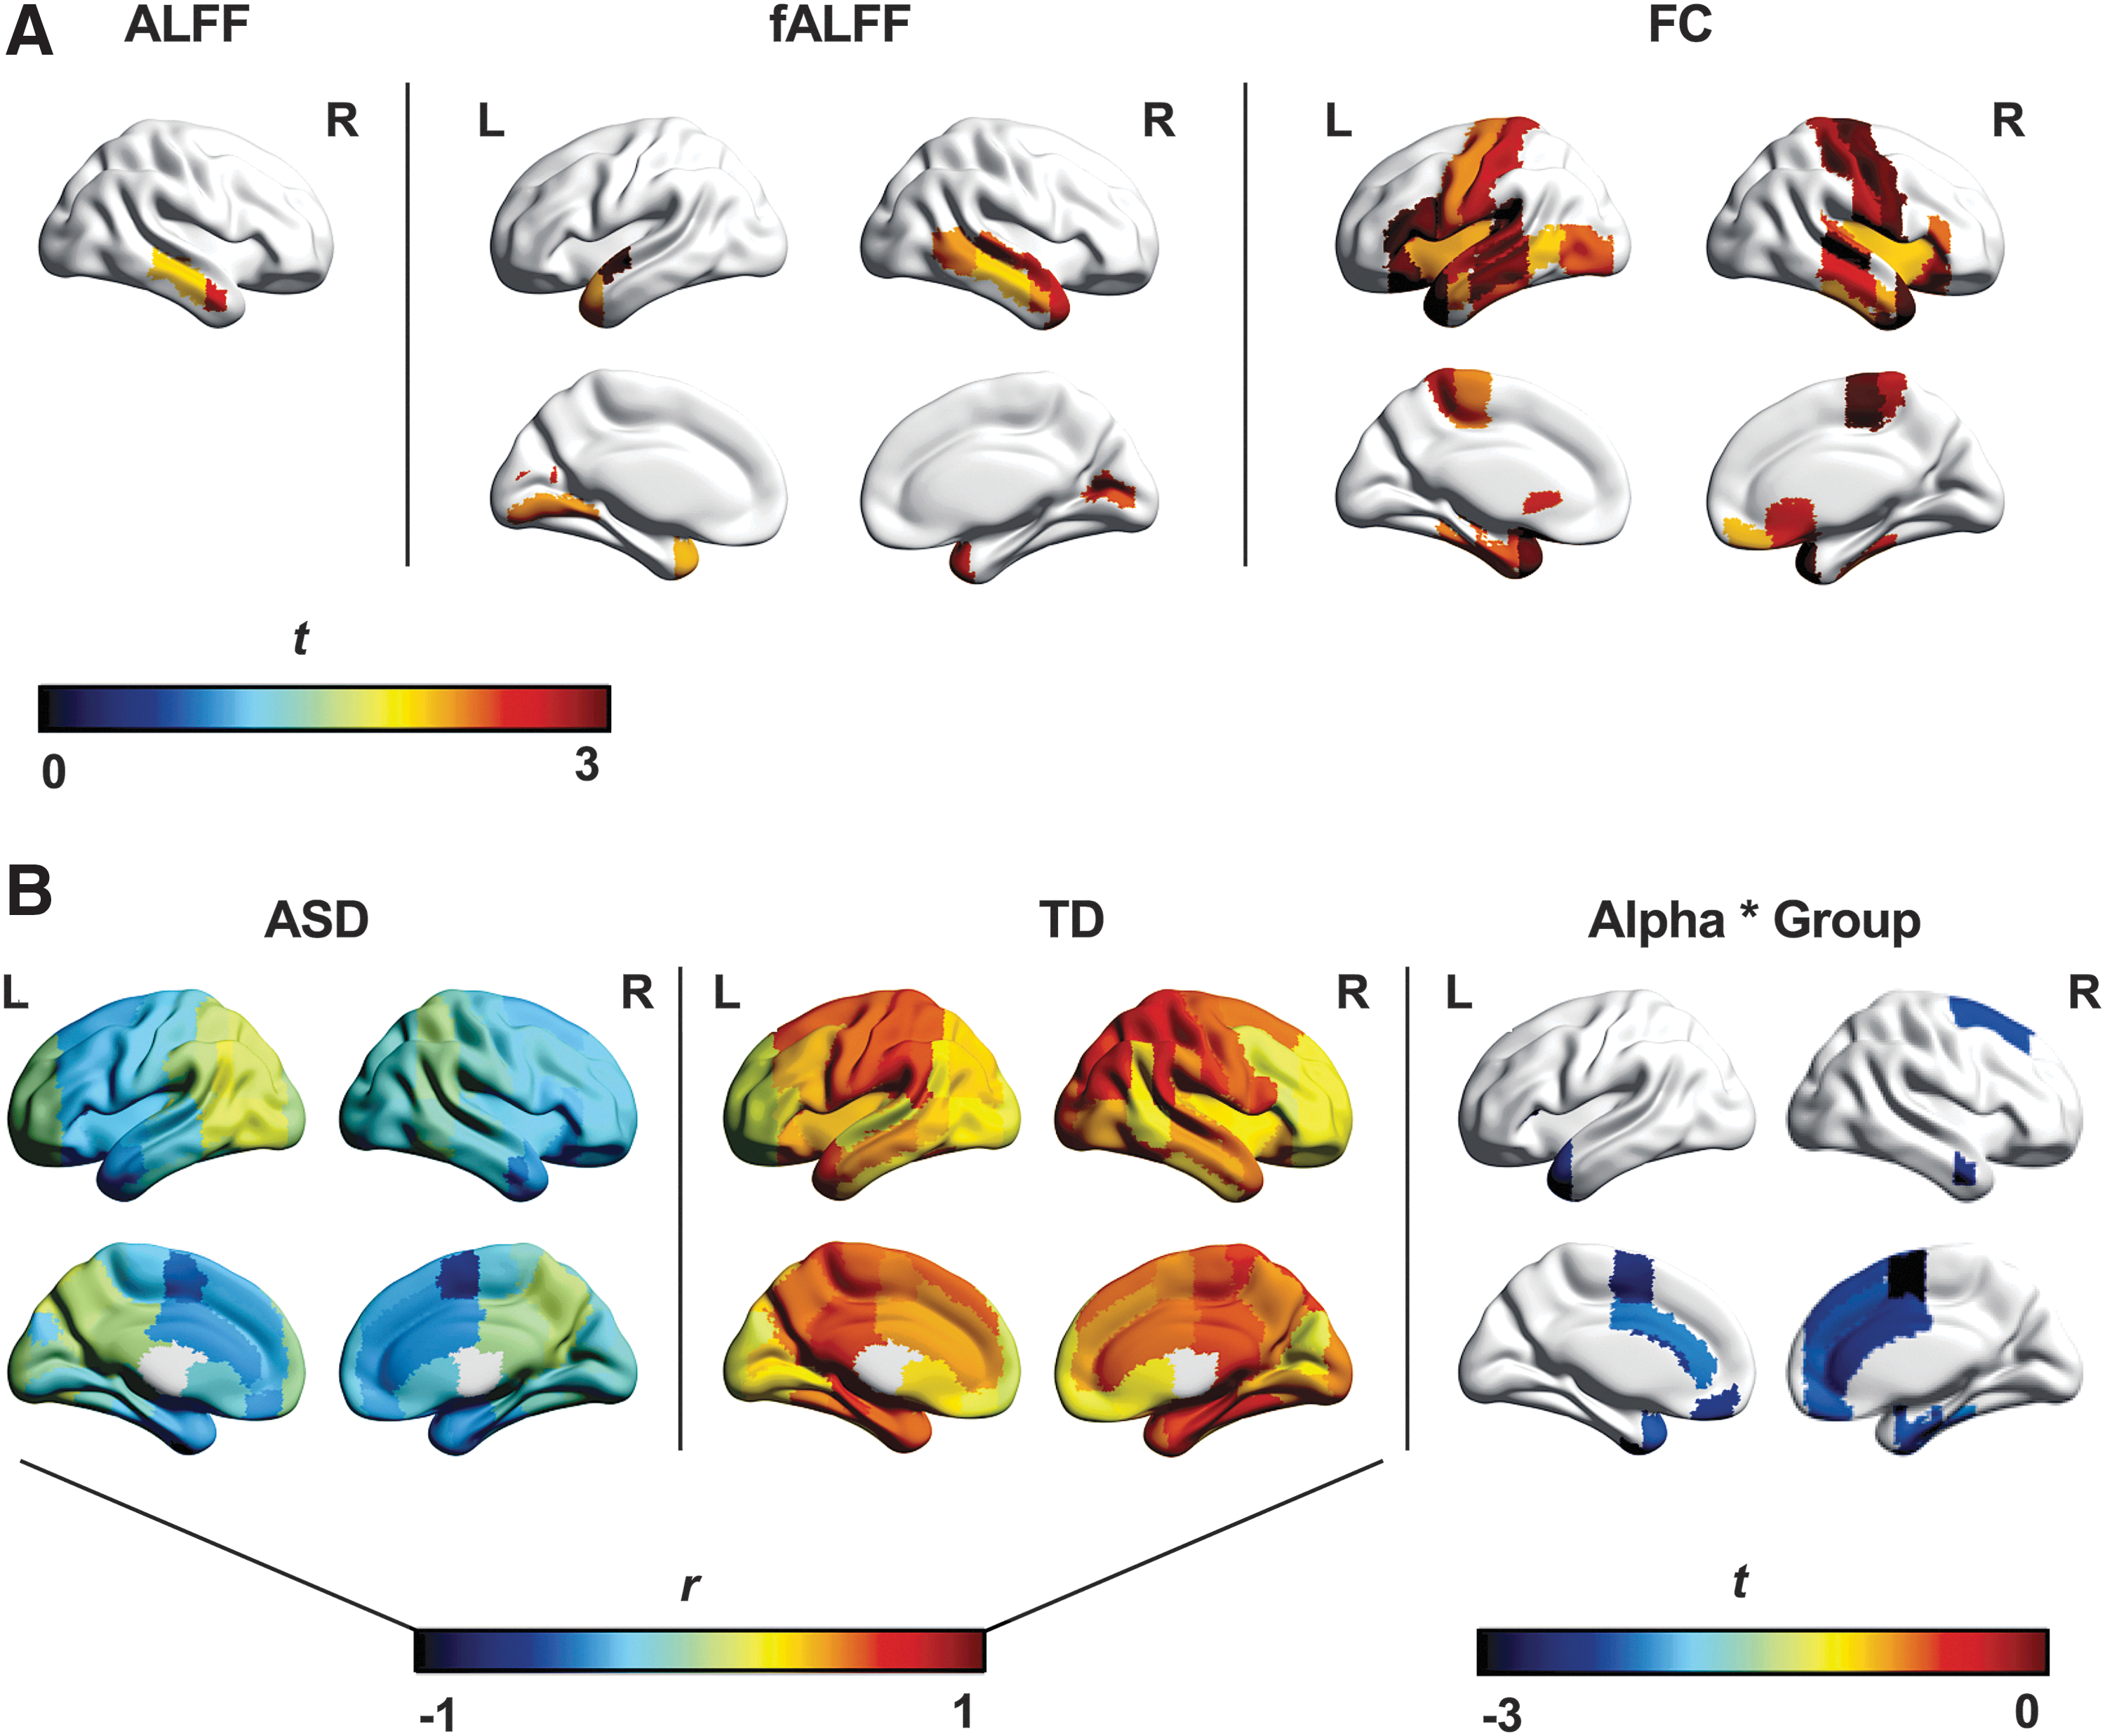
fMRI and multimodal group differences.
With respect to thalamocortical FC, MLM revealed ipsilateral overconnectivity (ASD > TD) involving bilateral frontal, somatomotor, and temporal, as well as left limbic regions (p range = 0.002–0.03, Supplementary Table S3). ROI-level results were consistent and are presented in Figure 2A and Supplementary Table S4. Supplemental analyses of unmedicated ASD participants and a matched TD subsample (n = 37 per group) yielded similar results for ALFF, fALFF, and FC to those reported in the full sample (Supplementary Fig. S4).
Multimodal analyses
Alpha power and ALFF
MLM showed multiple alpha by diagnosis interactions with respect to ALFF (i.e., the alpha-ALFF relationship differing between groups) in bilateral frontal, limbic, and somatomotor ROI groups, with consistently less positive relationships between ALFF and alpha power in the ASD compared with the TD group (p range = 0.01–0.04; Supplementary Table S5). Furthermore, MLM combining all 96 cortical ROIs in the ASD group alone found that across the whole brain, there was an interaction between ADOS total score and alpha power [t(1628) = −2.44, p = 0.01], such that greater ASD symptom severity predicted an overall less positive relationship between alpha power and ALFF. Finally, within the ASD group, there was no effect of medication on the overall relationship between alpha power and ALFF in whole-brain MLM (p = 0.90).
At the ROI level, thalamic ALFF was not predicted by absolute alpha power, diagnosis, or their interaction (all p > 0.09). Findings for cortical ROIs were consistent with MLM analysis, suggesting that alpha-ALFF relationships differed between groups in 15 frontal, limbic, somatomotor, and temporal ROIs (Fig. 2B, Supplementary Fig. S5, and Supplementary Table S2). Follow-up Pearson correlations determined that across all cortical ROIs, alpha power and ALFF were more positively related in the TD group (mean r = 0.40, range = 0.11–0.70) than in the ASD group (mean r = −0.18, range = −0.61 to 0.17). One-sample t-tests of alpha-ALFF correlations (transformed to Fisher's z) for each ROI corroborated that this relationship was significantly greater than zero in the TD group [t(95) = 22.15, p < 0.0001], but significantly less than zero in the ASD group [t(95) = −10.90, p < 0.0001].
Alpha power and thalamocortical FC
There was no effect of alpha, diagnosis, or their interaction on thalamocortical connectivity in MLM (all p > 0.11; Supplementary Table S5). One-sample t-tests indicated that overall, the correlation between EEG alpha and thalamocortical FC was significantly less than zero in both the ASD [t(95) = −8.95, p < 0.0001] and TD groups [t(95) = −3.62, p < 0.001]. At the ROI level, the ASD group showed a more positive relationship between alpha power and thalamocortical FC than the TD group for the right angular and supramarginal gyri, whereas the opposite effect of group was observed in the occipital pole (p range = 0.003–0.03; Table 4).
ROI-Level EEG-fMRI Findings
ROIs with group differences (p < 0.05, uncorrected) are shown.
ALFF, amplitude of low-frequency fluctuations; FC, functional connectivity; ROI, region of interest.
Discussion
Our study replicates two commonly reported findings from the unimodal EEG and fMRI literatures, showing reduced alpha power as well as predominantly increased thalamocortical connectivity in children and adolescents with ASDs. Although no robust group differences were detected for ALFF, findings suggest that spontaneous BOLD fluctuations in right temporal lobe may be increased in ASDs. Multimodal analyses identified group differences in the relationship between EEG alpha power and ALFF, but not between alpha power and thalamocortical FC.
Unimodal group differences
Reduced EEG alpha in ASDs
In line with previous research (Keehn et al., 2017; Murias et al., 2007), our EEG sample showed atypically reduced posterior (i.e., occipital or parietal) resting-state alpha power in children and adolescents with ASDs. Although the resting alpha rhythm is most prominent at posterior electrodes, reduced alpha power in ASDs has also been reported more broadly in frontal and temporal regions (for review, see Wang et al., 2013). The resting alpha rhythm is inversely associated with autonomic arousal (i.e., electrodermal activity) in TD children (Barry et al., 2004), which is thought to be coordinated largely by inhibitory GABAergic interneurons (Jensen and Mazaheri, 2010). In ASDs, an imbalance between excitatory and inhibitory neural activity has been proposed (Nelson and Valakh, 2015; Rubenstein and Merzenich, 2003), which may lead to such changes in autonomic activity. This is supported by evidence of tonic hyperarousal (Palkovitz and Wiesenfeld, 1980) as well as histological (Hashemi et al., 2017; Oblak et al., 2010) and magnetic resonance spectroscopy reports (Gaetz et al., 2014; Puts et al., 2017) of reduced GABA in this population.
Increased thalamocortical connectivity in ASDs
Previous findings with respect to thalamocortical FC in ASDs have been only partially consistent. Nair and colleagues (2015), who included a smaller sample partly overlapping with that of the present study, reported primarily reduced thalamocortical FC with frontal, parietal, and occipital regions and increased FC with auditory, primary motor, and limbic areas. These distinct findings may be attributed to methodological differences. For example, the focus on functional differences within the thalamus through voxel-wise analyses by Nair and colleagues (2015) contrasts with the focus on overall thalamic connectivity with each cortical ROI in the present study.
Similarly to Nair and colleagues (2015), Cerliani and colleagues (2015) reported overconnectivity between the thalamus and primary sensory and motor networks (including somatosensory, motor, visual, and auditory regions) identified through ICA in a larger sample of children and adults (ages 7–50; 166 ASD, 193 TD) from the Autism Brain Imaging Data Exchange (ABIDE) database. However, they did not find any evidence of thalamocortical underconnectivity. Another study using a large ABIDE sample (ages 6–40; n = 228 per group) described overconnectivity between the thalamus and primary sensory cortices (including somatosensory, motor, and temporal regions) as well as prefrontal cortex (Woodward et al., 2017). Furthermore, this study reported greatest overconnectivity in older adolescents (ages 13–18) compared with other age groups. These findings are consistent with results from the present study, which also found exclusive overconnectivity with frontal, temporal, somatomotor, and limbic ROIs in children and adolescents.
Regionally increased BOLD activity in ASDs
The results of the present study support increased BOLD activity (i.e., ALFF, fALFF) in bilateral (right more than left) temporal and occipital regions; no evidence of decreased ALFF or fALFF was found. These findings are only partly consistent with extremely limited previous research examining ALFF and fALFF in ASDs. In a multisite study, Supekar and colleagues (2013) reported broadly increased ALFF across the brain in ASDs in multiple independent cohorts of children. In a large ABIDE sample, increased fALFF was found in right temporal regions (as in the present study), as well as in right dorsal superior frontal cortex (Di Martino et al., 2014). However, this same study and another (Itahashi et al., 2015) reported reduced fALFF in left and right occipital regions in ASDs. This is contrary to the findings from the present study, which were exclusively positive (i.e., ASD > TD) for both temporal and occipital regions.
EEG-fMRI associations differ between groups
EEG alpha and ALFF
Relationships between EEG alpha power and fMRI measures were surprising and seemingly counterintuitive, in light of the well-established inverse relationship between concurrent (i.e., simultaneously acquired) EEG alpha and cortical BOLD activity in TD adults. However, simultaneous alpha and BOLD time series are distinct from overall alpha power and ALFF, which were measured in the present study. The former describes moment-to-moment fluctuations, but the latter provides summary measures of alpha and BOLD magnitude across an entire recording session. In the present study, alpha power had an overall positive relationship with spontaneous BOLD activity (ALFF) in TD adolescents, but a weakly negative relationship with ALFF in those with ASDs. This difference was driven mainly by frontal, limbic, and somatomotor regions. Furthermore, a more negative alpha-ALFF relationship across the entire brain was associated with greater ASD symptom severity. The underlying neural basis of this relationship remains unclear but may relate to differences in inhibitory GABAergic activity, as described earlier. Importantly, GABA is thought to mediate thalamocortical regulation of the alpha rhythm (Hughes and Crunelli, 2005; Lorincz et al., 2009; Lozano-Soldevilla et al., 2014). Therefore, impaired GABAergic signaling in ASDs could conceivably disrupt modulation of alpha rhythms by thalamic and cortical activity, leading to an atypically weak relationship between alpha and cortical BOLD magnitudes in ASDs.
EEG alpha and thalamocortical FC
Thalamocortical FC and EEG alpha power showed overall weakly negative associations in both ASD and TD groups across the brain. This diverges from findings described above for ALFF; while the magnitude of BOLD activity appears to be dissociated from alpha power in ASDs, coordination between the thalamus and cortex showed a comparatively normal relationship with alpha power in the ASD group. This negative alpha-FC relationship across groups in our multimodal sample may be considered in relation to unimodal results in our larger EEG and fMRI samples. Specifically, the ASD samples showed reduced alpha power in EEG analyses, but widespread overconnectivity between thalamus and frontal, limbic, somatomotor, and temporal ROIs in functional connectivity MRI analyses. The overall negative relationship between alpha and thalamocortical FC detected in both ASD and TD subsamples with multimodal data suggests that the two findings in the larger unimodal samples may be related, implying that children with ASDs with most severely reduced alpha power will also tend to show heavier overconnectivity between the thalamus and cerebral cortex.
Limitations and future directions
The present study included a limited subsample of participants with high-quality data in both EEG and fMRI modalities. Only high-functioning individuals with ASDs were included, who may not represent the full autism spectrum. Furthermore, groups were not well matched for verbal IQ in the fMRI-only and multimodal samples. However, as verbal abilities are related to core ASD symptomatology in the sociocommunicative domain, verbal IQ was not included as a covariate in group analyses. Therefore, reported group differences cannot be definitively dissociated from verbal ability in the present study. Future research with larger, matched samples representing a broader range of ASD symptom severity may help to clarify some of the patterns suggested by the present study.
Another important consideration is the distinction between multimodal relationships within versus between individuals. Past research using simultaneous recordings has examined concurrent fluctuations in EEG and fMRI within TD adults, or “state-level” associations. Separately acquired data cannot answer this question, but they can speak to how these signals are related between individuals, at the “trait-level.” For example, it has been established that within individuals (state level), moment-to-moment increases in EEG alpha power are associated with concurrent decreases in cortical (but not thalamic) BOLD (Bridwell et al., 2013; Goldman et al., 2002; Laufs et al., 2003; Olbrich et al., 2009). However, the present study suggests a seemingly opposite relationship between typical developing individuals (trait level), such that in typical development, those showing higher overall alpha power also show greater magnitude of spontaneous BOLD fluctuations. These trait-level associations are an important bridge between fMRI and EEG research in ASDs. Group differences reported by unimodal studies suggest that there are meaningful, interindividual differences between the ASD and TD groups. Therefore, a clear understanding of normative interindividual relationships between multimodal measures will provide a common context for interpreting past EEG and fMRI findings. Future research may further explore these important questions with simultaneous EEG-fMRI when possible, and by conducting both within-subjects analysis of temporal dynamics and between-subjects analysis of multimodal relationships.
Conclusion
This is the first known study to characterize relationships between resting-state EEG and fMRI measures in ASDs. Reduced alpha power and broadly increased thalamocortical connectivity were found in ASDs relative to TD individuals. Results also suggest a positive relationship between EEG alpha power and cortical BOLD activity in typical development, which was not observed in ASDs. These findings raise questions for future research about potential abnormalities in thalamocortical regulation of the alpha rhythm in this disorder.
Footnotes
Acknowledgments
The authors acknowledge Marissa Westerfield and Wen-Hsuan Chan for their contributions to the preprocessing EEG data, and Christopher Fong for preprocessing of fMRI data.
Author Disclosure Statement
No competing financial interests exist.
Funding Information
This work was funded by the National Institutes of Health R01 MH081023 (Ralph-Axel Müller), R21 MH102578 (Ralph-Axel Müller, Thomas T. Liu), R01 MH101173 (Ralph-Axel Müller), R21 MH096582 (Jeanne Townsend), the National Institute of Neurological Disorders and Stroke Center Grant 2P50NS22343 (Jeanne Townsend), and the National Science Foundation Graduate Research Fellowship 1321850 (Lisa E. Mash).
Supplementary Material
Supplementary Figure S1
Supplementary Figure S2
Supplementary Figure S3
Supplementary Figure S4
Supplementary Figure S5
Supplementary Table S1
Supplementary Table S2
Supplementary Table S3
Supplementary Table S4
Supplementary Table S5
References
Supplementary Material
Please find the following supplemental material available below.
For Open Access articles published under a Creative Commons License, all supplemental material carries the same license as the article it is associated with.
For non-Open Access articles published, all supplemental material carries a non-exclusive license, and permission requests for re-use of supplemental material or any part of supplemental material shall be sent directly to the copyright owner as specified in the copyright notice associated with the article.