
Abstract
Recent studies have reported on the feasibility of real-time functional magnetic resonance imaging (rt-fMRI) neurofeedback (NF) training. Although modulation of blood oxygenation level-dependent signal of single brain regions in rt-fMRI NF is a well established technique, the same does not hold true for modulation of connectivity. Self-modulation of interregional connectivity is a potential alternative in clinical neuroscience applications, since long-range functional dysconnectivity is being increasingly recognized as a mechanism underlying neuropsychiatric disorders. In this study, a framework was designed to train participants to self-regulate, in real time, interhemispheric functional connectivity between bilateral premotor cortices. To this end, participants use a novel adaptive motor imagery task, with gradual frequency variation preventing activity plateaus and subsequent decreases in correlation of activity (three NF runs). Participants were able to upregulate and maintain interhemispheric connectivity using such adaptive approach, as measured by correlation analysis. Modulation was achieved by simultaneous volitional control of activity in premotor areas. Activation patterns in the downregulation condition led to significantly lower correlation values than those observed in the upregulation condition, in the first two NF runs. Comparison between runs with and without feedback showed enhanced activation in key reward, executive function, and cognitive control regions, suggesting NF promotes reward and the development of goal-directed behavior. This proof-of-principle study suggests that functional connectivity feedback can be used for volitional self-modulation of neuronal connectivity. Functional connectivity-based NF could serve as a possible therapeutic tool in diseases related to the impairment of interhemispheric connectivity, particularly in the context to motor training after stroke.
Introduction
Functional magnetic resonance imaging (fMRI) can be used as a noninvasive technique using the amplitude of the blood oxygenation level-dependent (BOLD) signal for neurofeedback (NF) applications (Sulzer et al., 2013). Technical and methodological advances supported the implementation of real-time fMRI (rt-fMRI) and have allowed for online brain activation monitoring and the possibility of presenting this information to the participant while he/she is performing a particular task (Sitaram et al., 2011). NF is a technique that allows participants to have real-time access to measures of their own brain activity to learn to volitionally self-modulate activity in a specific brain region, combination of regions, or even connectivity between regions. A wide range of neurological disorders have been shown to present impaired brain activation patterns, and NF-based training may represent a safe therapeutic alternative, enabling neurobehavioral improvements, with potential to help patients on a long-term basis (Coben et al., 2010).
From single region of interest NF to connectivity-based NF
Since the first rt-fMRI NF experiments (Weiskopf et al., 2004), many studies have reported single region of interest (ROI) self-modulation related to particular cognitive functions (Caria et al., 2010; Direito et al., 2019; Rota et al., 2009; Weiskopf et al., 2004; Sitaram et al., 2017). To confirm the beneficial effects on brain function, neuroplasticity, and cognitive improvement, specific behavioral outcome measures are often used to document training effects (Weiskopf, 2012).
The fact that complex cognitive processes (emotion processing, motor coordination, language, etc.) imply coordinated activity between several brain regions has so far been overlooked in this context (Friston, 2011). Despite the positive evidence favoring the presence of beneficial effects of self-regulation of a specific brain region and induced behavioral changes, such a simplistic approach may not address the complexity of the underlying connectivity-based processing mechanisms (Ruiz et al., 2014).
Disorders such as autism (Minshew and Keller, 2010), movement disorders (Poston and Eidelberg, 2012), schizophrenia (Stephan et al., 2006), and stroke (New et al., 2015) have been associated with deficient or poorly coordinated brain networks and with the loss or destabilization of interhemispheric connectivity. In this sense, there has been an increasing number of studies analyzing connectivity across brain networks, based on bivariate or multivariate covariance or synchronization of segregated brain areas (Bullmore, 2012).
Recent developments in NF experiments focused on the activation of more than one brain region. Koush et al. (2013) tested the feasibility of using effective connectivity measures in a NF setup, in which the participants were asked to modulate connectivity between ipsilateral brain regions from visual and parietal cortices. The feedback display was designed based on a “near” real-time implementation of dynamic causal modeling. The feedback was computed using a 90-point sliding window and visually presented after 60 sec. Ruiz et al. (2014) studied an rt-fMRI NF setup based on functional connectivity metrics. The authors proposed healthy participants to increase functional connectivity between the inferior frontal gyrus (IFG) and the superior temporal gyrus, using visual feedback. The feedback was calculated as a sliding window correlation coefficient considering current and past time points. Spetter et al. (2017) developed a functional connectivity-based rt-fMRI NF experiment, in which subjects were instructed to increase functional connectivity between the dorsolateral prefrontal cortex (dlPFC) and the ventromedial prefrontal cortex, key areas in executive control and reward processing. A similar approach was used for patients with chronic stroke and severe motor impairment with reported augmentation in ipsilesional cortical–subcortical connectivity (Liew et al., 2016).
Motor imagery paradigm
Motor imagery (MI) is defined as a dynamic state in which the subject mentally simulates a particular action so that he/she can feel himself as if performing the imagined action (Decety, 1996). Compared with the brain processes involved in motor performance (MP), MI requires an additional inhibitory process from prefrontal and dorsolateral frontal cortices to prevent the imagined movement from actually happening (Jeannerod, 1994; Piokenhain, 1984).
Functional imaging studies (Gao et al., 2011; Gerardin et al., 2000) have shown an overlap between the neural networks involved in MI and MP, reporting coincident activations in several areas such as the supplementary motor area (SMA), premotor cortex (PMC), parietal areas, the basal ganglia, and the cerebellum. Guillot et al. (2014) reported higher activity in the ventral part of the PMC, responsible for movement planning during MI.
Interhemispheric functional interactions between motor-related areas in both MI and MP tasks have been previously reported (see the studies by Gao et al., 2011, Grefkes et al., 2008, and Liuzzi et al., 2011) and their relevance in terms of movement coordination was highlighed.
There is an important distinction in the MI literature regarding visual and kinesthetic MI and related brain activation patterns (Andrade et al., 2017; Hétu et al., 2013).
In particular, kinesthetic MI (a first-person perspective) has been previously used in reference tasks for NF experiments (Berman et al., 2012; Linden and Turner, 2016; Mehler et al., 2019). Authors reported high correlation between self-modulation of motor areas and improvements in task-related MP (Blefari et al., 2015).
In this proof-of-concept experiment, we asked participants to voluntarily modulate the interhemispheric connectivity between bilateral premotor cortices. The Pearson's correlation coefficient was used as the connectivity measure between the BOLD signals of these two regions.
Taking into account the novelty of this technique, we tested the ability to up- and downregulate functional connectivity. The feedback was presented continuously during NF functional runs.
We hypothesized that (1) it is possible to modulate interhemispheric connectivity between right- and left-hemisphere PMC in an rt-fMRI NF experiment based on a kinesthetic MI paradigm and (2) participants are able to adaptively optimize (based on imagined frequency of movement) the modulation strategy using such an NF paradigm.
Materials and Methods
Participants
We recruited 10 volunteers (mean age: 26.5 ± 3.3; 7 male) to perform a functional connectivity-based rt-fMRI NF experiment. This sample size was decided based on similar proof-of-concept studies (Thibault et al., 2018). All had normal or corrected-to-normal vision and no history of neurological or psychiatric diseases. All volunteers gave informed consent before participating. This study was conducted in accordance with the declaration of Helsinki.
Pretraining and psychometric evaluation
The NF sessions were preceded by a 30-min training session in which each participant got acquainted with the fMRI protocol and reference tasks. All questions concerning the study were answered. Their MI ability was assessed using the Movement Imagery Questionnaire-3 (Mendes et al., 2016; see Results in Supplementary Table S1).
After the fMRI session, all participants answered a debriefing questionnaire, in which they reported their subjective experience and perceived success of the proposed adaptive strategies.
rt-fMRI NF data acquisition
Each rt-fMRI NF session consisted of a first anatomical run—a run where a structural information of the brain is acquired—followed by six functional runs. Functional runs are defined as task-related runs where BOLD signals are measured: the first includes a localizer run that is used to map PMC. This run defines the spatial mask used as a NF target region. The localizer run is followed by five imagery runs. The first and the last imagery runs were performed without feedback information. Each scanning session lasted for ∼1 h and 20 min.
The setup includes a 3T Siemens Magnetom TrioTim scanner with a 12-channel head coil. First, the participants underwent a high-resolution magnetization-prepared rapid acquisition gradient echo sequence for coregistration of functional data (176 slices; echo time [TE]: 3.42 ms; repetition time [TR]: 2530 ms; voxel size: 1 × 1 × 1 mm; flip angle [FA]: 7°; field of view [FOV]: 256 × 256 mm).
Functional imaging focused on motor-related areas (related to motor planning and/or execution in frontal and parietal areas). The acquisition consisted of an echo-planar imaging sequence with 26 slices, in-plane resolution: 3 × 3 mm, FOV: 210 × 210 mm, slice thickness: 3.5 mm, FA: 75°, TR = 1500 ms and TE = 30 ms. The real-time data processing methods required to compute and present the feedback were performed using Turbo-BrainVoyager 3.2 (TBV; Brain Innovation, Maastricht, The Netherlands). The software implements real-time three-dimensional head motion detection and correction as well as an alignment between functional runs using anatomical information as reference. An incremental general linear model (GLM) based on a recursive squares algorithm accessed the functional data as soon as available.
Stimuli were presented on an LCD screen (70 × 39.5 cm, resolution of 1920 × 1080 pixels, 60 Hz refresh rate) that the participants viewed through a mirror mounted above their eyes at an effective distance of 156 cm.
Functional ROIs definition
To functionally localize the NF target regions during the localizer run, we used a mapping procedure that combined movement imagination with actual performance, following the task proposed in Xie et al. (2015). The procedure included two activation conditions, MI and MP, and baseline periods in a block design experiment.
The mapping procedure included a total of 17 blocks of 30 sec—9 baseline blocks, 4 MI blocks, and 4 MP blocks. The total duration of the localizer was 8 min and 30 sec. At the beginning of each block, the condition name was presented to the participant on the screen for 3 sec. During the MP blocks, each participant was instructed to execute a bilateral finger tapping sequence: 1-2-1-4-3-4 (1—left middle finger, 2—left index, 3—right index, and 4—right middle finger) at a specific frequency (2 Hz). During the MI blocks, the participants were asked to imagine the same sequence, without overt movement.
The ROIs (right premotor cortex [rPMC] and left premotor cortex [lPMC]) were functionally defined according to the contrast MI > baseline. In addition, anatomical landmarks—anterior to the central sulcus and superior to the Sylvian fissure, caudal parts of the superior frontal gyrus and middle frontal gyrus—and functional information—the rostral part of the precentral gyrus not occupied by the primary motor cortex (M1; Schubotz et al., 2010)—were used to determine the appropriate ROIs. The contrast MP > baseline was used to validate the strategy.
Feedback calculation and stimulus presentation
During the NF runs, the mean BOLD values of each ROI (defined in the functional localizer, rPMC and lPMC) were used to compute the functional connectivity metric according to Equation 1:
where p represents Pearson's correlation coefficient, x and y the mean BOLD signal of each ROIs, and n the sliding window size (Zilverstand et al., 2014). Feedback was calculated using an eight-point window (12 sec interval) and was updated at every point (1.5 sec).
A three-sample smoothing was applied before displaying the feedback value to avoid sudden variations (Zhang, et al., 2007) and to minimize frustration and fatigue of the participants.
The visual feedback was presented through a thermometer bar divided into 20 blocks, each block representing a 0.1 correlation increment (p values range from −1 to +1). TBV was used to extract the mean BOLD time courses and a custom Matlab software (The Mathworks, Natick, MA) script was developed to calculate the correlation and present the visual feedback (Fig. 1).
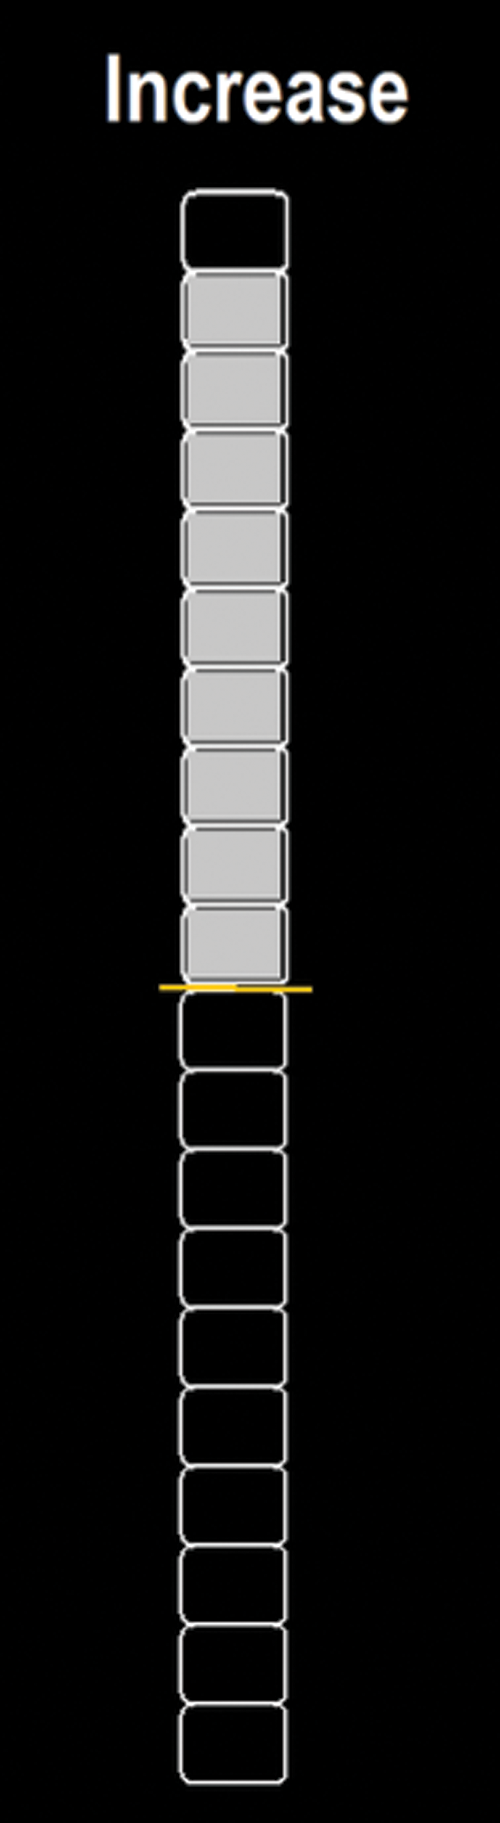
Visual feedback and presented instruction (with the name of the condition (“Increase” or “Decrease”) to each participant, at the beginning of each block, during the NF runs. NF, neurofeedback. Color images are available online.
The imagery runs were composed of 17 blocks of 30 sec, totaling 510 sec (340 volumes). The first and the last imagery runs were performed without feedback to provide a within-subject control strategy and test the ability to control BOLD connectivity in the absence of the feedback information. An auditory beep at the 15 sec mark indicated the midpoint for each block.
NF proposed strategies
The imagery runs included two conditions: “Increase” and “Decrease.” Each condition was presented eight times per run, alternately. During the “Increase” blocks, the participants were asked to implement an adaptive strategy to fill up the thermometer bar. On the opposite, during the “Decrease” blocks, they were instructed to implement a strategy that would keep the thermometer as close to zero as possible. For both conditions, negative values in the thermometer were to be interpreted as negative feedback.
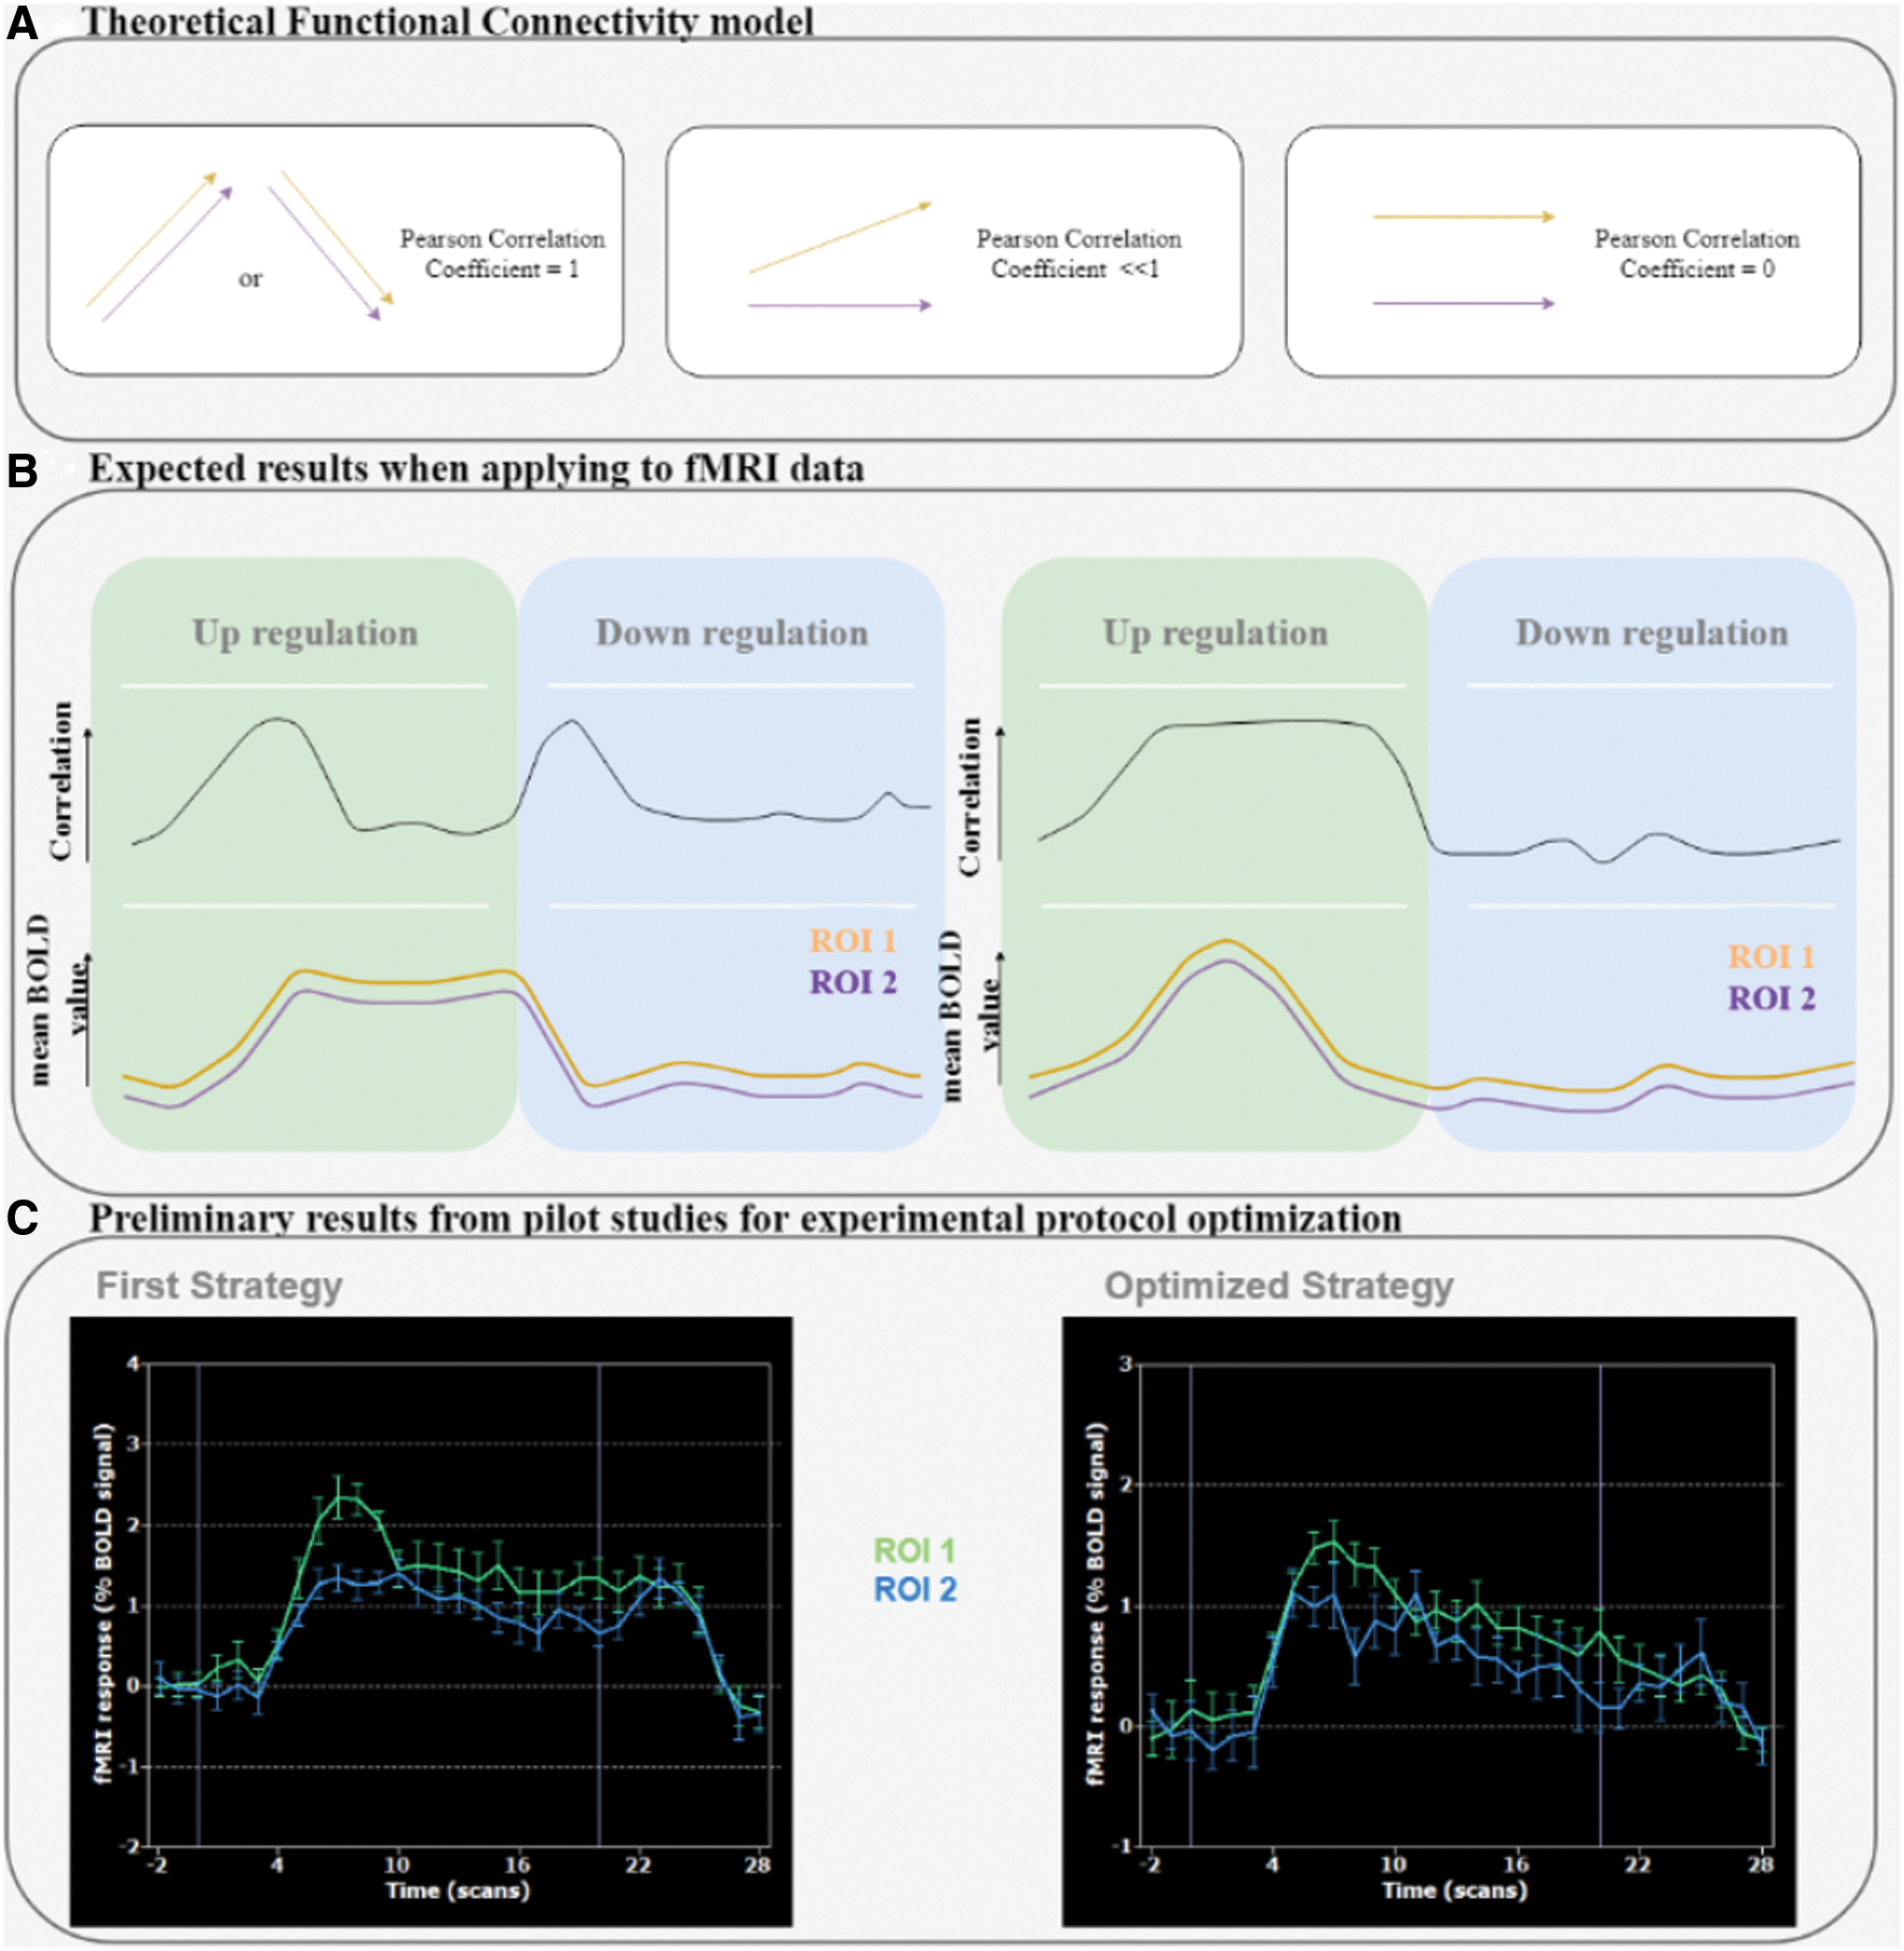
Based on data collected during pilot experiments, the adaptive strategy proposed to increase the thermometer value (“Increase” condition) consisted of the kinesthetic imagery of bimanual synchronized movements with gradual increase in frequency until the 15 sec mark, followed by a gradual decrease in the frequency until the end of the block. The critical rationale of this strategy is to avoid activity “plateaus” where correlations become nondiscernible, and to promote activity variations that favor detection of correlation patterns. Our pilot data favored this hypothesis, and are further explained in Figure 2—a triangular shape time course of the mean BOLD value of both rPMC and lPMC would increase the likelihood of identifying functional correlations. The adaptive strategy proposed is also in accordance with Rao et al. (1996), that is, the activation level within the whole-motor network increases with increasing finger tapping speed, that is, frequency increase.
For the “Decrease” condition block, participants were instructed to use a mental strategy of their own choice that did not activate premotor areas.
Offline fMRI data analysis
Offline fMRI data analysis was performed using BrainVoyager QX 2.8 (Brain Innovation). Preprocessing included slice-time correction, motion detection and correction, temporal high-pass filtering, coregistration between the functional and the anatomical data, and normalization to Talairach (TAL) coordinate space (Talairach and Tournoux, 1988).
Whole-brain statistical analyses
Functional data from the localizer and imagery runs were analyzed using a GLM. The design matrix was determined based on the predictors encoding the stimulus conditions, combined with six motion parameters (three translational and three rotational) and spikes (i.e., outliers in the BOLD time course), which were included as covariates.
A first whole-brain exploratory fixed effects (FFX-GLM) group analysis was performed to determine differences in the magnitude of the BOLD signal between conditions during the functional runs. During the localizer run, we aimed to determine the optimal regions for NF targets. During imagery runs, the objective of the whole-brain analysis was to explore the most relevant regions involved in the presence or absence of feedback and explore the underlying neural mechanisms involved in the proposed imagery tasks.
Connectivity analysis
Functional connectivity was determined as the Pearson's correlation between mean BOLD time courses of the NF targets (rPMC and lPMC).
To evaluate the ability to self-regulate connectivity in the NF runs, we compared the correlation values of both conditions (“Increase” vs. “Decrease”) at the midpoint of each block (i.e., TR sample 10, where an auditory cue instructs a decrease in imagined frequency). According to the triangular shape activation pattern hypothesis, this timepoint is crucial to understand whether this optimized strategy would result in a better differentiation of correlation between conditions. The selection of a time point well within the condition block also ensures that the feedback is entirely resulting of mental strategies of the current condition (taking into account the inherent BOLD signal delay and the windowed correlation calculation).
To further explore the modulation of functional connectivity, we compared the Pearson's correlation values of the condition “Increase” versus condition “Decrease.” To this end, only the final 12 correlation values from each block were considered (the rationale is that the first 8 points represent a mixture of data between both conditions—preventing points from the previous block from a different condition from being considered).
A paired Wilcoxon sign rank test was performed to determine the statistical significance of the difference between the conditions across participants and runs.
Results
Localizer run and NF target
The localizer run allowed for online functional definition of the subject-specific NF targets with the mapping procedure depicted in Figure 3.
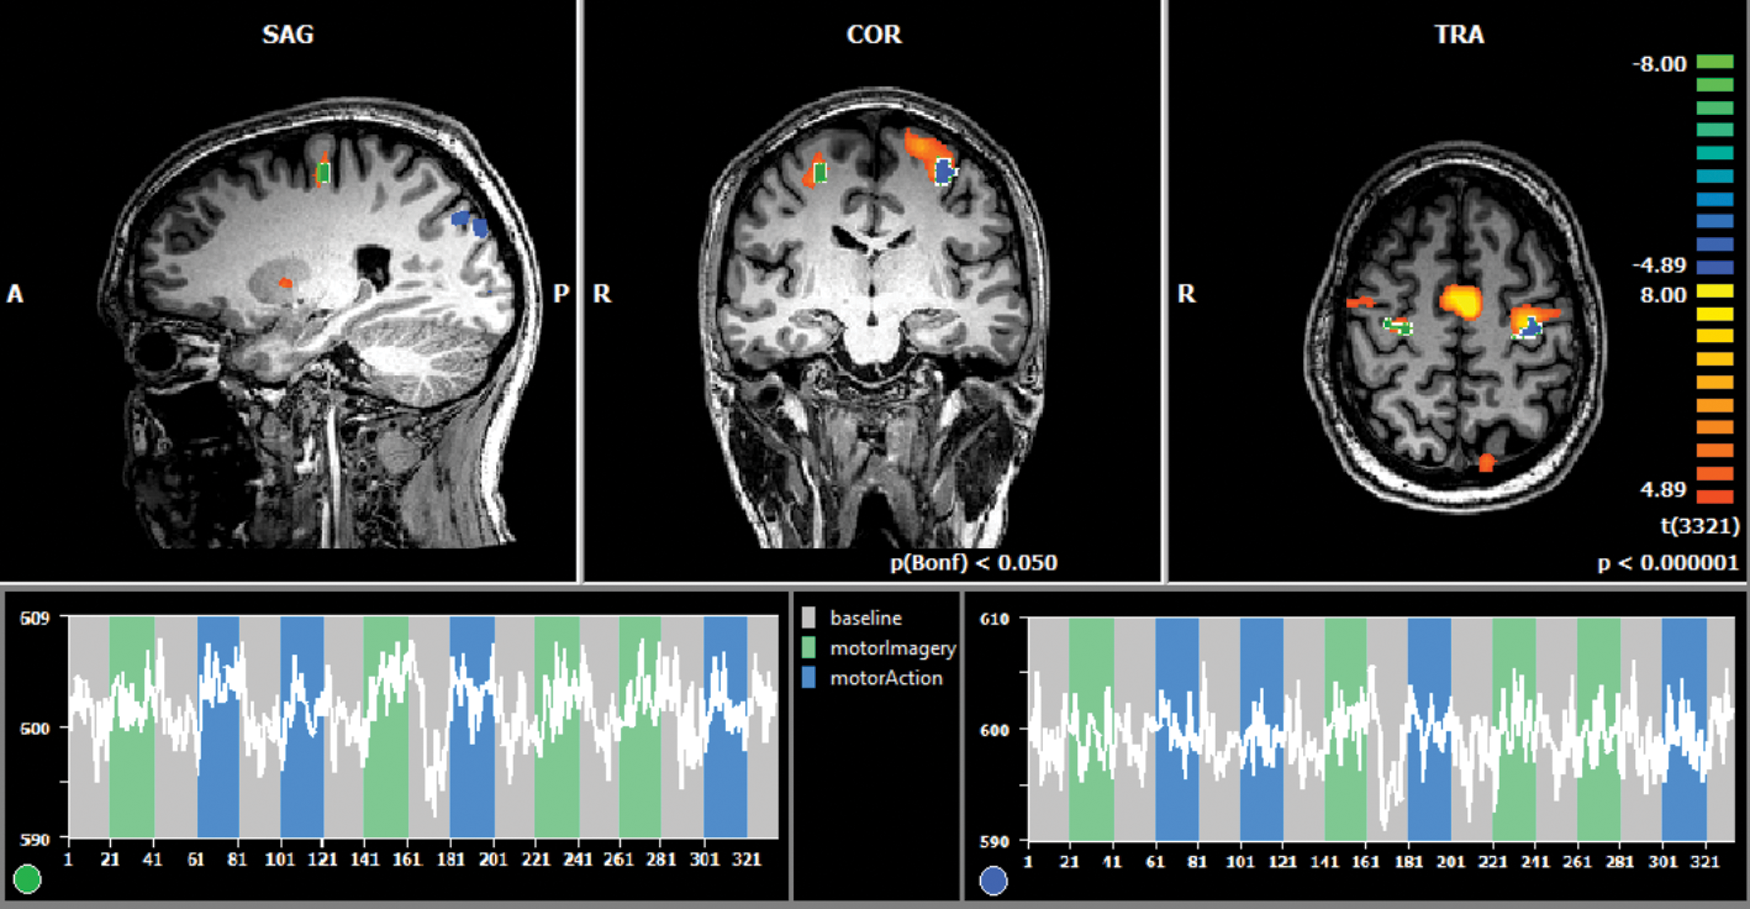
Overview of the localizer run, with offline FFX group analysis, p < 0.05 (Bonferroni corrected), overlaid with the online selected ROIs (blue, lPMC; green, rPMC) of one chosen subject on top and their respective BOLD signal time course (gray blocks: “baseline” condition, green blocks: “motor imagery” condition, blue blocks: “motor performance” condition) on the bottom. FFX, fixed effects; lPMC, left premotor cortex; rPMC, right premotor cortex. Color images are available online.
For each subject, significant activation clusters were selected for lPMC and rPMC ROIs. Mean location of the ROIs were lPMC: (−48, −4, 44) TAL coordinates, with size 819 ± 503 mm3 and rPMC: (46, −6.5, 48), with size 636 ± 334.97 mm3. The probabilistic maps corresponding to the overlap of the subject-specific ROIs defined online are presented in Figure 4.
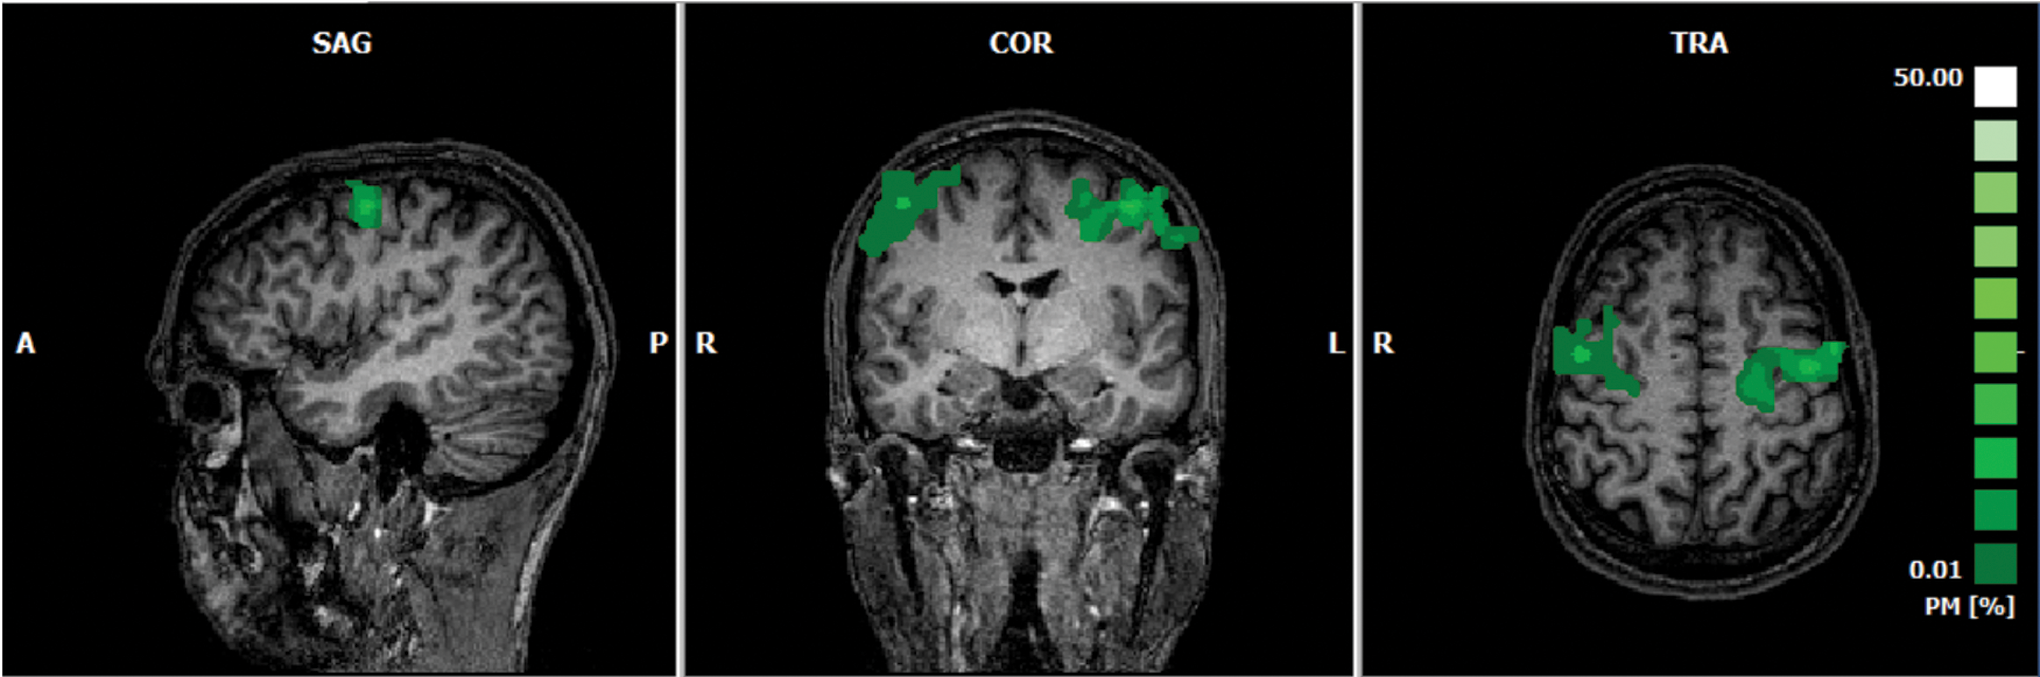
Probabilistic map of the combined ROIs (lPMC and rPMC) for the 10 subjects, showing the overlap of the subject-specific ROIs, selected online during the localizer run. Color images are available online.
BOLD modulation patterns
A block-related average (20 TRs corresponding to the 30 sec condition block) of the mean BOLD time course considering all NF runs (10 subjects, 3 runs each) for each ROI is presented in Figure 5. The average time course depicted in the figure for the “Increase” condition (green) shows a bilateral increase of the mean BOLD during the first samples, as hypothesized. This pattern is followed by a gradual decrease toward the end of the block. At the beginning of “Decrease” blocks, the mean BOLD activity decreases bilaterally.
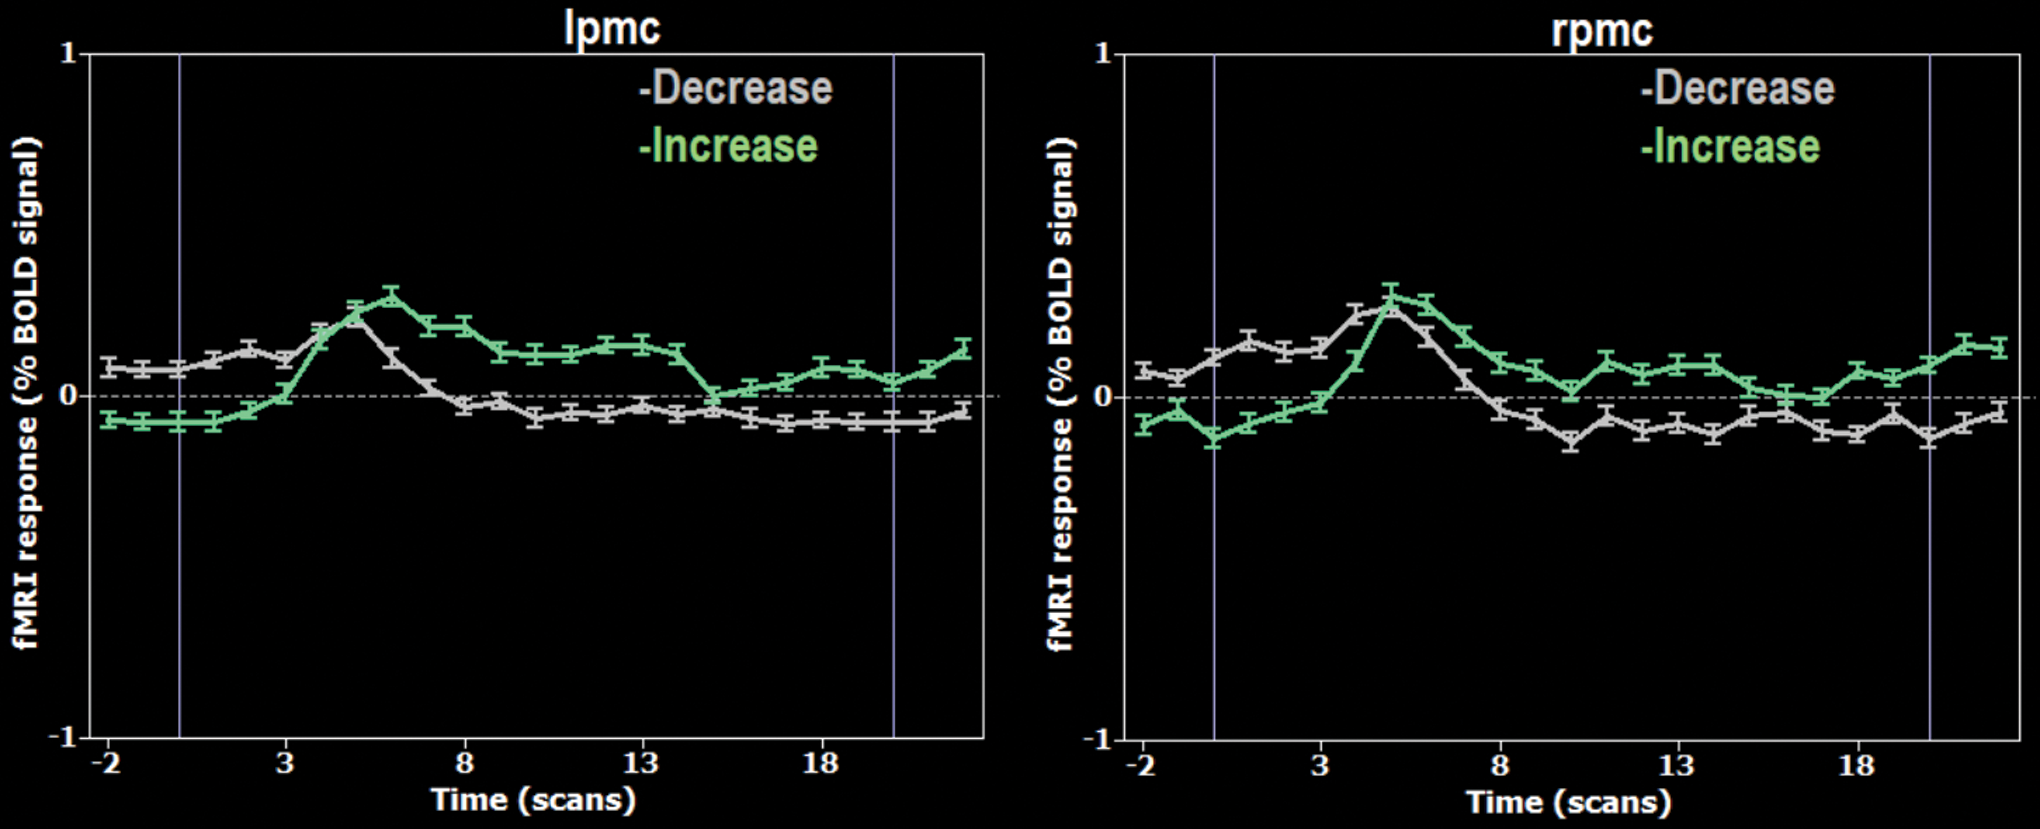
Block-related average per time point (20 TRs) of the mean BOLD time course of the lPMC (left) and rPMC (right), for both “Increase” (green) and “Decrease” (gray) conditions, for all 10 subjects and the three NF runs. TR, repetition time. Color images are available online.
The prominent shape of BOLD signal time course for both ROIs in the “Increase” condition departs from a “plateau” and follows a triangular (increasing, peaking, and decreasing) shape, suggesting that the adaptive strategy was successful.
Functional connectivity during imagery runs
Midpoint of upregulation block: difference between conditions
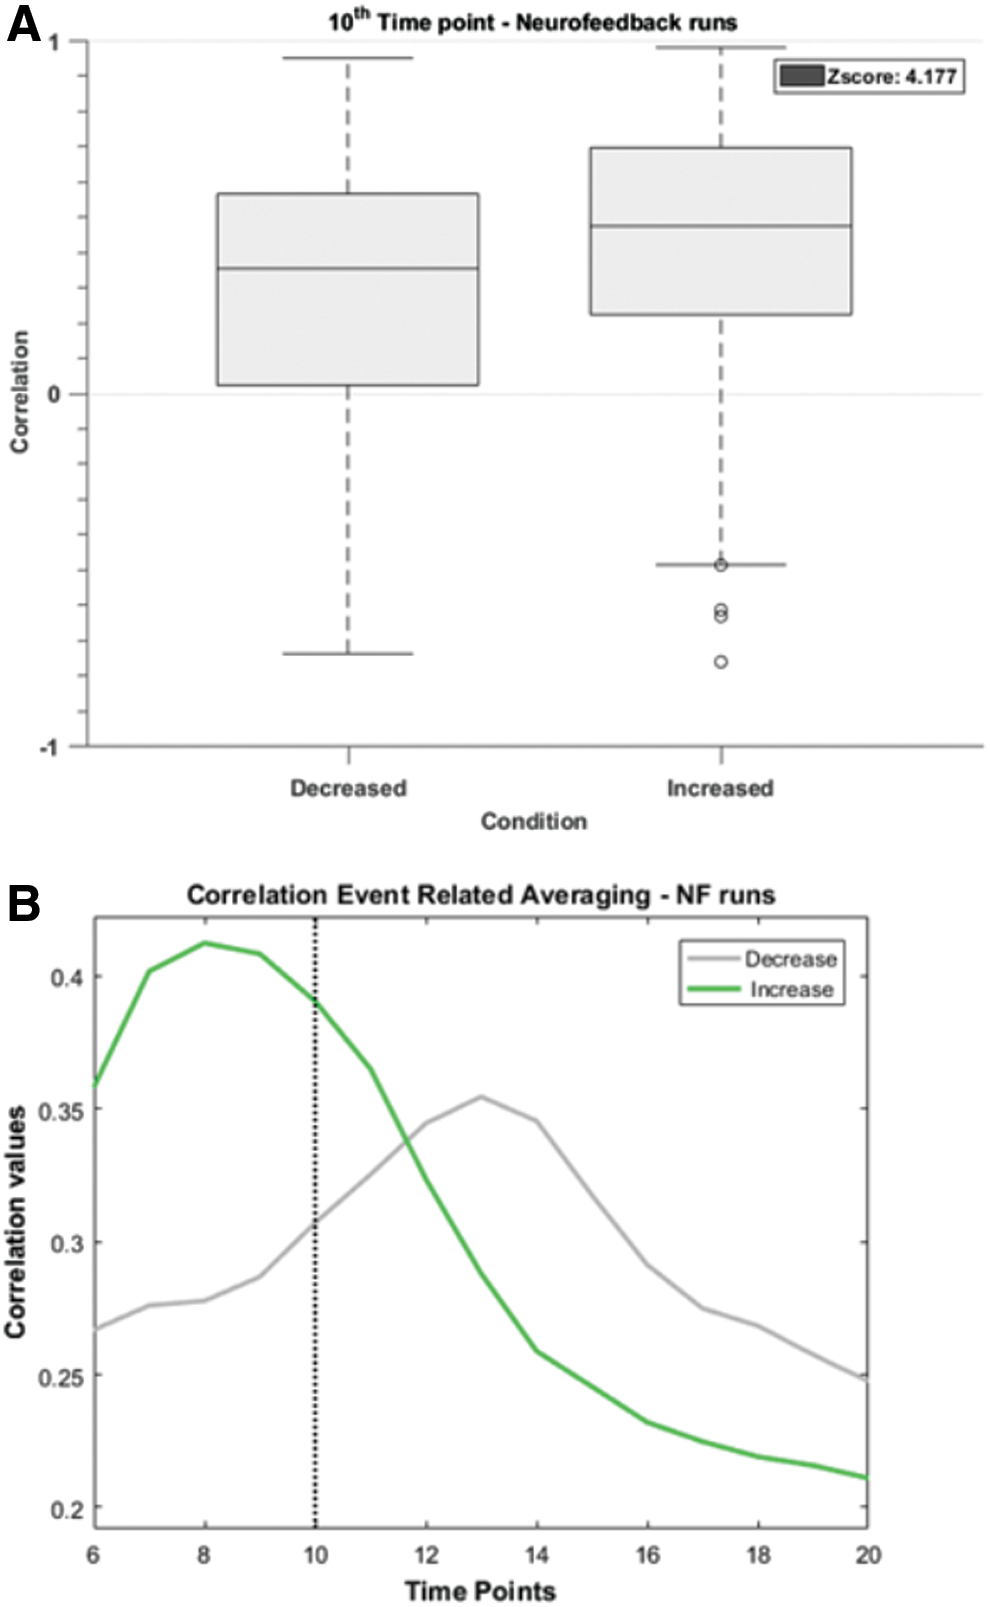
To explore possible modulation of functional connectivity between bilateral premotor areas, we analyzed the differences between correlation values for each condition at the midpoint of the blocks (corresponding to the expected “triangle peak”), that is, volume 10.
The difference between the functional connectivity at this critical midpoint is statistically significant in NF runs 1 (Z = 3.377, p < 0.001) and 2 (Z = 3.736, p < 0.001). The participants were unable to achieve statistically different correlation values between conditions in the very last run 3 (Z = 0.475, p = 0.635).
As mentioned in the section “rt-fMRI NF data acquisition,” before and after the NF runs, functional runs without NF were also acquired. Regarding those runs, statistical significance was observed in the “before” run but not in the “after” run [Z(“before”) = 3.799, p < 0.001; Z(“after”) = 1.118, p = 0.264]. All functional runs presented upregulation average values greater than the downregulation average values.
Figure 6 illustrates the differences (box-plots with confidence intervals) between the functional connectivity at midpoint (volume 10) across all NF runs and subjects. The results show a significant difference between “Increase” and “Decrease” correlation values (Z = 4.177, p < 0.001, paired tests).
Whole-block connectivity analysis
Regarding the comparative analysis between conditions based on the 12-point window, participants presented higher functional connectivity during the condition “Increase” in NF runs 1 (marginally) and 2 (highly significant) [Z(NF1) = 1.833, p = 0.067 and Z(NF2) = 4.501, p < 0.001]. On the opposite, the “Decrease” condition presented higher functional connectivity in run 3 [Z(NF3) = −7.182, p < 0.001]. This intriguing finding may be explained by decay of attention in this late run, as suggested by debriefing (see Discussion section). In the runs without feedback, functional connectivity modulation did not change across conditions [Z(“before”) = 0.564, p = 0.573; Z(“after”) = −1.098, p = 0.272].
Statistical maps
NF runs
Whole-brain analysis contrasting “Increase”>“Decrease” conditions presented activation clusters in bilateral precentral gyrus (corresponding to the premotor areas), medial frontal gyrus (MFG; corresponding to the SMA), bilateral IFG (related with executive function), bilateral lentiform nucleus, and bilateral anterior lobe of the cerebellum (both related to motor control; Fig. 7).
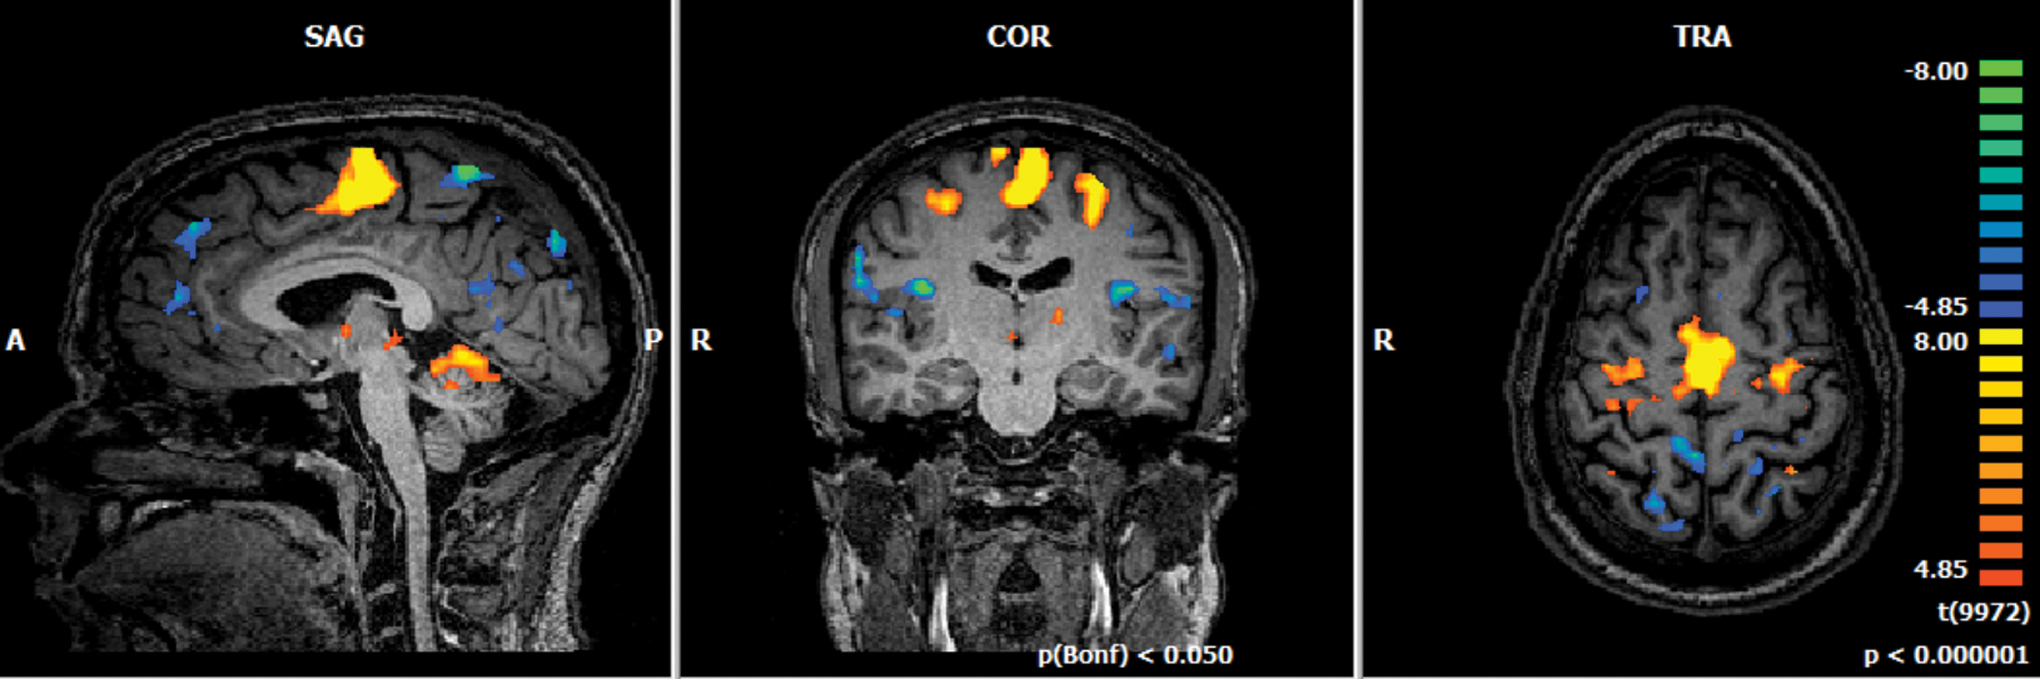
FFX-GLM group analysis for all 10 subjects and all 3 NF runs per subject, with condition “Increase” greater than “Decrease,” p(Bonf) <0.05. GLM, general linear model. Color images are available online.
Feedback versus nonfeedback
To study the effect of feedback in the performance of the imagery task, we analyzed activation patterns of the brain in runs in which feedback was given and runs in which feedback was not (Fig. 8). Considering our contrast of interest (“Increase”>“Decrease”), the difference between feedback and nonfeedback runs showed activation clusters in areas such as MFG, anterior cingulate cortex, middle occipital gyrus, parahippocampal gyrus, middle temporal gyrus, fusiform gyrus, and areas of the midbrain such as the thalamus.
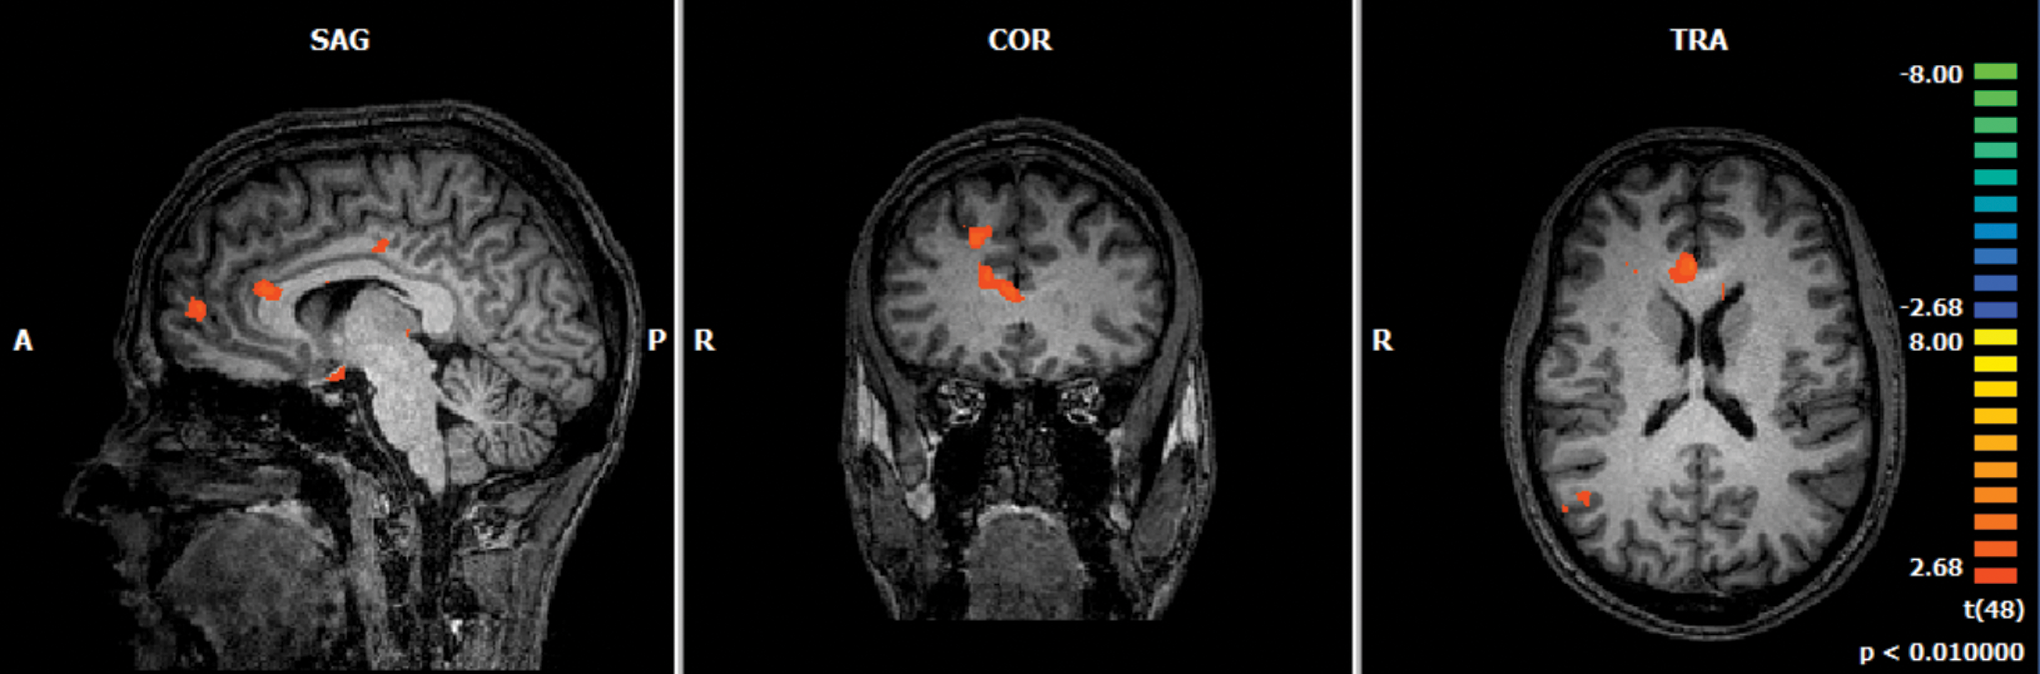
Whole-brain group analysis of the difference between NF runs and nonfeedback runs, both regarding “Increase”>“Decrease” contrast, result of a statistical two-sample t-test comparing the activation pattern found in these two run groups, t(48), p < 0.01). Color images are available online.
Discussion
The main achievement of this article was the development of a NF training technique that allows to modulate functional connectivity and to maintain this modulation consistently throughout an experimental block. This study hence addresses an important research gap in the development of connectivity-based NF paradigms. Specifically, the typical BOLD signal response of a block design paradigm task tends to “plateau” after some time, leading to lower correlation values. This is a major challenge for the use of correlation as a NF metric. By instructing a strategy of gradual variation of movement imagery frequency (increasing up to the midpoint of the block followed by a gradual decrease), we prevented such “plateau” thereby enabling participant's stable modulation of the correlation.
With this novel strategy, modulation of functional connectivity was achieved due to simultaneous self-modulation of bilateral premotor activity by increases and decreases of BOLD response. The triangular-shaped BOLD signal pattern prevented the emergence of a “plateau” during the upregulation condition as hypothesized. Moreover, lower connectivity values were observed in the “Decrease” condition than in the “Increase” condition. However, the concomitant bilateral decrease of activity in the early time points of the “Decrease” condition may lead to an initial and undesired increase in correlation.
Group-level analysis exhibits significant differences while comparing critical midpoint correlation values from upregulation and downregulation conditions in the first two of the three NF runs. In addition, the analysis based on a 12 points window of each block supports the idea of maintenance of higher values of correlation during upregulation condition comparing with downregulation condition. The results of the last NF run, as well as the results of the last functional run (“after”) could possibly be due, as suggested by debriefing, to raised questions by the participants of attention span and exhaustion, especially in the latter stages of the session. These factors were already reported in previous NF experiments (Greer et al., 2014; Koush et al., 2013) and could likely contribute to the correlated late decay of the BOLD signal to a lower level of activity in the NF targets BOLD signal during the “Decrease” condition.
Previous studies have shown that the modulation of connectivity between different regions is possible (e.g., dlPFC–amygdala regions, Zotev et al., 2013), but to the best of our knowledge, this is the first study aiming interhemispheric connectivity modulation and proposing/assessing specific strategies to stably modulate (increase or decrease) connectivity.
The results suggest that the presence of feedback had an impact on the ability of the participants to modulate functional connectivity. The control runs, without feedback, presented nonsignificant or smaller differences between “Decrease” and “Increase” conditions than the differences achieved in the NF runs, suggesting that the presence of NF is instrumental: participants relied on the feedback information presented to adapt their brain response and update the strategy used.
We were also interested in the direct neural correlates of feedback presentation. To this end, we investigated which regions presented differences between the feedback and the nonfeedback runs. Regions such as MFG and caudate, key areas related to executive functions, cognitive control, and the reward-related system (Ridderinkhof et al., 2004) as well as areas related to motor control presented higher activation during runs with feedback. The involvement of reward-related areas suggests that the participants use feedback to achieve reward, promoting the development of goal-directed behavior.
Choosing an efficient mental imagery strategy to achieve volitional control and maintenance of brain connectivity is one of the challenges in NF training. Previous studies evidenced that explicit strategies could have a positive effect on NF performance (Sulzer et al., 2013). In this study, we encouraged participants to modulate activity in two different conditions, alternating up- and downregulation of connectivity. In the first (“Increase” condition), based on the basic neurophysiological findings of Rao et al. (1996), we targeted a triangular shaped activation function (Fig. 2). To this end, we added an auditory cue indicating the midpoint of the “Increase” condition blocks. The first section of the proposed triangle-shaped activation function was achieved. These results support our hypothesis that an instructed gradual increase/decrease of BOLD signal, based on auditory midpoint cues within a condition block paradigm, is suitable for rt-fMRI functional connectivity-based NF experiments. The difficulty in sustaining high correlation values during the entire block was still present. Although highlighting the fact that this is a single-session study, the results reinforce that there is still room to improve the strategy, in multiple session paradigms.
Using the explicit frequency-based adjustment strategy proposed, the participants were able to fine-tune the kinesthetic imagery experience based on the received feedback. In the debriefing questionnaire, for the “Increase” condition, participants reported achieving best results with bimanual symmetric arm movement (playing musical instruments, e.g., drums or piano), opening and closing both hands, finger tapping sequences, and clapping. For the “Decrease” condition, in which the participants were asked to keep the thermometer as close to zero as possible, strategies included distracting mathematical calculation, N-back tasks, and color imagery.
The main limitations of this study include the relatively small sample size of healthy participants, therefore, lacking evaluation in a clinical population, the single-session approach (precluding the possibility to study learning across sessions) and the absence of electromyography recordings. A point to address in the future is to take into account situations wherein connectivity increases upon concomitant deactivation. With this design, we did not control for activation/deactivation of the target regions, in the sense that both can lead to positive correlations. We focused instead on the maintenance of modulation of functional connectivity, which is achievable for both synchronous activation and deactivation of the regions of interest. The question of the directionality of the activity in target areas is also relevant regarding neurorehabilitation and should be covered in future studies. Adressing and mitigating factors such as fatigue, reported by the subjects, will also need to be considered in future studies as well as finding an optimized strategy for the “downregulation” condition. The initial transient block change caused initial relatively high correlation values in downregulation conditions (because concomitant decay leads to increased correlation), which needs to be addressed in future studies, possibly with further experimental optimization with stricter modulation tasks/strategies and type of feedback representation.
Conclusion
This proof-of-principle study suggests that functional connectivity feedback based on bilateral premotor regions can be used to voluntarily modulate and maintain neuronal connectivity. Our adaptive frequency strategy allowed to achieve increased stability of functional connectivity, preventing a plateau of measured activity and, therefore, a decay in correlation. The ability to modulate connectivity was achieved due to simultaneous volitional amplitude control of BOLD response in bilateral premotor areas. Ultimately, our connectivity-based approach could be an alternative and/or complement of amplitude modulation NF.
The strategy suggested to increase the connectivity during a certain period was successful but there is still room to improve the approach to sustain the modulation for longer periods of time/sessions. Moreover, we found that the presence of feedback contributed to augment this modulation (higher correlation values correspond to upregulation condition blocks). Importantly, reward-related areas were more activated in the presence of feedback.
Our findings show that interhemispheric connectivity-based rt-fMRI NF is possible and may represent a possible therapeutic tool in diseases involving impaired interhemispheric connectivity, such as stroke. Clinical trials may represent an important next step toward establishing NF as an alternative treatment approach.
Footnotes
Acknowledgments
We thank Daniela Pereira and João Duarte for helpful suggestions.
Author Disclosure Statement
No competing financial interests exist.
Funding Information
Funding sources: FP7-HEALTH-2013-INNOVATION-1-602186, BRAINTRAIN; H2020 Marie Skłodowska-Curie Actions Award Number: 708492, Fundação Luso-Americana para o Desenvolvimento, Prémio FLAD Life Sciences 2020, Fundação para a Ciência e a Tecnologia, Award Numbers: FCT-UID/NEU/04539/2013, COMPETE, POCI-01-0145-FEDER-007440, POCI-01-0145-FEDER-30852, FEDER, BIGDATIMAGE, CENTRO-01-0145-FEDER-000016 financed by Centro 2020 FEDER, COMPETE; PAC—MEDPERSYST POCI-01-0145-FEDER-016428.
Supplementary Data
Supplementary Table S1
References
Supplementary Material
Please find the following supplemental material available below.
For Open Access articles published under a Creative Commons License, all supplemental material carries the same license as the article it is associated with.
For non-Open Access articles published, all supplemental material carries a non-exclusive license, and permission requests for re-use of supplemental material or any part of supplemental material shall be sent directly to the copyright owner as specified in the copyright notice associated with the article.