
Abstract
Migraine is a common disorder with high social and medical impact. Patients with migraine have a much higher chance of experiencing headache attacks compared with the general population. Recent neuroimaging studies have confirmed that pathophysiology in the brain is not only limited to the moment of the attack but is also present in between attacks, the interictal phase. In this study, we hypothesized that the topology of functional brain networks is also different in the interictal state, compared with people who are not affected by migraine. We also expected that the level of network disturbances scales with the number of years people have suffered from migraine. Functional connectivity between 78 cortical brain regions was estimated for source-level magnetoencephalography data by calculating the phase lag index, in five frequency bands (delta–beta), and compared between healthy controls (n = 24) and patients who had been suffering from migraine for longer than 6 years (n = 12) or shorter than 6 years (n = 12). Moreover, the topology of the functional networks was characterized using the minimum spanning tree. The migraine groups did not differ from each other in functional connectivity. However, the network topology was different compared with healthy controls. The results were frequency specific, and higher average nodal betweenness centrality was specifically evident in higher frequency bands in patients with longer disease duration, while an opposite trend was present for lower frequencies. This study shows that patients with migraine have a different network topology in the resting state compared with healthy controls, whereby specific brain areas have altered topological roles in a frequency-specific manner. Some alterations appear specifically in patients with long-term migraine, which might show the long-term effects of the disease.
Introduction
Migraine is not only characterized by moderate to severe headaches but often also involves nausea, vomiting, and enhanced sensitivity to a range of external stimuli and auras (Schwedt, 2013; Silberstein, 1995). It affects around 10% of the population worldwide (World Health Organization, 2011). The underlying mechanisms and causes are incompletely understood at this time. However, recent advances in brain imaging have provided evidence showing that migraine induces structural brain changes. In particular, patients with migraine display volumetric differences in both white and gray matter volume compared with controls, as well as white matter abnormalities and infarct-like lesions (Bashir et al., 2013; Jia and Yu, 2017). Importantly, migraine is a disease that often changes over time and undergoes chronification. These phenotypical changes have been paralleled with changes in brain structure, with damage that accumulates over time, hence becoming more prominent as the duration of migraine increases (Neeb et al., 2017).
Along with such structural changes, functional alterations have been reported in migraine. Most of the literature concerns studies based on functional magnetic resonance imaging (fMRI) (Schwedt et al., 2015). These studies described in the review by Schwedt et al. (2015) have shown that weaker, stronger, and atypical functional connectivity patterns have been observed in several resting-state networks (e.g., salience network and default mode network) in between migraine attacks. There is no overarching consensus yet about which brain regions are affected. However, a recent meta-analytic study based on MRI findings suggests that the visual cortex, insula, and hypothalamus play an important role in the pathogenesis of migraine (Burke et al., 2020). All in all, it is evident that the changes related to migraine are spread temporally as well as spatially.
However, only a few studies have investigated the resting state of the migraine brain using magnetoencephalography (MEG). MEG is a noninvasive technique that records the magnetic fields that are induced by the electrical activity of groups of neurons (Buzsaki, 2006; Schnitzler and Gross, 2005) and has a high temporal resolution and a moderate to high spatial resolution (Troebinger et al., 2014). One study in the interictal period showed that brain hubs that are related to pain processing have an abnormal nodal centrality in migraine patients (Liu et al., 2012). A different topological network organization was found in patients with migraine compared with controls, including alterations in small-world properties, resilience, node centrality, and inter-regional connectivity (Liu et al., 2015).
One case study showed that alpha band desynchronization was present during the migraine attack and disappeared after, while desynchronization in the gamma band persisted for roughly 10 min after the attack (Hall et al., 2004). Another MEG study showed that migraine patients display increased connectivity while simultaneously showing longer path lengths for lower frequencies compared with healthy controls (Wu et al., 2016). While a conclusive interpretation of evidence is still lacking, the literature so far is compatible with altered activity of pain-processing regions as well as with global changes that might impair brain resiliency and facilitate the long-range spreading of activation. The observed alterations in brain network topology may imply that migraine is associated with a functional brain reorganization that makes attacks more likely.
Interestingly, comorbidity between migraine and epilepsy has been reported (Sowell and Youssef, 2016; Winawer et al., 2013). Migraine and epilepsy share loci on chromosomes 12 and 14 (Polvi et al., 2012), and these neurological conditions also share both clinical symptoms and pathophysiological mechanisms (Haut et al., 2006; Liao et al., 2018; Sowell and Youssef, 2016; Trenite et al., 2019). In patients with epilepsy, hyperconnectivity is shown around the epileptic focus, while a more disconnected topology is present on the whole-brain scale (Van Dellen et al., 2009). Previous research has revealed a loss in functional network efficiency in interictal recordings of patients with focal epilepsy using MEG (Van Diessen et al., 2013). Since migraine and epilepsy share clinical symptoms as well as pathophysiological mechanisms, it might be expected that functional connectivity and network topology will be similarly affected across these diseases. More specifically, we hypothesize that both migraine and epilepsy are characterized by more integrated network topology than usually found in healthy controls.
We therefore set out to study the functional brain network using MEG. Based on structural brain differences and functional network findings in epilepsy, we hypothesized increased connectivity and increased network integration in the migraineurs compared with controls.
Methods
Subjects
A population-based nested case–control design was used. Subjects were selected from the Amsterdam Growth and Health Longitudinal Study (AGHLS), which started in 1976 with ∼600 first-grade and second-grade pupils from the Netherlands who were born between 1962 and 1964. This multidisciplinary, longitudinal cohort study was set up to examine the natural development of growth, health, and lifestyle of adolescents. Up to now, the AGHLS has had 10 detailed rounds of measurements spread out over 30 years (1976–2006). The study sample is highly educated, quite homogeneous, and still remains fairly healthy (Wijnstok et al., 2013).
From 1991 onward, questions about migraine were added, and in 2006, MEG recordings of 242 subjects were included. In addition, we obtained information about several lifestyle factors (i.e., subjects' smoking status) and body composition, which was measured with a dual-energy X-ray absorptiometry scan. Our study complied with the Declaration of Helsinki, the Medical Ethical Institutional Review Board of the VU University Medical Center approved the study, and all subjects provided their informed consent.
Figure 1 shows a flowchart of the selection of people with migraine and controls in the AGHLS between 1991 (age 27) and 2006 (age 42) (A). We used a self-reported health questionnaire and participants who answered yes to the following questions were included: “Do you suffer from migraine?” and “Were you diagnosed with migraine by a doctor?” We selected participants who had been diagnosed with migraine between 1991 and 2006 (n = 24: M = 4, F = 20) and sex-matched them with participants with no history of migraine (n = 24: M = 4, F = 20) (B). We divided the participants into recently diagnosed patients (n = 12: M = 2, F = 10) and long-term patients (n = 12: M = 3, F = 9): participants who were diagnosed with migraine in the period between the 2000 and 2006 measurement rounds were labeled as recently diagnosed migraineurs (n = 12, <6 years) and those who had been diagnosed with migraine for more than 6 years at the time of MEG recording were identified as long-term patients (n = 12, >6 years) (C). None of the participants were diagnosed with epilepsy (Table 1).
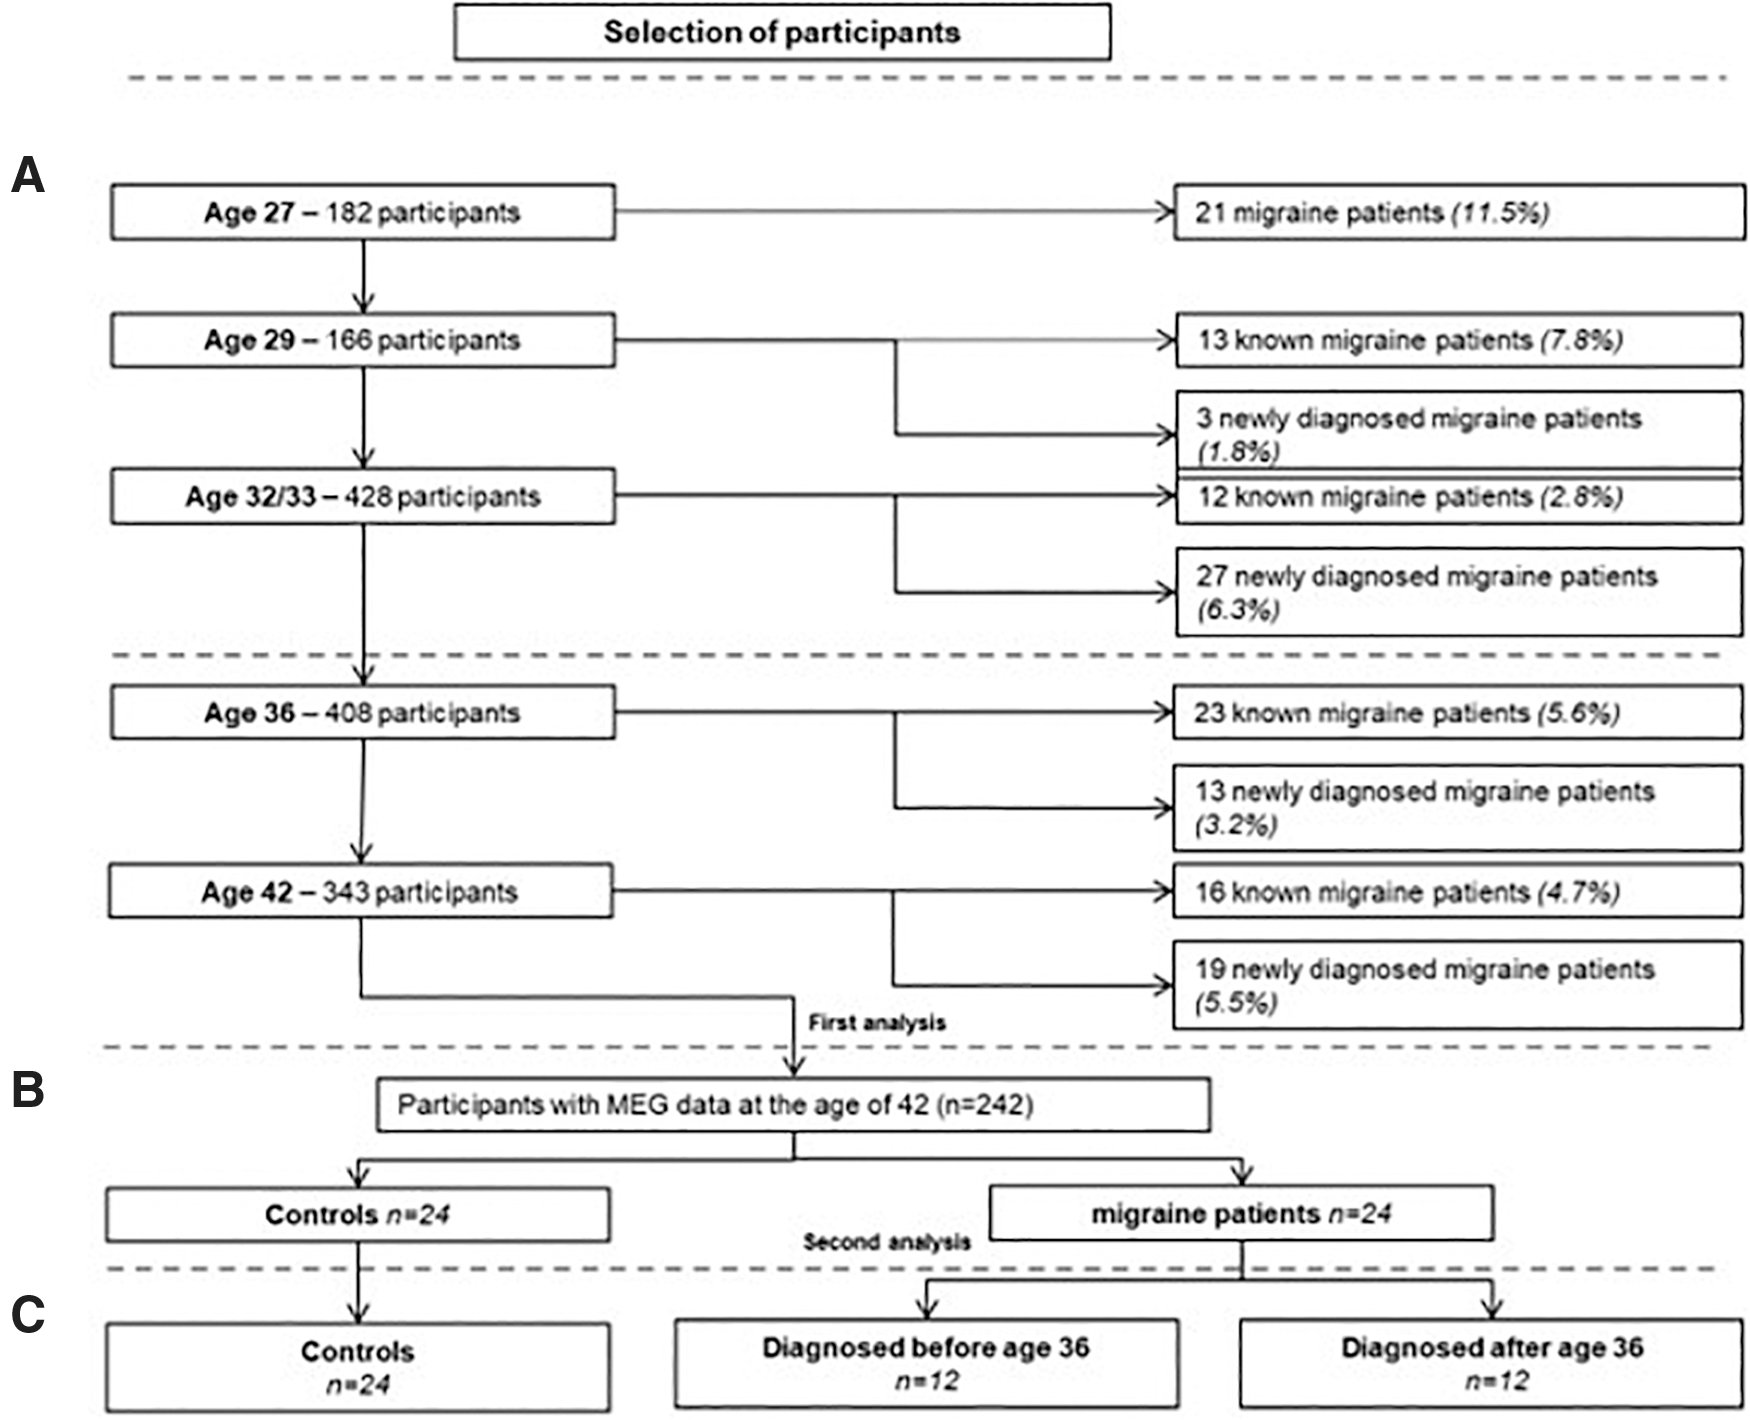
Flowchart of participant selection for the analysis.
General Characteristics of the Study Population
Data are means ± SDs.
M, males; F, females; VO2max, maximal oxygen uptake on a treadmill running test; SD, standard deviation; BMI, body–mass index.
Magnetoencephalography
As described in earlier MEG studies within this cohort, the MEG recordings were obtained using a 151-channel whole-head system (CTF Systems, Inc., Port Coquitlam, BC, Canada) while subjects were in supine position inside a magnetically shielded room to reduce background noise (Vacuumschmelze, Hanau, Germany) (Douw et al., 2014; Nieboer et al., 2016; Sorrentino et al., 2017). Recordings were obtained during a 5-min, no-task eyes-closed condition. The head position relative to the coordinate system of the helmet was recorded at the beginning and ending of each recording by passing small alternating currents through three head position coils attached to the left and right preauricular points and to the nasion. Head movements of at most 0.5 cm during acquisition were allowed. After visual inspection by two experienced raters (D.N. and P.S.), we selected artifact-free epochs of 4096 samples (6.554 sec) (Fraschini et al., 2016), that is, those that did not contain system-related artifacts, physiological artifacts, or excessive environmental noise. Subjects with at least 17 good epochs were selected for source reconstruction analysis (Brookes et al., 2008).
Source reconstruction
A template MRI was used for coregistration with the obtained MEG data since no MRI scans were available within this cohort. To label the voxels in the coregistered MRI, the voxels in the coregistered template MRI were labeled according to the automated anatomical labeling (AAL) atlas (Tzourio-Mazoyer et al., 2002) and 78 cortical parcels (Gong et al., 2009). The voxel at the centroid of each region was used to obtain a single time series for each region and is described in detail by Hillebrand and colleagues (2016). This centroid approach has been evaluated in the context of template MRIs (Douw et al., 2018) and applied previously within the AGHLS (Sorrentino et al., 2017).
The next step was to band-pass filter the MEG data between 0.5 and 48 Hz. The covariance matrix and a unity noise covariance matrix were used to reconstruct the normalized beamformer weights (Cheyne et al., 2007) for each centroid using synthetic aperture magnetometry (Robinson and Vrba, 1999). The time series of neuronal activation of each parcel's centroid was then subsequently estimated by projecting the data through these weights, resulting in 78 broadband time series of neuronal activation, that is, one for each of the 78 parcels of the AAL atlas. Further analysis was performed using BrainWave software (CJS, version 09.152.1.23, available from
Functional connectivity
The phase lag index (PLI) was used as a measure of functional connectivity. It quantifies the asymmetry of distribution of the instantaneous phase differences between two time series as follows:
where the phase difference
Brain network topology
To estimate the topological properties of brain activity, we constructed a network, whereby the regions were represented as nodes and the connectivity values as edges. From this network, we constructed the minimum spanning tree (MST), a subnetwork of the original weighted network that connects all nodes without forming loops and has the minimum total weight of all possible spanning trees. We used BrainWave software to construct the MST, which applies Kruskal's algorithm (Kruskal, 1956) to the weighted adjacency matrix. Because we were interested in the strongest connections, we used 1/PLI as the weight for each link when constructing the MST. Kruskal's algorithm ranks the links in ascending order and proceeds to attach all the links until all nodes are connected, discarding those links that (if added) would form a loop. The topology of the MST can be characterized with several measures (Boersma et al., 2013; Stam, 2014; Tewarie et al., 2015) (Table 2) on a global or nodal level.
Explanation of the Minimum Spanning Tree Metrics
MST measures and their definitions based on studies by Boersma et al. (2013) and Tewarie et al. (2014).
MST, minimum spanning tree.
It is then possible to compare the overlap of connections among groups with a reference MST. A reference MST (MSTref) was created from the MST of the group mean connectivity matrix from the healthy subject for each frequency band separately. The MST for each epoch of each subject was compared with this reference MST (Lee et al., 2006) as follows:
where MSTx refers to the MST reconstruction based on the epoch-specific adjacency matrix and M refers to the number of edges in the MST. Hence, for a single edge in a single epoch, if a link is either present or absent in both, it would count as one. If an edge is instead present in the MSTref, but absent in the single epoch MST (or vice versa), then it would count as zero. Finally, the number of overlapping edges was divided by the total number of edges, making the overlap range between 0 (no matching edges) and 1 (exact match) (Fig. 2). As a final step, all the MST overlap values belonging to one patient were averaged, hence retrieving one MST overlap per patient. On these values, group-level statistical testing was performed. An overview of the analysis pipeline can be found in Figure 3.
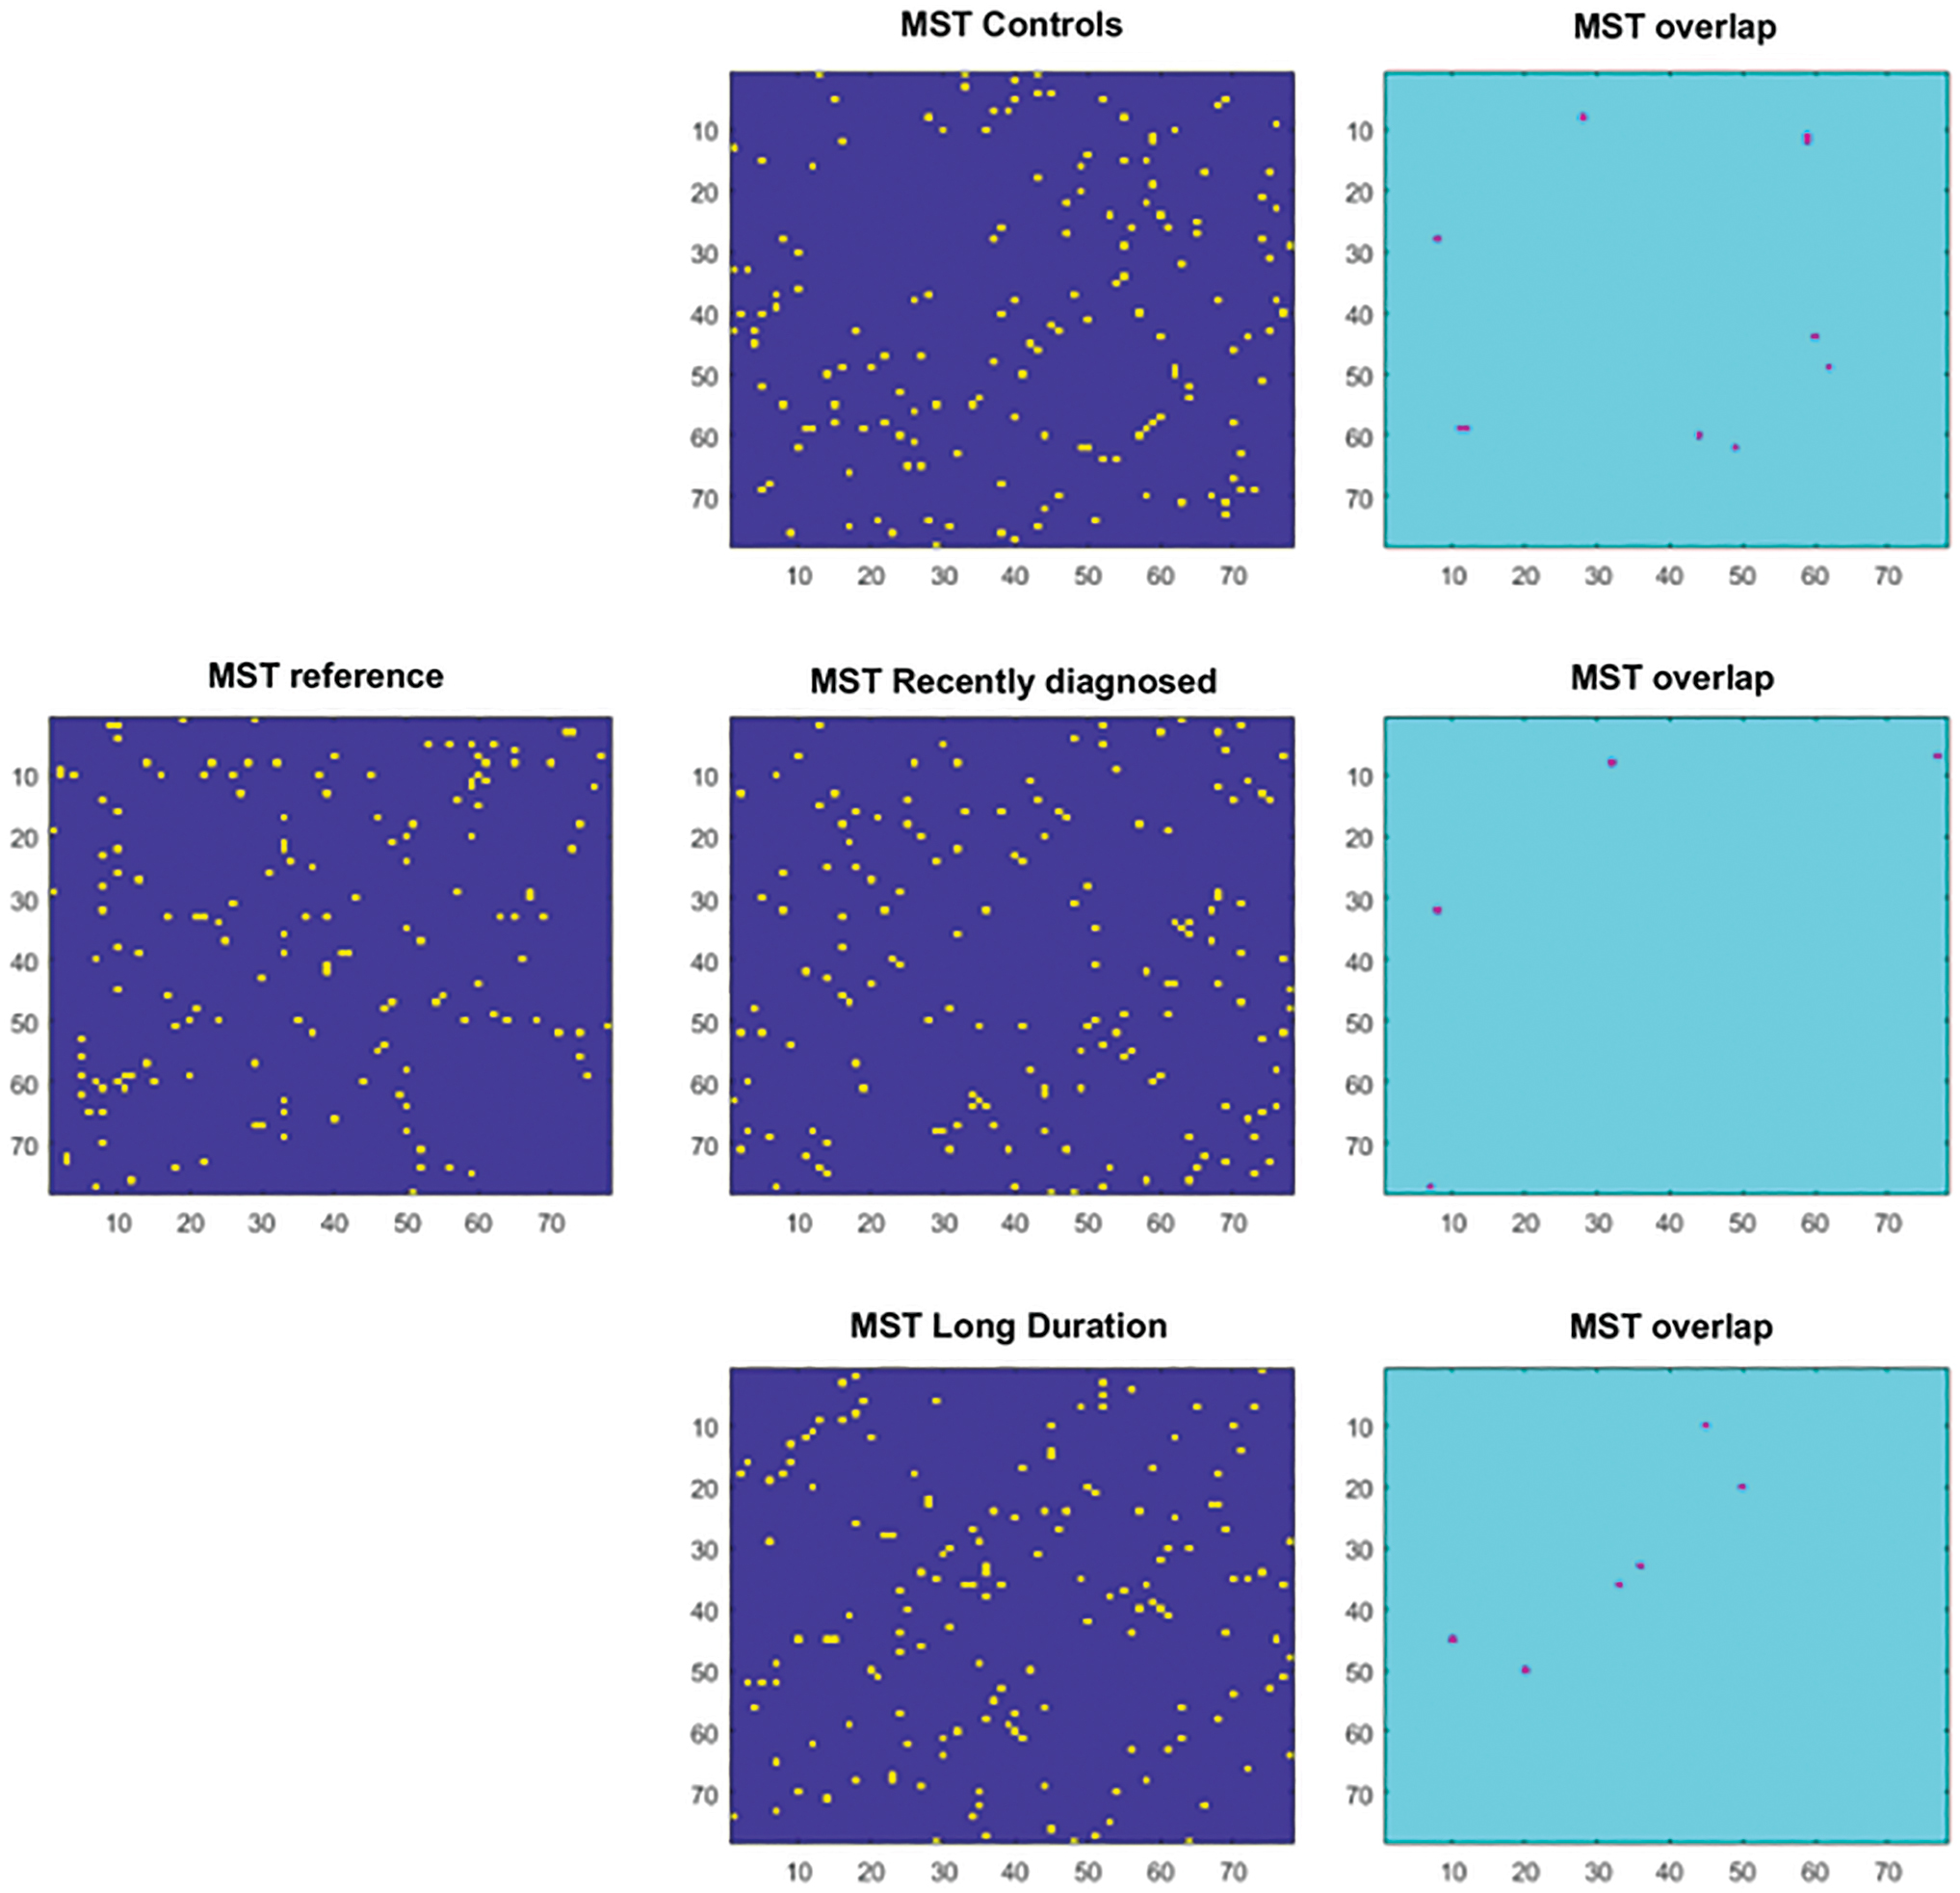
MST overlap: on the left, the reference MST, reconstructed from healthy subjects. In the middle column, the MST reconstructed for a randomly selected epoch for each of the three groups (healthy controls and recently diagnosed and long-term migraine patients). Yellow indicates a link is present, while blue means non link is present. In the right column, the resulting MST overlap is shown, which indicates for each element in the matrix, that is, each link in the MST, whether there is an overlap between a link in the MST for an epoch and the reference MST. Violet indicates overlap. MST, minimum spanning tree. Color images are available online.
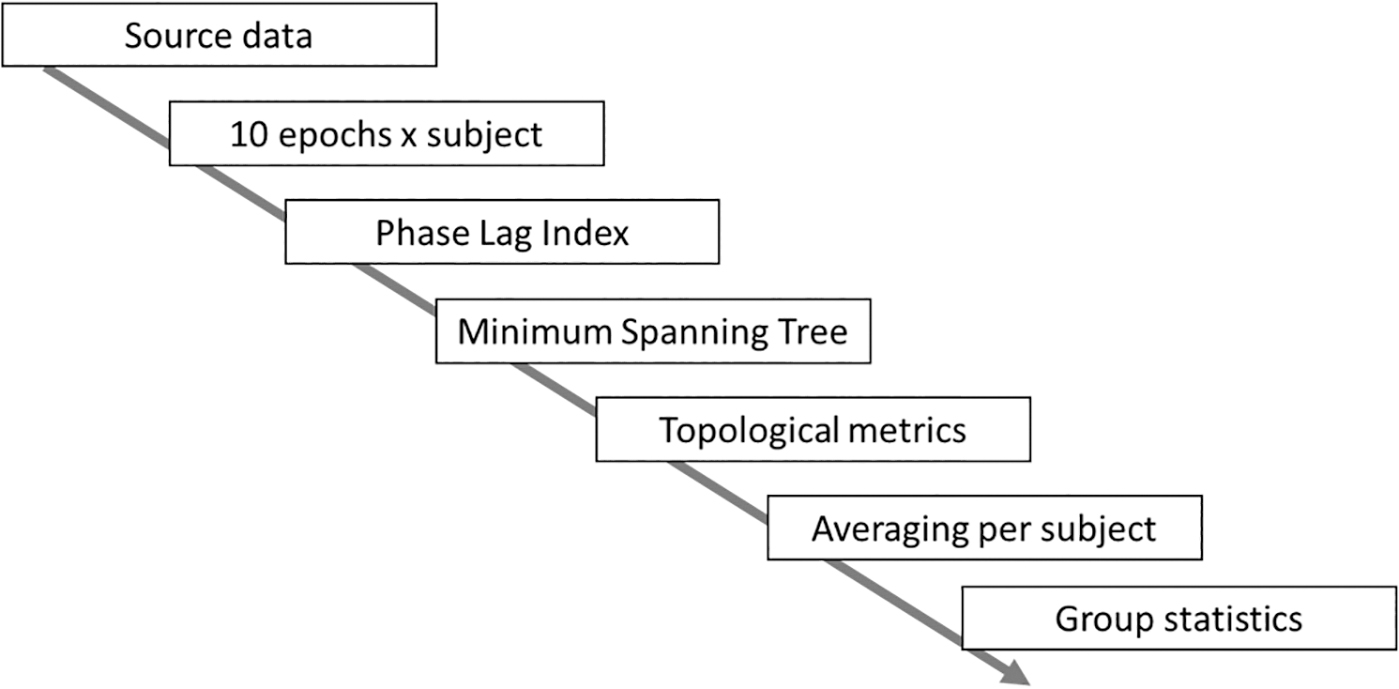
Analysis pipeline: 10 epochs were obtained from each subject. As a next step, the phase lag index was calculated as a measure of functional connectivity for each epoch, which was then used for reconstruction of the MST. The topological parameters were calculated based on each MST and then averaged per subject. The subject-specific topological values were used for further group statistics.
Global network topology
The degree of divergence (kappa), which is a measure that defines the broadness of degree distribution (the degree being the number of edges incident upon a given node), is an estimate of the resiliency of the network against targeted attacks. The diameter (D) represents the longest shortest path in the network. The leaf fraction (L) is the fraction of nodes with degree 1 present in the network. Finally, the tree hierarchy (Th) shows the balance between efficient communication and node overload prevention (Boersma et al., 2013; Stam, 2014) and is defined as:
where L is the leaf number (number of nodes with degree = 1), BC is the betweenness centrality (fraction of all shortest paths that pass through a particular node (Freeman, 1978), BCmax is the maximum BC across the network, and M is the number of links.
Nodal network topology
We calculated BC as a measure of node centrality. BC is defined as the number of shortest paths passing through a node divided by the total number of shortest paths (Table 2) that are present in the network. The shortest path between nodes A and B is the path between A and B with the smallest number of edges.
Statistical analysis
Non-normality of the distribution was inspected visually.
Group differences in the MSToverlap were tested using the Kruskal–Wallis test, followed by post hoc testing using the Tukey–Kramer test. Results across frequency bands were corrected with the false discovery rate. Only if there was a significant (p < 0.05) difference in the MSToverlap, the global PLI, global MST metrics, and centrality metrics were compared between groups using the Kruskal–Wallis test, followed by post hoc analysis (Tukey–Kramer). In detail, for BC, the values of each region were compared using the Kruskal–Wallis test, retrieving 78 p-values (i.e., one per region). The regions whose significance survived this step went ahead for post hoc analysis (across groups, corrected for multiple comparisons).
In addition, a leave-one-out sensitivity analysis was performed by iteratively removing one subject at a time to confirm that our group findings were not driven by a single subject. Furthermore, correlations between global network metrics were examined by Pearson correlation coefficients and can be found in Supplementary Table S1.
Results
Study population
Table 1 shows the main characteristics for the migraine patients (n = 24) and the sex-matched controls (n = 24) (Fig. 1A), as well as recently diagnosed (n = 12) and long-term (n = 12) subgroups (Fig. 1B).
MST overlap
The MST overlap showed statistically significant differences between groups in all frequency bands (p < 0.0001, corrected). The leave-one-out analyses confirmed that this result was not due to single outliers (Fig. 4). Post hoc analysis revealed that both recently diagnosed and long-term patients with migraine differed from controls in all frequency bands with respect to overlap (p < 0.0001, corrected).

Results of the leave-one-out approach (N = 48): in green, the distribution of p-values (in each iteration corrected for multiple comparisons across frequency bands using the false discovery rate) for the Kruskal–Wallis test, expressed in log scale. The red line shows the level of statistical significance. Color images are available online.
Functional connectivity
The analysis of the global mean PLI did not yield any significant differences between groups (Fig. 5).
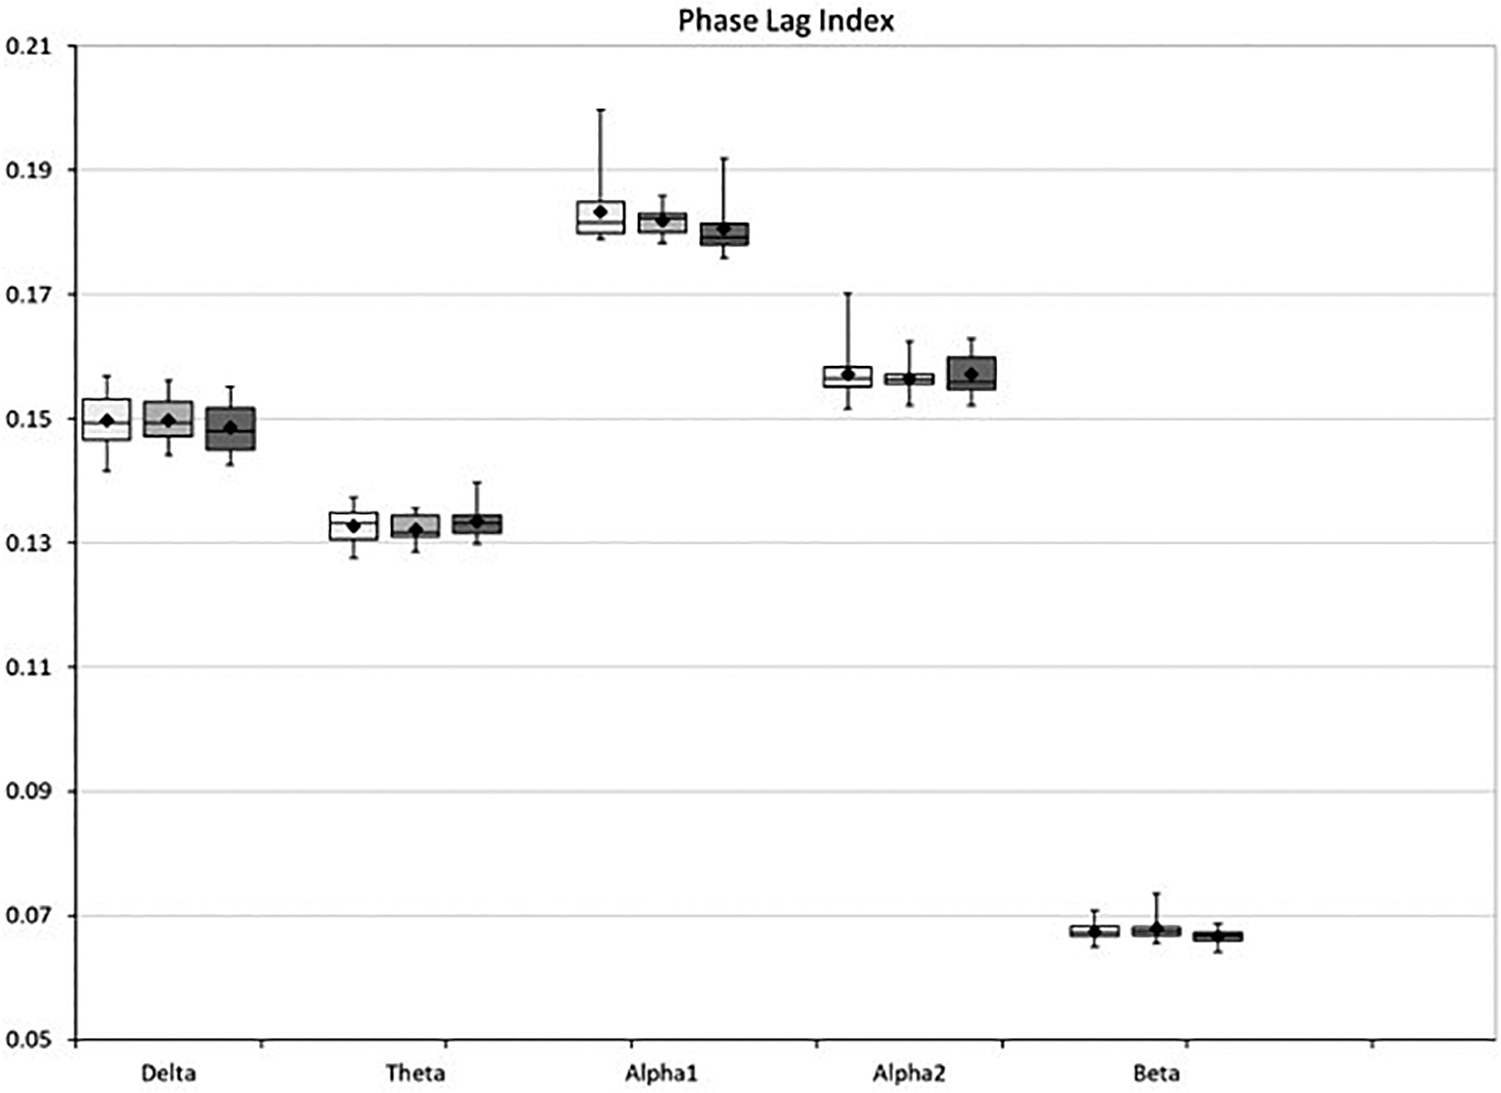
Box-whisker plot of the global functional connectivity (phase lag index) in healthy controls (white), recently diagnosed migraine patients (light gray), and long-term migraine patients (dark gray).
Global network topology
We computed global metrics for all frequency bands: the diameter, leaf fraction, and tree hierarchy, and compared them between the groups. No statistically significant differences appeared for these measures (data not shown).
Nodal network topology
We analyzed the BC for all 78 cortical regions (Fig. 6). In the delta band, a group difference of BC in the right precuneus was evident [H(2,47), p < 0.01]. In the post hoc analysis, this effect proved to be due to the long-term migraine patients who had lower BC compared with both recently diagnosed migraine patients and healthy controls (p < 0.01). In the theta band, the left gyrus rectus appeared to be different between groups [H(2,47), p < 0.0001]. In the post hoc analysis, this effect was related to the long-term migraine patients showing lower BC compared with the healthy controls (p < 0.01). In the alpha1 band, the paracentral lobule showed group-level differences in the right hemisphere [H(2,47), p < 0.01]. In the post hoc analysis, long-term migraine patients showed lower BC compared with healthy controls (p < 0.001). In the alpha2 band, the groups did not show any difference in BC. In the beta band, the right olfactory cortex showed differences among groups [H(2,47), p < 0.01]. Post hoc analysis revealed that this was due to the long-term migraine patients, who had higher BC compared with the controls (p < 0.001).
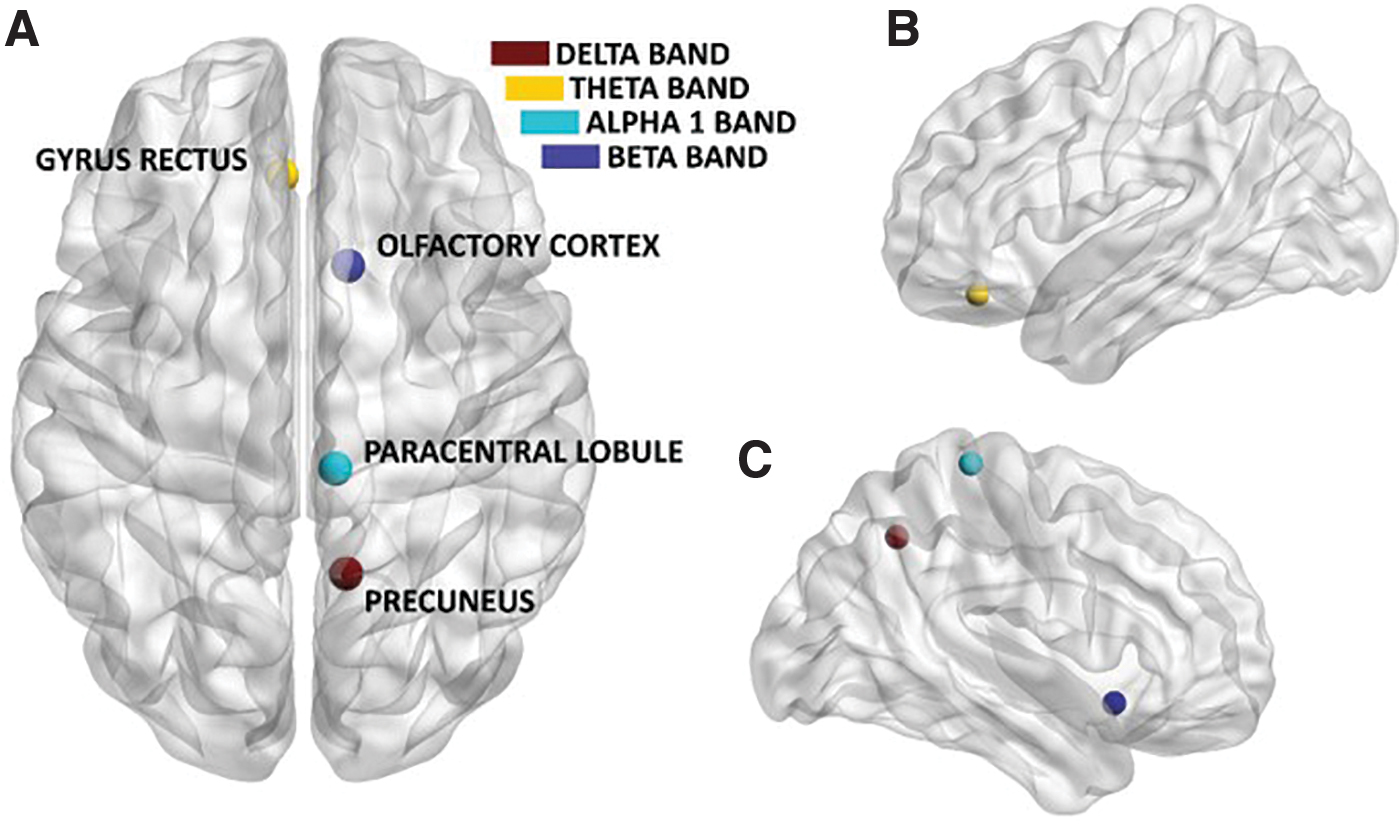
Significant difference in BC between patients with migraine and healthy controls, viewed from the top
Discussion
Neuroimaging studies in patients with migraine have confirmed that structural and functional alterations in the brain are not only limited to the moment of the migraine attack but are also present in the interictal phase. In this study, we set out to study functional brain network alterations in patients with migraine. Specifically, we hypothesized that the group differences would encompass increased connectivity and increased network integration in the migraineurs as structural network findings have implied such network topological alterations in literature.
While functional connectivity did not show any difference, frequency-specific topological rearrangements involving specific brain areas were demonstrated, whereby the centrality of specific brain areas was lower in migraineurs in the lower frequency band compared with the control group, while the opposite was observed in the higher frequencies. This finding is in line with previous literature showing that topological properties in the resting-state network change according to the specific frequency (Stam, 2004) and that the same pathological process can induce opposite shifts in low and high frequencies (Tewarie et al., 2014). Widespread changes in network organization have been reported previously (Liu et al., 2012, 2013; Wu et al., 2016). For instance, using fMRI, small worldness and efficiency alterations are observed in migraine patients (Li et al., 2017). Interestingly, such findings seem to capture a more connected network overall. Furthermore, a recent study using structural MRI has demonstrated the presence of alterations in the structural network properties of patients with chronic migraine (DeSouza et al., 2020). Many neurological diseases are characterized by changes in network topology as a result of disease progression, such as epilepsy (Van Dellen et al., 2009), Alzheimer's disease (Binnewijzend et al., 2012), mild cognitive impairment (Jacini et al., 2018), Parkinson's disease (De Schipper et al., 2018), amyotrophic lateral sclerosis (Sorrentino et al., 2018), and hereditary spastic paraparesis (Rucco et al., 2019). Within our study, differences were seen between long-term duration migraine patients and healthy controls with regard to their network topology, while no difference was evident between patients with short versus long duration of migraine. It is possible that differences in network topology are not yet present in those who are recently diagnosed with migraine. It is interesting that we report differences in network topology, but no differences in average functional connectivity between brain areas.
With respect to the regional analysis, we find that specific brain regions are different between patients and controls in a frequency-specific manner. Several of the nodes involved correspond to areas that have previously been described as main hubs in the human connectome and are hypothesized to be more likely to be targeted by pathological processes (Crossley et al., 2014). In the delta band, the right precuneus displayed lower BC in the long-duration patients compared with controls. Caution should be exercised when interpreting these results since the delta band is known to be noisy and is prone to artifacts (Goffaux et al., 2014). In the theta band, the left gyrus rectus showed lower BC for the patients compared with controls. Numerous studies have confirmed that frontal brain regions display altered functional connectivity in patients with migraine (Mainero et al., 2011; Maleki et al., 2011, 2013; Russo et al., 2017; Tessitore et al., 2013; Yuan et al., 2012). Interestingly, Liu et al. (2011) applied the network theory to resting-state fMRI data and found that the migraine patients display widespread lowering of BC, especially in the frontal regions. A more recent fMRI study showed widespread differences in static and dynamic functional connectivity between migraine patients and people suffering from persistent traumatic headache in pain-processing and visual-processing regions, showing high specificity of alterations in these disorders (Dumkrieger et al., 2019). In our data, the paracentral lobule also showed lower BC in migraine patients compared with controls in the lower alpha band. In the beta band, the right olfactory cortex showed higher BC in migraineurs compared with controls. This finding should also be interpreted with caution, considering that this is a structure where the MEG signal is not very reliable. A speculative interpretation might relate this finding to the well-proven hypersensitivity to olfactory stimuli in migraine (Demarquay et al., 2008; Harriott and Schwedt, 2014). Overall, multiple speculative interpretations might be proposed from the results. Previous literature shows that specific networks, such as the default mode network (DMN), are disrupted in migraine, possibly as part of a maladaptive response to stress. Our results add to these findings, showing that local centrality is different in migraineurs in a frequency-dependent manner. The fact that we observe topological changes specifically in long-term patients is compatible with the idea that these differences are related to chronification. More specifically, the fact that in lower frequency bands, the centrality is lower in long-term patients, while the opposite happens in the beta band, shows a shift of the relative importance of brain areas within the network. Finally, the lack of changes in global metrics suggests that network differences involve specific regions and/or subnetworks, rather than the whole network being in a different configuration.
Within our study, information about the intensity and frequency of migraine attacks was not available, but might be an important factor for disease progression. Moreover, in our study, around 17% of patients reported using prescription drugs to control their pain. This number is much lower in comparison with other sample surveys (Lipton et al., 2001, 2002; Morillo et al., 2005). The relatively low number of patients reporting drug use to control their migraine is in line with previous findings, showing that the AGHLS cohort is slightly biased as the participants within the study are healthier compared with the general population (Wijnstok et al., 2013). As a result, it is noteworthy that within this relatively healthy population, migraine-related differences in brain networks were observed. Furthermore, previous research indicates that there are sex-related differences in the resting-state networks in migraine sufferers (Liu et al., 2011), and it is known that women are three times more susceptible to migraine than men (Schroeder et al., 2018). The prevalence of migraine in our study population was indeed higher in women than in men, which might have influenced our results. As such, it is important to take sex differences into account in future MEG studies. Several lifestyle-related risk factors are also associated with migraine (i.e., overweight, low physical activity, and smoking) (Fernández-de-las-Penas et al., 2010; Robberstad et al., 2010). These risk factors were equally distributed among the subjects in our study, independently of their migraine status. However, it must be noted that the recently diagnosed group was slightly overweight according to their body–mass index status (26.5 ± 2.6), possibly confounding migraine. Moreover, a longitudinal study with a larger sample size and more detailed medical information about the exact onset of migraine, medication use, frequency of attacks, and severity is needed to further investigate the hypothesis regarding the process of chronification over time.
When interpreting our results, one should consider that the choice of functional connectivity measure does affect the results. Within this study, the PLI was chosen as a measure of functional connectivity. One of the main advantages of the PLI is that it is less sensitive to volume conduction than many other estimators of functional connectivity, which reduces the risk of falsely identifying connections that are due to volume conduction (Peraza et al., 2012). However, the PLI might underestimate connectivity at small time lags and has a low signal-to-noise ratio, which increases the risk of type II errors. Moreover, the functional network of the brain was captured with the MST, which can be seen as the backbone of the brain. We choose the MST as a principled way to avoid biases in network comparison across conditions and groups, even if the weight of the connections is different (Van Wijk et al., 2010). Moreover, MST measures correlate well with the full network measures (e.g., clustering and path length) (Tewarie et al., 2015). The MST favors stronger connections, but due to the objective of connecting all the nodes, weaker connections may also be taken into account. Alternative methods to achieve such an unbiased comparison exist, such as thresholding based on orthogonal minimal spanning trees (Dimitriadis et al., 2017) or based on efficiency–cost optimization (Fallani et al., 2017), and may be applied in future work.
Within the AGHLS cohorts, no MRI scans were available, and therefore the MEG data were coregistered with a template MRI. It has recently been shown that no differences for global and regional properties of reconstructed functional networks were evident when using either a native or template MRI for coregistration (Douw et al., 2018). Nonetheless, source reconstruction based on a template remains less precise compared with the use of the native MRI. This should be kept in mind when interpreting the results. In fact, Douw and colleagues (2018) used a healthy population. It must be acknowledged that migraine patients tend to have structural brain abnormalities (Bashir et al., 2013), therefore the template approach may not be optimal in severe cases of migraine. Moreover, we opted to exclude the gamma band due to relatively weak results with regard to the consistency of functional connectivity and network analyses when using a template MRI for coregistration with the MEG data (Douw et al., 2018). However, we do think that this band may contain important information in the context of migraine (Hall et al., 2004; Li et al., 2016; Liu et al., 2015). Future research should take this band into account, for example, with the use of native MRIs.
Conclusion
Our study shows that patients with migraine have a different network topology in the resting state compared with healthy controls, whereby specific brain areas have altered topological roles in a frequency-specific manner. Furthermore, some alterations appear specifically in patients with long-term migraine, which might show the long-term effects of the disease. The etiology of migraine is still poorly understood and information on the long-term effects is lacking. MEG will help to improve the knowledge of the frequency-specific network correlates of migraine. Therefore, more longitudinal studies are needed to determine if the alterations of the functional network topology we described can be used to elucidate pathophysiological mechanisms and to investigate the clinical course of migraine.
Footnotes
Author Disclosure Statement
No competing financial interests exist.
Funding Information
Since the start of the study in 1976, each wave of the Amsterdam Growth and Health Longitudinal Study was funded by a combination of grants. Grants were obtained from the Dairy Foundation, the Netherlands Heart Foundation, the Dutch Prevention Fund, Heineken BV, the Ministry of Public Health, Wellbeing and Sport (VWS), the Scientific Board of Smoking and Health, the Vrije Universiteit, and the Vrije Universiteit Medical Centre (grant number: 06/025).
Supplementary Material
Supplementary Table S1
References
Supplementary Material
Please find the following supplemental material available below.
For Open Access articles published under a Creative Commons License, all supplemental material carries the same license as the article it is associated with.
For non-Open Access articles published, all supplemental material carries a non-exclusive license, and permission requests for re-use of supplemental material or any part of supplemental material shall be sent directly to the copyright owner as specified in the copyright notice associated with the article.