
Abstract
High rates of variability in the amplitude of transcranial magnetic stimulation (TMS)-induced motor evoked potentials (MEPs), a popular method for assessing corticospinal excitability (CSE), make it essential to examine inherent reliability of the MEP amplitude. We aimed to investigate the effects of different intertrial intervals (ITIs) of single-pulse TMS on the amplitude, variability, and test-retest reliability of MEPs. Twenty-five TMS single pulses were recorded at four different ITIs of 5, 10, 15, and 20 sec from 15 healthy participants who attended two experimental sessions. Repeated measures analysis of variance (rmANOVA) and standardized z-value standard deviations (SDs) were used to investigate the effects of ITIs on MEP amplitudes and variability. Test-retest reliability of MEP amplitudes was also assessed using rmANOVA and intraclass correlation (ICC). rmANOVA revealed significantly larger MEP amplitudes following ITIs of 10, 15, and 20 sec compared with ITI 5, with no significant increases between ITIs of 15 and 20 sec. Standardized z-value SDs revealed variability rate reduction following longer ITIs with significant reductions occurring following ITIs of 10, 15, and 20 sec compared with ITI 5 with no significant difference between ITIs of 15 and 20 sec. rmANOVA showed no significant Time main effect on the MEP changes confirming within- and between-session agreement. ICCs reported significant within- and between-session reliability in all selected ITIs. The findings of the current study indicate that longer ITIs up to 15 sec can significantly induce larger MEPs with lower variability and higher reliability. The increase in ITIs not only reduces the chance of TMS-induced changes in CSE but also helps us to use this assessment tool in studies with smaller sample sizes.
Introduction
Transcranial magnetic stimulation (TMS) is a noninvasive brain stimulation technique. It can be used to investigate the integrity and excitability of the corticospinal pathways for different muscles in the human primary motor cortex (M1) (Barker et al., 1985). Application of suprathreshold TMS pulses over M1 induces motor responses, which can be recorded by surface electromyography (EMG) electrodes from the target muscle. These responses are known as motor evoked potentials (MEPs). The peak-to-peak MEP amplitude is used as an index of corticospinal excitability (CSE) changes (DiLazzaro et al., 2004; Priori et al., 1998). Larger MEPs indicate higher levels of CSE (Nitsche and Paulus, 2000). It is generally believed that single-pulse TMS (spTMS), as an assessment tool that is applied at a defined intertrial interval (ITI), does not change the CSE by itself (Kiers et al., 1993; Pell et al., 2011).
Two common characteristics of the recorded MEPs are amplitude and latency. Amplitude represents the net excitatory and inhibitory changes on corticospinal pathways (Kamen, 2004). It has been shown that changes in MEP amplitudes could exhibit physiological and pathological changes in the corticospinal tract and intracortical circuits (Chen et al., 2008). MEP latency, on the other hand, is an indication of the time needed for the pulse to reach the targeted muscle throughout the pathway. Latency is relatively more stable compared with the highly variable MEP amplitude (Kiers et al., 1993).
While TMS has been used for several decades as a reliable measurement tool (Kamen, 2004; Nitsche and Paulus, 2000), some of its fundamental methodological principles have not been sufficiently analyzed. A measurement tool should be reliable and valid, producing accurate and meaningful data (Portney and Watkins, 2015). Reliability refers to similar results of repeated measures in the same individuals. It is a degree to which repeated measurements provide similar results over time (de Vet et al., 2006). TMS, as a reliable measurement tool, must induce comparable MEPs at different testing sessions over time in the absence of an intervention (Christie et al., 2007; Lexell and Downham, 2005). Different physiological and technical factors, including muscle activity, attention, stimulation intensity, waveform, coil placement, and ITI, could affect MEP amplitudes and contribute to variability in CSE measurements (Ridding and Ziemann, 2010). These confounding variables could directly reduce the reliability of CSE measurements (Wassermann, 2002). Therefore, there is always the risk of whether CSE changes are due to real neurophysiological changes induced by an intervention or the result of one or more of the abovementioned factors (Schambra et al., 2015). Thus, these confounding factors may violate common assumptions about the effects of spTMS, delivered in sequence, on CSE as a highly reliable and less variable tool. It has previously been reported that TMS with longer ITIs induced MEPs with higher stability and lower variability, reflected in the input–output curve (Moller et al., 2009). Later, it was explained that despite a linear correlation between MEP and ITI, there was no significant difference between the fixed and random ITI range (<10 sec) (Julkunen et al., 2012; Pellicciari et al., 2016). While an increasing number of studies in this field confirms the importance of the research on the effect of ITIs on the MEP amplitude, there are several shortcomings in this area that have not been systematically investigated. Majority of the studies on this topic only investigated the effects of two ITIs (fixed or random range), mainly focused on the conventional ITI (<10 sec) (Cuypers et al., 2014; Julkunen et al., 2012; Moller et al., 2009; Pellicciari et al., 2016; Stamoulis et al., 2011; Vaseghi et al., 2015). Because it takes about 12 sec for the brain perfusion to return to baseline (Thomson et al., 2012), finding and comparing the effects of ITIs higher and lower than 12 sec on CSE changes seem to be essential. The current study not only tried to find a response to this gap in the literature but also aimed to investigate the MEP variability and reliability following different ITIs systematically. It should be noted that in this study, we controlled the abovementioned physiological and technical factors (Ridding and Ziemann, 2010) to reduce their potential effects on CSE changes.
In summary, the main aim was to compare the effects of four ITIs (5, 10, 15, and 20 sec) on size, variability, and reliability of MEP amplitudes. There were three main hypotheses in this study: (1) longer ITIs would induce larger MEP amplitudes; (2) MEP amplitude variability is lower at longer ITIs; and (3) longer ITIs would induce higher within- and between-session reliability.
Materials and Methods
Participants
Fifteen participants (9 females) aged 19–40 years (mean ± standard deviation [SD]: 24.06 ± 5.37) participated in this study. All participants were right-handed according to the Edinburgh handedness questionnaire (Oldfield, 1971) and screened for any contraindication to TMS, including the history of medical, neurological, psychiatric, or psychological disorders (Keel et al., 2001; Rossi et al., 2009). All participants gave a written consent form before experimental sessions. Each participant attended two main testing sessions with at least a 48-h between-session interval. The study was conducted according to the Declaration of Helsinki and approved by the Human Research Ethics Committee at Monash University.
Electromyography
Surface EMG was recorded from the right first dorsal interosseous (FDI) muscle using a pair of Ag-AgCl electrodes taped with a 2-cm distance in belly-tendon orientation. A ground electrode was placed over the ulnar styloid process at the wrist. The skin of FDI was gently abraded and then cleaned to reduce electrode–skin impedance and improve the recorded EMG responses (Gilmore and Meyers, 1983). Signals with a sampling rate at 1000 Hz were amplified ( × 1000) before being band-pass filtered (10–500 Hz) (PowerLab; ADInstruments, Australia) and stored using LabChart™ software (ADInstruments) in a laboratory computer for further off-line analysis. During the experiments, complete muscle relaxation was controlled by visual EMG feedback, and participants were instructed to relax their hand (FDI) when necessary.
TMS procedure
Participants were comfortably seated in an adjustable chair with the right forearm and hand resting on the armrest and did not wear earplugs. TMS was performed using a 70-mm figure-of-eight coil (MagVenture, Farum, Denmark) with a biphasic current waveform. The TMS coil was held tangentially to the skull with the handle pointed backward and 45° away from the sagittal plane (Brasil-Neto et al., 1992; Kaneko et al., 1996; Mills et al., 1992). The optimal coil positioning on M1, hot spot, was identified for induction of the largest MEP amplitudes in the relaxed right FDI muscle. The vertex (Cz) location was measured using the international electroencephalography (EEG) 10–20 system and marked to be used as a reference (Schwartz and Andrasik, 2017). Then, an FDI hotspot was marked on the scalp with a soft-tipped marker by moving 5 cm lateral (toward the left external auditory meatus) and slightly anterior to Cz. These markings ensured the reproducible positioning of the TMS coil throughout the experimental sessions. This process was repeated in both testing sessions. Resting motor threshold (rMT) at the FDI hot spot was obtained using parameter estimation by the sequential testing (PEST) protocol. This protocol was followed using the TMS Motor Threshold Assessment Tool (Freeware, MTAT 2.0; Awiszus and Borckardt, 2011). The program started with a TMS intensity of 37% of stimulator output. The intensity for the next TMS trial was determined based on rater interaction with the software. Indeed, the rater indicates whether the trial was successful by clicking on the Y key or not (click on the N key). It was a success if MEP amplitudes ≥0.05 μV and then a new intensity displayed for delivery. The protocol stopped after 20 stimuli, which provide sufficient accuracy for rMT estimates within limits imposed by safety guidelines (Awiszus, 2011; Rossi et al., 2009). As the second session of assessment was not carried out in more than 48 h from the first session, the traces of markings still remained on the scalp. However, all measurements for identification of the hot spot were repeated to make sure that the marked hot spot induced the largest MEP amplitude compared with nearby points. The consistency for the hot spot was also confirmed with no significant difference between mean rMT values of the two sessions. Moreover, unlike a previous study (Bastani and Jaberzadeh, 2012), which was designed based on a combined hot spot for FDI and extensor carpi radialis (ECR) muscles, the current study used the exact hot spot for FDI muscle. Based on the study by Ridding and Ziemann (2010), it is necessary to control all confounding factors, including attention as it could contaminate the real changes following TMS measurements. For example, if participants even think about hand movements, based on the concept of mirror neurons, it may affect the MEP amplitude. Therefore, participants were asked to count the number of stimuli they received to minimize the changes in their attention.
Experimental procedure
All participants attended (three sets of data collection) two experimental sessions. Session 1 included two sets of data collection (T1 and T2) separated by a 20-min rest, while session 2 only included one set of data collection (T3). The order of four ITIs was pseudo-randomized using computerized randomization software (

Experimental design. Twenty-five TMS-induced MEPs were recorded at four selected ITIs. There were two sets of data collected at session 1 separated by a 20-min resting period. There was a 48-h interval between sessions 1 and 2. ITI, intertrial interval; MEP, motor evoked potential; TMS, transcranial magnetic stimulation.
Data analysis
SPSS 25 (IBM Corporation, NY) was used for data analysis. Peak-to-peak MEP amplitude was measured automatically using LabChart software (ADInstruments). Then, CSE changes were determined by averaging 25 MEPs at each time point (T1, T2, and T3) for each ITI. To measure MEP variability, SDs of mean standardized z-scores of 25 MEPs were used for each participant (n = 15), ITI (n = 4), and time point (n = 3). Normal distribution of MEP amplitudes and z-value SDs were tested using the Shapiro–Wilk test, and where required, log transformations of data were performed to correct the skewness of data.
ITI and MEP amplitude
A two-way repeated measures analysis of variance (rmANOVA) was conducted to test the effect of ITI and Time on log-transformed MEPs. To test sphericity, Mauchly's test was carried out, and in case of sphericity violation (p < 0.05), Greenhouse–Geisser correction was used. Post hoc analysis using Bonferroni correction was used to assess multiple comparisons wherever a significant main or interactive effect was revealed (p = 0.05).
ITI and MEP variability
A two-way rmANOVA was used to investigate the effect of ITI and Time on log-transformed, standardized z-score SDs. When a significant main or interaction effect was found, post hoc pairwise comparisons were performed using Bonferroni correction (p = 0.05).
ITI and MEP reliability
Within- and between-session reliability values of measured MEPs for each ITI were examined using the intraclass correlation (ICC) coefficient with 95% confidence interval (Portney and Watkins, 2015). A two-way mixed-effects model (ICC3, 1) was used to examine the consistency of estimates (Shrout and Fless, 1979). The reliability coefficient ranges from 0 to 1, with values closer to 1 representing stronger reliability. It has been suggested that coefficients were considered poor for ICC <0.4, fair for 0.4 ≤ ICC ≤0.58, good for 0.59 ≤ ICC ≤0.75, and excellent for ICC ≥0.75 (Cicchetti et al., 1981). ICC tests were used to assess agreement between repeated measurements for each ITI. The significance level was set at the level of 0.05.
Results
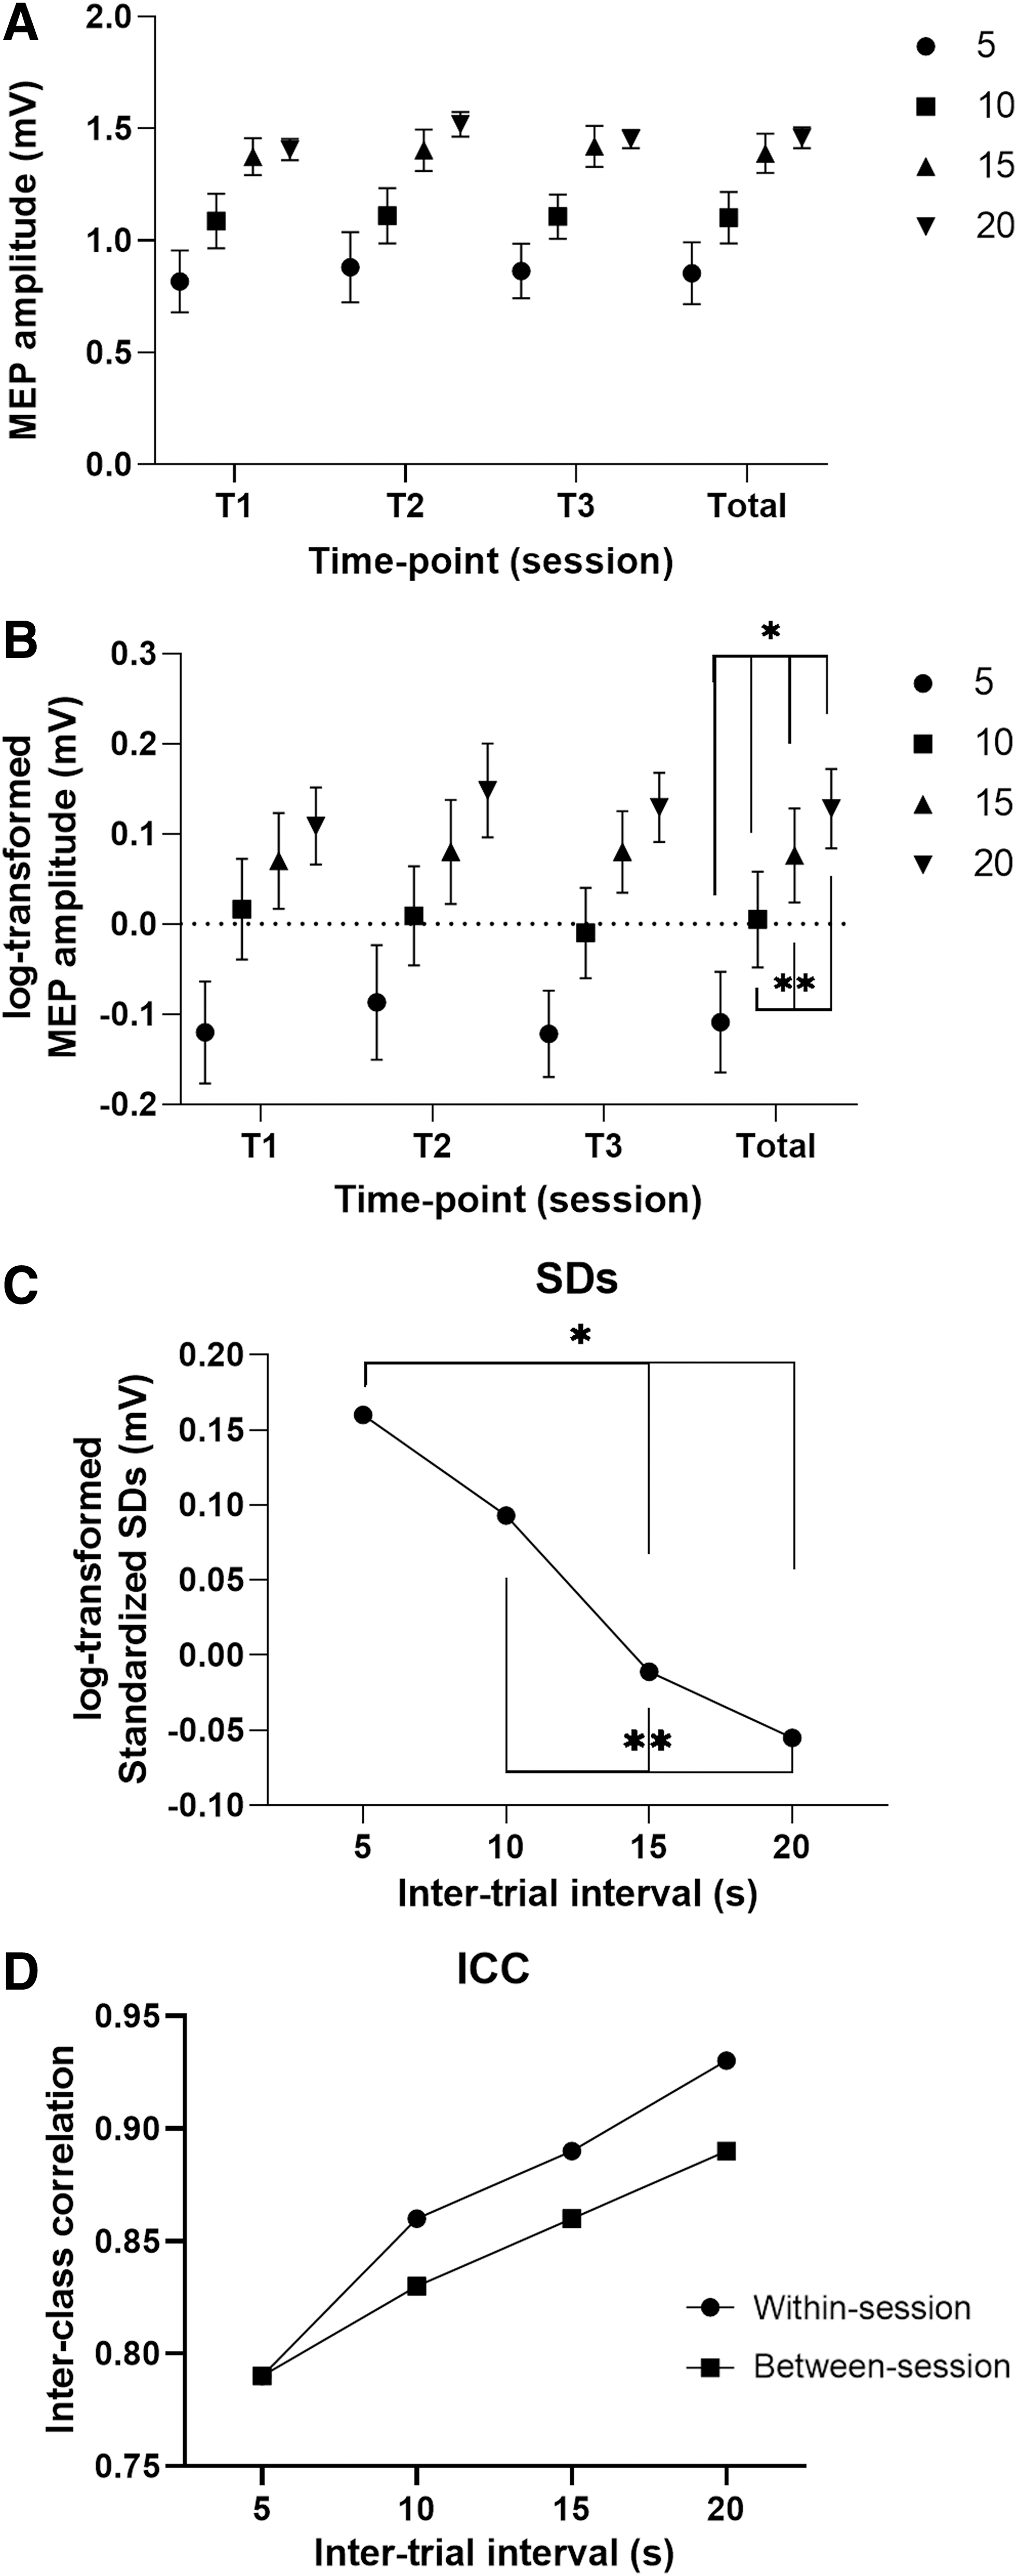
All participants completed both experimental sessions. Mean rMT was 36% of stimulator output (36.2 ± 5.3) for session 1 (T1 and T2) and 35% (34.6 ± 4.8) for session 2 (T3). As MEP amplitudes and z-value SD measurements did not follow normal distribution, log transformations were performed to correct data skewness. Figure 2 presents the MEP amplitude (raw and log-transformed), SDs, and reliability plots.
Effects of ITIs on
Hereafter, in all remaining sections, MEP(s) and SDs were used instead of their full-term of log-transformed MEP and long-transformed, standardized z-value SDs, respectively.
ITI and MEP amplitude
Two-way rmANOVA showed a significant ITI main effect on MEPs (F (3, 42) = 12.39, p < 0.001, ηp 2 = 0.46). Moreover, there was no significant Time main effect and ITI × Time interaction on MEPs (F (2, 28) = 0.13 and F (6, 84) = 0.58). Post hoc comparison using the Bonferroni correction indicated that mean MEP amplitude increased as ITI increased up to 15 sec. There was a significantly lower mean score of MEP amplitude at ITI 5 compared with 10, 15, and 20 sec (p < 0.01) and at ITI 10 with 15 and 20 sec (p < 0.01). However, there was no significant difference between the mean score of ITIs of 15 and 20 sec (p = 0.25; Fig. 2B).
ITI and MEP variability
rmANOVA revealed a significant ITI main effect on SDs (F (3, 42) = 14.27, p = 0.002, ηp 2 = 0.505) (Fig. 2C). However, there was no significant Time main effect and ITI × Time interaction on SDs (F (2, 28) = 2.94, and F (6, 84) = 0.33). The post hoc comparison showed that while ITIs increased, SDs decreased. SDs did not reduce significantly from 0.16 at ITI 5 to 0.11 at ITI 10 (p = 1.000). Then, SDs significantly reduced to −0.012 at ITI 15 (p = 0.003). Further reduction was revealed at ITI 20, reducing to −0.055 (p = 0.002). However, there was no significant reduction following ITI 15 to 20 sec (p = 0.491; Fig. 2C).
ITI and MEP reliability
rmANOVA revealed no significant Time main effect on MEP amplitudes (F (2, 28) = 1.86, p = 0.189, ηp 2 = 0.11). A comparison of mean MEP amplitude following different ITIs shows more consistency in MEP amplitudes following longer ITIs (10, 15, and 20 sec). The pairwise comparison did not show any significant difference in mean MEP values following measurements by the same rater on two different days; this reveals agreement of within- and between-session reliability and confirms intrarater reliability.
Within-session reliability
ICC tests showed significant within-session reliability for all ITIs at three time points. By increasing the ITI, reliability gradually improved from good correlation of 0.79 at 5 sec to excellent at 10 sec (r = 0.86), 15 sec (r = 0.89), and 20 sec (r = 0.90).
Between-session reliability
ICC tests showed high intersession reliability with a good correlation of 0.79 at ITI 5 that increased to the excellent level of 0.83, 0.86, and 0.89 at 10, 15, and 20 sec, respectively.
Figure 2D shows within- and between-session reliability of MEPs using different ITIs.
Discussion
The current study was designed to systematically investigate the effect of ITIs on size, variability, and reliability of MEP amplitude. Our findings indicated that there is a positive linear correlation between the ITI and MEP amplitude. It was also found that variability significantly reduced, while MEP reliability increased, as the ITI was becoming longer. Therefore, all original hypotheses are strongly supported by the findings of this study.
ITI and MEP amplitude
We hypothesized that longer ITIs would induce larger MEP amplitudes. The current findings supported this hypothesis. Our findings were in line with the findings of different studies regardless of methodological differences (Julkunen et al., 2012; Moller et al., 2009; Pellicciari et al., 2016; Vaseghi et al., 2015). Based on previous studies, it was shown that MEP amplitudes increased when ITIs increased from 5 to 20 sec (Moller et al., 2009), 5 to 10 sec (Julkunen et al., 2012), and 4 to 10 sec (Vaseghi et al., 2015). This positive linear relationship between ITI and MEP amplitude revealed that the general assumption regarding the independency of spTMS pulse and ITI is not valid and can be violated under certain conditions, for example, using a shorter ITI, that is, 5 sec (Moller et al., 2009). It has been explained that each TMS pulse could change cerebral hemodynamics of the stimulated area by affecting cerebral vessels through vasoconstriction and reduction of blood flow. It has been shown that it takes about 8–10 sec for the cerebral blood flow to return to the prestimulation baseline state (Thomson et al., 2012). These hemodynamic changes would significantly reduce the Oxy-Hb (HbO) concentration, which takes about 15 sec to return to the baseline (Mochizuki et al., 2006). Indeed, these changes could explain smaller MEPs following shorter ITIs (5 and 10 sec) as there was not enough time (<12 sec) for cerebral hemodynamic changes to return to the baseline level before the next upcoming TMS pulse. In addition, no significant difference between ITIs of 15 and 20 sec on MEP amplitudes would indicate enough time between consecutive pulses (>12 sec) for cerebral changes to return to baseline (Furubayashi et al., 2013). Furthermore, it has also been shown that consecutive pulses could also have a cumulative effect on each other (Pellicciari et al., 2016; Stamoulis et al., 2011), affecting the size of MEP amplitudes. Indeed, each pulse provides a neuronal history for subsequent pulses that could cancel further enhancement in MEP amplitudes following shorter ITIs compared with longer ones. Moreover, this cumulative effect seems to diminish gradually as ITIs increased from 5 to 20 sec, reflecting in the larger size of MEP amplitudes.
ITI and MEP variability
We hypothesized that longer ITIs would induce less variable MEPs compared with the shorter ones. The current findings strongly supported this hypothesis. The results indicated an inverse relationship between the length of the ITI and MEP variability. Findings revealed that the SDs reduced when ITIs got longer from 5 to 20 sec. This finding is supported by several studies regardless of methodological differences (Julkunen et al., 2012; Moller et al., 2009; Pellicciari et al., 2016; Schmidt et al., 2009). It has been shown that compared with ITI 5, MEP variability decreased following ITI 20 (Moller et al., 2009). In another study, less consistency of MEP amplitudes has been confirmed following the use of a short ITI of 3 sec (Schmidt et al., 2009). Moreover, it has been indicated that ITI <10 sec would not necessarily guarantee the stabilization of MEP measurements because of the high variability following ITIs from 1 to 10 sec (Julkunen et al., 2012).
In addition, some studies revealed that MEP amplitude variability could be affected by the carryover effect of each pulse on subsequent pulses, mainly when shorter ITIs are used. It has been shown that spTMS could prime baseline neuronal activities and increase background excitability for subsequent pulses in ITIs ≤5 sec (Pellicciari et al., 2016). This change, therefore, highlights the cumulative effects of each pulse on consequent pulses, especially if the ITI is not long enough for neuronal hemodynamic changes to return to baseline (Furubayashi et al., 2013; Mochizuki et al., 2006; Nilsen, 1996; Schmidt et al., 2009). Therefore, this could increase MEP variability following shorter ITIs compared with longer ones.
Although literature indicates a number of possible mechanisms, including hemodynamic and neurophysiological mechanisms for regulation of changes at the stimulated area following different ITIs, there is still no consensus on the exact mechanisms behind variability changes in MEP amplitude.
ITI and MEP reliability
We hypothesized that the overall within- and between-session MEP reliability would increase following longer ITIs. This hypothesis was strongly supported by the findings in the current study.
Within-session reliability
The current results indicated a linear relationship between the MEP reliability and ITI up to 15 sec. There was good to high within-session reliability for each ITI; however, longer ITIs had a higher level of ICC and agreement. Within-session reliability values in this study are supported with findings of previous studies reporting good to high levels of ICC: 0.65–0.83, Christie and associates (2007); 0.79–0.97, Bastani and Jaberzadeh (2012); and 0.79–0.96, Vaseghi and associates (2015). On the other hand, our findings are negated by the results of Julkunen and associates (2012) as they revealed that MEP changes were not time invariant (Julkunen et al., 2012). The discrepancy may be related to the methodological differences between these studies. While in the current study, we did reliability measurements in different experimental sessions (method section), Julkunen and associates (2012) split 30 recorded MEPs into three blocks of 10 MEPs and did the within and between comparisons in these blocks to investigate the time invariance of MEP amplitudes.
Between-session reliability
The current findings on between-session reliability revealed high ICC values for all ITIs, with the highest level for 20 sec, which supported our hypothesis. Our findings on reliability values, including ICC and agreement, are supported by previous studies showing values ranging from 0.8 to 0.87 in the study by Bastani and Jaberzadeh (2012) and 0.84 to 0.97 in the study by Vaseghi and associates (2015).
Limitations
The findings in the current study should be interpreted considering the following limitations. First, the current sample size was low; therefore, a generalization of the findings to a larger population is hard. Further studies with larger sample sizes are required to ensure generalization of the findings to a larger population. Second, even though the current study showed that variability decreased following longer ITIs, it should be emphasized that the source of variability is multifactorial and other factors such as age, gender, coil positioning, and attention level (Li et al., 2015; Ridding and Ziemann, 2010) should be considered in future studies. Moreover, the current study was done on young and healthy individuals. Therefore, the findings might not be extrapolated to other age groups and patients with different pathological conditions. Furthermore, while a number of studies suggested that the neuro-navigational systems provide more robust data compared with detection of hot spots using conventional methods (Sparing et al., 2008), other studies have shown that the intrasubject and intersubject variability remains high (Gugino et al., 2001; Julkunen et al., 2009; Jung et al., 2010) in the assessments using neuro-navigational systems. It should be noted that the current study utilized conventional methods for determination of the hot spot and therefore interpretation of data should be considered accordingly. Finally, the findings in this study are only applicable to the use of TMS as a measurement tool. Therefore, we cannot extrapolate these findings into the context of rTMS, which is mainly a therapeutic technique.
Future directions
In the current study, the outcome measure of interest was the MEP amplitude. Future studies should also check the effects of ITI on neurophysiological measures such as indices of intracortical excitation or inhibition, which will shed light on the underlying mechanisms behind changes in MEP amplitude. Due to the differential effects of hormones on males and females, the study of gender effects on the MEP size and their variability seems to be necessary. In addition, further investigations comparing different TMS intensities at both resting and active conditions are recommended. Furthermore, technical factors such as coil shape, coil direction, waveform, frequency, target muscle, and different intersession intervals may also affect the findings. Therefore, further studies are required to investigate the effects of these technical factors. As was also recommended previously (Stamoulis et al., 2011), longer ITIs seem to be safer than shorter ITIs (<10 s). Thus, in some clinical applications, it may be appropriate to use longer ITIs, especially when high numbers of pulses are required. Finally, due to dependency of the MEP amplitude on ITI, it seems to be useful to add the ITI as a modulatory criterion to the international checklist for application of investigational TMS.
Conclusions
The present study concluded that longer ITIs are associated with larger, less variable, and highly reliable MEP amplitudes. The findings confirm the superiority of longer ITIs for assessment of TMS-induced MEPs. The use of longer ITIs is more significant when a higher number of pulses are necessary for the assessment of corticospinal and cortico-cortical circuits. Indeed, longer ITIs would minimize the possible modulatory effects of TMS pulses on the effects of subsequent interventions. Therefore, it is highly recommended to report ITI in all TMS measurements.
Authors' Contributions
M.H.Z. and S.J. conceived and designed the study and interpreted the findings; M.H.Z. performed data collection, conducted the analysis, and wrote the manuscript; and M.H.Z., M.Z., and S.J edited the drafts.
Footnotes
Author Disclosure Statement
No competing financial interests exist.
Funding Information
This research did not receive any specific grant from funding agencies in the public, commercial, or not-for-profit sectors.