
Abstract
Human cognition and behavior emerge from neuronal interactions on a brain structural architecture. The convergence (or divergence) between functional dynamics and structural connectivity (SC) and their relationship with cognition are still a pivotal question about the brain. We focused on the information processing speed (IPS), assessed by the Symbol Digit Modalities Test (SDMT), once delayed IPS underlies attention deficits in various clinical conditions. We hypothesize that the SC constrains but does not determine functional connectivity, and such a relationship is related to the cognitive performance. Blood oxygenation level-dependent and diffusion tensor images of healthy young volunteers were acquired in a 3T magnetic resonance imaging machine. Activation maps included the left and right middle frontal gyri, left superior parietal lobule, left precuneus, left inferior frontal gyrus (IFG), right cuneus, left lingual gyrus, and left declive. A network involving such regions and signal propagation from visual, through cognitive, up to motor regions was proposed. Random effects Bayesian model selection showed that the top-down connections have the highest expected and exceedance probabilities. Moreover, all pairs of task-related regions were connected by at least one tract, except for the left declive with the left IFG. The interactions between the right cuneus with left declive were related to the interindividual variability in SDMT performance. Altogether, our findings suggest that the IPS functional network is related to the highest SDMT scores when its effective endogenous connections are suppressed to the detriment of modulation caused by the experimental conditions, with the underlying structure providing low diffusion environments.
Introduction
Human cognition and behavior emerge from dynamic neuronal interactions on a brain structural architecture. Nevertheless, the convergence (or divergence) between dynamic functional connectivity (FC) and structural connectivity (SC) is still a pivotal and challenging question (Park and Friston, 2013). The central hypothesis is that the anatomic architecture constrains the neural network dynamics, but does not determine it (Batista-García-Ramó and Fernández-Verdecia, 2018; Rubinov et al., 2009).
Studies have found moderate to strong correlation between SC and FC measures obtained from multimodal magnetic resonance imaging (MRI) (Honey et al., 2009); others have inferred resting-state FC from SC, showing consistent results corroborating the hypothesis that structure influences, but does not determine brain function (Honey et al., 2009). The comprehension about the structure–function relationship is essential to clarify the normal neural mechanisms and provide biomarkers of the healthy aging process (Nakagawa et al., 2013; Persson et al., 2006), and the so-called disconnectivity syndromes (Bullmore et al., 2009), such as schizophrenia and dementia (Skudlarski et al., 2010).
The structure–function relationship studies have relied on neuroimaging techniques such as multimodal MRI and sophisticated computational data modeling, with additional contributions from neuropsychological tests to provide information about cognition (Park and Friston, 2013). SC describes the white matter connections between cortical regions and can be studied using diffusion tensor imaging (DTI) and diffusion spectrum imaging (Xiao et al., 2015). DTI is an MRI technique that measures anisotropic diffusion of water molecules in tissues, providing useful structural information about the white matter, such as the orientation of the neural tracts (Robinson et al., 2016).
Reconstruction of DTI includes model-based and model-free methods. The model-free method, generalized q-sampling imaging (GQI), quantifies the density of diffusing water at different orientations, providing a spin distribution function. The GQI method was then generalized, originating the q-space diffeomorphic reconstruction method considering group analysis in a specific template space (Yeh and Tseng, 2011). The study of structure–function relationship using the GQI method is interesting once it presented the highest number of valid bundles in a worldwide competition concerning the human structural connectome mapping using diffusion tractography, which involved 96 distinct submissions from 20 research groups (Maier-Hein et al., 2017).
Regarding FC, we refer here to the interregional synchronization of low-frequency fluctuations in MRI signal based on the blood oxygenation level-dependent (BOLD) contrast (Biswal et al., 1995). It correlates with spontaneous neural activity of a brain region through the neurovascular coupling and is thus considered to be physiologically significant (Logothetis et al., 2001).
BOLD contrast is based on the difference in magnetic susceptibility of hemoglobin molecules, which depends on their oxygenation state. When in the presence of a stimulus or task, neural activity occurs, causing local oxygen demand for energy production, which is supplied by the blood vessels through increasing local cerebral blood flow. As the increase is greater than the demand, there is a decrease in the oxygen extraction fraction, causing an increase in T2*-weighted MRI signal (Ogawa et al., 1990). As the BOLD signal comes from vessels larger than capillaries, there is low spatial specificity regarding the neuronal activity. In contrast, because of its sensitivity and temporal resolution, BOLD-MRI is useful in functional studies with or without tasks (Detre and Wang, 2002).
FC is of great value considering its biological basis and its description in terms of brain organization in functional networks. A functional network can be broadly defined as a set of brain regions that show consistent synchronous activity, with FC between two or more regions due to synchronization within or between networks. FC is also studied using the effective connectivity (EC) concept, a complementary approach that relies on the biophysics of context-sensitive neuronal mechanisms.
EC is defined as how one region influences or causes activity in another during the particular neural process (Friston, 1994). It can be modeled using dynamic causal modeling (DCM) that estimates and makes inferences over the neuronal coupling and its changes due to the controlled experimental disturbance (Friston et al., 2003). It uses a realistic coupled neurovascular model and estimates its parameters such as those from the bilinear neural state: the endogenous connectivity, the modulatory connectivity, and the driving inputs. DCM presents advantages over similar methods due to its more plausible generative model of measured brain responses, once it considers their nonlinear and dynamic nature (Friston et al., 2003).
In this context, we evaluated the brain functional integration in response to the execution of a cognitive task, the Symbol Digit Modalities Test (SDMT) (Smith, 1968), which evaluates information processing speed (IPS), adapted to the MRI environment (Silva et al., 2018, 2019). IPS was chosen because several cognitive functions require sufficient speed for relevant operations to be performed within the allowed timeframe; delayed IPS usually underlies attention deficits (Chiaravalloti et al., 2015). Therefore, we investigated the dynamics of the IPS functional network, its relationship with the structural network, and the cognitive performance of IPS in healthy individuals based on multimodal MRI and neuropsychological evaluation. We hypothesize that SC constrains but does not determine FC, and their relationship is closely related to IPS cognitive performance assessed by the SDMT.
Materials and Methods
Participants and cognitive evaluation
Fourteen right-handed Portuguese speakers, both genders (nine men, five women), with a mean age of 28 ± 7 years (range: 18–43 years), asymptomatic for neurological and psychiatric disorders, were recruited. The research ethics committee of the institution approved the study. Exclusion criteria were abuse of alcohol or illicit drugs verified by the CAGE questionnaire (O'Brien, 2008); sensory or motor problems that could interfere with task performance, verified by the 9-Hole Peg Test (Feys et al., 2017); previous experience with cognitive tests for 6 months; language other than Portuguese; psychiatric disorders; presence of partial or total carotid stenosis, unilateral or bilateral; presence of injury from stroke or brain tumor; MRI contraindications; claustrophobia; myopia; and pregnancy.
The cognitive evaluation was performed by a neuropsychologist or supervised trainee to investigate differences within the group. The oral and written versions of the SDMT (Lezak et al., 2012) were administered according to the manual instructions. In brief, the SDMT (Smith, 1968) presents a key of numbers paired with symbols, followed by rows of symbols to which the participant provides the correct numbers as rapidly as possible, orally (oSDMT) or written (wSDMT).
Image acquisition
MRI was performed on a 3T system (Philips Achieva, The Netherlands), using a full-body transmission coil and a dedicated 32-channel head coil for signal reception. BOLD images were acquired using a 2D echo-planar imaging (EPI) sequence with the following parameters: time of repetition (TR)/time of echo (TE) = 2000/30 ms, flip angle = 80°, matrix = 80 × 80, field-of-view (FOV) = 240 × 240 mm2, number of slices = 31, slice thickness = 4 mm, gap between slices = 0.5 mm, number of repetitions = 165 (during task) and 200 (during resting state).
Diffusion-weighted imaging was acquired using a spin-echo sequence with EPI readout, and the following parameters: TR/TE = 9300/54 ms, pixel size = 2 × 2 mm2, slice thickness = 2 mm, EPI factor = 67, FOV = 256 × 256 mm2, acquisition matrix = 128 × 128 pixels, 60 slices, 33 diffusion gradients (32 with b = 1000 s/mm2 and 1 with b = 0), and overplus = no. For anatomical reference, images were acquired using a T1-weighted gradient-echo sequence with the following parameters: TR/TE = 7/3 ms, flip angle = 8°, matrix = 240 × 240, FOV = 240 × 240 mm2, number of slices = 160, and slice thickness = 1 mm.
SDMT task for fMRI
The block-designed paradigm consisted of five 30-sec blocks of task intercalated by six 30-sec blocks of control. The task was an adaptation of the SDMT test. As previously described, the participants should associate numbers with corresponding symbols based on a “response key.” During each task block, a symbol was displayed every 2 sec, totaling 15 symbols per block. During control blocks, a number was displayed every 2 sec, totaling 15 numbers per block, and the participant should silently read the displayed number (Silva et al., 2019).
The commands were developed in PsychoPy (Peirce, 2007), and presented on a monitor positioned in front of the MRI machine. The participant viewed the monitor through a mirror system coupled to the head coil. Before image acquisition, all participants were instructed to perform the task inside the MRI environment. Details about the task adaptation are available in a previous study (Silva et al., 2019).
Image processing and analysis
Functional images
Functional image preprocessing was performed using the Statistical Parametric Mapping (SPM12), and included reorientation using the anterior commissure as reference point for the origin; slice time correction; realignment for correction of motion artifacts; coregistration with anatomical images; normalization to Montreal Neurological Institute (MNI) space; and spatial smoothing using a Gaussian filter (full width at half maximum = 6 mm).
Statistical parametric maps were obtained for each subject and the group, using the General Linear Model with a boxcar regressor convolved with a canonical hemodynamic response function (p-FDR <0.01, cluster size [k] ≥ 50 voxels). Based on a previous meta-analysis (Silva et al., 2018) and the obtained activation maps, a task-related template was created using the WFU PickAtlas Toolbox (Maldjian, 1994), and included eight regions: left and right middle frontal gyri (MFG, Brodmann area [BA] 6), left superior parietal lobule (SPL, BA 7), left precuneus (BA 7), left inferior frontal gyrus (IFG, BA 9), right cuneus (BA 17), left lingual gyrus (BA 17), and left declive (portion of cerebellum). More details about the activation maps and the regions of interest were previously reported (Silva et al., 2019).
We used the CONN toolbox (Whitfield-Gabrieli and Nieto-Castanon, 2012) to assess the FC among regions during task performance. First, to remove unwanted fluctuations in BOLD signal, we used motion correction residual and their first-time derivatives, global signals of white matter and cerebrospinal fluid, and finite impulse response task timing, as regressors (Cole et al., 2019). We performed a region of interest (ROI)-to-ROI analysis considering the task-related templates. A correlation matrix was obtained from the bivariate correlation between the time series of each ROI. Correlation values were considered significant for p < 0.05, corrected for false discovery rate (FDR).
We used the DCM12 implemented in SPM12 to assess EC and investigate the best network model considering task-positive regions. Task-related regions were inserted as nodes in three models for the EC analysis. The first model was created based on the FC analysis, considering bidirectional connections (top-down and bottom-up) and signal propagation from visual, through cognitive, up to motor regions. The second and third models considered only top-down and bottom-up connections, respectively, of the first model. For each node, we considered the principal component extracted from the set of time series of all voxels that constitute each ROI. Intrinsic connections were considered within and between each region (node).
For DCM, we used parametric regressors for “all SDMT” contrast as a single input, and “SDMT minus control” contrast as a modulator of EC (Büchel et al., 1998). The first regressor (“all SDMT minus implicit baseline”) modeled nonspecific information-processing effects relative to baseline, whereas the second regressor (“SDMT minus control”) modeled information-processing effects during SDMT performance. Such regressors were orthogonal to each other. We used Bayesian model selection (BMS) to choose the best model and obtain EC parameters (endogenous connections, modulations, and driving inputs). The BMS determines the most likely random effects model among a set of hypotheses about the mechanisms that generated the observed data considering between-subjects heterogeneity.
The model evidence or the probability that the data are explained by the model is approximated by the negative variational free energy as an optimal compromise between accuracy and complexity of a model and is used to compare among alternative models (Stephan et al., 2009). The best model was chosen based on the expected probability and exceedance probability. The former represents the probability that a specific model generated the data of a randomly chosen subject, and the latter represents the probability that a model is more likely than the other models (Rigoux et al., 2014).
Endogenous and modulatory connectivity parameters of the winning model were correlated with the SC metrics, described later in the text (Yeh et al., 2010, 2017). The endogenous (forward and backward) and modulatory (backward) connectivity among regions are rates of change (in units of hertz) expressing what one region causes in others due to intrinsic and experimental conditions, respectively. If the value is positive, it is said that the connection is excitatory, with one region causing an increase in the activity of the other region; otherwise, the connection is inhibitory, with one region causing a suppression in the activity of the other region (Zeidman et al., 2019a,b).
Diffusion-weighted images
First, we performed eddy current and motion correction (Andersson and Sotiropoulos, 2016), and extracted the brain (Smith, 2002) of diffusion-weighted images using the FSL (Jenkinson et al., 2012). Then, using DSI Studio, we reconstructed the images in the MNI space using q-space diffeomorphic reconstruction (Yeh and Tseng, 2011) to obtain the spin distribution function (Yeh et al., 2010). A diffusion sampling length ratio of 1.25 was used. The restricted diffusion was quantified using restricted diffusion imaging (Yeh et al., 2017), and a deterministic fiber tracking algorithm (Yeh et al., 2013) was used with a quantitative anisotropy (QA) threshold of 0.0455 (Bauer et al., 2017).
We performed a preliminary study to determine the best angular threshold setting that gives similar results as the tractography atlas (Yeh et al., 2018), testing for 40°, 50°, 60°, 70°, and 80°. The step size was 0.5 mm. Then, the fiber trajectories were smoothed by averaging the propagation direction with a percentage of the previous one. The percentage was randomly selected from 0% to 95%. Tracks with a length <10 or >400 mm were discarded. A total of 106 seeds were placed.
We calculated several SC metrics for each tract linking two cortical regions from task-related template: number, volume, and length of the tracts; fractional anisotropy (FA); axial (AD), radial (RD), and mean diffusivities (MD) in unit of 10−3 mm2/s; QA and normalized quantitative anisotropy (NQA); isotropic diffusion component (ISO); and density of restricted diffusion (RDI) and nonrestricted diffusion (nRDI) given a displacement distance (Yeh et al., 2010, 2017).
Statistics
Demographic variables, neuropsychological scores, and BOLD metrics were evaluated with the Shapiro–Wilk normality test (p < 0.05). Once they presented normal distribution, parametric Pearson's correlation was performed among the described structural, functional, and cognitive measures. Otherwise, we used the nonparametric Spearman correlation. Moreover, SC measures of each tract were obtained and correlated with EC measures from the respective cortical regions pair. Both SC and EC measures from each tract/associated cortical regions pair were correlated with both written and oral SDMT scores. We considered significant correlations at p < 0.05. We also used the Bonferroni's method to correct for multiple comparisons.
Results
Demography and neuropsychological evaluation
The sample consisted of 14 participants (5 women) with a mean age of 28 ± 7 years. Most of them (78.6%) had >12 years of education (17 ± 4 years). Mean scores of wSDMT and oSDMT were 55.6 ± 7.71 and 59.2 ± 12.1, respectively, which are consistent for cognitively healthy subjects.
Brain connectivity
The statistical parametric map for the whole group showed activations in all regions of the task-related template. Task-based FC patterns showed interactions among all regions of the network (Fig. 1). Random effects BMS considering the three models and based on modulatory parameters showed that the top-down model (Fig. 2, model 3) presented the highest expected probability (0.415) and exceedance probability (0.585).
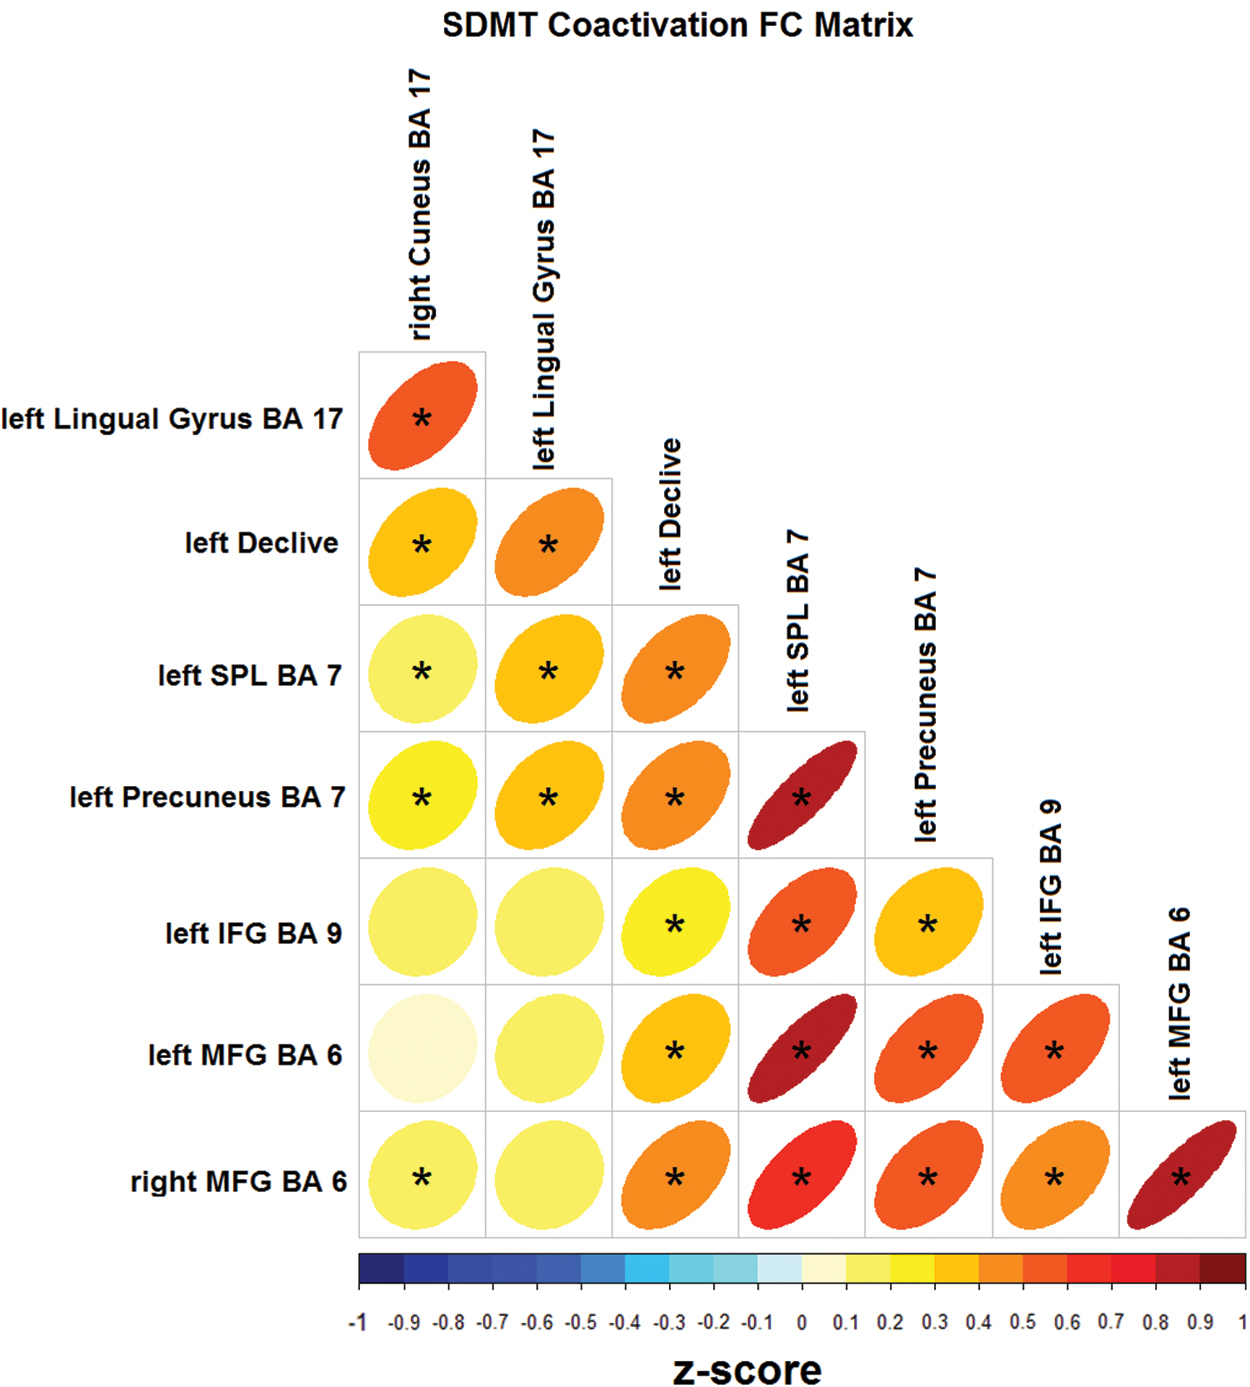
Functional connectivity analysis using bivariate Pearson's correlation and task-related regions. SDMT coactivation matrix: the ellipsoid shape is related to the correlation strength; circles represent low correlation, whereas ellipses represent high correlation. Asterisks indicate significant correlations for p-FDR < 0.05. MFG, middle frontal gyrus; SDMT, Symbol Digit Modalities Test; SPL, superior parietal lobule. Color images are available online.
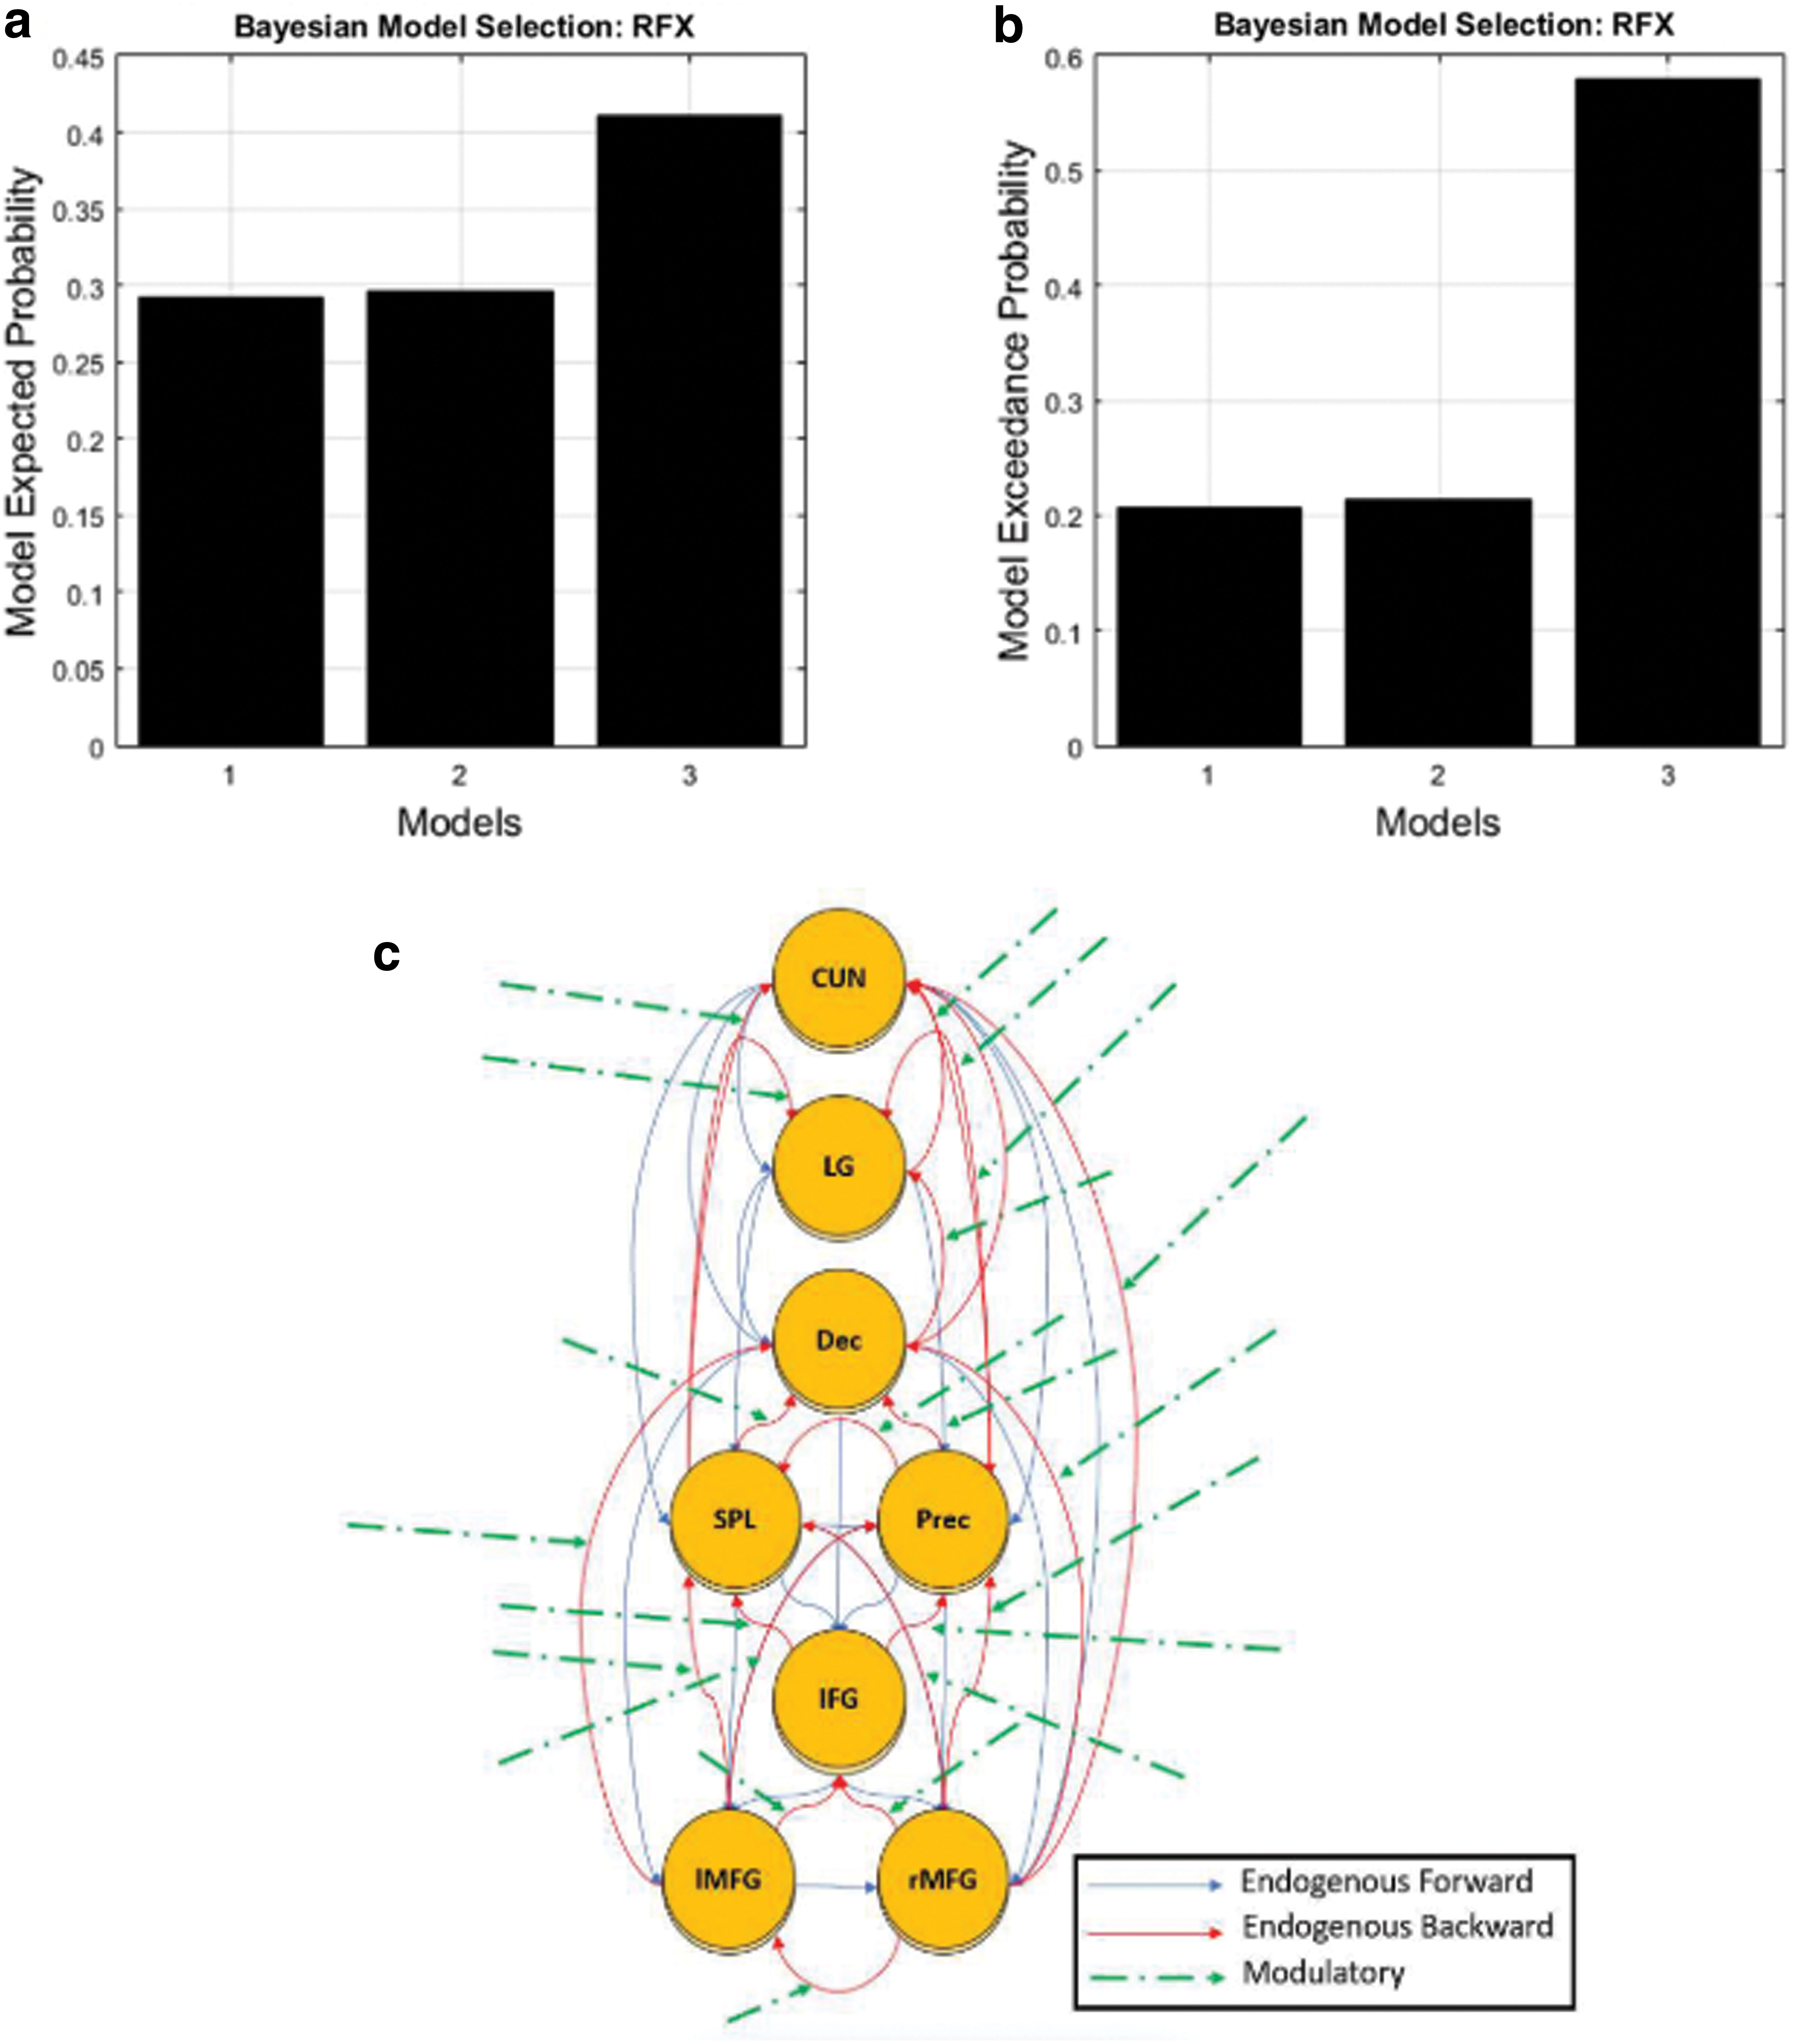
Results of Bayesian model selection. Bar charts show the expected model probabilities
For the structural analysis, we obtained the tracts from a preliminary study (Supplementary Table S1) using the HCP1021 tractography atlas to identify the fibers passing through every two ROI pairs from which task-based FC survived the FDR correction. All pairs of ROIs were connected by at least one tract, except for the left declive with the left IFG. Moreover, the corpus callosum tract connected most of the regions.
IPS structural and EC relationship
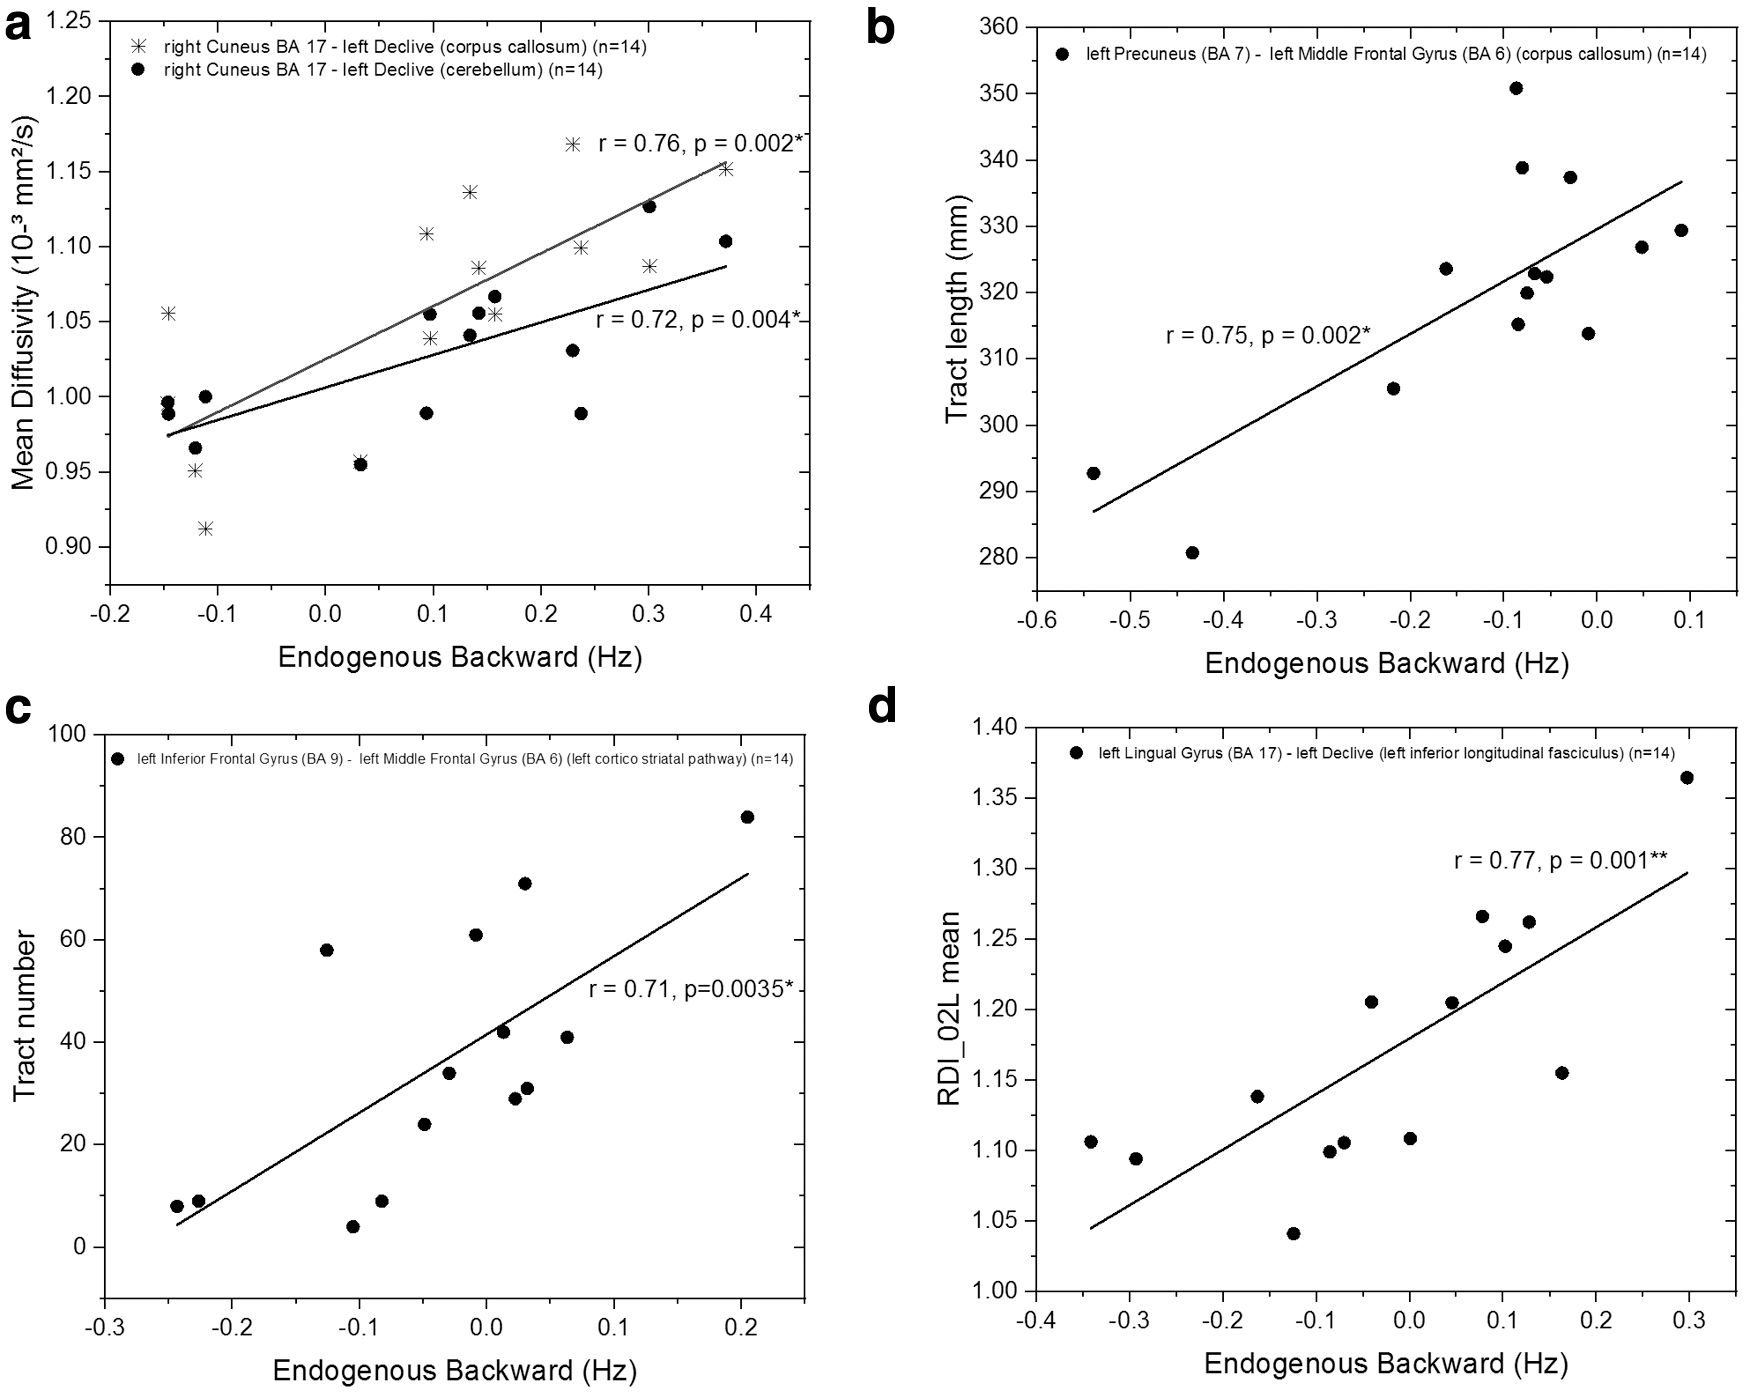
The correlations between SC and EC parameters showed significant associations involving interactions among 19 pairs of cortical regions (Supplementary Table S2). When considering only statistically significant associations after correcting for multiple comparisons, we mainly observed correlation of endogenous backward EC metrics with the tract length, MD, AD, and RDI from five cortical pairs (Table 1 and Fig. 3). Moreover, most of these associations involved the precuneus or the declive.
Associations between
Correlations Between Structural and Effective Connectivity Measures
Statistically significant at p < 0.1 after multiple comparison correction using Bonferroni method.
Statistically significant at p < 0.05 after multiple comparison correction using Bonferroni method.
AD, axial diffusivity; BA, Brodmann area; FA, fractional anisotropy; ISO, isotropic diffusion component; MD, mean diffusivity; nRDI, density of nonrestricted diffusion in a displacement L; r, Pearson correlation coefficient; RDI, density of restricted diffusion; ρ, Spearman correlation coefficient.
When considering associations without multiple comparisons and for p < 0.05, in general, we found the following associations patterns: (1) QA correlated with endogenous forward measures positively and modulatory measures negatively; NQA correlated negatively with endogenous forward measures negatively and FA correlated with endogenous forward and backward measures negatively and with modulatory measures negatively; (2) ISO, RDI, and nRDI also correlated positively with endogenous forward and backward measures, and negatively with modulatory measures; (3) MD, RD, and AD presented associations correlating positively with both endogenous forward and backward connectivity measures, whereas MD and mainly RD correlated negatively with modulatory measures.
The length was the only tract's physical characteristic that correlated significantly with EC, being positively associated with endogenous forward measures. Figure 3 shows some of the associations. The other significant correlations and their information (r-values, p-values, sample number, cortical ROIs pair, and related tracts) can be found in Supplementary Table S2.
IPS SC and SDMT performance relationship
When considering only statistically significant associations after correcting for multiple comparisons, we found negative correlations between the scores of the SDMT and diffusivity metrics of the corpus callosum connecting six pairs of cortical regions (Table 2 and Fig. 4).

Associations between
Correlations Between Structural and Effective Connectivity Measures
Statistically significant at p < 0.1 after multiple comparison correction using Bonferroni method.
Statistically significant at p < 0.05 after multiple comparison correction using Bonferroni method.
o, oral; RD, radial diffusivity; SDMT, Symbol Digit Modalities Test; w, written.
When considering associations without multiple comparisons and for p < 0.05, the correlations between SC parameters and cognitive scores showed significant associations involving interactions among 19 pairs of cortical regions (Supplementary Table S3). The associations presented a consistent pattern: tract's physical characteristics such as volume and number correlated positively with cognitive scores, whereas MD, RD, AD, and NQA presented negative associations with both oSDMT and wSDMT scores. It was not possible to identify a correlation pattern of FA and tract length with cognitive scores due to a similar number of positive and negative correlations.
IPS EC and SDMT performance relationship
We found only one significant association after correcting for multiple comparisons using a less restricted p-value (p < 0.15): endogenous backward connections between left declive and right cuneus correlated with oSDMT scores. However, when considering no correction for multiple comparisons, the correlations between EC parameters and cognitive scores showed significant associations involving interactions mainly among 6 of the 22 pairs of cortical regions: right cuneus with left declive, left precuneus, and right MFG, and left lingual gyrus with left SPL. The corpus callosum tract appeared in five connections (Supplementary Table S4). Modulatory connections showed mainly positive associations with both scores, whereas endogenous connections correlated mainly negatively with cognitive scores.
Structural–functional connectivity relationship underlying IPS performance
When considering only statistically significant associations after correcting for multiple comparisons, the following structural–functional significant relationship was associated with oSDMT performance: endogenous backward connections between left declive and right cuneus correlated with AD measurement of corpus callosum tract (Fig. 5a).

Individual deterministic tractography results regarding structural–functional correlates related to SDMT performance.
When considering associations without such a correction, the following structural–functional significant relationships were associated with oSDMT performance: endogenous backward connections between left declive and right cuneus correlated with MD and AD measures of corpus callosum tract (Fig. 5a), and MD, AD, and RD values of right u fiber tract (Fig. 5b); endogenous forward connectivity between right cuneus and left precuneus correlated with AD and RD measures of corpus callosum (Fig. 5c); modulatory connectivity values between right cuneus and left precuneus correlated with RD values of right cingulum tract (Fig. 5d). Moreover, the correlation of the endogenous forward connectivity between right cuneus and left precuneus with AD measures of the corpus callosum tract (Fig. 5a), and right u fiber tract (Fig. 5b), showed significant association with the wSDMT performance.
Discussion
We investigated the dynamics of functional networks in response to the execution of an MRI-adapted cognitive task (SDMT), which evaluates IPS, their relationship with structural networks, and cognitive performance in healthy individuals, based on empirical data obtained from multimodal MRI and neuropsychological evaluation.
The dynamics of functional networks were studied using BOLD-fMRI data and DCM, which allows specifying models of EC among selected brain areas, to estimate their parameters (endogenous and modulatory connections) and compare hypotheses (Zeidman et al., 2019b). Our winning model among the tested hypotheses was the one with top-down modulations. Top-down visual attention is described as a voluntary process that selects internally and focuses upon a particular thing of interest (Corbetta and Shulman, 2002), as the association between the symbols and the number in the SDMT task. Studies suggest that the prefrontal cortex and areas in the posterior parietal cortex are the source regions related to not only the top-down process but also the bottom-up process (Liu et al., 2010).
The top-down and bottom-up processes have been widely considered as two systems responsible for attentional demands, both being critical for efficient information processing (Katsuki and Constantinidis, 2014). It can be the reason behind the considerable exceedance probability involving bottom-up and bidirectional models, even if the top-down model was the dominant one in our study. Moreover, intersubject variability regarding strategies to achieve goal-directed behavior may explain that result.
Our results about the IPS structural and EC relationship show a positive association between the diffusion parameters and tract features between two cortical regions and the effects on endogenous connections across these regions. On the contrary, lower diffusivity parameters and lower tract characteristics tend to cause inhibitory effects in intrinsic connections. As an exploratory analysis, results suggest a step further in the understanding of structure–function relationship. As diffusivity and tracts features decrease, both the excitatory additive changes in endogenous connections and the inhibitory influences in intrinsic connections among regions increase. This is due to the modulation impinged by the experimental conditions.
Different methodologies were previously used to assess SC and its relationship with function and cognition. Huang and Ding (2016) reported that conditional Granger causality (GC) correlated significantly with the weight of the edges of the structural network, suggesting that these measures are the most appropriate to describe the structural–functional connectivity relationship. Age-related SC changes were observed using metrics obtained from deterministic tractography within resting-state networks, although no convergence with resting-state FC changes was found (Tsang et al., 2017). Resting-state FC was shown to be constrained by the large-scale anatomical structure using fiber counts among 66 cortical regions (Honey et al., 2009).
Graph analysis using fiber bundles FA, MD, AD, and RD connectivity matrices showed that children with the highest intellectual abilities present strong inter- and intrahemispheric white matter integrity (Kocevar et al., 2019). In our study, we considered DCM as the measure of EC, which is complementary to the GC (Friston et al., 2013). GC characterizes EC with a generic inferential approach, whereas DCM focuses on specific models previously selected, describing hidden dynamics from observations. Our choice relies on the fact that DCM englobes a biologically plausible background (Daunizeau et al., 2011), providing a more reliable interpretation of our results. Concerning the structural measures, we decided to evaluate diffusion parameters with neurobiological background and wide application in clinical studies.
Moreover, our study provides a methodology wherein SC analysis is performed between cortical regions related to the performance of a cognitive task, assessed by the statistical parametric map (in opposition to the inclusion of all cortical regions or fiber bundles from atlas) and inserted in functional and EC analysis of task-based data (in contraposition to the usual resting-state data). Although some studies reported associations between structure and function and others between structure and cognition, we were able to identify associations among structure–function–cognition, providing a more complete method of analysis of such a challenging question.
Moreover, recent studies have reported altered measures of SC, such as MD, RD, and AD in different diseases. Increased MD, RD, and AD values were found when comparing progressive supranuclear palsy–Richardson's syndrome patients with Parkinson's disease patients, conditions with complicated diagnostic accuracy due to its similar clinical symptoms (Talai et al., 2018). Another study stated that MD is an essential correlate of cognition and predictor of motor impairment in Parkinson's disease, allowing its stratification (Minett et al., 2018).
Higher MD in specific white matter regions was significantly correlated with Alzheimer's disease stage, clinical severity (Kantarci et al., 2017), and preceding dementia symptoms (Caballero et al., 2018). RD correlated positively with worse sleep quality scores, whereas both MD and RD were associated with increased depressive symptoms in individuals with mild traumatic brain injuries when compared with healthy controls (Raikes et al., 2018). Higher MD values also correlated with aging (Tsang et al., 2017). Therefore, once MD, RD, and AD correlated significantly with both functional and cognitive measures in our healthy group and presented associations with various conditions reported in recent publications even with various methodologies, we suggest that the methodology we used can be a useful tool to investigate diseases that presents alterations in diffusivity measures.
Notably, both diffusivity measurements (such as MD, AD, and RD) and density measurements (such as QA, ISO, RDI, and nRDI), and tract features (tract volume and length) correlated significantly with EC metrics and cognitive scores. Diffusivity measurements are more sensitive to identify pathological conditions, whereas density measurements are better to detect individual and physiological differences (Yeh and Tseng, 2011). In clinical applications, it can be useful to detect the structural intactness using the diffusivity measurements and to evaluate the SC using density measurements, once the latter quantifies the total amount of diffusing water (Yeh and Tseng, 2011).
Regarding the structural–functional connectivity correlates of IPS performance, we found associations related to the connection between the right cuneus, left precuneus, and left declive. It was previously shown that the posterior part of precuneus has strong connections with the cuneus, related to visual information processing (Margulies et al., 2009). In addition, the precuneus is considered “pivotal for conscious information processing” (Cavanna, 2007), once its disruption has been linked to impaired consciousness pathophysiological conditions such as vegetative state, Alzheimer's disease, and schizophrenia (Cavanna, 2007).
It was also shown that the posterior lobe of the cerebellum is responsible for visual perceptual learning (Deluca et al., 2014). The visual information processing requires coordinated processing in time to enable appropriate behavior. Once the categorization of visual images is related to many stages, it can be affected by any of the processing stages (Lev et al., 2014). Then, perceptual learning can improve visual processing speed, and due to the many stages of processing, it can also improve nontrained visual functions. Our findings suggest the importance of such areas in IPS performance, suggesting that interindividual variability in SDMT scores can be related to the structural–functional connectivity differences.
Despite the interesting findings, our study also has some limitations. Regarding our sample size (n = 14), it was reported that in DCM studies, the number of subjects required for a study to observe the effect of interest is similar for detecting group activation in fMRI studies (Goulden et al., 2012), with 12 volunteers providing 80% of power (Desmond and Glover, 2002). In addition, different DCM models and nodes can be tested to address individual variability and clinical groups. More specifically, due to brain changes in clinical conditions, other ROIs can be part of the IPS network to perform the task. Such changes must be considered to get more reliable EC parameters. Finally, confounders such as age and gender can also be included in future analyses to find stronger associations.
It is also important to note that our hypothesis is broad and encompasses a challenging question in neurosciences, that is, the relationship between brain function and cognition and its underlying structure. In this exploratory study, we also considered results without correcting for multiple comparisons. As reported before, in cases of confirmatory studies, which can cause a change in clinical practice or approval of a new treatment, it is more important to guard against the possibility of false-positive results. In the case of exploratory studies or post hoc analysis of existing data, a strict adjustment for multiple comparisons is less critical. Then, we also considered no correction for multiple comparisons to explore the results. However, we also added the findings that survived such a correction to assess which parameters best fit our general hypothesis.
Increasing the number of subjects, applying to different cognitive domains, and in clinical groups are the next steps to make our results well grounded and allow the asking for more precise hypotheses.
Conclusion
Our findings suggest that IPS functional network is related to the highest SDMT scores when its effective endogenous connections are suppressed to the detriment of modulation caused by the experimental conditions, with the underlying structure providing low diffusivity (as measured by MD, RD and AD) and density diffusion (as measured by NQA) environments. Therefore, IPS SC network constrains but does not determine IPS FC network, and both are related to the SDMT performance. Moreover, the use of neuroimaging techniques such as multimodal MRI, sophisticated computational data modeling with increasingly plausible neurobiological background, and neuropsychological tests seems to be useful to provide more reliable and robust information about the structure–function–cognition relationship assessed by cognitive tasks.
Footnotes
Authors' Contributions
P.H.R.d.S. contributed to image processing and analysis and article writing. K.F.S. and C.R. contributed to data discussion and article writing. R.F.L. contributed to image acquisition, analysis, and article writing.
Acknowledgment
The authors thank Dr. Carina for conducting the cognitive evaluation.
Author Disclosure Statement
No competing financial interests exist.
Funding Information
This study was financed by the Fundação de Amparo à Pesquisa do Estado de São Paulo (FAPESP).
Supplementary Material
Supplementary Table S1
Supplementary Table S2
Supplementary Table S3
Supplementary Table S4
References
Supplementary Material
Please find the following supplemental material available below.
For Open Access articles published under a Creative Commons License, all supplemental material carries the same license as the article it is associated with.
For non-Open Access articles published, all supplemental material carries a non-exclusive license, and permission requests for re-use of supplemental material or any part of supplemental material shall be sent directly to the copyright owner as specified in the copyright notice associated with the article.