
Abstract
Background:
Characterization of, and evaluation of strategies to mitigate, the effects of sub-concussive impacts (SCI) on brain structure and function are crucial to understanding potential long-term neurological risks associated with sports participation.
Objectives:
To evaluate the efficacy of a jugular vein compression collar for preserving functional and structural measures of brain network organization in a cohort of female high school soccer players throughout a season of competitive play.
Methods:
Athletes were assigned to a collar (N = 72) or non-collar (N = 56) group before engaging in a season of play, during which head impact data were recorded via accelerometer for every practice and competition. Participants completed neuroimaging sessions before and following the season. A graph theoretical framework was applied to the functional and structural connectivity measures computed from resting state functional magnetic resonance imaging (rs-fMRI) and diffusion tensor imaging (DTI) data.
Results:
Non-collar-wearing athletes exhibited significantly increased rs-fMRI-derived global clustering coefficients (p = 0.032) and DTI-derived modularity (p = 0.042), compared to collar-wearing athletes. No longitudinal changes in any graph measures were observed for the collar group (p > 0.05).
Conclusion:
The observed increase in graph measures in the non-collar group is congruent with previous studies of SCI and is similar to graph theoretical studies of traumatic brain injury. The absence of alterations in graph metrics in the collar group indicates a potential ameliorating effect of the collar device against network reorganization, in line with previous literature.
Impact statement
This work adds to the body of neuroimaging literature reporting altered measures of brain structure and/or function following participation in contact sports generally and female youth soccer specifically. Further, the observation of a potentially ameliorating effect of a novel protective device is consistent with a small but encouraging number of studies reporting similar effects.
Introduction
Concern over the long-term cumulative effects of sports-related head impacts, even in the absence of a diagnosed concussion, has motivated numerous neuroimaging studies of athletes exposed to repetitive sub-concussive impacts (SCI). Prospective longitudinal diffusion tensor imaging (DTI) studies have associated SCI exposure with changes in the microstructural integrity of white matter (Bahrami et al., 2016; Bazarian et al., 2014; Chun et al., 2015; Churchill et al., 2017; Davenport et al., 2014; Lipton et al., 2013; Mayinger et al., 2018; McAllister et al., 2014; Myer et al., 2016a,b, 2019; Schneider et al., 2019; Yuan et al., 2018a). The SCI exposure also affects functional magnetic resonance imaging (fMRI) measures, as evidenced by alterations in functional brain activity (Robinson et al., 2015; Yuan et al., 2017, 2018b), connectivity (Abbas et al., 2015a,b; Johnson et al., 2014; Reynolds et al., 2018; Slobounov et al., 2017), and cerebrovascular reactivity (Svaldi et al., 2020).
The potential risks of SCI have also motivated innovations in protective equipment that could ameliorate potential deleterious effects of SCI. One such device is a jugular vein compression (JVC) collar that purports to increase intracranial blood volume and thereby reduce intracranial forces that occur when the brain is subjected to differential motions relative to the skull (“slosh”). Several preliminary neuroimaging studies of the JVC collar have reported promising results in young athletes (Myer et al., 2016a,b, 2019; Yuan et al., 2017, 2018a,b). Specifically, prospective longitudinal DTI studies in either high school football (male) or soccer (female) players show that pre- to postseason alterations in microstructural properties of white matter associated with repetitive SCI are significantly greater in non-collar-wearing athletes compared with athletes who wore a JVC collar, despite similar exposures to head impacts (Myer et al., 2016a,b, 2019; Yuan et al., 2018a). Moreover, fMRI studies indicate longitudinally increased activation during a working memory task for non-collar-wearing athletes relative to JVC collar-wearing athletes for both girls' soccer (Yuan et al., 2018b) and boys' football (Yuan et al., 2017), indicating compensatory recruitment of neuronal resources. However, in addition to having relatively small sample sizes, previous studies have only evaluated the localized spatial extent of these effects and not how they may influence structural and functional connectedness between different areas of the brain.
Network connectivity analyses using graph theory are a logical next step to test the efficacy of the JVC collar for mitigating the effects of SCI in athletes. For any neuroimaging data, computing connectivity measures consists of dividing the brain into a set of nodes (often distinct, anatomically delineated regions) and defining a relationship between each pair of nodes. In the case of DTI, connectivity measures correspond to the strength of physical connections between pairs of nodes vis-à-vis white matter tracts (Hess et al., 2006; Lazar et al., 2003; Mori et al., 1999). For fMRI data analyses, connectivity measures are most often a temporal correlation between the blood oxygen level dependent (BOLD) signals from each of two nodes, although other statistical measures can also be considered (Biswal et al., 1995; Fox et al., 2005; Greicius et al., 2003). The resultant number of connectivity measures rapidly increases with the number of nodes chosen (Nconnections α Nnodes 2 – Nnodes) and can, thus, be very large; however, the graph theoretical framework distills these large ensembles of node-to-node connectivity measures into a small set of so-called “global” scalar measures that each describe a unique property of network organization throughout the entire brain.
Collectively, these graph theoretical measures offer a comprehensive yet intuitive and biologically meaningful description of brain network organization. For instance, the graph theoretical measure of clustering coefficient describes the prevalence of densely interconnected groups of nodes in a network, the presence of which may indicate segregated neural processing in functionally derived networks (Rubinov and Sporns, 2010). Another measure, characteristic path length (L), describes the functional integration of a network—how readily information can pass across distributed brain regions. The measure of modularity (Q) describes the degree to which an individual's brain network is organized into distinct “communities” of functionally related neural elements called modules. High Q indicates strongly segregated modules that are densely connected within a module yet sparsely connected between them (Rubinov and Sporns, 2010; Sporns and Betzel, 2016). Because graph theoretical measures describe properties of network organization at a global level, individual-level alterations in connectivity in response to insult or trauma do not need to be spatially consistent across subjects to identify group-level network effects. This is advantageous for any study of phenomena where the etiology is unknown or diffuse—as is the case with SCI exposure.
The purpose of this study was to determine the efficacy of the JVC for preserving the longitudinal stability of functional and structural brain network organization in athletes exposed to SCI. Specifically, we applied a graph theoretical framework to longitudinal resting-state fMRI (rs-fMRI) and DTI data collected before and after a season of high school female soccer in non-collar- and collar-wearing athletes. By applying the same framework to both imaging modalities, we obtained a common set of measures from both levels of information, facilitating a more direct comparison between rs-fMRI and DTI data.
We posit that the axonal and neuronal insult resulting from SCI exposure evokes a modest reorganization of brain networks in athletes not wearing the JVC collar, as suggested in earlier studies of this population. Specifically in female soccer athletes (Yuan et al., 2018b), longitudinal increases in activation were observed in non-collar-wearing athletes, indicating compensatory recruitment of neuronal resources after a competitive season of play. Accordingly, in rs-fMRI-derived graph theory measures, we hypothesized that non-collar-wearing athletes would exhibit greater longitudinal increases in activation that would manifest as an increase in clustering coefficient compared with collar athletes, indicative of brain recruitment of neuronal resources from functionally related areas. A previous study using DTI showed widespread reductions in diffusivity in non-collar-wearing female soccer athletes relative to collar-wearing athletes (Myer et al., 2019), likely indicative of microstructural alterations in deep white matter tracts. From these data, we hypothesized that reduced diffusivity would manifest in DTI-derived graph theory measures as greater increases in path length for non-collar-wearing athletes compared with collar athletes, due to the weakening of structural connectivity between spatially (and functionally) distant brain regions for athletes not protected by JVC.
Materials and Methods
Participants
We recruited 204 healthy female soccer players from eight area high school varsity teams to participate. Informed consent and assent were provided by athletes and their parents/guardians, and data were collected in accordance with procedures approved by the (redacted for review) Institutional Review Board (
Head impact tracking
Impact data were recorded for each participant throughout the course of the season via an accelerometer device affixed immediately inferior to the mastoid process (CSx Systems Ltd, Auckland, New Zealand). Research coordinators attended all practices and games to ensure proper application and functioning of accelerometers and to monitor collar compliance if applicable. Recording of impact data was triggered when the sensor detected acceleration of >10 g; for each such event, 50 ms of data were transmitted—5 ms before and 45 ms after the event. Data were downloaded from the accelerometers at the end of each practice or game, and precise time and peak acceleration of each impact were saved for analysis.
Given that a recent study of accelerometer recordings in female soccer athletes found that the devices have a positive predictive value of just 19% (Press and Rowson, 2017) and that obvious artifactual signals were present in our data via visual assessment (see Supplemental Figures S1 and S2 in Supplementary Data for more detail), we removed suspected spurious recordings by filtering out sequences of three or more impacts of >20 g spaced ≤10 sec apart (such impacts are extremely improbable occurrences in soccer).
MR acquisition and preprocessing
Neuroimaging data were acquired on one of three 3T Philips MRI scanners (Philips Medical Systems, Best, the Netherlands) equipped with a 32-channel phased array head coil: Achieva, Ingenia, or Ingenia Elition. Image acquisition parameters were harmonized across scanners before start of the study, and no hardware or software updates were performed during the course of the study. All participants were scanned on the same instrument for both pre- and postseason neuroimaging sessions; the distributions of participants across scanners were: Achieva = 32 (17 collar, 15 no-collar), Ingenia = 47 (24 collar, 23 no-collar), and Ingenia Elition = 49 (31 collar, 18 no-collar). BOLD data for functional connectivity analyses were acquired during a 5-min rs-fMRI session by using a single-shot echo planar imaging sequence (repetition time [TR] = 1200 ms; echo time [TE] = 30 ms; nominal in-plane resolution = 3 × 3 mm; slice thickness = 3 mm; field of view = 240 × 240 × 153 mm; in-plane parallel reduction factor = 1.25; multi-band factor = 3). During these scans, participants were instructed to relax and focus on a fixed cross (+) projected onto a screen in the center of their field of vision. The DTI data were acquired with a 61-direction spin echo-planar imaging sequence (TR/TE = 8600/97 ms; field of view = 256 × 256 mm; acquisition matrix = 128 × 128; slice thickness = 2 mm [voxel resolution = 2 × 2 × 2 mm]; number of slices = 67; SENSE factor = 3; diffusion weighting factor b-value = 1000 s/mm2). We acquired seven interleaved frames of images without diffusion weighting (b0). In addition, a high-resolution three-dimensional T1-weighted anatomical image was acquired (TR/TE = 8.1/3.7 ms; TI = 1070 ms; isotropic resolution = 1 mm3). All anatomical images were evaluated by a board-certified neuroradiologist blinded to group assignment. No traumatic abnormalities were identified in any participant in pre- or postseason scans.
The T1-weighted images were processed by using SPM12's Unified Segmentation Algorithm (Ashburner and Friston, 2005) to obtain gray matter, white matter, and cerebrospinal fluid probability maps as well as the non-linear deformation field describing subject-specific translation to standardized space. BOLD data were temporally realigned, co-registered to T1-weighted images, and normalized to 2-mm isotropic standardized space by using T1-derived deformation fields. To mitigate motion artifact-induced correlations, frame-wise realignment parameters and their first order derivatives were regressed from the BOLD signal at each voxel. In addition, frames were censored from the timeseries if composite motion was >0.5 mm or if the frame-wise change in global signal average exceeded 3 standard deviations. Table 1 provides summary statistics of motion and censoring by group; no study participants were excluded from analysis due to excessive motion (>0.2 mm mean framewise displacement). Further temporal whitening was achieved by regression of the first five principle components of BOLD signals extracted separately from white matter and cerebrospinal fluid compartments. Finally, residual BOLD data were bandpass filtered (0.008–0.09 Hz) to eliminate confounds from signal drift as well as cardiac and respiratory artifacts. Mean residual BOLD timeseries data were extracted from 90 anatomically derived cortical and subcortical regions of interest (ROIs) defined by the automated anatomical labeling (AAL) atlas (Tzourio-Mazoyer et al., 2002). Functional connectivity matrices for each subject were created by computing Fisher-transformed Pearson correlation coefficients between each pair of ROIs.
Mean and Standard Deviations of Average Framewise Displacement (μFD) and Number of Censored Frames (Σscrubbing) for Resting-State Data, by Group, at Pre- and Postseason
Diffusion-weighted images were processed by using the FMRIB Software Library (FSL) version 5.11 (
Graph theoretical analyses
All graph theoretical measures were computed on binary, undirected networks by using the Brain Connectivity Toolbox (
Normalized measures (γ and λ) were computed by dividing each subject's Cg and L by the average of these measures calculated from 100 randomized graphs with subject-preserved degree distributions. For determination of Q, a multi-resolution hierarchical consensus clustering approach using the Louvain community detection algorithm was used to avoid errors from degenerate solutions (Jeub et al., 2018; Lancichinetti and Fortunato, 2012). Functional connectivity networks were generated by proportionally thresholding rs-fMRI connectivity matrices (ignoring negative connections) at five fixed average degree levels (corresponding to network densities of 0.1, 0.15, 0.2, 0.25, and 0.3). Two-sample Kolmogorov–Smirnov tests showed no significant differences (p > 0.05) in degree distributions between groups at any network density level for either pre- or postseason graphs, indicating that there was no between-group bias in this fundamental network property to skew global network measures. Structural connectivity networks were generated by proportionally thresholding the structural connectivity matrices at eight fixed average degree levels (corresponding to network densities of 0.18, 0.19, 0.20, 0.21, 0.22, 0.23, 0.24, and 0.25). Lower threshold density was determined by the minimum value at which all participants had a fully connected network, whereas upper threshold density was determined by the minimum original density level in connectivity matrices among all participants.
For both functional and structural data, we computed the summation of each network measure across all computed network density levels; this provided a threshold-independent scalar for each network measure termed the area under the curve (AUC), which minimized any bias that could arise from an arbitrary (or prejudiced) choice of network density thresholding. We fit the observed longitudinal changes in AUC of each network measure for all subjects using ordinary least-squares regression models with design matrices composed of three categorical predictor variables (for collar, non-collar, and scanner) as well as a continuous predictor variable for number of head impacts. Because the accuracy of head impact detection via accelerometer tracking is quite poor (O'Connor et al., 2017; Press and Rowson, 2017), we also present results from a model without the continuous predictor variable for number of head impacts. Based on our literature-guided hypotheses regarding fMRI-derived Cg and DTI-derived L, F-tests were independently performed to test null hypotheses that these models' coefficients for collar and non-collar groups were equal to zero (i.e., test for longitudinal changes within groups) as well as the null hypothesis that the difference between the collar and non-collar coefficients was equal to 0 (i.e., test for group differences in longitudinal changes). We also performed these F-tests for the longitudinal changes in AUC of the remaining graph measures as a set of exploratory data analyses to guide future research. Further, we also report the results for each network measure at each network density level to provide descriptive statistics about dependencies between changes in graph measures and network density thresholding levels.
Results
Head impact exposure
The number of head impacts ≤20 g was significantly higher in the non-collar group compared with the collar group (filtering was not applied to hits ≤20 g). There were no significant differences between groups in the number of impacts at any level >20 g; average force per impact was not significantly different between groups at any level (Table 2).
Impact Exposure Data for All Athletes (Mean ± Standard Deviation)
Significant difference between groups in two-tailed, two-sample t-test (p < 0.05).
Graph theoretical measures
Tables 3 and 4 report the results testing for longitudinal changes of the AUC of network measures for functional and structural connectivity data, respectively. For graph measures derived from rs-fMRI data, significant increases in Cg (scanner-only model p = 0.019; scanner + impacts p = 0.026) and L (scanner-only model p = 0.043) were observed for the non-collar group. In addition, the change in Cg was significantly different between groups (scanner-only model p = 0.032; scanner + impacts p = 0.047). Measures of Cn were generally increased in the non-collar group, but no significant difference was found at any node after controlling for multiple comparisons (Fig. 1). No significant changes were observed for the collar-wearing group for any graph measure in any model (see Supplemental Tables S2 and S3 in Supplementary Data for more detail).

Lateral views of the right
p-Values for Longitudinal Changes in Area Under the Curve of Graph Measures Derived from Resting-State Functional Magnetic Resonance Imaging
First column indicates explanatory variables included in the model. Significant effects (p < 0.05) are bold and italicized.
γ, normalized clustering coefficient; λ, normalized path length; σ, small world-ness; C, collar group; Cg, global clustering coefficient; L, characteristic path length; NC, non-collar group; Q, modularity.
p-Values for Longitudinal Changes in Area Under the Curve of Graph Measures Derived from Diffusion Tensor Imaging
First column indicates explanatory variables included in the model. Significant effects (p < 0.05) are bold and italicized.
For graph measures derived from DTI data, both models found significant (p < 0.05) increases in Q for the non-collar group, whereas no significant changes were observed for the collar group for any graph measure. In addition, change in Q was significantly greater in the non-collar group compared with the collar group when controlling for scanner only (p = 0.042) but not when additionally controlling for number of impacts (p = 0.064).
Figure 2 shows within- and between-group differences of graph theoretical measures derived from functional connectivity matrices at each of the five network densities, controlling for scanner. The non-collar group had significant pre- to postseason increases in Cg (4/5 network density levels), L (1/5 network density levels), and Q (2/5 network density levels). The collar group did not show any significant changes for any measure at any network density level. Between-group differences showed that changes were significantly greater in the non-collar group compared with the collar group for Cg (3/5 network density levels) and γ (1/5 network density levels).
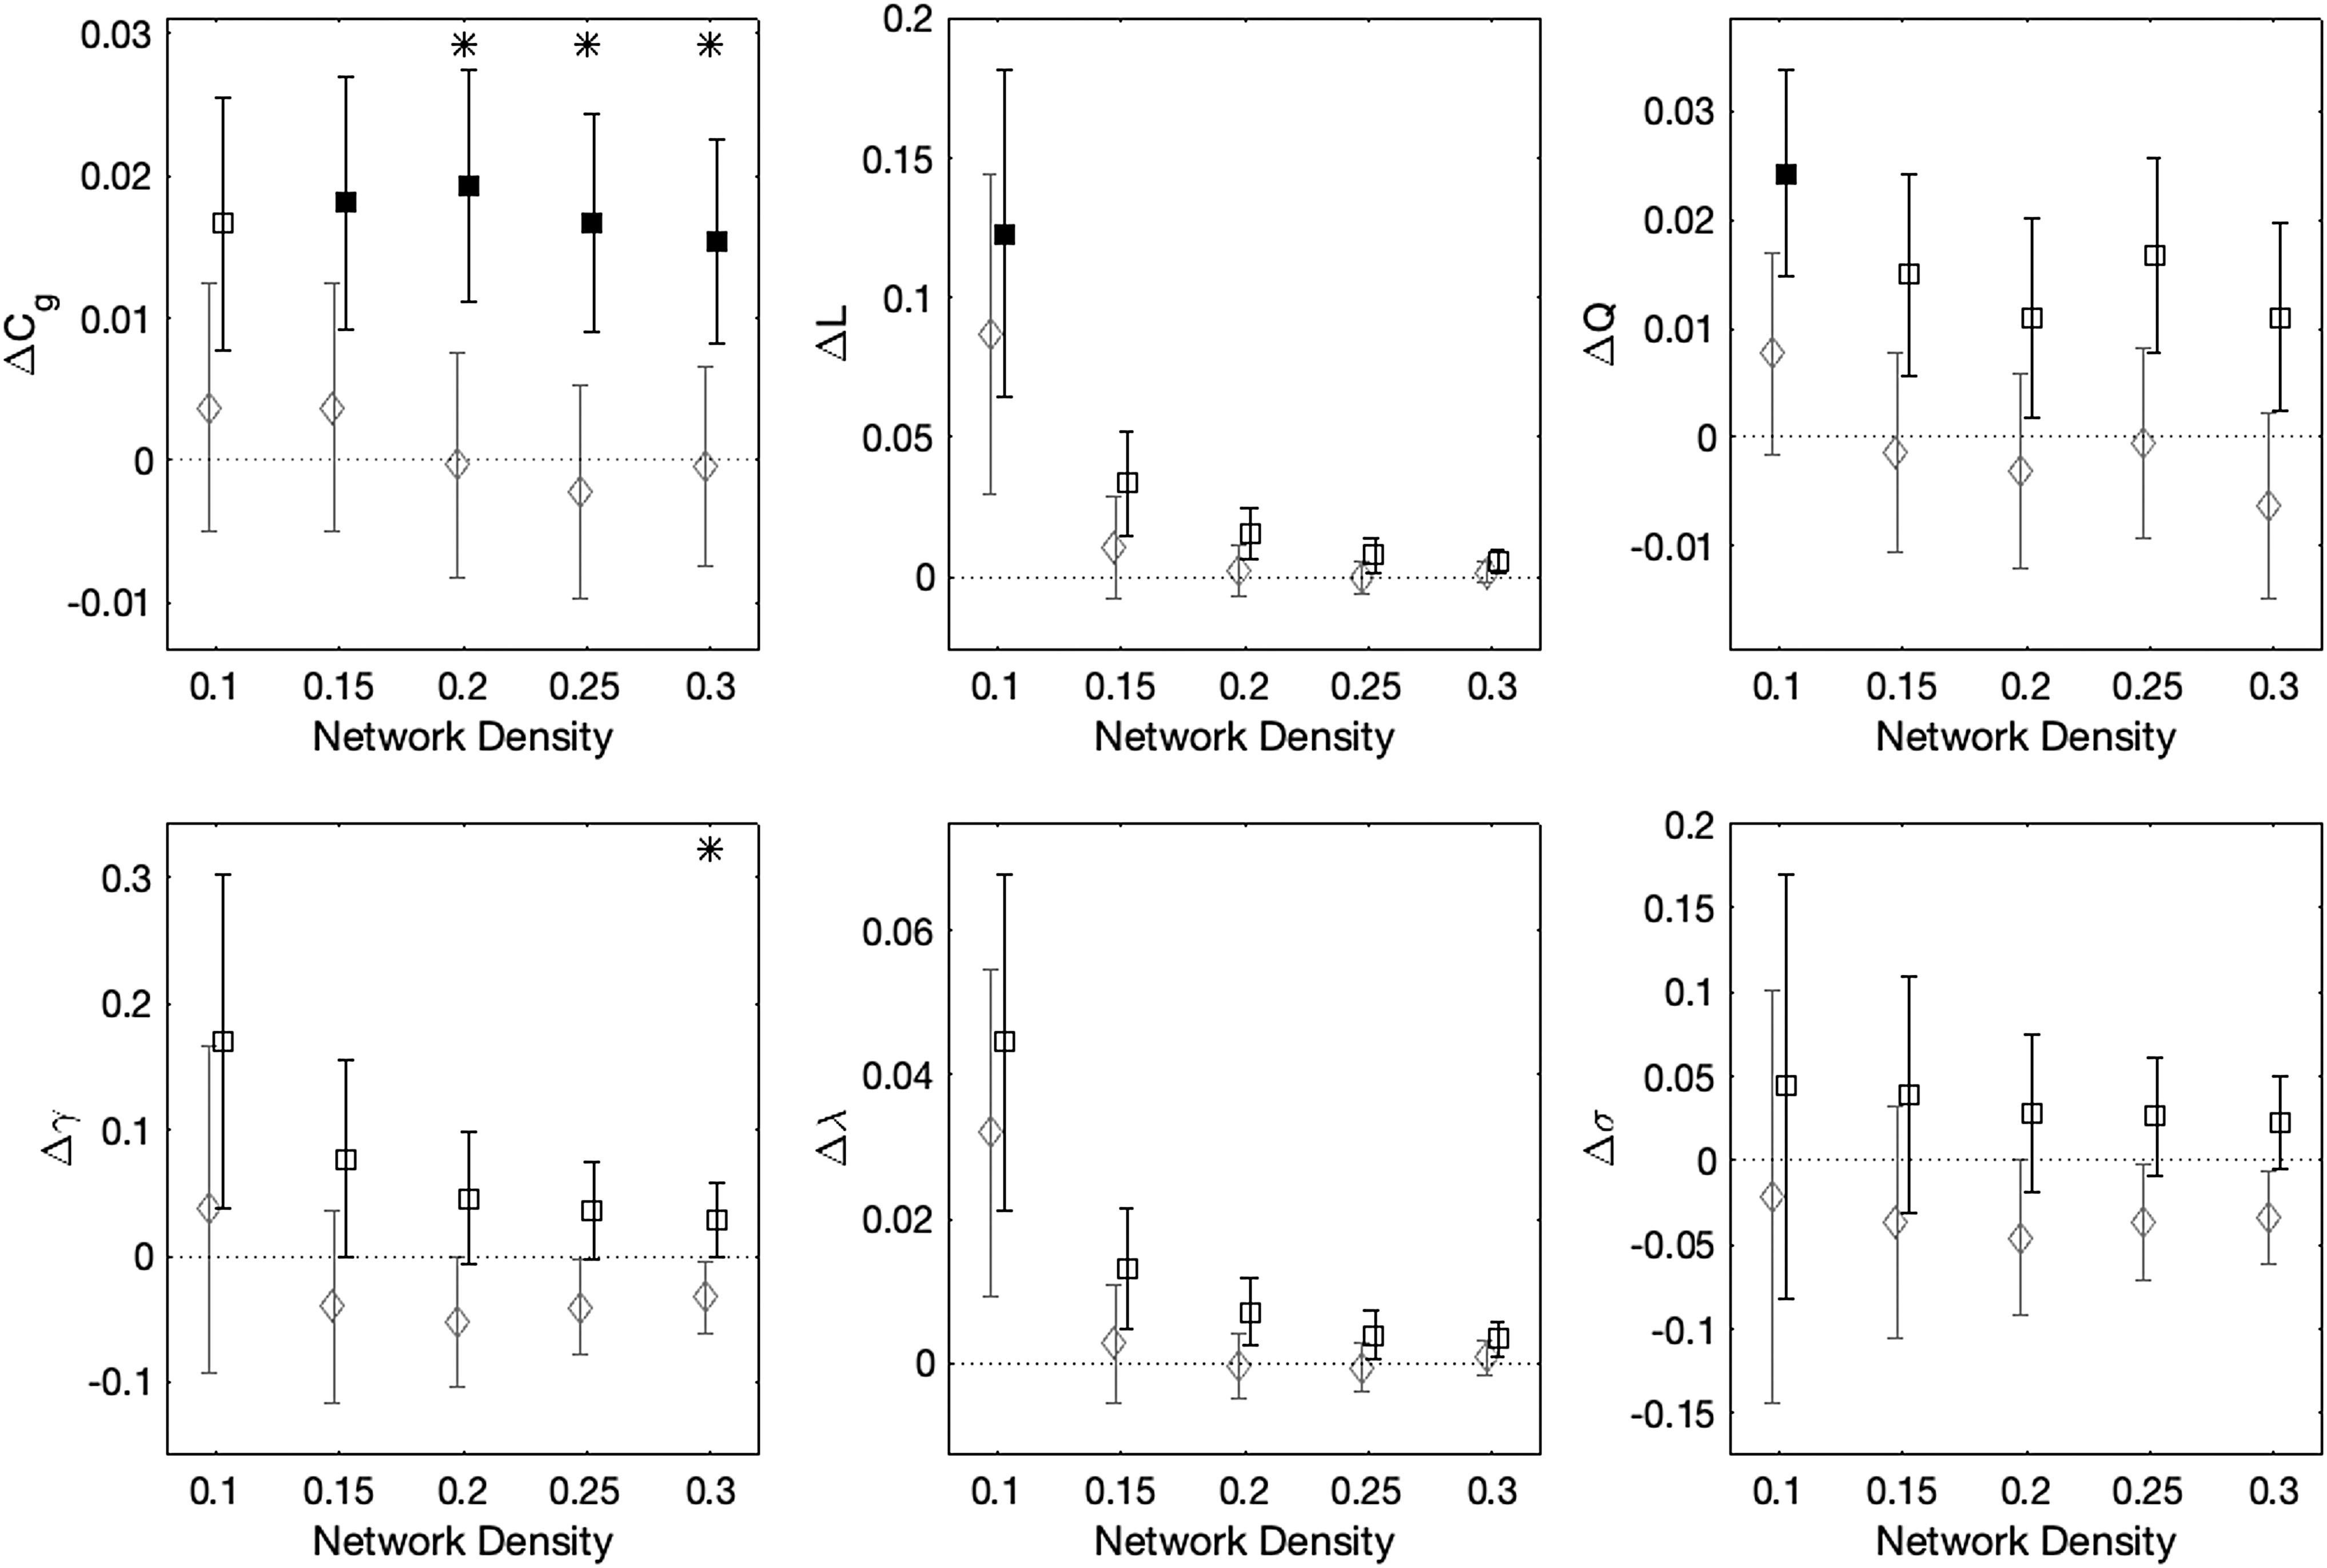
Mean longitudinal changes in graph theoretical measures of the functional connectome for collar (gray diamonds) and non-collar (black squares) groups computed at five network density levels. Error bars show standard error; filled symbols indicate that within-group changes are statistically significant for a given network density level, whereas asterisks indicate that between-group differences are statistically significant. Collar and non-collar data are offset on the x-axis by −0.0025 or +0.0025, respectively, to improve readability.
Figure 3 shows within- and between-group differences of graph theoretical measures derived from structural connectivity matrices at each of the eight network densities, controlling for scanner. The non-collar group had significant pre- to postseason increases in Q at 4/8 network density levels. The collar group did not show any significant changes for any measure at any network density level. Between-group differences showed that changes in Q were significantly greater in the non-collar group compared with the collar group at network densities of 0.18, 0.19, 0.21, and 0.23.
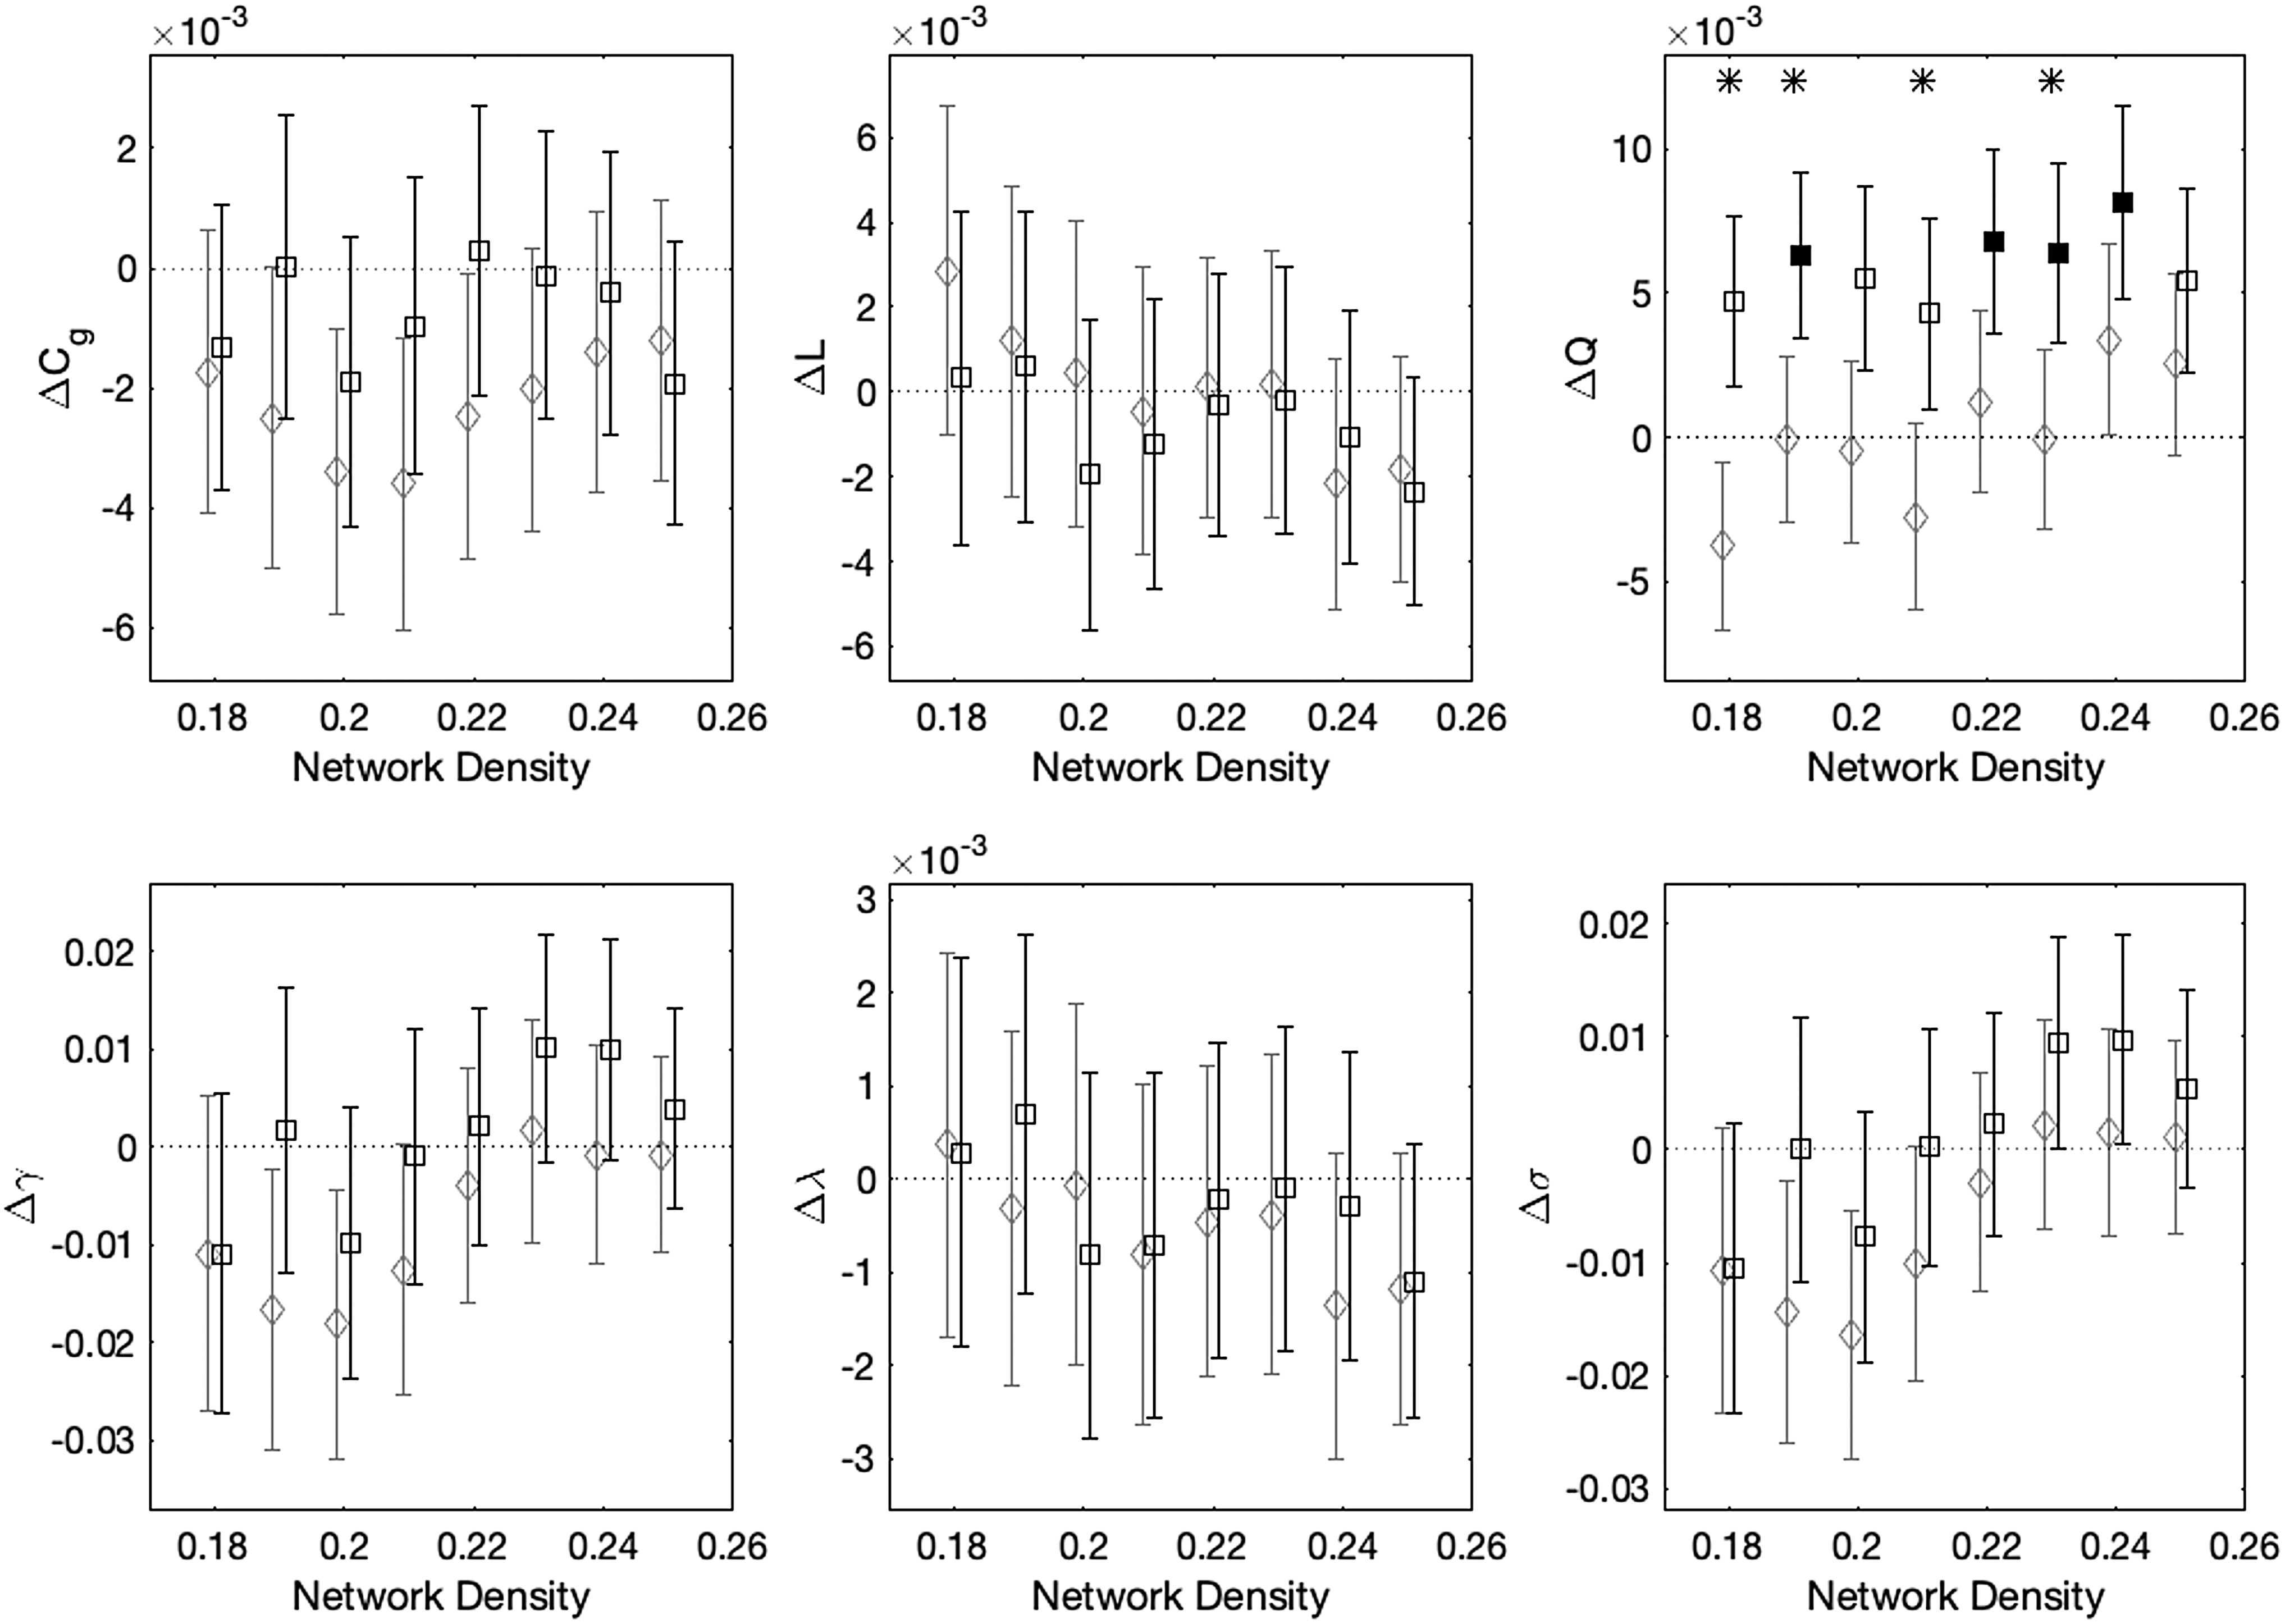
Mean longitudinal changes in graph theoretical measures of the structural connectome for collar (gray diamonds) and non-collar (black squares) groups computed at eight network density levels. Error bars show standard error; filled symbols indicate that within-group changes are statistically significant for a given network density level, whereas asterisks indicate that between-group differences are statistically significant. Collar and non-collar data are offset on the x-axis by −0.001 or +0.001, respectively, to improve readability.
Discussion
The purpose of this study was to determine the efficacy of the JVC collar for preserving high-school female soccer athletes' functional and structural measures of brain network organization in response to SCI after a season of competitive play. We used graph theoretical-based analyses of both functional and structural neuroimaging data to produce summary measures that characterize brain network organization. Consistent with our hypothesis, fMRI-derived brain networks of non-collar-wearing athletes exhibited an increased Cg relative to collar-wearing athletes. Clustering coefficients were not significantly increased at the nodal level (after controlling for multiple comparisons), though this is consistent with a diffuse and/or heterogeneous effect of SCI exposure. Our DTI-derived networks did not exhibit increased L in the non-collar-wearing group as hypothesized. However, these networks did show increased Q, and fMRI-derived networks showed increased L. For both modalities, brain networks of JVC collar-wearing athletes displayed no significant changes. Collectively, these data indicate that brain network organization of non-collar-wearing athletes became more segregated over the course of the season and that the JVC collar may afford some protective effect against such changes.
Graph theoretical measures can conveniently and succinctly describe network organization, but linking changes in these topological metrics to biological mechanisms remains a challenge. Findings from this work indicate that the JVC collar is capable of preserving some level of network reorganization after SCI in high-school female soccer athletes. Though this study does not reveal any specific mechanism underlying this reorganization, a reasonable supposition is that axonal injury plays a role. The most direct evidence of potential axonal injury contributions comes from numerous studies reporting altered DTI measures associated with SCI (Bahrami et al., 2016; Bazarian et al., 2014; Churchill et al., 2017; Davenport et al., 2014; Lipton et al., 2013; Mayinger et al., 2018; McAllister et al., 2014; Myer et al., 2016a,b, 2019; Schneider et al., 2019; Yuan et al., 2018a). Further, studies of concussion/traumatic brain injury (TBI) may afford additional insights. The SCI exposure is similar to TBI in that both involve external mechanical force applied to the head, although SCI exposure does not result in immediate and obvious symptomology as in TBI, despite giving rise to neurological sequelae (Morley, 2018; Nauman and Talavage, 2018). Thus, it is not entirely surprising that our observations are directionally consistent with numerous TBI studies. Studies of TBI have reported increased Cg (or the highly correlated graph measure of local efficiency; Caeyenberghs et al., 2012; Hillary et al., 2014; Nakamura et al., 2009), increased L (Caeyenberghs et al., 2014; Pandit et al., 2013), and disruptions in modular organization (Han et al., 2014).
An important strength of this work is the assessment of graph theoretical measures in both functional and structural MR modalities. Graph measures derived from DTI data describe the brain network in terms of strength or coherence of physical connections between gray matter regions, whereas fMRI-derived graph measures describe the relative synchronicity of spontaneous BOLD fluctuations across these regions. Notably, the two are not entirely independent descriptors of brain network topology; connections measured by rs-fMRI are well predicted by structural connections, but not the other way around (Honey et al., 2009, 2010). In other words, the two modalities provide overlapping information sets that complement—rather than replicate—each other.
As mentioned earlier, Q is the degree to which modules within the network are segregated from one another; a network has high Q if nodes in a given module are well connected to each other but not well connected to nodes of different modules. Thus, an increase in Q may be driven by decreases in connectivity between nodes in different modules and/or increases in connectivity between nodes in the same module. For the non-collar-wearing group, our observations of DTI-derived increases in Q with commensurate increases in fMRI-derived Cg and L suggest that both are at play. The observed increase in fMRI-derived Cg indicates that functionally similar nodes (i.e., ones likely in the same module) are increasingly connected. Conversely, the increase in fMRI-derived L indicates an erosion of connectivity between functionally distinct nodes (i.e., ones unlikely to be in the same module). Thus, the DTI- and fMRI-derived graph metrics provide different but complementary evidence of brain network reorganization in response to SCI exposure.
This study does have limitations. First—due to the large number of participants needing to be scanned in short time windows before and after the season—imaging data were acquired on three separate 3T Philips scanners at the same site. However, this should introduce negligible bias, because: (1) image acquisition parameters were harmonized across scanners, (2) study participants were matched to the same scanner for pre- and postseason imaging sessions, and (3) scanner was included as a categorical covariate of no interest in all analyses.
Second, accurately controlling for the number head impacts experienced by each athlete is challenging as accelerometer tracking is unreliable (O'Connor et al., 2017; Press and Rowson, 2017) and we lacked the comprehensive video footage of every practice and game necessary to verify each recorded impact. Consequently, we reported results from models including number of impacts as an explanatory variable as well as models without this factor. The congruence of results between these models suggests that differences in impact exposure between the JVC collar-wearing and non-collar-wearing groups had a small to negligible effect on our observed results.
Finally, this study did not recruit or observe a non-contact-sport control group (e.g., female cross country) against which to compare the longitudinal changes in the non-collar group. Accordingly, it is not appropriate to make clinical judgments on the longitudinal changes in network organization observed in the non-collar group, especially in the absence of concomitant changes in cognitive, behavioral, or neuromotor outcomes. Furthermore, while no negative outcomes associated with collar wearing were observed (e.g. dizziness, syncope, headaches, radiological findings on postseason MRI), this study evaluated the effects of the collar device on imaging-derived connectomic measures over the course of only a single season, and thus we are unable to comment on the long term efficacy and safety of the collar device.
Conclusion
This work adds to the body of evidence that the JVC collar potentially provides an ameliorative effect against SCI exposure (Myer et al., 2016a,b; Yuan et al., 2017, 2018a,b). It also provides novel descriptions of how SCI exposure is associated with subtle but measurable alterations in brain function and structure in youth female soccer athletes (Myer et al., 2019; Svaldi et al., 2020; Yuan et al., 2018b). The clinical impact of the current results is not clear; future work is needed to determine whether and to what extent SCI-associated altered connectivity relates to adverse cognitive, behavioral, or neuromotor outcomes. Given the prevalence of athletic participation and the cruciality of brain development during adolescence, there is a critical need to better study and contextualize these alterations in brain function and structure.
Footnotes
Acknowledgments
The authors would like to thank their outstanding collaborators and support staff who made this large-scale investigation possible. Although it would be difficult to acknowledge all who contributed toward the success of this project, there are those with specific contributions who the authors would like to mention. At Cincinnati Children's Hospital Medical Center, the authors would like to thank faculty members Brian Coley, Charles Dumoulin, Kim Cecil, Megan Narad, and Paul Gubanich; MRI technologists Lacey Haas, Brynne Williams, Matthew Lanier, Kaley Bridgewater, Elizabeth Fugate, and Marty Jones; MRI engineering and technical support Hui Wang, Zach Heeger, and Dennis Flage; and staff members Staci Thomas, Sarah Orban, John Simon, Ryan MacPherson, Katie Kitchen, Katherine Kinsella, James Lynch, and Brooke Gadd. They also express their sincere gratitude to the University of Cincinnati medical student interns, Anna Saltman, Brent Waibel, Madeline Engeler, and Ramsey Sabbagh; undergraduate/graduate student interns from various universities, including Dan Braswell, Nicholas Slaboden, Emma Hansen, Ashley Doud, Lila Wright, Nicholas Zenger, Omar Brijawi, Austin Tiernan, Jennifer Shine, Sydney Hamilton, Saed Mustif, Bradley Jacobs, Enna Selmanovic, Kia Hreno, Emily Hornback, Meghan Swearingen, Kristen Jansen, Savannah Bacon, Nicole Veselitis, Samantha Simms, Cody McMillian, Daniel Riveros Molina, Morgan Froelich, Eric Schmitz, Jordan Maxwell, Philip Wienkamp, Teresa Rust, Courtney Johnson, Walker Engelhard, Kelsey Laizure, John Rizk, Victoria Colacicco, Megan Sloboda, Jessica Culbertson, Elizabeth Reddington, Dylan Kirby, Brady Tincher, Abby Odachowski, and Hima Devgan. The authors also wish to acknowledge and thank student advisors Dan Carl and Susan Kotowski who were critical in helping manage and facilitate the student opportunities to participate in this project. They also express their thanks to the school athletic trainers Katie Taylor, James Muncy, Nathalie Towchik, Alli King, Cindy Busse, Kayla Taske, Becky White, Rebecca Lemmel, Joe Lucas, and Al Ducker; the school athletic directors Tony Hemmelgarn, Steve Ellison, Jan Wilking, Wendy Smith, Kim Gunning, Diane Redmond, Mark Schenkel, and Eric Taylor; school coaches Kevin Spraul, Tino Mam, Karen Wood, Marissa Wolf, Dave Ruehl, Keith Schaeper, Kiersten Johnson, and Heather Vibberts; and team physicians Dr. Kremcheck, D. Argo, Dr. Rice, Dr. Altenau, Dr. Kevin Reilly, Dr. Eugene Reilly, Dr. Patrick Reilly, Dr. Noyes, Dr, Galloway, and Dr. Cha. They also express their thanks to Ed Lodge who helped with accelerometers and Jamison Float for neck collar fitting. Lastly, the authors express their appreciation to the football players and families from the following high schools for being supportive of the authors' mission to keep athletes safe during sport by engaging and participating in this research project: Oak Hills, Walnut Hills, Wyoming, Seton, St. Ursula Academy, Ursuline Academy, Mount Notre Dame, and Cincinnati Hills Christian Academy.
Author Disclosure Statement
No competing financial interests exist.
Funding Information
Funding for this study was provided to Cincinnati Children's Hospital by Q30 Sports Sciences LLC. Q30 Sports Sciences has financial interests in the development of the Q-Collar. One author (GDM) has consulted for Q30 Innovations to support applications with the U.S. Food and Drug Administration but has no financial interest in commercialization of the Q-Collar.
Supplementary Material
Supplementary Data
Supplementary Figure S1
Supplementary Figure S2
Supplementary Table S1
Supplementary Table S2
Supplementary Table S3
References
Supplementary Material
Please find the following supplemental material available below.
For Open Access articles published under a Creative Commons License, all supplemental material carries the same license as the article it is associated with.
For non-Open Access articles published, all supplemental material carries a non-exclusive license, and permission requests for re-use of supplemental material or any part of supplemental material shall be sent directly to the copyright owner as specified in the copyright notice associated with the article.