
Abstract
Background:
Emotion regulation by neurofeedback involves interactions among multiple brain regions, including prefrontal cortex and subcortical regions. Previous studies focused on connections of specific brain regions such as amygdala with other brain regions.
New method:
Electroencephalography (EEG) neurofeedback is used to upregulate positive emotion by retrieving positive autobiographical memories and functional magnetic resonance imaging (fMRI) data acquired simultaneously. A global data-driven approach, group independent component analysis, is applied to the fMRI data and functional network connectivity (FNC) estimated.
Results:
The proposed approach identified all functional networks engaged in positive autobiographical memories and evaluated effects of neurofeedback. The results revealed two pairs of networks with significantly different functional connectivity among emotion regulation blocks (relative to other blocks of the experiment) and between experimental and control groups (false discovery rate corrected for multiple comparisons, q = 0.05). FNC distribution showed significant connectivity differences between neurofeedback blocks and other blocks, revealing more synchronized brain networks during neurofeedback.
Comparison with Existing Methods:
Although the results are consistent with those of previous model-based studies, some of the connections found in this study were not found previously. These connections are between (a) occipital and other regions including limbic system/sublobar, prefrontal/frontal cortex, inferior parietal, and middle temporal gyrus and (b) posterior cingulate cortex and hippocampus.
Conclusions:
This study provided a global insight into brain connectivity for emotion regulation. The brain network interactions may be used to develop connectivity-based neurofeedback methods and alternative therapeutic approaches, which may be more effective than the traditional activity-based neurofeedback methods.
Impact statement
Previous neurofeedback-based emotion regulation studies focused on connections of specific brain regions. This study provided a global insight into brain connectivity for emotion regulation. To this end, fMRI data was acquired while EEG neurofeedback was used to upregulate positive emotion. Then, a global data-driven approach, group independent component analysis (ICA), was applied to the fMRI data and functional network connectivity was estimated. The proposed approach identified all functional networks engaged in positive autobiographical memories and evaluated effects of neurofeedback. While the results were consistent with those of previous studies, some of the connections were not found in the past.
Introduction
Emotion regulation consists of extrinsic and intrinsic complex processes used to modify emotional states or mood that includes maintenance, enhancement, or inhibition of one's behavioral response. Several emotion regulation strategies are proposed in Gross (1998), including situation selection and modification, attentional deployment, cognitive change, and response modulation. Based on previous studies and cognitive models proposed for emotion regulation, emotion regulation involves interactions among different brain regions of prefrontal cortex (PFC) and subcortical regions, especially limbic system (Li et al., 2016; Linhartová et al., 2019). There are various intervention techniques for emotion regulation including pharmacological therapy, deep brain stimulation, transcranial magnetic stimulation, and neurofeedback with different advantages and disadvantages (Papo, 2019).
Neurofeedback is a self-brain training technique used to modulate and enhance brain function through receiving neural activity feedback (Scheinost et al., 2013). Compared with other alternative interventions with side effects, neurofeedback offers various advantages such as noninvasive intervention, long lasting effects, low risk with few side effects, and investigating and understanding the relationship between brain function and behavior (Luigjes et al., 2019; Sulzer et al., 2013; Van Doren et al., 2019).
Several studies have demonstrated the feasibility and effectiveness of neurofeedback for emotion regulation and treatment of mental disorders (Enriquez-Geppert et al., 2017; Gapen et al., 2016; Hartwell et al., 2016; Herwig et al., 2019; Kinreich et al., 2012; Lackner et al., 2016; Liew et al., 2016; Mennella et al., 2017; Nicholson et al., 2016; Quaedflieg et al., 2016; Sitaram et al., 2017; Young et al., 2018b; Zuberer et al., 2018). The training results can be quantified as changes in the activity/function of the brain networks or behavior in medical (clinical symptoms) or nonmedical applications.
Electroencephalography (EEG) and functional magnetic resonance imaging (fMRI) are two main neuroimaging modalities used in several studies of neurofeedback with demonstrated effects on the brain functions for treatment of mental disorders or emotion regulation (Enriquez-Geppert et al., 2017; Gapen et al., 2016; Linhartová et al., 2019; Morgenroth et al., 2020; Wang et al., 2019).
Recent advances in data acquisition have made it possible to perform simultaneous recording of EEG and fMRI especially for neurofeedback (Goldman et al., 2000; Ives et al., 1993). Simultaneous EEG-fMRI utilizes the advantages of both modalities especially high temporal and spatial resolutions (Ritter and Villringer, 2006). It provides the ability to access deep brain regions and design new neurofeedback paradigms that can be used later using EEG alone to avoid the cost of fMRI neurofeedback (Zotev et al., 2014). The ability to modulate and apply interventions on the involved brain circuits through EEG neurofeedback along with simultaneous fMRI will provide valuable information to understand the interactions among the brain circuits in various clinical applications.
According to several researches and recently fMRI review study, several brain circuits consisting of deep brain regions (including limbic system) and prefrontal regions are involved with the normal and abnormal behaviors as well as the emotion regulation process (Linhartová et al., 2019; Phillips et al., 2008).
From the limbic system, amygdala plays a key role in generating and regulating emotional responses besides other deep regions such as thalamus and insula. Amygdala interacts with several limbic and prefrontal regions during different emotional stimulus and regulation states (Zotev et al., 2011). Prefrontal regions especially dorsolateral prefrontal cortex (DLPFC), ventrolateral prefrontal cortex (VLPFC), and dorsomedial prefrontal cortex and orbitofrontal cortex (OFC) with reciprocal connections to amygdala play key roles in different steps of emotion regulation such as generation of emotional states (Kohn et al., 2014; Linhartová et al., 2019; Svoboda et al., 2006).
Also, in several mental disorders including neurological and psychiatric diseases, abnormality has been reported in various brain networks and connectivity of the brain regions (Broyd et al., 2009; Fornito et al., 2015; Yamashita et al., 2017). Since cognitive functions and behaviors are related to the brain networks, understanding the interactions among the brain networks may be used to develop new therapeutic paradigms to modify specific brain networks (such as connectivity-based neurofeedback) and also can be used as a biomarker for mental disorders (Kim et al., 2015; Koush et al., 2017; Megumi et al., 2015). Despite existence of several emotion regulation studies using neurofeedback, interactions among brain regions/networks involved in emotion regulation are still unclear (Li et al., 2016; Sulzer et al., 2013). Therefore, comprehensive analysis of fMRI data is needed to have a better understanding of the brain function as a result of neurofeedback.
This study proposes to use a global data-driven approach to identify functional networks and discover all connections among functional networks that are involved in emotion regulation as a result of neurofeedback. To this aim, EEG neurofeedback is used to upregulate positive emotion through induced happiness (by retrieving positive autobiographical memories) while acquiring fMRI data simultaneously. Independent component analysis (ICA) is a data-driven method that does not need prior model of data to extract distinct spatially independent functional networks whose time courses are not necessarily independent. This method reveals functional network connectivity (FNC) as the temporal correlation/dependency among the time courses of independent components (ICs; Calhoun et al., 2001; Meda et al., 2009).
Most of the previous emotion regulation studies used model-based methods for functional connectivity analysis and found connections among specific brain regions, such as amygdala and rest of the brain (Ferri et al., 2016; Li et al., 2016; Murphy et al., 2016; Seeley et al., 2019; Zotev et al., 2011, 2013). The aim of this study is to discover the effect of neurofeedback on connectivity of functional networks and compare the FNC between emotion regulation blocks and other blocks of experiment. We hypothesize that emotion regulation using neurofeedback changes the connectivity of distinct functional networks in/between prefrontal and limbic regions. To the best of our knowledge, this is the first study based on ICA to examine FNC and quantify the connectivity changes due to emotion regulation through EEG neurofeedback.
Our approach can be outlined as follows: we utilize group ICA to identify spatially independent functional networks. Then, the pair-wise correlation between the time courses of these functional networks among all participants is calculated to discover significant connections as a result of neurofeedback. This is done by comparing FNC of emotion regulation blocks and other blocks of the experiment and also those of the experimental and control groups.
Materials and Methods
Research protocol and participants
The research protocol was approved by the ethics committees of the Iran University of Medical Sciences, Tehran, Iran. Eighteen healthy males (age 26.7 ± 3.6 years) as the experimental group and 14 healthy males (mean age 27 ± 3.8 years) as the control group participated in this study. The exclusion criteria included existence or history of major psychiatric or neurological disorder, drug or alcohol abuse during the past year, brain surgery, and problems related to being imaged by magnetic resonance imaging (MRI). All participants were right handed with normal or corrected-to-normal vision.
Before the experiment, two psychometric tests including Beck's Depression Inventory (BDI) (Craven et al., 1989) and General Health Questionnaire-28 (GHQ-28; Nazifi et al., 2014) were completed by each participant. The mean ± standard deviation of Beck's Depression Inventory and GHQ-28 was 6.8 ± 3 and 2.2 ± 2, respectively. The participants were normal according to the scores of the Beck's Depression Inventory and nonpsychiatric according to the scores of the GHQ-28 test.
Participants in the experimental group experienced emotion regulation with real EEG neurofeedback, whereas the control group experienced the same protocol with the sham EEG neurofeedback. The experiment contained 10 runs of three blocks, namely, rest, view, and upregulation. Before the experiment, each participant was asked to write at least 10 positive autobiographical memories. Different from similar paradigms used in Young et al. (2014), Zotev et al. (2014, 2016), during blocks of view and upregulation, pictures of positive autobiographical memories (expressed during interviews) were presented to increase the effectiveness of retrieving positive autobiographical memories. The duration of the rest, view, and upregulation blocks was 20, 40, and 60 sec, respectively.
During the rest block, the participants were asked to relax without remembering anything. In the view block, two pictures (from those announced during interview) were presented for 40 sec and the participants were asked to see them without remembering anything. In the upregulation block, two images similar to the view block were presented and participants tried to remember the autobiographical positive memories related to the presented images and increase the height of the neurofeedback bar.
Neurofeedback was presented only in the upregulation period based on the approach–withdrawal hypothesis (Davidson, 1998; Davidson et al., 1990) and was calculated as the difference between the EEG power in the right and left hemispheres in the alpha frequency band in 2 sec time windows, updated every 1 sec with 50% overlap between the consecutive windows. The paradigm is shown in Figure 1. The effectiveness of the neurofeedback through retrieving positive autobiographical memories is described in Supplementary Data.

The timing of rest, view, and upregulation blocks for each run of neurofeedback. Color images are available online.
Data acquisition
The MRI data were acquired using a 3 Tesla Scanner (Prisma; Siemens, Erlangen, Germany) located in the National Brain Mapping Lab, Tehran, Iran. fMRI was acquired using a T2*-weighted gradient-echo, echo-planar pulse sequence (TR = 2000 msec, TE = 30 msec, matrix size = 64 × 64 × 30, and voxel size = 3.8 × 3.8 × 4 mm). During the 10 runs of the experiment session, 650 volume images were acquired. Structural images were acquired using a gradient-echo T1-weighted MPRAGE pulse sequence (TI = 1100 msec, TR = 1810 msec, TE = 3.47 msec, and voxel size = 1 × 1 × 1 mm).
The EEG data were recorded simultaneously with fMRI using an MRI-compatible EEG system (Brain Products, München, Germany). The EEG cap had 63 electrodes according to the 10–20 system and 1 electrocardiography electrode. The impedances of the EEG electrodes were maintained <5 K Ohms and the EEG signal was recorded at 5K samples per second. The task was presented by Psychtoolbox program through a coil-mounted display.
Real-time data analysis
Owing to practical limitations, neurofeedback was provided only based on the EEG signal. The BrainVision RecView software (Brain Products GmbH) was used to remove MRI and ballistocardiogram artifacts from the 64-channel EEG data in real time using a moving average method. As the mean head displacement obtained in offline analysis was 0.41 ± 0.17 mm, the result of moving average template subtraction did not differ significantly from the counterpart methods used in offline analysis (Moosmann et al., 2009; Niazy et al., 2005).
The denoised data were downsampled to 250 samples per second. Then, the difference in powers of the channels F4 and F3 in the alpha band (frontal asymmetry) was calculated every 1 sec using a 2 sec moving window in the upregulation blocks with respect to the baseline, where the baseline was the average difference between the powers of the channels F4 and F3 in the previous view block. The frontal asymmetry index was presented as a neurofeedback bar during the upregulation blocks.
Offline data analysis
As depicted in Figure 2, the offline analysis consisted of several steps including fMRI preprocessing, group ICA analysis, IC selection, cross-correlation between time courses of ICs for each participant in the experimental group, statistical test to determine the significant functional connectivity between ICs in the upregulation versus view blocks for the experimental group, and finally statistical test between the experimental and control groups to reveal the effect of neurofeedback.
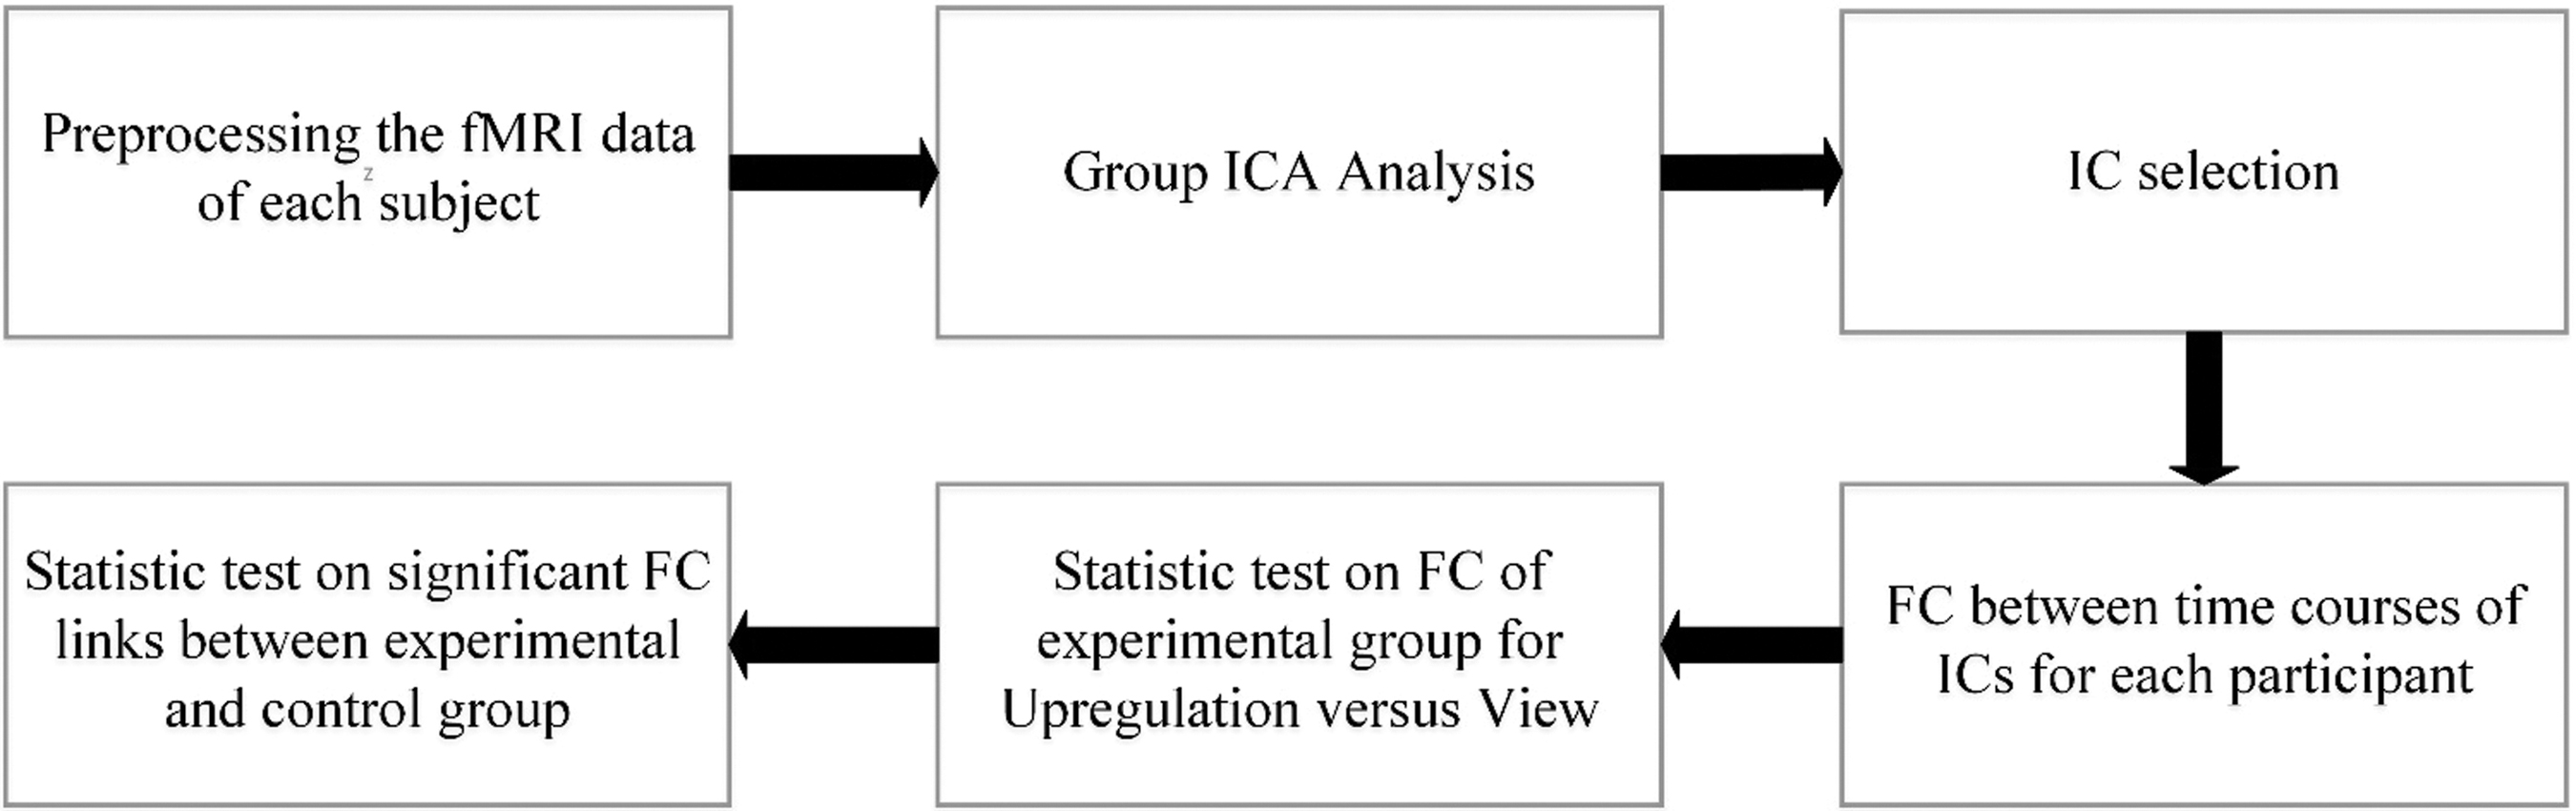
Block diagram of offline analysis. FC, functional connectivity; fMRI, functional magnetic resonance imaging; ICs, independent components; ICA, independent component analysis.
Preprocessing of the fMRI data was performed in FMRIB Software Library and included slice timing correction, rigid body motion correction with six degrees of freedom (mean head motion for the experimental group was 0.40 ± 0.13 mm and that for the control group was 0.42 ± 0.22 mm), normalization to the Montreal Neurological Institute (2 mm) standard space, spatial smoothing using an 8-mm full width at half-maximum Gaussian kernel, and temporal high-pass filter (cutoff = 0.005 Hz; Smith et al., 2004; FSL, 2006).
After preprocessing, a group ICA method was applied on all subjects to identify spatially ICs (networks) using the Group ICA of fMRI Toolbox (GIFT) (Calhoun et al., 2001). This step included data reduction using principle component analysis and evaluation of the reliability of ICs using the ICASSO software, which investigated reliability of ICA estimates by clustering and visualization of the results of multiple runs of ICA.
The number of ICs was estimated to be 51 using the minimum length criteria (Li et al., 2007). Then, back reconstruction was used to estimate the spatial map and time course of each IC for each subject. Before connectivity analysis, the ICs corresponding to noise, motion artifacts, breath, or heartbeat were removed by visual inspection of the group ICs, yielding 43 ICs for further analysis. Next, the cross-correlation functional connectivity between the time courses of ICs for each participant was calculated.
Estimation of functional network connectivity
Spatial ICA decomposed the fMRI data into spatially independent maps (functional networks) and the corresponding time courses. According to Jafri et al. (2008), FNC between ICs can be estimated as the Pearson correlation of the IC's time courses. Using this approach, FNC was estimated between each pair of 43 ICs both in the view and upregulation blocks separately for each participant in the experimental group. Then, for each connection (each pair of ICs), a statistical test (paired t-test) was performed to specify whether this connection was significantly different between upregulation and view among all participants of the experimental group. The procedure was repeated for 43 × (43-1)/2 = 903 different connections, by considering the false discovery rate (FDR) correction for multiple comparisons at q = 0.05.
To reveal the effect of neurofeedback, the extracted significant links (upregulation–view) for the experimental group were compared with those of the control group and connections significantly different between the experimental and control groups were identified as the neurofeedback effect of emotion regulation. For this purpose, a two-sample t-test was performed between the experimental and control groups on the significant connections (obtained by comparing the upregulation and view blocks of the experimental group) and FDR corrected for multiple comparisons at q = 0.05. Estimation of FNC between the ICs (Pearson correlations of the IC's time courses) and calculation of statistical tests was done using MATLAB and Statistics Toolbox Release 2016b.
Results
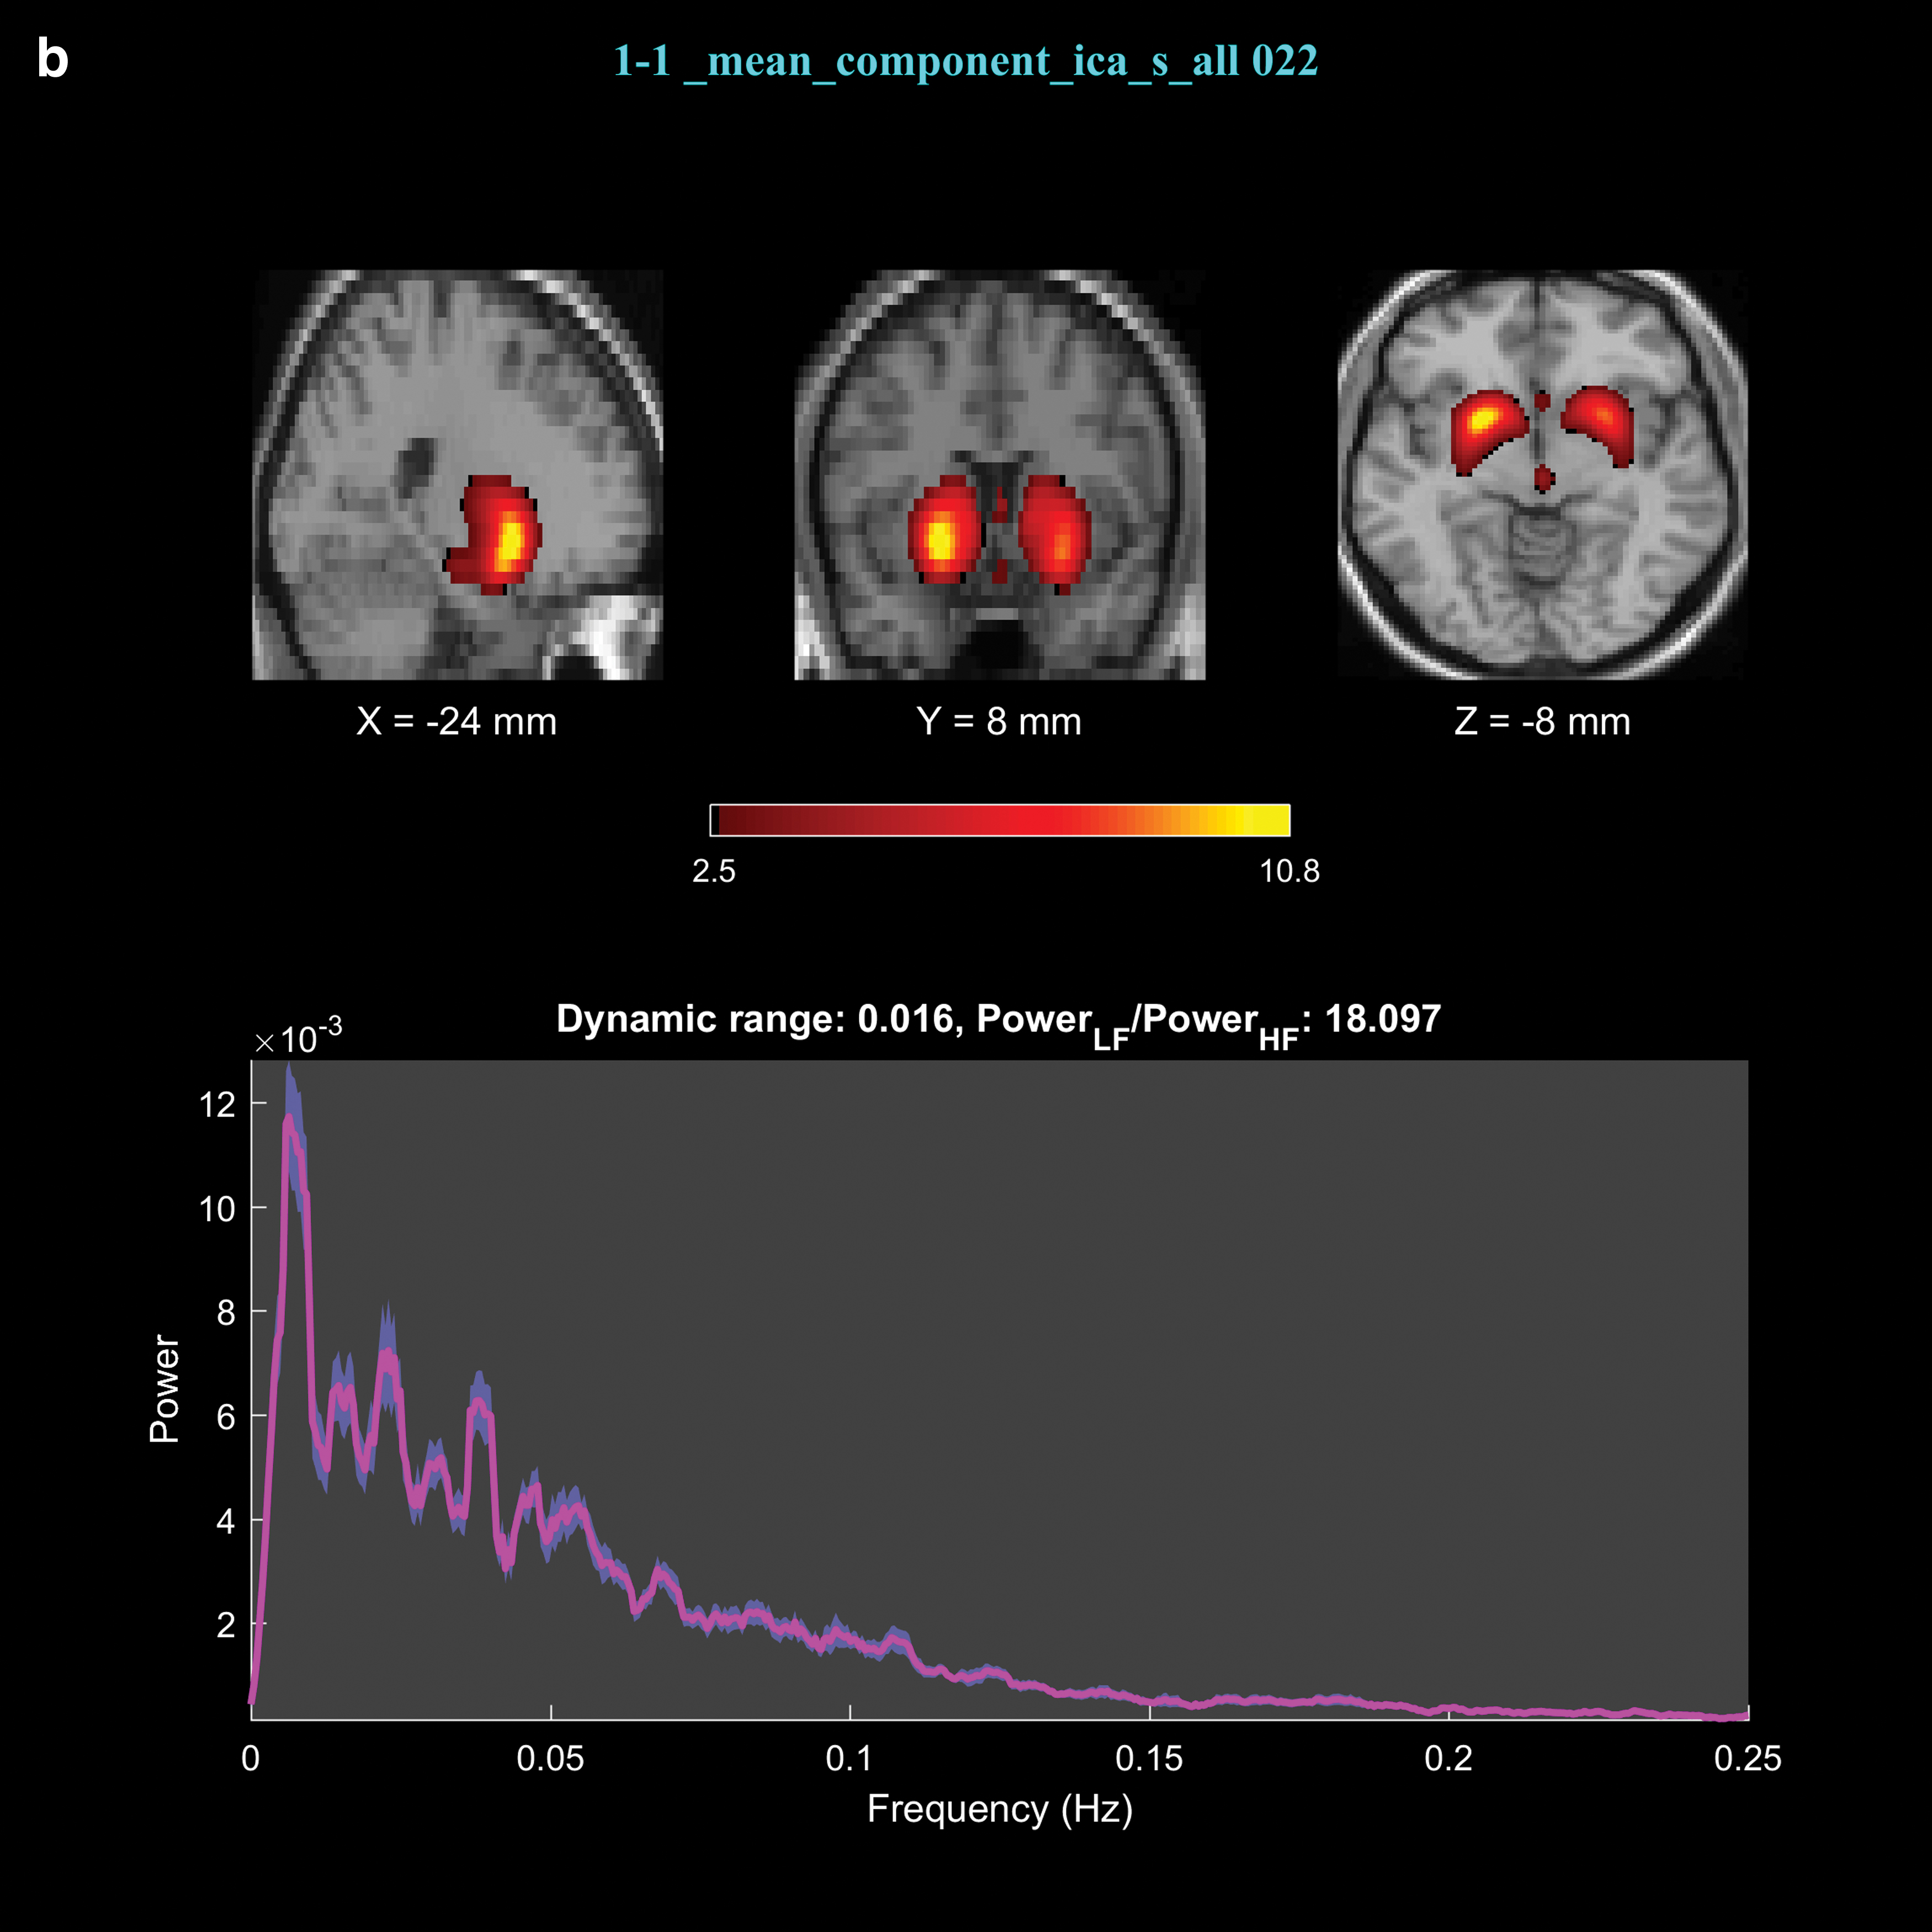
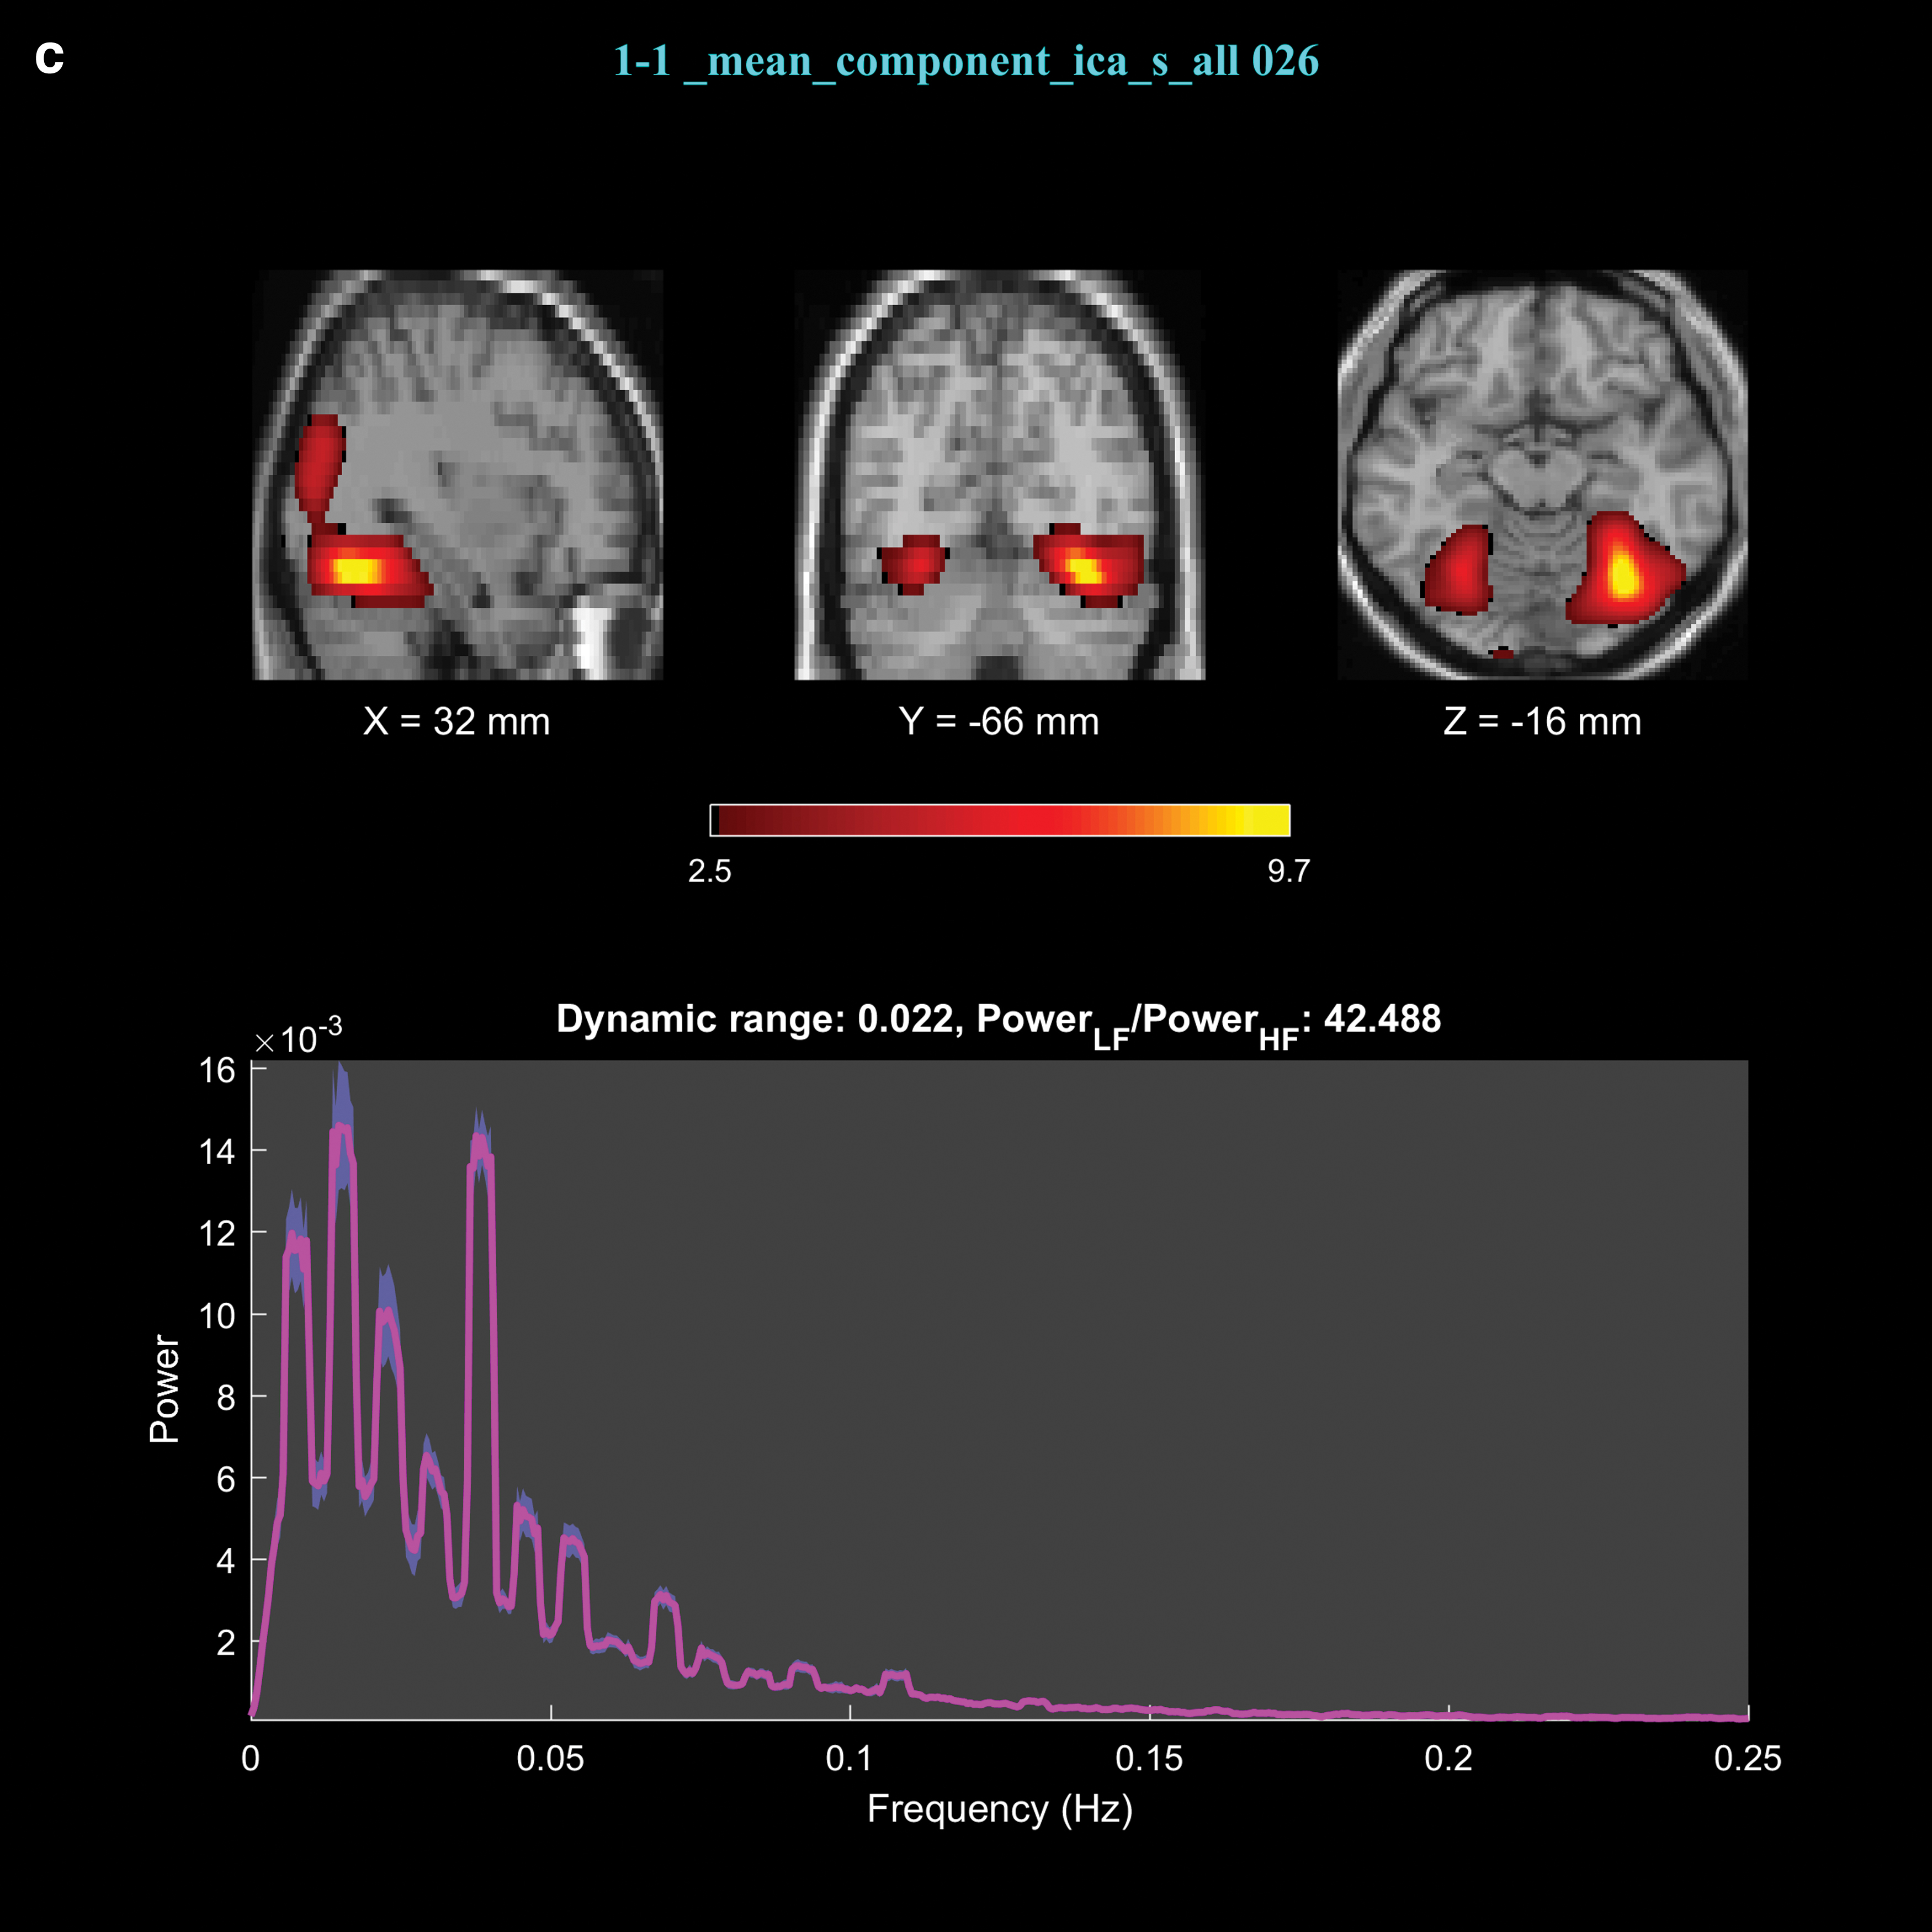
The FNC results revealed 32 significant connections among 43 × (43-1)/2 = 903 connections between the upregulation and view blocks, out of which 2 were significantly different between the experimental and control groups. The significant connections were between IC9 and IC22 with p-valueupregulation versus view of experimental group = 1.7 × 10⁻³ (p-valueexperimental group versus control group = 3 × 10⁻³), and between IC26 and IC44 with p-valueupregulation versus view of experimental group = 8.7 × 10⁻⁵ (p-valueexperimental group versus control group = 2.6 × 10⁻⁴). The spatial maps and the brain regions for these components are presented in Figure 3 and Table 1.

Spatial maps and power spectrum of the time courses corresponding to components 9

Brain Regions Identified by Components 9, 22, 26, and 44
DLPFC, dorsolateral prefrontal cortex; IC, independent component; MNI, Montreal Neurological Institute; OFC, orbitofrontal cortex; PCC, posterior cingulate cortex; VLPFC, ventrolateral prefrontal cortex.
The connectivity changes between the two pairs of networks (ICs 9–22 and 26–44) for the view and upregulation blocks in the experimental group are presented in Figure 4. This figure illustrates that as a result of neurofeedback, the connectivity between ICs in the upregulation blocks is higher than the view blocks.
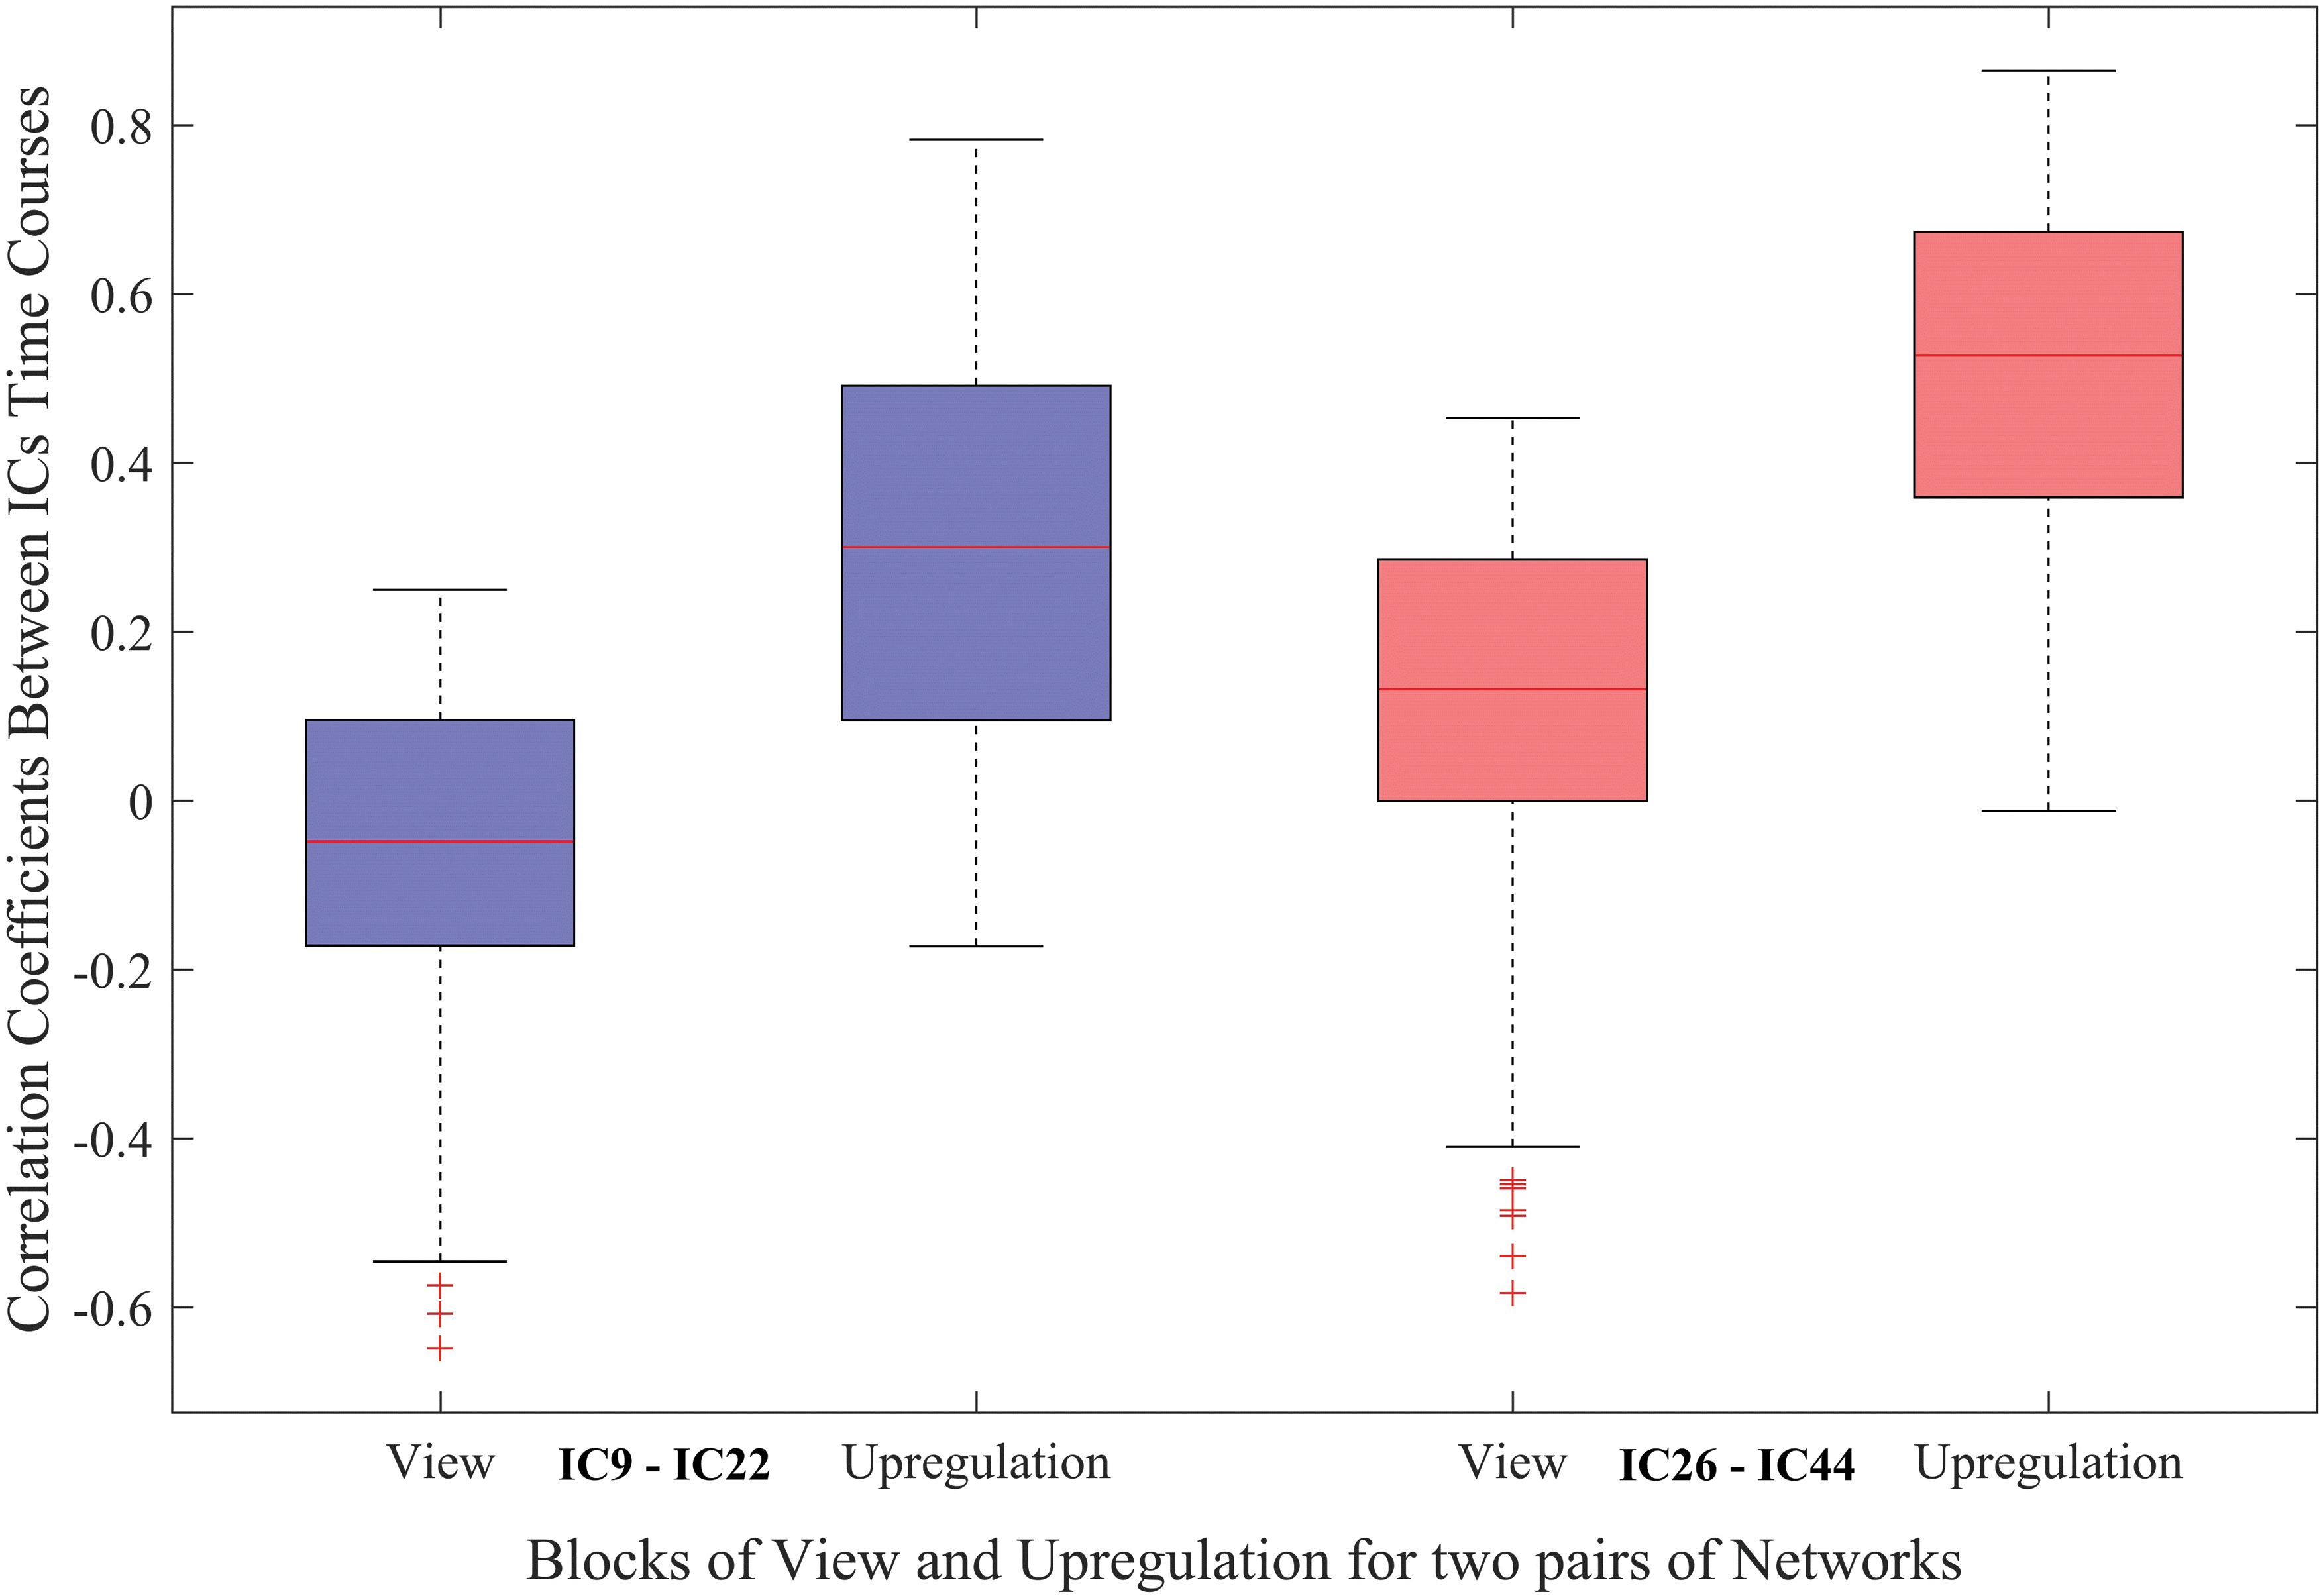
Functional network connectivity between significant connections (FDR corrected for multiple comparison at q = 0.05) for the view and upregulation blocks in the experimental group. FDR, false discovery rate. Color images are available online.
Figure 5 shows the differences between functional connectivity of upregulation and view for ICs 9–22 and 26–44 in the experimental and control groups. This figure illustrates that the real neurofeedback has increased the differences between functional connectivity of upregulation and view of ICs more than sham neurofeedback.
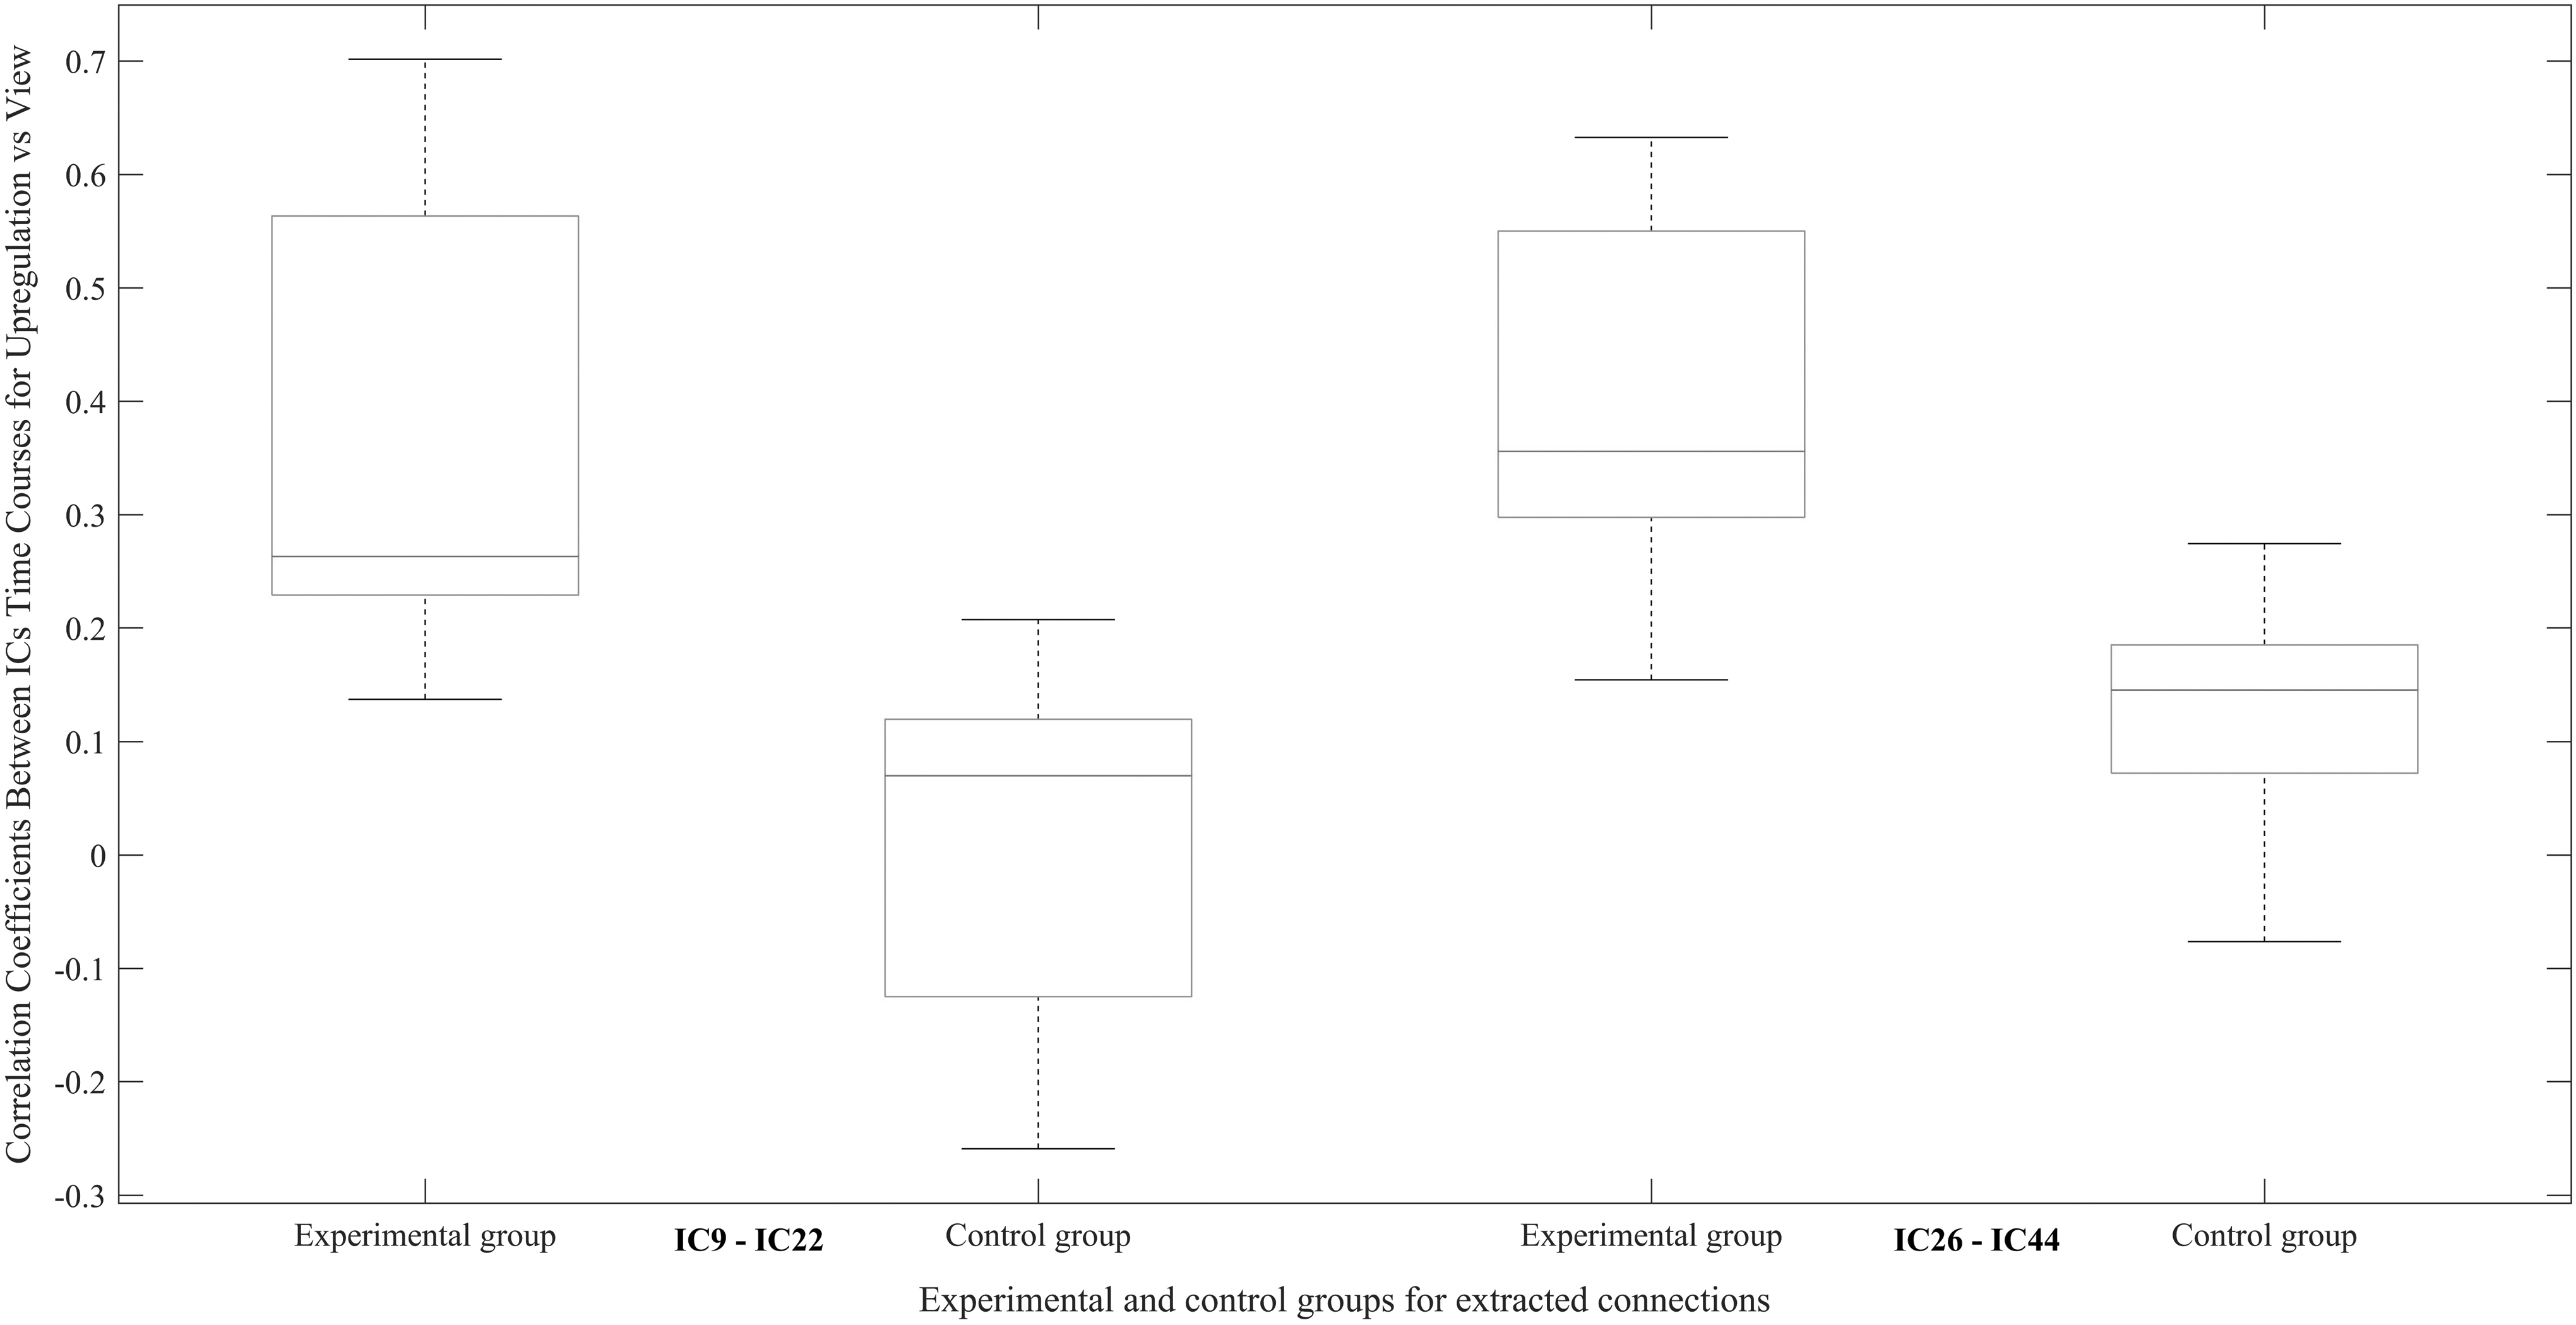
Difference between functional connectivity of upregulation and view of ICs 9–22 and 26–44 in the experimental and control groups.
To have a better understanding of the distinction between functional connectivity of upregulation and view blocks, the FNC distribution (FNCD) of two identified connections (between ICs 9–22 and 26–44) for the experimental group is presented in Figure 6. For this purpose, the range of correlation coefficients for the view and upregulation blocks is divided into 15 sections (bins), separately. Then, the number of correlation coefficients in each bin is plotted and a Gaussian curve is fitted to the resulting FNCD of the view and upregulation blocks. This figure shows that the FNCD in the upregulation blocks is higher and distributed toward positive connectivity than the view blocks, which means that brain networks are more synchronized during the upregulation (neurofeedback) blocks.
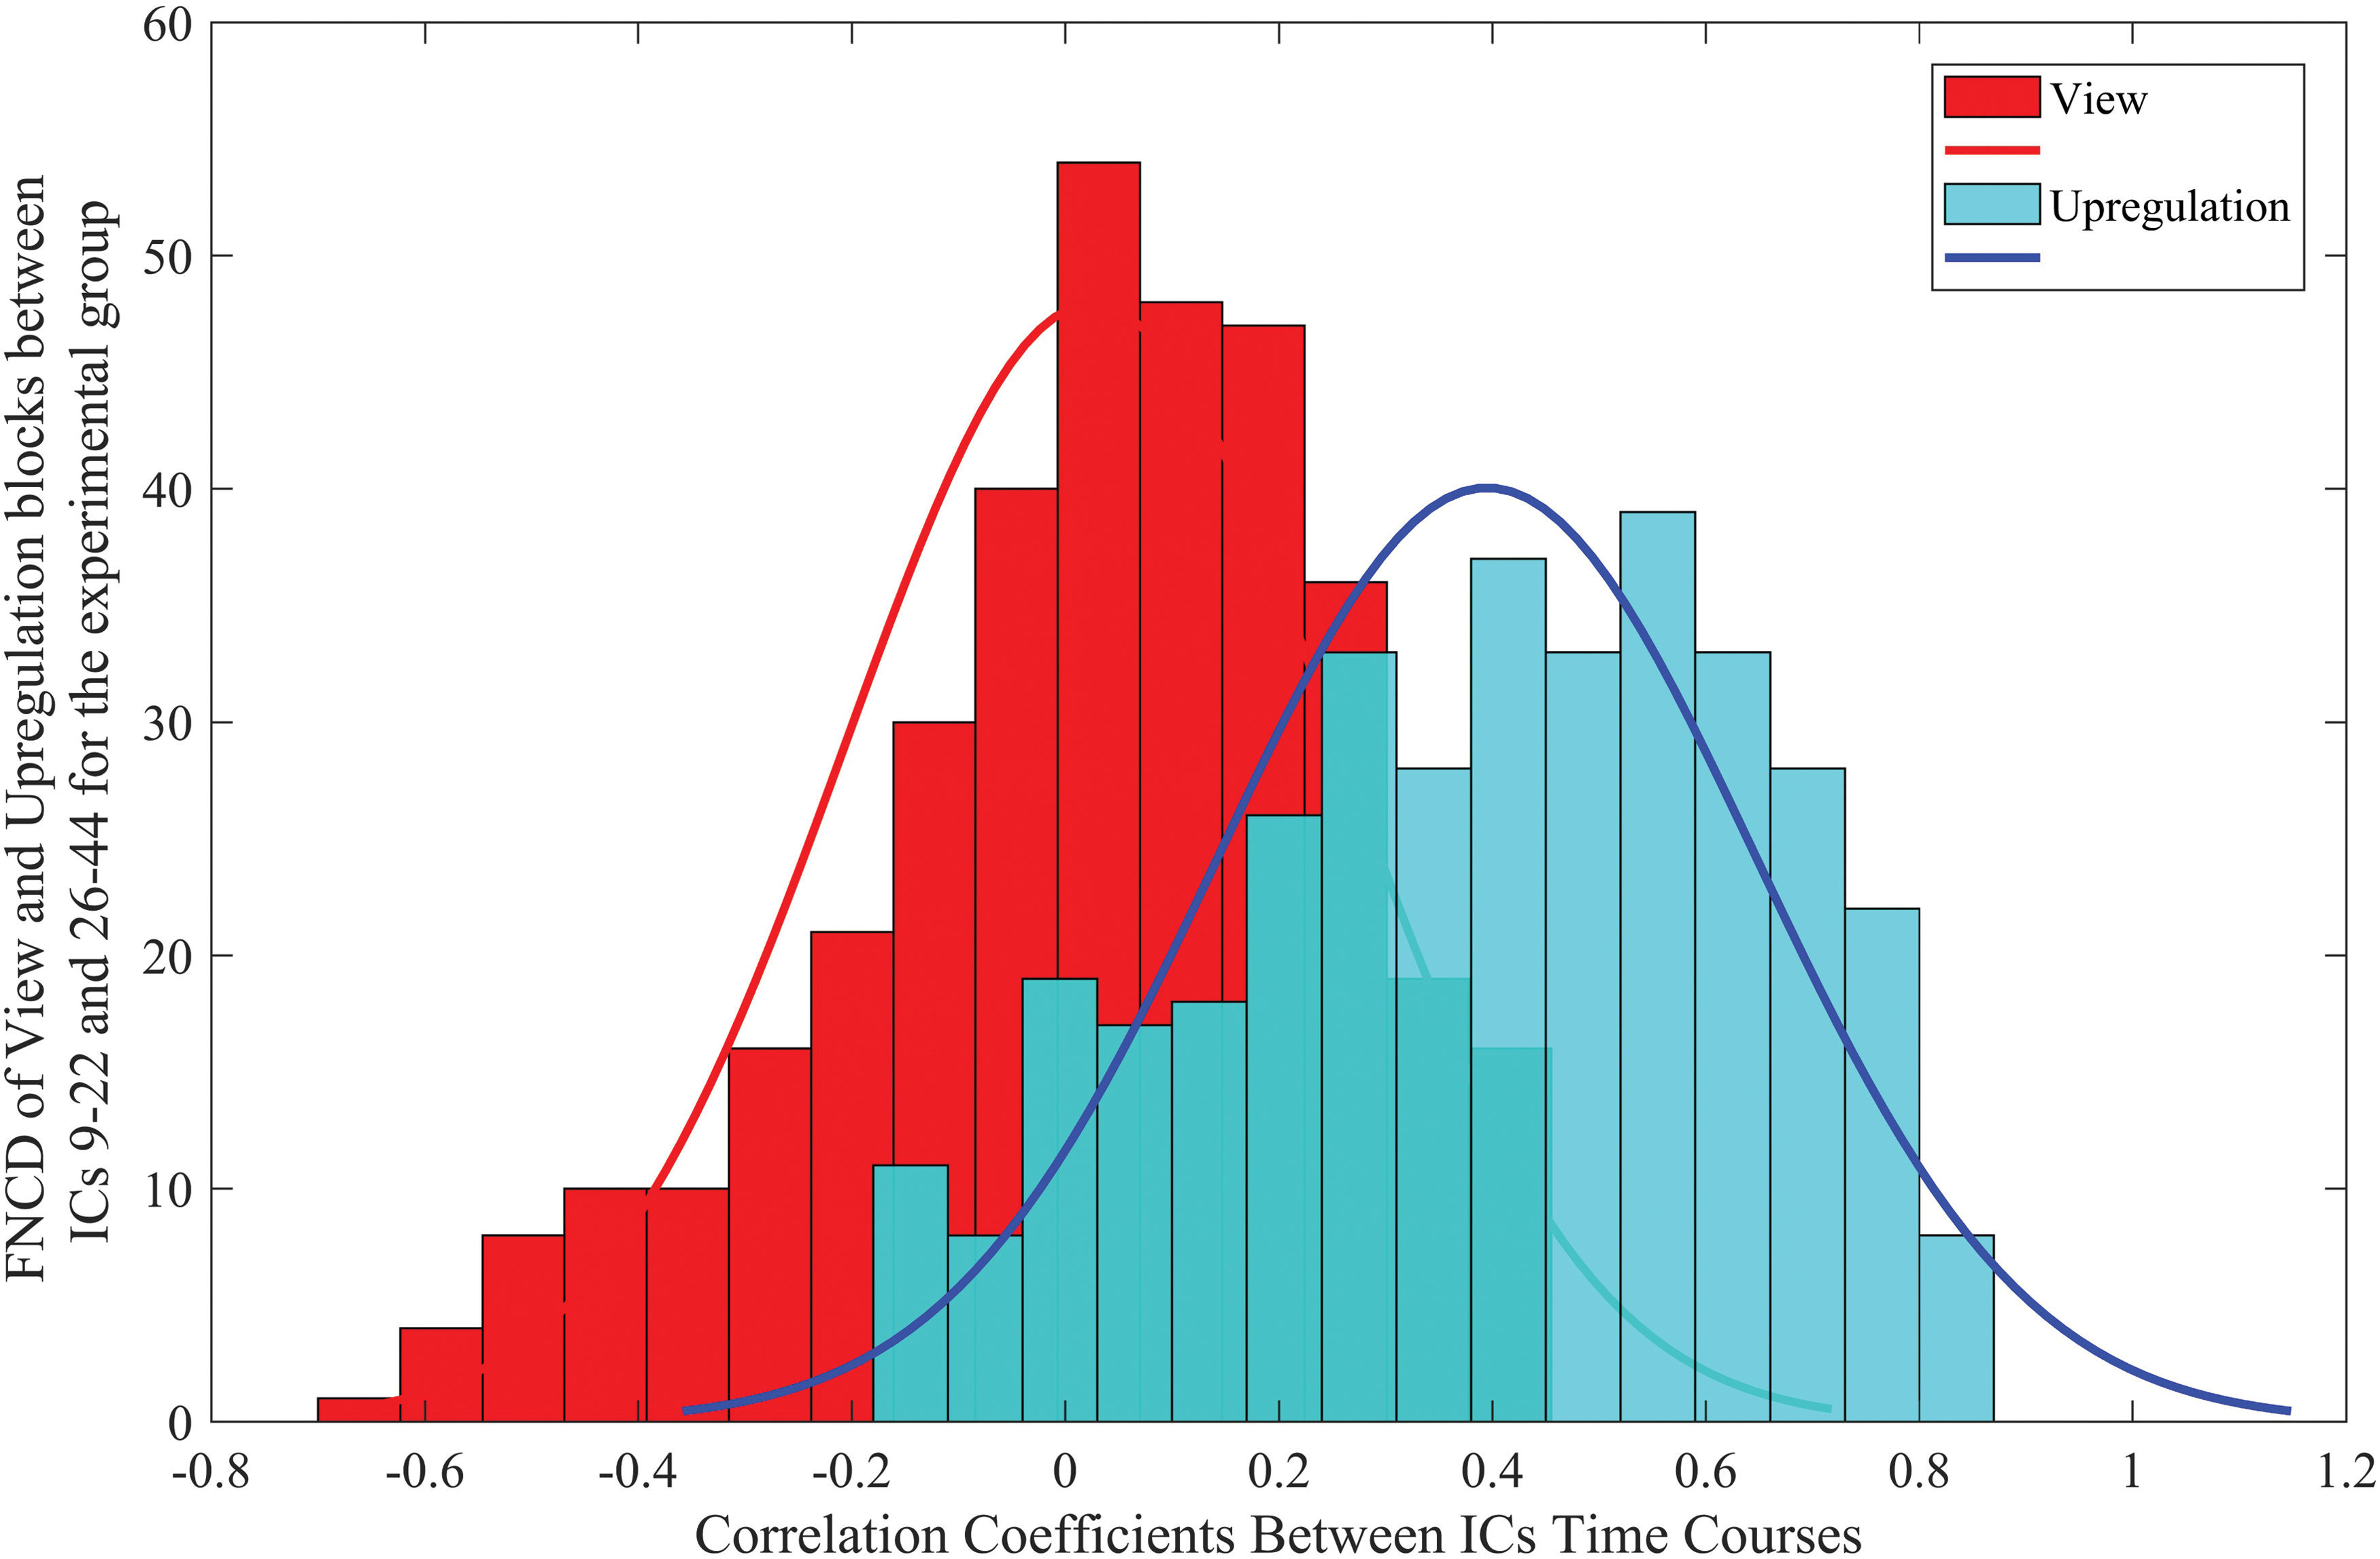
FNCD for the view and upregulation blocks of the two identified connections (between ICs 9–22 and 26–44) for the experimental group. FNCD, functional network connectivity distribution. Color images are available online.
Discussion
This study used group ICA as a framework to determine spatial maps of the brain functional networks and evaluate the interactions of the brain networks in two conditions of emotion regulation. In contrast to previous model-based studies (Young et al., 2014; Zotev et al., 2011, 2014, 2016), the functional networks were found without prior information/models. Functional connectivity was estimated by the Pearson correlation of the time courses of the ICs.
Significant connections during neurofeedback were found between IC9–IC22 and IC26–IC44. The brain regions corresponding to these ICs are presented in Table 1, consistent with the function and role of these regions reported during emotion regulation and retrieving autobiographical memories (Dehghani et al., 2019; Zotev et al., 2011, 2014, 2018).
The 9th IC includes cuneus, precuneus, VLPFC, DLPFC, and posterior cingulate cortex (PCC). The 22nd IC contains amygdala, caudate, hippocampus, insula, putamen, and thalamus. The 26th IC contains cuneus, middle occipital, fusiform, and lingual gyrus. The 44th IC includes ventral striatum, VLPFC, DLPFC, OFC, inferior parietal, and middle temporal gyrus. Therefore, the main regions of IC9 are in the occipital, parietal, PFC, and limbic system and those of IC22 are in the limbic system and sub-lobar. Similarly, for IC26, they are in occipital, and for IC44, they are in the limbic system, parietal, temporal, and prefrontal/frontal cortex regions.
Functional connectivity analysis revealed significant correlation of IC9 and IC22 between the occipital/limbic/PFC/parietal and limbic/sub-lobar networks, and that of IC26 and IC44 between occipital and limbic/parietal/temporal/prefrontal (frontal) networks. Notably, as shown in Figures 4 and 6, the functional connectivity between the two pairs of networks during upregulation is higher than the view blocks. This indicates additional coherence and synchronization among the brain regions during upregulation of positive emotion.
According to the emotion regulation model, emotion is generated by subcortical regions (amygdala and ventral/dorsal striatum; Kohn et al., 2014). The trigger for emotion generation is by visual stimulus of individual positive images of autobiographical memories. The visual information of images is processed in the occipital lobe whereas the emotion is generated by the subcortical regions, especially the amygdala.
Other processes and steps of emotional regulation, including the (1) appraisal of stimulus, (2) detection and initiation of regulation, and finally, (3) regulation and generation of new emotional states, are performed by brain regions such as VLPFC, DLPFC, middle temporal gyrus, insula, and amygdala (Kohn et al., 2014). Therefore, increased connectivity between occipital regions and frontal, limbic system (amygdala and ventral/dorsal striatum including putamen and caudate), and insula as a hub of receiving emotional signals from other brain regions in IC9–IC22 and IC26–IC44 is likely related to the processing of the visual stimulus by the occipital regions in the beginning of the three steps of emotion regulation (Chen et al., 2009; Kohn et al., 2014; Pohl et al., 2013).
As mentioned by Seeley et al. (2019), functional connectivity changes between insula and occipital region (cuneus) and between PFC and occipital regions (cuneus, lingual gyrus, middle occipital, and fusiform) are significant in decreasing negative emotion. They seem to behave similarly in increasing positive emotion (based on neurofeedback and paradigm in this study) as reported in connections 9–22 and 26–44.
The increased functional connectivity between cuneus and thalamus and between cuneus and hippocampus (IC9 and IC22) may be interpreted according to the role of hippocampus in memory retrieval that may initiate by images of positive autobiographical memories, and thalamus in relaying sensory information to occipital regions (Cerqueira et al., 2008; Jin and Maren, 2015; Wei et al., 2019).
The rise of functional connectivity between PCC and hippocampus (IC9 and IC22) is because of their involvement in the memory system (Cheng et al., 2018).
The coactivation pattern between amygdala and VLPFC is according to the first and third steps of the emotion regulation model, where the appraisal of the stimulus occurs through a signaling from amygdala and basal ganglia to VLPFC through insula, and generation of emotion response occurs through a feedforward signal from VLPFC to amygdala (Kohn et al., 2014). The rise of functional connectivity between insula and VLPFC/DLPFC is according to their same roles in three steps of emotion regulation model (Kohn et al., 2014). Increased connectivity between DLPFC and amygdala is related to the third step of the emotion regulation model and reciprocal anatomical connections in frontal brain regions and also between frontal and limbic system.
The increased connectivity between PCC and amygdala is mediated by the structural projections of the cingulate cortex to amygdala and the PFC (Stevens et al., 2011). Decreased functional connectivity between PCC/precuneus and amygdala was associated with higher anxiety and the ability to regulate emotion, and decrease in this symptom was associated with greater functional connectivity between PCC/precuneus and amygdala (Hahn et al., 2011; Hamm et al., 2014; Li et al., 2016). Therefore, after emotion regulation, increased happiness, and decreased sadness (and also decreased anxiety according to psychometric tests), the functional connectivity between PCC and amygdala enhanced (IC9–IC22).
Parietal and temporal regions are involved in attention deployment and also integration of sensory information (Aday et al., 2017; Johnson, 2001; Sheldon et al., 2016). Therefore, the coactivation pattern between temporo/parietal regions and occipital regions (IC26–IC44) is potentially related to the processing of visual–sensory information and attention deployment.
Precuneus, as a region of parietal lobe, plays a key role in visual processing and visual attentional deployment, retrieving autobiographical memories, and direct regulation of amygdala activity to emotional stimulus through attentional deployment (Daselaar et al., 2008; Ferri et al., 2016).
Previous studies (Hahn et al., 2011; Hamm et al., 2014; Li et al., 2016; Sato et al., 2019) revealed that increased functional connectivity between amygdala and precuneus was associated with subject happiness scale (and decreased anxiety), similar to neurofeedback paradigm used in our study. Therefore, according to the role of precuneus in attentional deployment to visual images of positive autobiographical memories and emotion generation by amygdala, the functional connectivity between amygdala and precuneus increased. Increased functional connectivity between amygdala and precuneus was also correlated with regulation success and symptom improvement, using positive autobiographical memories and neurofeedback in major depression disorder (Stevens et al., 2011; Young et al., 2016, 2018a).
Increased functional connectivity between precuneus and hippocampus may be interpreted according to their same roles in retrieving autobiographical memory.
Overall, these findings provide significant correlation between brain regions from frontal, occipital, temporal, and limbic systems. They can be used as markers for treatment, treatment monitoring, or design of new treatment paradigms according to the interactions of the brain networks (connectivity-based neurofeedback).
Most of the identified networks (especially for regions located in prefrontal/frontal cortex) have a peak value in the left hemisphere. According to the approach–withdrawal hypothesis, more activity of the left hemisphere is associated with emotions such as joy (Davidson, 1998; Davidson et al., 1990), consistent with the neurofeedback paradigm and findings reported in this study. In the identified connections, the coactivation pattern between the prefrontal/frontal regions and other regions (limbic and occipital) provides valuable information for practical neuromodulation applications, especially neurofeedback, where the prefrontal activity can be measured by EEG and enhancement/modulation of other brain regions can be predicted.
Although the FNC results of this study are consistent with those of the previous studies and emotion regulation models, some of the connections identified in this study were not found in the previous studies. These connections are between (1) occipital (fusiform, cuneus, middle occipital, and lingual gyrus) and other regions including limbic system/sub-lobar (thalamus, hippocampus, amygdala, caudate, putamen, insula, and ventral striatum), prefrontal/frontal cortex (DLPFC, VLPFC, and OFC), inferior parietal and middle temporal gyrus and (2) PCC and hippocampus. Table 2 compares brain functional connectivity found in previous studies with those of this study.
Comparison of Brain Connectivity Changes in Emotion Regulation Studies and This Study (as a Result of Neurofeedback)
ACC, anterior cingulate cortex; DMPFC, dorsomedial prefrontal cortex; IFG, inferior frontal gyrus; PFC, prefrontal cortex; SFG, superior frontal gyrus; SMA, supplementary motor area; TPJ, temporoparietal junction; VMPFC, ventromedial prefrontal cortex.
Simultaneous recording of EEG and fMRI for neurofeedback is expensive and also time consuming due to the practical problems such as installation of the EEG electrodes on the participant's head. Therefore, the sample size of our study (n = 32) is relatively small but similar to or higher than those of the related previous studies (Perronnet et al., 2017; Zotev et al., 2014). Notably, among the 55 studies reviewed (Linhartová et al., 2019), 50 studies had sample sizes similar or less than ours. Moreover, each participant in this study had 10 runs of three blocks, namely, rest, view, and upregulation. The reliability of the ICA-derived networks was additionally assessed using ICASSO (20 iterations).
Owing to previous reports of gender-specific differences in emotion regulation and process (Mak et al., 2009a,b; McRae et al., 2008; Whittle et al., 2017), all participants in this study were male. Future studies may be conducted on the female subjects using the same emotion regulation paradigm.
Conclusions
The EEG neurofeedback along with induced positive autobiographical memories was used to modulate the activity and connectivity of brain regions during emotion regulation. Effectiveness of EEG neurofeedback in changing activity of brain regions during emotion regulation was demonstrated in previous studies. In contrast to the previous model-based studies (Ferri et al., 2016; Li et al., 2016; Murphy et al., 2016; Seeley et al., 2019; Zotev et al., 2011, 2013), group ICA was used as a global data-driven method to identify and characterize functional connectivity among all brain networks involved in neurofeedback. Experimental results revealed effects of neurofeedback in emotion regulation as increased interaction/connectivity among multiple brain regions, including prefrontal, limbic, temporal, and occipital regions.
The brain connections identified in this study include those reported in the previous studies (Table 2) but also include additional connections between (1) occipital (fusiform, cuneus, middle occipital, and lingual gyrus) and other regions including limbic system/sub-lobar (thalamus, hippocampus, amygdala, caudate, putamen, insula, and ventral striatum), prefrontal/frontal cortex (DLPFC, VLPFC, and OFC), inferior parietal, and middle temporal gyrus and (2) PCC and hippocampus. Notably, the coactivation pattern between the prefrontal/frontal regions and other regions, obtained in this study, provides valuable information for practical neuromodulation applications especially EEG neurofeedback, where the prefrontal activity can be measured by EEG and enhancement/modulation of other brain regions can be predicted.
In majority of mental disorders, multiple brain regions and networks show abnormality. Novel neurofeedback methods based on the connectivity of the brain regions involved in emotion regulation may lead to increased treatment effectiveness. In particular, our connectivity analysis results may be used in future neurofeedback studies, instead of the traditional activity-based neurofeedback. Modulation of the neural networks related to emotion regulation may provide new therapeutic paradigms for mental disorders such as major depressive disorder and post-traumatic stress disorder to monitor both behavior and cognition, which are modulated by neurofeedback and other interventions (Zotev et al., 2011).
Footnotes
Acknowledgment
The authors thank National Brain Mapping Lab, Tehran, Iran, for conduction of experiments and technical support.
Authors' Contributions
All authors listed have made a substantial, direct, and intellectual contribution to the study and approved it for publication.
Author Disclosure Statement
The authors have no conflicts of interests to declare.
Funding Information
There are no financial disclosures to declare.
Supplementary Material
Supplementary Data
Supplementary Figure S1
References
Supplementary Material
Please find the following supplemental material available below.
For Open Access articles published under a Creative Commons License, all supplemental material carries the same license as the article it is associated with.
For non-Open Access articles published, all supplemental material carries a non-exclusive license, and permission requests for re-use of supplemental material or any part of supplemental material shall be sent directly to the copyright owner as specified in the copyright notice associated with the article.