




Abstract
This study aims at assessing the impact of age on the short-term temporal dynamics of the topological properties of the undirected and weighted whole-brain functional connectivity (FC) networks. We studied the association between the participant's age and the number of significant change points detected through the Network Change Point Detection algorithm. Secondary, we defined state as the resting-state functional magnetic resonance imaging (rs-fMRI) subsequence between two significant change points, obtaining the FC network in each state and participant and characterized their network topological properties. The data comprise the rs-fMRI sequences of 114 healthy individuals combined from 3 different studies conducted at the Department of Medicine, School of Medicine and Health Sciences, University of Barcelona. Participants were healthy people in the absence of any pathology that could interfere with the scanning procedures, as well as any chronic illness that implied a short-lived situation. Topological properties of everyone's FC networks were characterized by their network strength, transitivity, characteristic path length, and small-worldness, analyzing the effect of age in those observed distributions. To that effect, we constructed a mixed linear model for each network topological property with age, state, and state duration as the linear predictors. Several statistically significant relationships have been estimated between the indicators of the FC networks that show a certain regular pattern of change in the networks during the time of registration at the resting fMRI paradigm. These dynamic changes seem to be related to the age of each group studied. Healthy aging could be characterized by FC dynamics patterns.
Introduction
The interest in functional connectivity (FC) in both healthy and clinical populations has witnessed a major rise in the past decades. FC reflects the strength of the synchronous temporal fluctuations of the blood oxygen level dependent (BOLD) contrast between brain regions of interest (ROIs) and can be derived from both task-related experimental conditions and resting-state functional magnetic resonance imaging (rs-fMRI) recordings.
The healthy aging process is associated with a series of structural and functional changes in the brain, such as a decrease in the gray matter volume (Fjell et al., 2014; Salat, 2011) and evidence of cognitive decline in terms of memory (Park and Reuter-Lorenz, 2009), executive function, attention, and processing speed (Damoiseaux et al., 2008; Dinomais et al., 2016). This cognitive decline is also associated to the integrity of the white matter fiber bundles (Ystad et al., 2011).
Related to FC, studies have identified a decrease in the FC in the default mode network (DMN), the auditory, frontoparietal, sensorimotor, and visual networks (Damoiseaux et al., 2008; He et al., 2013; Huang et al., 2015).
Using network analysis, it has been repeatedly established that the aging process is linked to lower within-network connectivity and higher between-network connectivity, lower segregation, modularity, small-worldness, and local efficiency (Damoiseaux, 2017; Onoda and Yamaguchi, 2013; Sala-Llonch et al., 2015; Xu et al., 2015); whereas higher average clustering and higher shortest path length were found in older participants (Sala-Llonch et al., 2014). Notably, Cao and colleagues (2014) found a linear decrease in modularity and a negative quadratic trend in both network mean connectivity strength and local efficiency across the human lifespan, from 7 to 85 years.
In their recent work on resting-state FC with the Rotterdam Study, a large prospective cohort study to investigate the determinants and effects of aging, Zonneveld and colleagues (2019) found a pronounced decrease in the FC within the anterior DMN, the ventral attention network, and the sensorimotor network after the age of 65; whereas the FC in the visual network increased with age. However, they also attested mixed increases and decreases in FC in different networks.
In a work on static FC with the same data set as the one analyzed here (Farras-Permanyer et al., 2019), we found a progressive decrease with age in the static FC. This reduction was most remarkable in individuals between 75 and 79 years. However, participants older than 80 years showed an increased FC comparable to the levels in younger individuals. This decrease was observed in both whole-brain analysis and a more specific analysis with the DMNs. Finally, we observed a decrease in the functional segregation of the DMN areas in participants with ages between 75 and 79.
Although seemingly contradictory, these changes may reflect a complex functional and structural reorganization of the healthy aging brain networks, in terms of their segregation and integration, as a compensatory mechanism to cognitive decline associated to the aging process (Ferreira and Busatto, 2013; Meunier et al., 2014).
The main drawback in the study of FC is the assumption of stability across the whole register fMRI sequence, which is to say that the coactivation between brain regions is treated as constant throughout the rs-fMRI experiment (Hutchison et al., 2013). According to this supposition, the brain activity is often averaged across the register length before the estimation of the FC matrix. Therefore, the dynamic patterns of synchronous activation are overlooked in the static FC approach. Several dynamic FC analytical methods, such as sliding-window analysis (Allen et al., 2014; Hindriks et al., 2016) and time-frequency coherence analysis (Yaesoubi et al., 2015), have been applied to the study of these short-term temporal fluctuations in brain activation.
In their work in dynamic FC in healthy adults Allen et al. (2014) found that the patterns of coactivation between some resting-state networks was highly nonstationary, often transitioning from positive to negative associations during the scanning session. These authors identified seven distinctive reoccurring short-term FC states through k-means clustering of the sliding-window correlation matrices.
Viviano and colleagues (2017) identified eight different dynamic rs-fMRI connectivity profiles through sliding-window k-means clustering. Older participants showed decreased likelihood of participating in a profile marked by its similarities with the static FC state whereas they were more likely to express a profile with low connectivity between the DMN and the ventral medial temporal lobe. However, they did not find any association between age and the rate of profile change.
However, some important considerations need to be addressed about the validity of the sliding-window FC approach. It has been noted that parameter choices, such as the window length, the impact of time-varying noise, or the band pass filtering of the signal, can greatly influence the results and lead to the rise of spurious correlations (Hutchison et al., 2013; Leonardi and Van De Ville, 2015; Shakil et al., 2016; Zalesky and Breakspear, 2015).
To solve the challenge of the parameter choices in the sliding-window FC, Cribben and Yu (2017) proposed the Network Change Point Detection (NCPD) algorithm, which combines change point detection in high dimensional multivariate time series with network community detection and allows the characterization of large-scale whole-brain networks.
This study aims at assessing the impact of age on the short-term temporal dynamics of the topological properties of the undirected and weighted whole-brain FC networks. First, we studied the association between the participant's age and the number of significant change points detected through the NCPD algorithm. Second, we defined as state the rs-fMRI subsequence between two significant change points; we obtained the FC network in each state for each participant and characterized their network topological properties. Finally, we were interested in the effects of age on the distribution of the network node strength (described by the total network strength, its median and variability), the characteristic path length, the network transitivity, and the network small-worldness coefficient. To that effect, we constructed a mixed linear model for each network topological property with age, state, and state duration as the linear predictors.
Methods
Participants
For this study, we analyzed the fMRI dataset reported in Farràs-Permanyer and colleagues (2019) under a different dynamic FC paradigm. These data comprise the rs-fMRI sequences of 114 healthy individuals combined from 3 different studies conducted at the Department of Medicine, School of Medicine and Health Sciences, University of Barcelona. Participants were excluded in case of illiteracy, prior cerebrovascular illness, psychiatric or neurodegenerative disorders, dementia, incompatibility conditions for MRI scanning session, as well as any chronic illness expected to shorten survival.
Informed consent was obtained from each participant before the first neuropsychological screening session in accordance with the Declaration of Helsinki. Each of the three different protocols was approved by the ethics committee from the Comissió de Bioètica of the Universitat de Barcelona (Approval No. PSI2012-38257) and the ethics committee from Barcelona's Hospital Clínic (Approval No. 2009-5306 and Approval No. 2011-6604).
Instruments
Neuropsychological assessment of normal cognitive functioning included the mini-mental state examination (MMSE) (Folstein et al., 1975; Tombaugh and McIntyre, 1992), the Boston Naming Test (BNT) (Kaplan et al., 2001), the National Adult Reading Test (NART) (Nelson, 1982), and the Vocabulary scale in the Wechsler Adult Intelligence Scale (WAIS) (Lezak et al., 2004). Rey Auditory Verbal Learning Test (Rey, 1964) was applied to the participants of two protocols, whereas Grober and Buschke Test (Grober and Buschke, 1987) was applied to the participants of the third protocol.
MRI acquisition and preprocessing
We applied the same MRI acquisition and preprocessing protocols reported in Farras and colleagues (2019) to guarantee the comparability of our findings. In short, scan sessions were performed through a Siemens Magnetom Trio Tim syngo 3-T system at the Unitat d'Imatgeper Ressonància Magnètica IDIBAPS (Hospital Clínic), Barcelona. High-resolution T1-weighted structural image was obtained with a magnetization-prepared rapid acquisition gradient-echo (MPRAGE) three-dimensional protocol with repetition time (TR) = 2300 ms, echo time (TE) = 2.98 ms, 240 slices, slice thickness = 1 mm, and field of view (FOV) = 256 mm.
The specific parameters for the resting-state register were: Protocol 1: n = 32 participants, TR = 2000 ms, TE = 16 ms, slice thickness = 3 mm, interslice gap = 25%, FOV = 220 mm, total: 5 min. Protocol 2: n = 59 participants, TR = 2000 ms, TE = 16 ms, slice thickness = 3 mm, interslice gap = 25%, FOV = 220 mm, total: 10 min. Protocol 3: n = 23 participants, TR = 2000 ms, TE = 19 ms, slice thickness = 3 mm, interslice gap = 25%, FOV = 220 mm, total: 5 min. Obviously, the different duration of the records forced only the primary 150 volumes of the second protocol to be selected.
Participants were instructed to lay down with eyes closed during the rs-fMRI sequence. The structural image data were analyzed by using an FSL (FMRIB Software Library v5.0) usual preprocessing pipeline adapted under authorization from the original authors (Diez et al., 2015), and the ROIs were obtained through the Automated Anatomical Labeling (AAL) atlas (Tzourio-Mazoyer et al., 2002).
Statistical analysis
Data treatment and statistical analysis of the participants' clinical characteristics and preprocessed fMRI sequences were performed with R software (version 3.5.0). Due to differences in the length of the scanning sessions across protocols, only the first 150 volumes of each subject were analyzed, as has been previously done in other works (Allen et al., 2014).
Network Change Points in FC dynamics were detected through the NCPD method (Cribben and Yu, 2017), which performs spectral clustering to extract the network community structure, and principal angles are used as the criterion for change points in the network community structure. Statistical significance of the candidate change points is tested with stationary bootstrap. The R functions for the NCPD method were provided by the authors and used under their authorization.
The proposal of Cribben and Yu (2017) is based on a nonparametric estimate of the number of communities (clusters) that can be shown in each network. Each network is defined by a matrix (Y) such that
Spectral clustering that is proposed is based on the conception that a community will be detected when, once that community is proposed, the minimum number of axes and nodes detected allows confirmation. It is operationalized by the so-called RCut that defines from Vk
(total number of edges) and its complement
For each participant, we applied the AAL to the preprocessed fMRI sequences to obtain a time series of 150 time points (TR = 2) for 90 cortical and subcortical regions. Network change points were detected for each participant through spectral clustering with 7 expected communities and a minimum distance of 30 time points between candidate change points. Statistical significance of these change points was tested through stationary bootstrap with 1000 iterations and an outlier threshold of α = 0.05.
Significant change points were used to segment each participant's rs-fMRI time series. In each segment, the network weighted adjacency matrix was estimated though the Pearson correlation between the BOLD signal of each pair of ROIs. These matrices were filtered with the Triangulated Maximally Filtered Graph (TMFG) algorithm (Massara et al., 2016) to obtain a sparse graph between each significant change point.
Topological properties of each individual's FC networks were characterized by their network strength, transitivity, characteristic path length, and small-worldness, estimated though NetworkToolbox R package (Christensen, 2019). Differences in these measures were analysed with mixed linear models, with age and state as fixed effects in the linear predictors and participant cluster as a random effect. The state is an ordinal variable that labels the network between each change point. The interaction between age and duration, as well as the interaction between age and state were tested. Models were adjusted with the scores of MMSE, BNT, NART, and the WAIS Vocabulary scale.
To account for the differences in scale of the variables, all continuous variables were standardized in all the following models for strength, characteristic path length, transitivity, and small-worldness. Therefore, all effect estimates should be interpreted in standardized scale.
Results
Regarding the distribution of participants according to the number of significant network change points during their rs-fMRI sequences (Fig. 1A), up to 51.8% (n = 59) of the study participants showed three change points, whereas no significant change points were detected in 12.3% (n = 14) of the participants. Figure 1B shows the location of the first, second, and third change points along the rs-fMRI sequence for the subjects with three changes points.
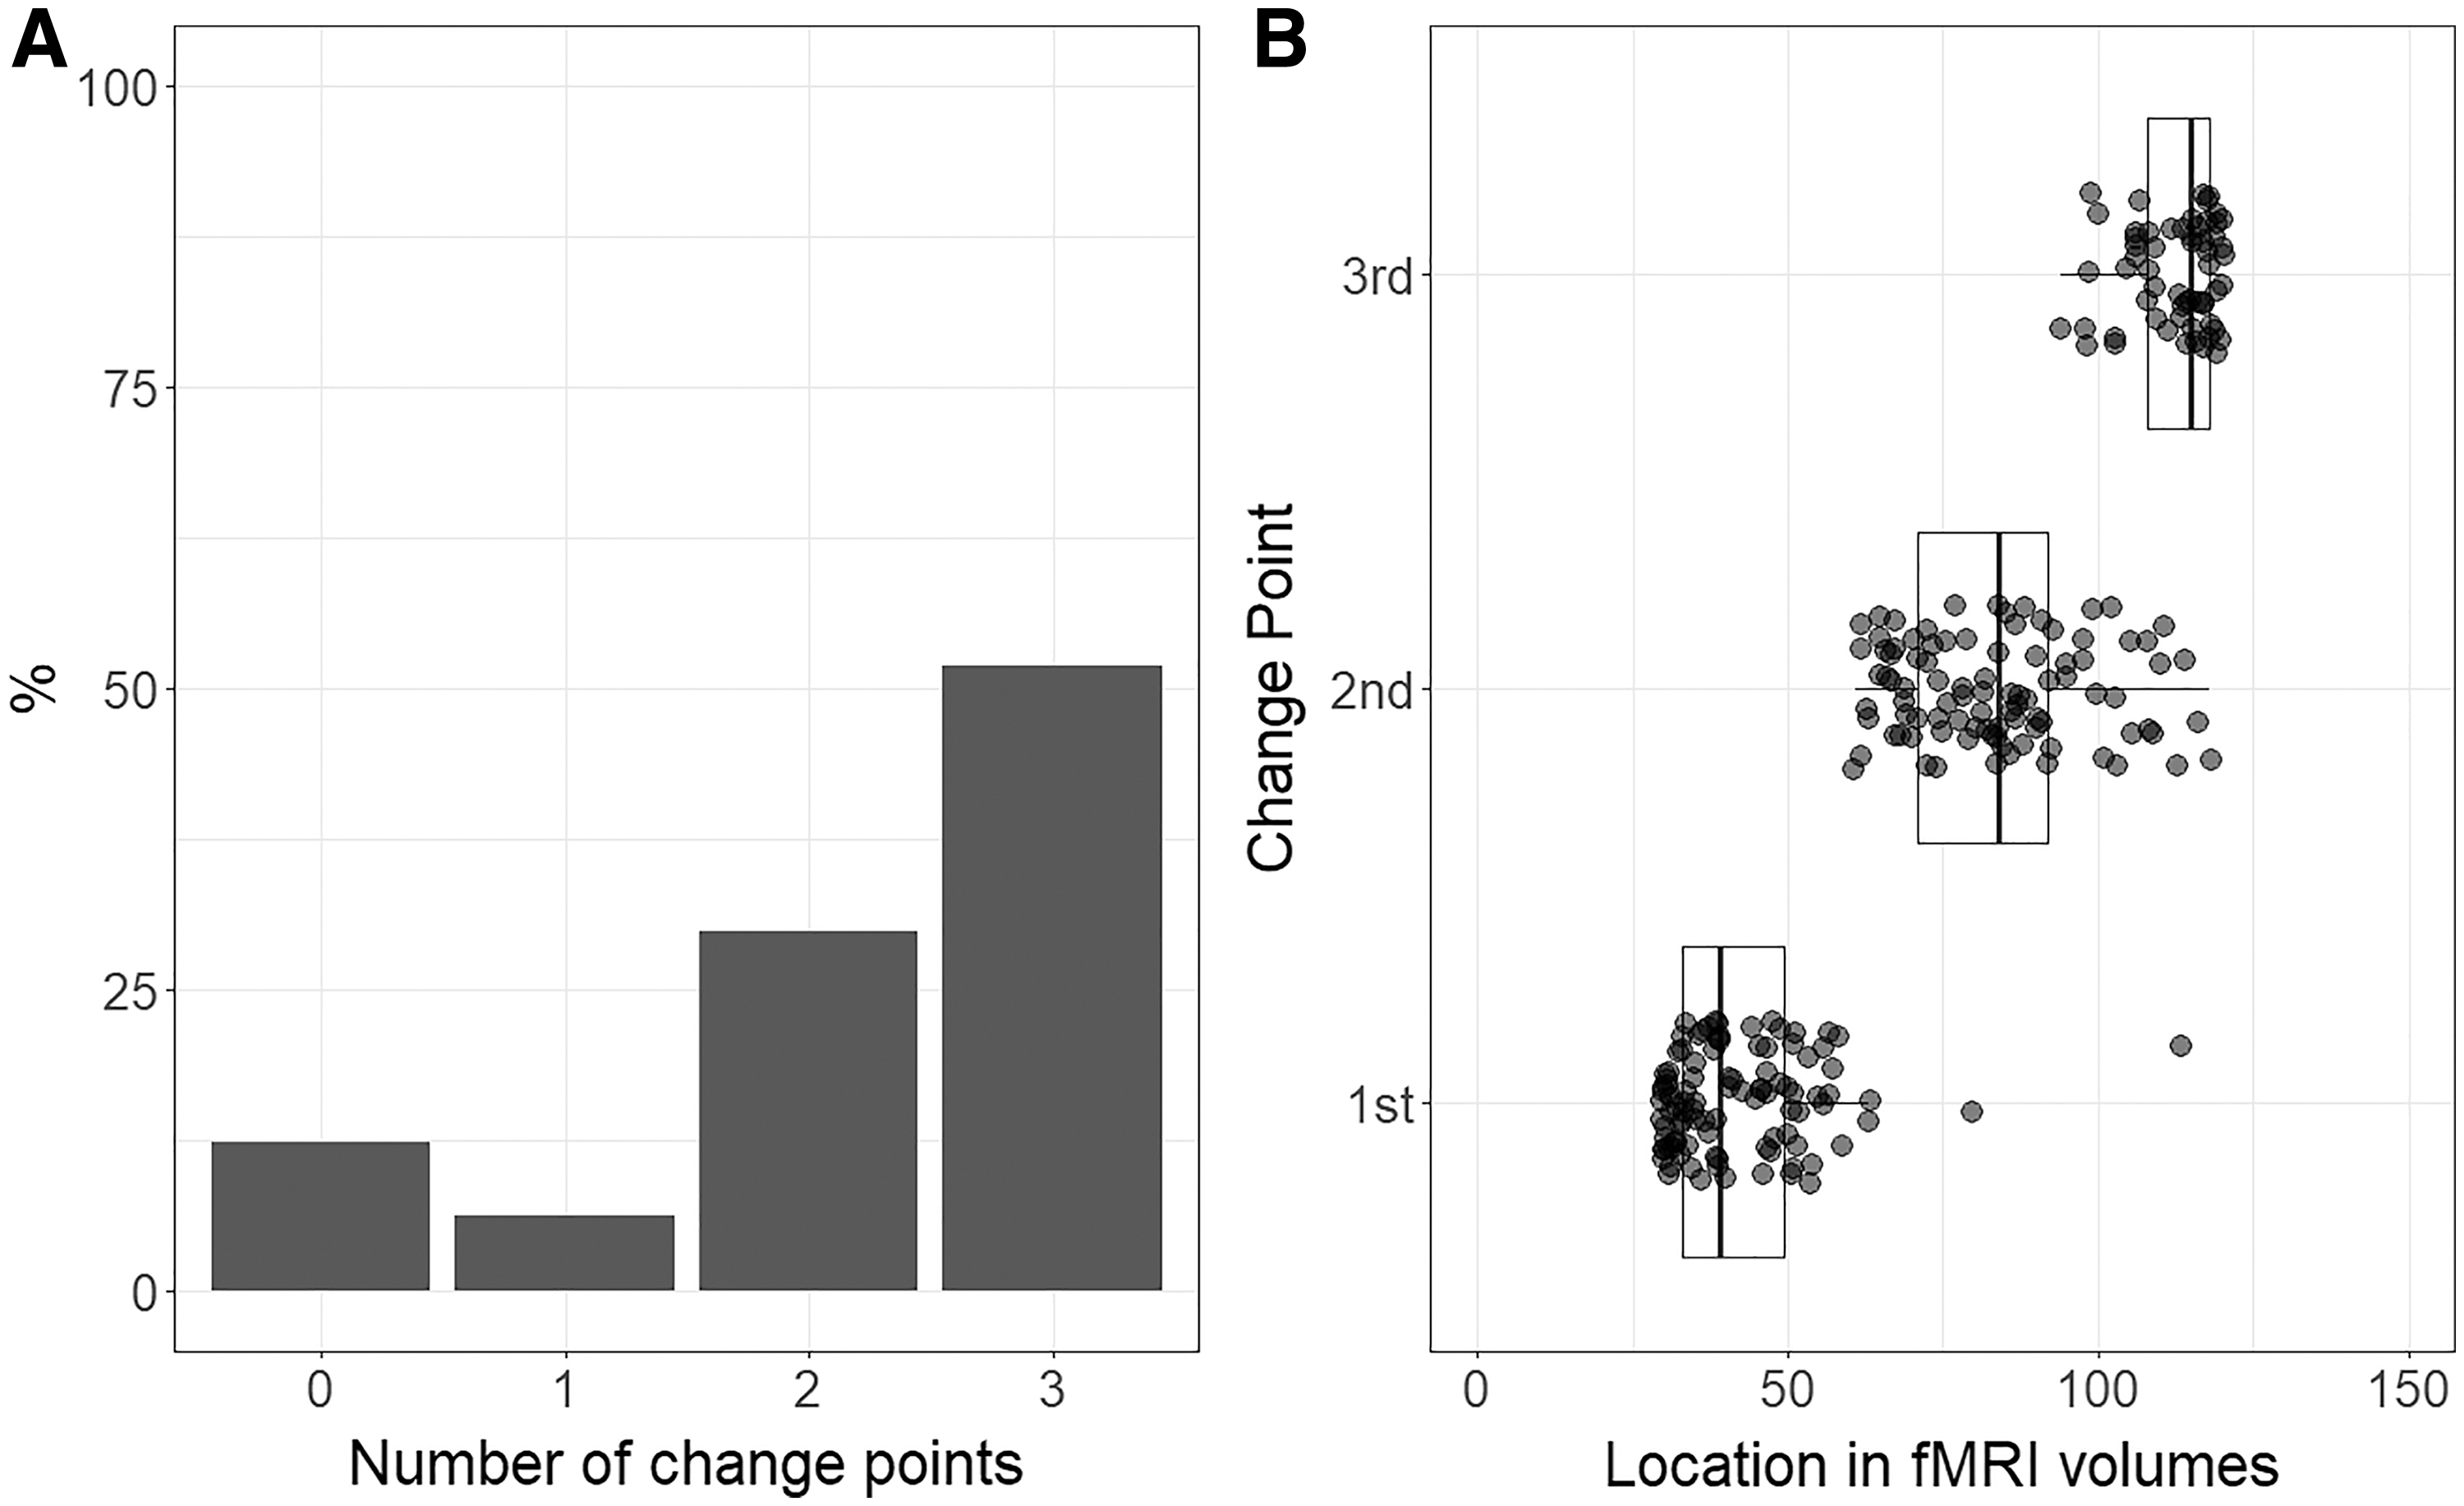
There were no significant differences in the age of the study participants in relation to the number of their significant network change points (F = 0.453,
Network strength
Network connectivity density was studied with three different approaches. First, we studied the total network strength of the network to characterize the global density of the FC networks in each time segment of each participant. Second, we computed the median node strength to identify the central tendency of each network. Finally, we analyzed the intra-patient variance of the node strength of the networks.
The best model in terms of the reduction of the AIC for the total network strength included the duration and the score in the WAIS Vocabulary scale (Table 1, Model 2). However, the marginal R 2 = 0.199 indicates a low predictive value of the fixed effects. Although there were no significant effects of age and state according to this model, an increase of one standardized unit in the duration of the state was associated to a −0.42 (95% CI: −0.52 to −0.32) decrease in the standardized total network strength. In addition to this, an increase of one standardized unit in WAIS Vocabulary was associated to an increase of 0.12 (95% CI: 0.01–0.23) in the total network strength.
Models for Total Network Strength
AIC, Akaike Information Criteria; CI, 95% confidence interval; Cond. R
2, conditional R
2; Est., estimates; ICC, intraclass correlation coefficient;
p < 0.05, *** p < 0.001.
When included in the models, BNT, NART, and MMSE, as well as the interactions between age and state, and age and duration, failed to reduce the AIC.
In relation to the median of the network strength for each state of each individual, the best model in terms of the reduction of the AIC included the effects of the duration of the state and the interaction between age and duration (Table 2, Model 3). According to this model, an increase in one standard unit of the state duration was associated to a −0.4 decrease (95% CI: −0.50 to −0.30) in the median of the network strength. In addition, the combined effect of age and duration was associated to a 0.18 (95% CI: 0.09–0.27) increase in the response variable. However, the marginal R 2 = 0.192 suggests a low predictive value of the fixed effects and an ICC = 0.18 falls below the acceptable values in mixed models.
Models for Median Network Strength
p < 0.01, *** p < 0.001.
The best model for the intra-patient variance of the node strength included the effect of MMSE (Table 3, Model 2). Although there was no significant additive effect of age and state, an increase of one standard unit in MMSE was associated to a 0.13 (95% CI: 0.02–0.25) increase in the intra-patient variability of the network strength. However, both the marginal R 2 and the ICC were low (R 2 = 0.043, ICC = 0.15).
Models for the Variance of the Network Strength
p < 0.05, *** p < 0.001.
MMSE, mini-mental state examination.
Characteristic path length
The best model for the Characteristic Path Length in terms of the reduction of the AIC includes the effect of MMSE (Table 4, Model 2). According to this model, an increase of one standard unit in age implied an increase of 0.20 (95% CI: 0.08–0.32) in the characteristic path length. Likewise, an increase in the number of states was associated to an increase of 0.12 (95% CI: 0.03–0.20) in the response variable. Finally, an increase in one standard unit in MMSE was associated to a −0.14 (95% CI: −0.25 to −0.02) decrease in the characteristic path length of the network.
Models for the Characteristic Path Length
p < 0.05, ** p < 0.01, *** p < 0.001.
Transitivity
The best model in terms of reduction of the AIC (Tables 5 and 6) included the state duration and the interaction of duration and age, as well as the effect of the WAIS Vocabulary scale (Table 6, Model 6). However, when the impact of MMSE was accounted for, both the effects of MMSE and WAIS Vocabulary became insignificant. Therefore, it is not possible to simultaneously include these two variables in the model. Consequently, even though Model 6 of Table 6 could be considered the best fit obtained, it seems much more reasonable to assume the estimates obtained in Model 5 of the same table.
Models for Transitivity (I)
p < 0.01, *** p < 0.001.
Models for Transitivity (II)
p < 0.05, ** p < 0.01, *** p < 0.001.
According to this model, there was not a net effect of age or time (state) on the network transitivity. However, an increase of one standard unit in the duration of the state was associated to a −0.43 (95% CI: −0.53 to −0.33) decrease in the standardized transitivity of the network. The combined effect of age an duration was related to a 0.13 (95% CI: 0.03–0.23) increase in the network transitivity, whereas an increase of one standard unit in the WAIS Vocabulary scale implied a 0.12 (95% CI: 0.01–0.24) decrease in the network transitivity. Overall, the Marginal R 2 of 0.22 suggests a small to moderate predicting capacity of the fixed effects of the model.
Small-worldness
The best model for the small-worldness coefficient included the effects of age, state, duration of the state, and the NART score (Table 7, Model 3). To resolve the differences in scale, all continuous variables were standardized.
Models for Small-Worldness
p < 0.05, ** p < 0.01, *** p < 0.001.
NART, National Adult Reading Test.
According to Model 3, an increase of one unit in age was associated to a 0.18 (95% CI: 0.06–0.30) increase in the small-worldness coefficient and an increase in time (state) was linked to a 0.11 (95% CI: 0.01–0.20) increase in the response. In addition, an increase in the state duration was related to a −0.4 (95% CI: −0.5 to −0.03) decrease in the small-worldness coefficient, whereas an increase in the NART score was associated to a 0.17 (95% CI: 0.05–0.28) increase in the response variable. However, the marginal R 2 of 0.182 suggests a small predicting capacity for the fixed effects of this model.
Discussion
This work aimed at studying the effect of age on the short-term temporal dynamics of the network topological properties of the whole-brain resting-state FC. We applied the NCPD algorithm to detect FC states along the rs-fMRI sequence. The FC matrices in each state were then filtered through TMFG to promote sparsity and described by their topological properties, namely the total, median, and intra-individual variability of the network strength, the characteristic path length, transitivity, and small-worldness. The effects of age, state, and neuropsychological assessment were tested by mixed linear models for each network topological property. We found no association between the age of the participants and the number of significant change points in their rs-fMRI sequences, which seems to fall in line with the lack of relationship between age and rate of profile change found in Viviano and colleagues (2017).
Regarding the distribution of node strength, no statistically significant net effects of age and state were detected for the total network strength, the median of the network strength, or the intra-patient variability of the network strength. However, longer states were associated to a decrease in the total and median network strength, which, in the case of the median network strength, could be attenuated due to an interaction effect of age and state duration. WAIS Vocabulary score was positively associated with the total network state. It is also worth further testing a positive association between the MMSE score and the variance in network strength. These results do not seem to confirm a reduction in the network strength associated to the aging process found in previous studies (Cao et al., 2014; Damoiseaux, 2017; Sala-Llonch et al., 2015; Xu et al., 2015).
Related to functional integration, characteristic path lengths increased with age and the progression of states, but it decreased with higher scores in MMSE. That increase suggests a more inefficient functional integration of the network nodes that could affect the quality of the information flow. This effect has been reported by previous works (Damoiseaux, 2017; Sala-Llonch et al., 2014) and falls in line with the disconnection hypothesis of the healthy aging brain (Ferreira and Busatto, 2013); however, given the low marginal R 2 of our model, this association should be carefully addressed in further studies.
Although the effect of state was not significant, longer states were associated to a decrease in the network functional segregation, which was attenuated through the effect of the vocabulary WAIS score and an interaction effect between age and state duration. Previous works have found an increase in functional segregation that could be explained by a progressive disconnection and more local processing (Damoiseaux, 2017; Sala-Llonch et al., 2014).
Finally, we could not replicate the loss in small-worldness associated with age found in the previous research (Onoda and Yamaguchi, 2013; Xu et al., 2015). However, we provide evidence of a positive association between the progression of state and the NART score on the small-worldness coefficient, as well as a negative effect of the duration of the state.
There are limitations in this work that should be considered. First, there is still no consensus on a standard procedure for the whole-brain parcellation and definition of the brain network components, either in anatomical parcellation or in data-driven clustering methods (Damoiseaux, 2017). Although we opted for the AAL atlas of 90 cortical ROI for its simplicity, newer and more detailed parcellation schemes (Glasser et al., 2016; Gordon et al., 2016) should be considered in further research, as they could lead to more interpretable network definitions for functional imaging analysis that would benefit the validation of the current research.
Second, our modeling strategy is adequate for testing linear associations between the response variable and the linear predictor. However, nonlinear models could better explain the relationship between age and the network topological properties, as there is evidence of nonlinear trends (Cao et al., 2014). This question remains pending to more advanced studies.
Footnotes
Authors' Contributions
Núria Mancho-Fora: Preparation of the article and data analysis and algorithms; Marc Montalà-Flaquer: Data analysis and algorithms; Laia Farràs-Permanyer: Data analysis; David Bartrés-Faz: Theoretical basis of the article; Lídia Vaqué-Alcázar: Theoretical basis of the article; Maribel Peró-Cebollero: Preparation of the article; Joan Guàrdia-Olmos: Coordination and preparation of the article and supervision.
Acknowledgments
Programa Estatal de Generación de Conocimiento y Fortalecimiento Científico y Tecnológico del S I+D+i (PGC2018-095829-B-I00). Thanks are due to I. Cribben and Y. Yu, who helped with facilitating the R library and code.
Author Disclosure Statement
In this portion of the article, the authors must disclose any commercial associations that might create a conflict of interest in connection with submitted manuscripts. This statement should include appropriate information for each author, thereby representing that competing financial interests of all authors have been appropriately disclosed according to the policy of the journal. It is important that all conflicts of interest, whether they are actual or potential, be disclosed. This information will remain confidential while the article is being reviewed and will not influence the editorial decision.
Funding Information
This work was supported by Ministerio de Cencia, Innovación y Universidades. Agencia Estatal de Investigación (PGC2018-095829-B-I00).