
Abstract
Background:
The combination of structural and functional analyses is a biologically valid approach that offers methodological advantages in autism spectrum disorder (ASD) neuroimaging science. The paucity of studies combining these methods constitutes an important knowledge gap. In this study, we investigate structural abnormalities and their associated functional differences in a developmentally homogeneous ASD cohort.
Methods:
Whole-brain voxel-based morphometry (VBM) analyses were performed on 28 ASD participants and 38 age-matched typically developing healthy controls (HC) to derive gray matter (GM) volume differences. The anatomically relevant clusters identified by VBM served as seed regions of interest (ROI) for resting-state functional-connectivity (RsFc) analysis.
Results:
Whole-brain VBM analyses revealed significant right lateralized GM volume abnormality in the ASD group, with lower GM volumes in cerebellar lobules VIIb/VIIIa (cluster 1) and significantly higher GM volumes in posterior middle/superior temporal gyri (Brodmann area [BA] 21/22, cluster 2) compared with HC. Whole-brain RsFc analysis in high-functioning ASD (HF-ASD) revealed significant hypoconnectivity of the cerebellar VBM cluster with the right cerebral cortical regions of superior parietal lobule (BA 7) and occipital pole (BA 19) (overlapping with dorsal attention and visual networks, respectively). Cerebral cortical VBM cluster (cluster 2) revealed significant hypoconnectivity in HF-ASD with other task-positive cerebral cortical including the left lateral prefrontal cortex (frontoparietal network) and some aspects of the insula (ventral attention network) and ectopic positive connectivity (lack of anticorrelations) with posterior cingulate cortex and medial prefrontal cortex (default mode network).
Conclusions:
The cerebro-cerebellar intrinsic functional dysconnectivity based on the whole-brain VBM-derived ROIs may advance our understanding of the compensatory mechanisms associated with ASD and offer cerebellum as a potential target for diagnostic, predictive, prognostic, and therapeutic interventions in ASD. Our findings also provide additional support indicating that functional abnormalities as indexed by RsFc exist in ASD, and highlight that there is likely a relationship between structural and functional abnormalities in this disorder.
Impact statement
Our findings indicate that functional differences as indexed by resting-state functional connectivity exist in autism spectrum disorder (ASD), and highlight that there is likely a relationship between structural and functional abnormalities in this disorder. Future developments in neuroimaging research should continue investigating structural and associated functional differences in ASD, and in this way complement the behavioral characterization of this disorder, potentially improving diagnosis, prognosis, and prediction.
Introduction
Autism spectrum disorder (ASD) is a neurodevelopmental disorder characterized by varying degrees of deficits in social–emotional functioning along with restricted and repetitive behaviors (American Psychological Association, 2013). It is estimated to affect up to 2% of the general population (Blumberg et al., 2013). ASD in absence of intellectual disability, referred to as high-functioning ASD (HF-ASD), is observed in ∼45% of individuals diagnosed with ASD (Charman et al., 2011). Although a large number of ASD studies have identified structural and functional brain differences (Anagnostou and Taylor, 2011; Ecker, 2017), ASD remains a clinically defined disorder with no biological markers that can inform diagnosis or guide treatment. Neuroimaging promises to contribute to the biological characterization of ASD, complementing the behavioral characterization of this disorder, and has the potential to identify neural biomarkers for early diagnosis, prognosis, and treatment.
Crucially, while the majority of neuroimaging studies on ASD have independently examined either structural or functional differences, very few studies have examined whether structural abnormalities are associated with abnormal patterns of functional connectivity. Neuroimaging studies in autism have identified gray matter (GM) volume differences in frontal, temporal, and cerebellar regions (D'Mello et al., 2015; Mechelli et al., 2005; Riva et al., 2013; Rojas et al., 2006). Some studies have explored structural abnormalities based functional connectivity disruptions in ASD (Mueller et al., 2013; Olivito et al., 2018; Wang et al., 2017), but these studies are limited by methodological challenges that include small sample sizes (n < 15), lenient statistical thresholds, large within-group age variability (including both preschool and school age children), and limited phenotypic characterization.
In light of the “network degeneration hypothesis” (Drzezga, 2018), it is reasonable to expect structural variation in ASD to be associated with atypical functional activity; identifying robust structural differences in ASD might thus be a promising approach to guide functional investigations in ASD. Our aim was to use a methodological approach that resonates with this biologically plausible assumption. We hypothesize that structural differences in ASD will be associated with aberrant functional connectivity. To this end, we first examined GM volume differences in adults with HF-ASD compared with age-matched typically developing healthy adults to identify regions that showed differences in structure, and then used these brain regions as regions of interest (ROI) for examining seed-to-voxel whole-brain resting-state functional-connectivity (RsFc) patterns.
Materials and Methods
Study participants
Twenty-eight adults (24 males; age range = 18–34 years; mean age = 24.7 ± 5.24) with HF-ASD participated in this study. All subjects were recruited from the Alan and Lorraine Bressler Clinical and Research Program for Autism Spectrum Disorder. Patients were diagnosed using the ASD DSM-IV Diagnostic Symptom Checklist. All individuals with ASD had to have an intelligence quotient (IQ) >70 as measured by the Wechsler Abbreviated Scale of Intelligence. IQ was assessed on four subtests: Vocabulary, Similarities, Block Design, and Matrix Reasoning. Contraindications to MRI such as presence of metal in the body, neuropsychiatric conditions such as dementia that impair cognition, and other neurological disorders associated with gross brain pathology served as exclusion criteria. Thirty-eight age-matched typically developing healthy adults (25 males; age range = 18–32 years; mean age = 24.3 ± 3.5) without any neurological disorder or physical illness served as controls. Written informed consent was collected from all participants in accordance with guidelines established by the Partners Health Care Institutional Review Board and the Harvard University Committee on the Use of Human Subjects in Research.
Assessment procedures
All ASD individuals completed the Social Responsiveness Scale–Adult Research Version (SRS-Adult) or Social Responsiveness Scale–Parent Report (SRS), as well as the autism diagnostic observation schedule (ADOS). The SRS is a 65-item rating scale that is completed by a parent/guardian, spouse, sibling, or another adult who knows the participant well and who interacts with the participant on a regular basis. It measures the severity of autism symptoms as they occur in natural social settings. The ADOS is an instrument that allows diagnosis and assessment of autism across age, developmental level, and language skills. The assessment includes a series of semistructured tasks that involve social interaction between the examiner and subject. The ADOS was administered by a certified rater.
Neuroimaging procedures
Imaging data were collected on the 3T Siemens Tim Trio system (Siemens Healthcare, Erlangen, Germany) with its commercially available 12 channel head coil. High-resolution (1.2 mm voxels) structural data were acquired using a multiecho T1-weighted Magnetization Prepared-RApid Gradient Echo (MPRAGE) sequence with a duration of 2 min 12 sec. Scan parameters for TR/[TE]/TI/Flip Angle were 2.2 sec/[1.5, 3.4, 5.2, 7]/1.1 sec/7°. The short duration of our structural scans is particularly beneficial for morphometry analyses, as it reduces motion-related image quality degradations. Two resting scans (3 mm voxels) were acquired using a T2*-weighted echo planar imaging (EPI) sequence, each with a duration of 6 min 12 sec. Scan parameters for TR/TE/Flip Angle were 3 sec/30 msec/85°. Forty-seven interleaved (ascending/foot-head) slices (whole-brain coverage including the entire cerebellum) were collected in AC-PC plane using an auto-align procedure to minimize intersubject variability in data acquisition. Subjects were asked to keep still while staying awake with their eyes open. A fixation cross hair was not used.
Data analysis
Voxel-based morphometry analysis
The Computational Anatomy Toolbox (CAT12
Resting-state functional connectivity analysis
RsFc data preprocessing
Before RsFc analysis, EPI data were realigned and unwarped, slice-time corrected, normalized to MNI template, and spatially smoothed with a 6-mm FWHM Gaussian kernel using SPM12 (Wellcome Department of Imaging Neuroscience, London, UK;
RsFc data analysis
CONN Toolbox (Whitfield-Gabrieli and Nieto-Castanon, 2012) was used for seed-to-voxel whole-brain RsFc analysis of VBM-derived ROIs. Band pass filtering was executed at 0.008–0.09 Hz. Artifact Detection Toolbox (
Statistical analysis
Pearson's correlation coefficients were computed between the denoised time course from the cluster of interest and the time course of all other voxels in the brain, and were then converted to normally distributed z-scores using the Fisher transformation to allow second-level general linear model analyses. There was a significant difference (p < 0.001) in the number of motion outliers in the ASD group (20.61 ± 9.98) compared with that of controls (13.11 ± 5.52). Mean motion, although not significantly different between the two groups (p = 0.07), was also higher in the ASD group compared with controls. These two covariates were included as nuisance regressors while evaluating between-group effects. Consistent with the statistical thresholds recommended by Eklund et al. (2016), only the regions that showed significant between-group differences at a height threshold of p < 0.001 (two-tailed) and FDR-corrected cluster threshold of p < 0.05 were reported. To interpret the functional significance of the topographical distribution of our clusters, results were overlapped with resting-state functional connectivity parcellations of cerebellum (Buckner et al., 2011) and cerebral cortex (Yeo et al., 2011), as well as functional gradients of cerebral cortex (Margulies et al., 2016).
Results
Among the 28 ASD participants, 24 had a comorbid psychiatric disorder. Subject demographics and psychiatric comorbidity with ASD are summarized in Table 1. Seven of the ASD participants were medication naive and 11 participants were receiving combination pharmacotherapy for the management of associated psychopathologies (Table 2).
Demographics and Psychiatric Comorbidity with Autism Spectrum Disorder
Values expressed as n (%) or mean ± standard deviation.
ADOS, autism diagnostic observation schedule; ASD, autism spectrum disorder; HC, healthy controls; IQ, intelligence quotient; N/A, not applicable; SRS, Social Responsiveness Scale.
Psychotropic Medication Treatment
Values expressed as n (%).
SNRI, serotonin and norepinephrine reuptake inhibitors; SSRI, selective serotonin reuptake inhibitors; TCA, tricyclic antidepressants.
VBM analysis
Whole-brain VBM analysis revealed two clusters of differing GM volume in individuals with ASD compared with controls (Fig. 1). Cluster 1 was located in the right cerebellum lobules VIIB and VIIIA (Fig. 1A), where GM volume was lower in ASD compared with controls. Cluster 2 included right medial temporal gyrus (MTG) extending to superior temporal gyrus (STG) (Fig. 1B), where GM volume was higher in ASD compared with the HC group. These clusters were used as seeds in subsequent RsFc analyses (Table 3).
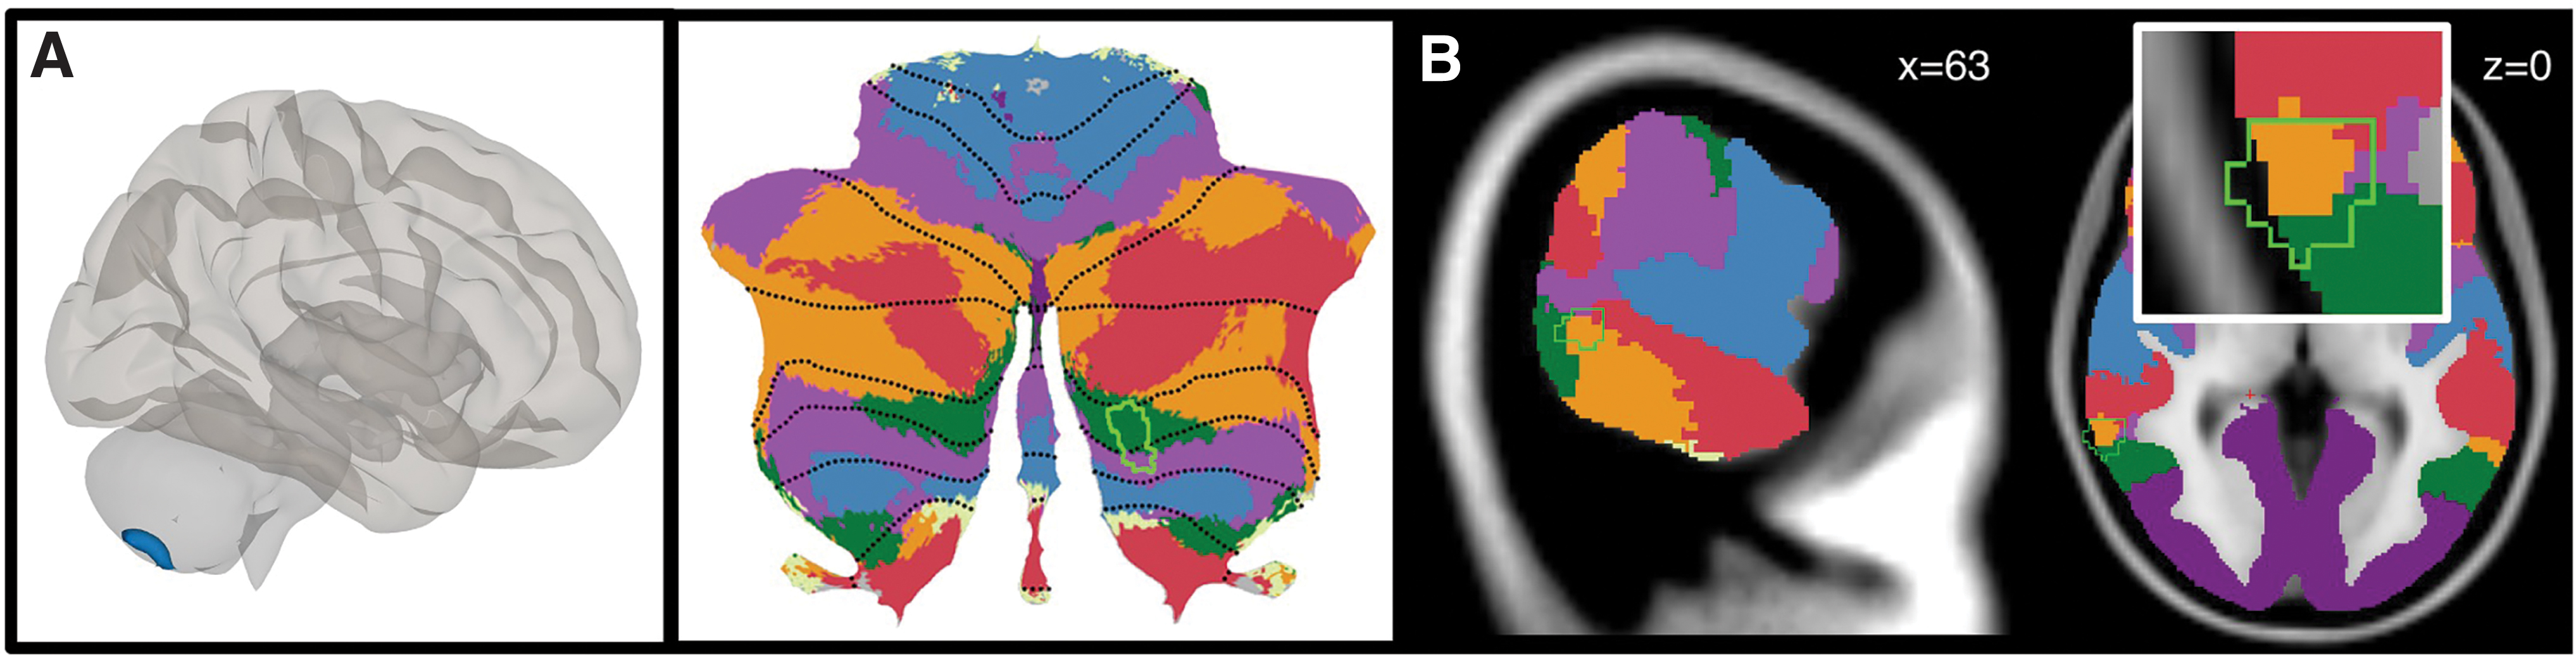
Whole-brain VBM results.
Results from Whole-Brain VBM Analysis and Second-Level Seed-to-Voxel RsFc Analysis of VBM-Derived Cerebellar Clusters for HC Versus ASD Contrast
A height threshold of whole-brain p < 0.001 (two-tailed) and FDR-corrected cluster threshold of p < 0.05 were used.
BA, Brodmann area; MTG, medial temporal gyrus; RsFc, resting-state functional-connectivity; STG, superior temporal gyrus; VBM, voxel-based morphometry.
RsFc analysis of VBM-derived clusters
For both the ASD and HC groups, seed-to-voxel functional connectivity analyses of the cerebellar VBM cluster (cluster 1) showed whole-brain positive correlations for the task-positive networks, including dorsal and ventral attention networks (VANs), frontoparietal networks (FPNs), and visual networks. There was significantly decreased connectivity in ASD compared with HC from VBM cluster 1 to right cerebral cortical medial superior parietal lobule (Brodmann area [BA] 7) and medial occipital pole (primary and secondary visual cortices, BA 17/18) (Fig. 2 and Table 3). Cerebral cortical VBM cluster (cluster 2) did not reveal any significant between-group differences in RsFc at a height threshold of p < 0.001. However additional exploratory analysis at a slightly relaxed height threshold (p < 0.005) revealed significant hypoconnectivity in HF-ASD with other task-positive cerebral cortical including the left lateral prefrontal cortex (FPN) and some aspects of the insula (VAN) and ectopic positive connectivity (lack of anticorrelations) with posterior cingulate cortex and medial prefrontal cortex (default mode network, DMN).
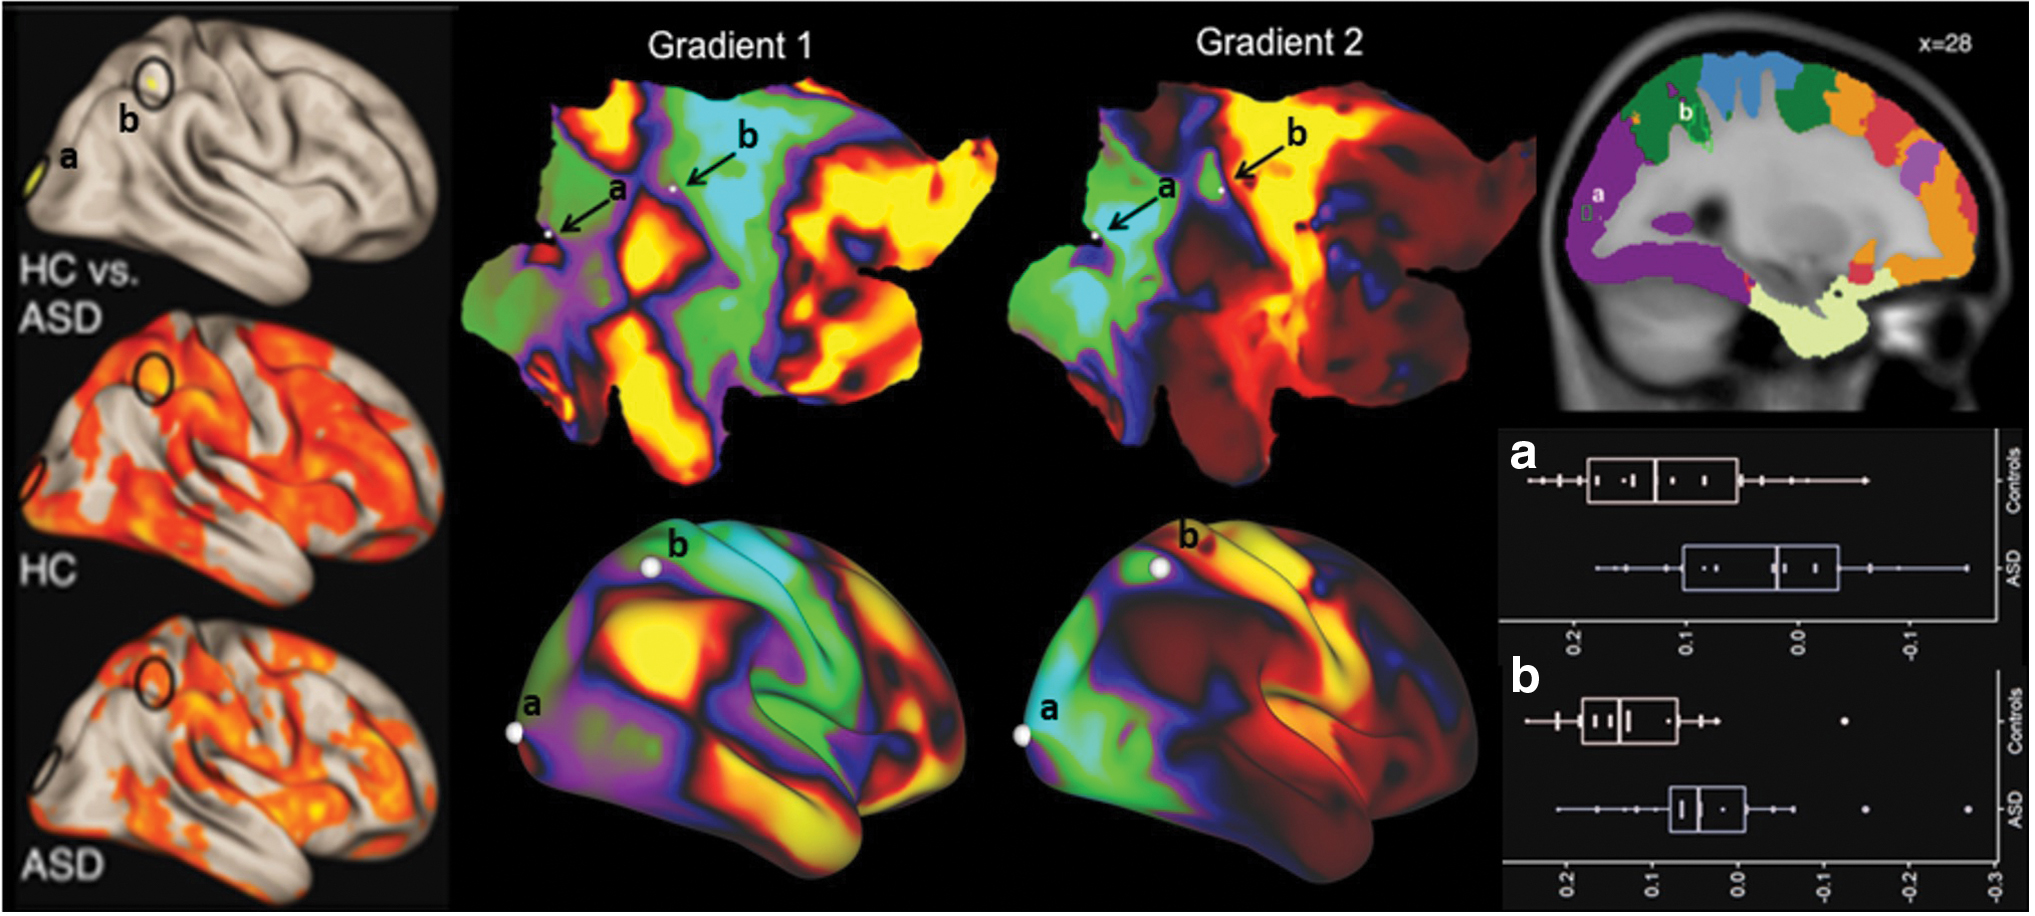
Second-level seed-to-voxel RsFc analysis for VBM-derived cluster 1 (two-sided comparison) resulted in clusters a (BA 18), and b (BA 7). A height threshold of p < 0.001 and FDR-corrected cluster threshold of p < 0.05 were used. Column 1 (marked as HC vs. ASD) shows clusters a (bottom) and b (top) in a surface representation of the cerebral cortex; main effects of functional connectivity from VBM cluster 1 in HC and ASD shown below (marked as HC and ASD, respectively) are from one-sample t-tests, p < 0.001 with FDR correction. Middle panel shows clusters a and b (solid white dots, black arrows) overlaid on functional gradients of the cerebral cortex (right cerebral cortical hemisphere shown as a flat map), including “gradient 1” that progresses from primary motor, auditory, and visual areas (green) to default-mode territories (red) and “gradient 2” that progresses from motor/auditory (red) to visual (green) territories, as described previously in Margulies et al. (2016). Surface representations of the functional gradients are shown below. Both clusters a and b were located at a similar position in cerebral cortical functional gradients 1 and 2, that is, both clusters are at locations displaying similar a position within the color scale of each functional gradient. Background colors in the right-most panel correspond to a cerebellar resting-state parcellation atlas developed by Yeo et al. (2011) (dark purple, visual; blue, somatomotor; green, dorsal attention; violet, ventral attention; cream, limbic; orange, frontoparietal; red, default network). Labels correspond to Table 3, and the boxplots below. BA, Brodmann area; FDR, false discovery rate; RsFc, resting-state functional connectivity. Color images are available online.
Discussion
This is the first study to investigate structural differences and their associated functional disruptions using strict statistical thresholds in adults with ASD. Our analyses revealed regional decreases in cerebellar GM volume and regional increases in cortical GM volume. In regions showing reduced cerebellar GM, ASD subjects revealed reduced functional connectivity to multiple cerebral cortical regions. Taken together, these findings confirm, expand, and integrate with previous neuroimaging observations in ASD, and contribute to the biological characterization of this disorder by using a data-driven, noncircular, biologically plausible, and largely unexplored methodology.
Cerebellar GM volume in ASD
Unbiased whole-brain VBM analysis revealed reduced cerebellar GM in the right posterior lobe (specifically, lobules VIIB and VIIIA) in the ASD group. The cerebellum is one of the most consistent regions of abnormality reported in ASD (see D'Mello and Stoodley, 2015 for review). A large body of neuroimaging studies has established that the cerebellum plays a significant role in cognitive, affective, and motor processing (; Baillieux et al., 2008; Guell et al., 2015, 2017, 2018; Hoche et al., 2016, 2018; Keren-Happuch et al., 2014; Koziol et al., 2014; Levisohn et al., 2000; Middleton and Strick, 1994; Ravizza et al., 2006; Riva, 2000; Schmahmann, 1996; Schmahmann and Pandya, 1991, 1997a,b; Schmahmann and Sherman, 1998; Schmahmann et al., 2007, 2019; Stoodley and Schmahmann 2009; Stoodley et al., 2012; Tedesco et al., 2011; Thompson and Steinmetz, 2009). Functionally, lobules VIIB and VIIIA of the cerebellum are predominantly involved in nonmotor processing (Guell et al., 2018; Keren-Happuch et al., 2014; Stoodley and Schmahmann, 2009, 2010; Stoodley et al., 2012, 2016). The specific regions of lobules VIIB and VIIIA that were identified by our VBM analysis overlap with cerebellar representations of ventral and dorsal attention networks (Buckner et al., 2011; Fig. 1A), as well as with task activity and functional connectivity maps related to a variety of cognitive processes including emotion processing and social processing (see Fig. IV in Guell et al., 2018). Consistent with the current findings, cerebellar structural ASD abnormalities are most often reported in the right hemisphere of the cerebellum and tend to be located in the posterior lobe (D'Mello et al., 2016, 2015). Differences in posterior lobe cerebellar GM may result from reduced Purkinje cell count in these regions (Skefos et al., 2014). Reduced GM in the right posterior cerebellum in ASD has also been shown to correlate with symptom severity in ASD (D'Mello et al., 2016, 2015; Riva et al., 2013; Rojas et al., 2006). Beyond ASD, cerebellar structural and functional abnormalities have been identified in multiple neurological, neurodevelopmental, and psychiatric disorders that affect cognitive and affective functions including schizophrenia, dyslexia, and attention-deficit/hyperactivity disorder (ADHD) (Bastos Leite et al., 2006; Guo et al., 2016; Kim et al., 2015; Phillips et al., 2015; Wang et al., 2016; Wilkins, 2017; Wolf et al., 2015; Wu and Hallett, 2013). However, the cerebellar findings associated with various disorders are characterized by distinct structural patterns of cerebellar abnormality (Stoodley, 2014). The location of cerebellar abnormality is often associated with networks implicated in each disorder (e.g., reduced GM in ASD is found in the DMN vs. reduced GM in ADHD is found in attention networks of cerebellum) (Stoodley, 2014). A large and expanding body of evidence indicates that the cerebellum is involved in prediction (Sokolov et al., 2017), and recent work suggests that individuals with ASDs have prediction deficits (Sinha et al., 2014). More recent work in cerebellar patients has shown that functional abnormalities in VBM-derived cerebellar regions of reduced GM may explain prediction deficits related to social functioning (Clausi et al., 2018). The region of reduced GM volume reported in this study in right lobule VIIB/VIIIA is implicated in linguistic prediction in typically developing individuals (D'Mello et al., 2017). The structural cerebellar deficits (and ensuing alterations in cerebro-cerebellar functional connectivity, as discussed below) observed in this study could thus be related to deficits in linguistic prediction in individuals with ASD (D'Mello and Stoodley, 2015).
Cortical GM volume in ASD
Compared with HC, individuals with ASD showed increased GM volume in the right posterior MTG/STG (BA 21). These clusters overlap with FPN (as well as partly with ventral, dorsal attention and DMNs) (Yeo et al., 2011). FPN correlates positively with other task-positive networks, and negatively with DMN (Fox et al., 2005). Previous studies of ASD have reported both structural and functional abnormalities in the superior and middle temporal gyri (e.g., Herringshaw et al., 2016; Just et al., 2004; Wang et al., 2017). In typically developing controls, these regions are implicated in social and linguistic processing. Notably, contrary to HC, individuals with ASD show more right lateralized language activation in these regions (Herringshaw et al., 2016). Multiple meta-analyses of structural neuroimaging findings in ASD report increased GM including in the MTG region (Cauda et al., 2011; Via et al., 2011). In addition, previous studies find reversed left/right volume asymmetry of the STG in autism, that is, larger right STG in ASD compared with HC (Herbert et al., 2002), in agreement with our findings.
Whole-brain RsFc of the VBM cerebellar cluster (lobules VIIB and VIIIA)
Seeding from region of decreased GM (lobule VIIB and VIIIA) revealed reduced Fc with right lateralized cerebral cortical regions that correspond to the dorsal attention network (medial BA 7) and visual network (medial BA 17/18) (Fig. 2). Accordingly, the VBM-identified cerebellar cluster overlaps with cerebellar representations of “task-positive” ventral and dorsal attention networks (Buckner et al., 2011). These findings suggest cerebro-cerebellar hypoconnectivity between task-positive cognitive processing regions (task-positive cerebellar regions and corresponding task-positive regions of the cerebral cortex). These results are consistent with literature suggesting functional hypoconnectivity in dorsal and VANs in adults with ASD (Farrant and Uddin, 2016). In addition, we find cerebellar hypoconnectivity with primary and secondary occipital cortices. A previous meta-analysis (Nickl-Jockschat et al., 2015) revealed that a distributed network of brain regions, including bilateral occipital regions and cerebellum, is hypoconnected with the left fusiform gyrus in the ASD group. This finding was attributed to face processing difficulties, one of the most consistent findings in ASD. A recent study using the 7T retinotopy data set has identified visual field maps in the cerebellum within nodes corresponding to the dorsal attention and visual networks. While occipital cortical areas distant from V1 are classified as visual network in some studies (Yeo et al., 2011), they might also possess a significant degree of task-positive network properties when considering gradual transitions from primary unimodal, to task-positive transmodal, to task-negative transmodal association cortical areas (Margulies et al., 2016). Indeed, upon closer examination using gradient-based maps of cerebral cortical function (Margulies et al., 2016), it was evident that these clusters (BA 7 and BA 18) fell within functionally similar regions (Fig. 2, note that clusters a and b are located at a similar position along cerebral cortical functional gradients 1 and 2). This concordance between cerebellar and cerebral cortical functional territories in our analyses supports the possibility that functional connectivity differences from our cerebellar seed may be causally related to cerebellar structural alterations—however, this hypothesis cannot be tested here given the correlational nature of our structural and functional analyses.
Whole-brain RsFc of the VBM cerebral cortical cluster (MTG/STG)
Using the strict statistical thresholds that we used in this study, the cerebral cortical VBM cluster did not reveal any significant between-group differences in RsFc. However, if we relax the height threshold of whole-brain RsFc analysis to p < 0.005 from p < 0.001 (with false discovery rate-corrected cluster threshold of p < 0.05), increased functional connectivity in ASD was seen with task-negative regions, and decreased functional connectivity with task-positive regions (Fig. 3). First, compared with typically developing HC, individuals with ASD had reduced connectivity between the MTG and other task-positive cerebral cortical, including the left lateral prefrontal cortex (FPN) and some aspects of the insula (VAN/salience network). While HC exhibited positive correlations with these two regions and the cerebral cortical VBM cluster, ASD subjects revealed a loss of this positive functional connectivity. Left lateral prefrontal cortex and insula have been implicated in the pathology of ASD in previous investigations (Francis et al., 2019; Lin et al., 2019). Second, individuals with ASD exhibit the ectopic positive correlation of MTG/STG with major nodes of the DMN. While HC lacked correlation between MTG/STG and the DMN regions of posterior cingulate cortex (PCC) and medial prefrontal cortex (mPFC), which is consistent with the literature (Fox et al., 2005), individuals with ASD revealed a significant positive correlation between the MTG and the PCC and mPFC.
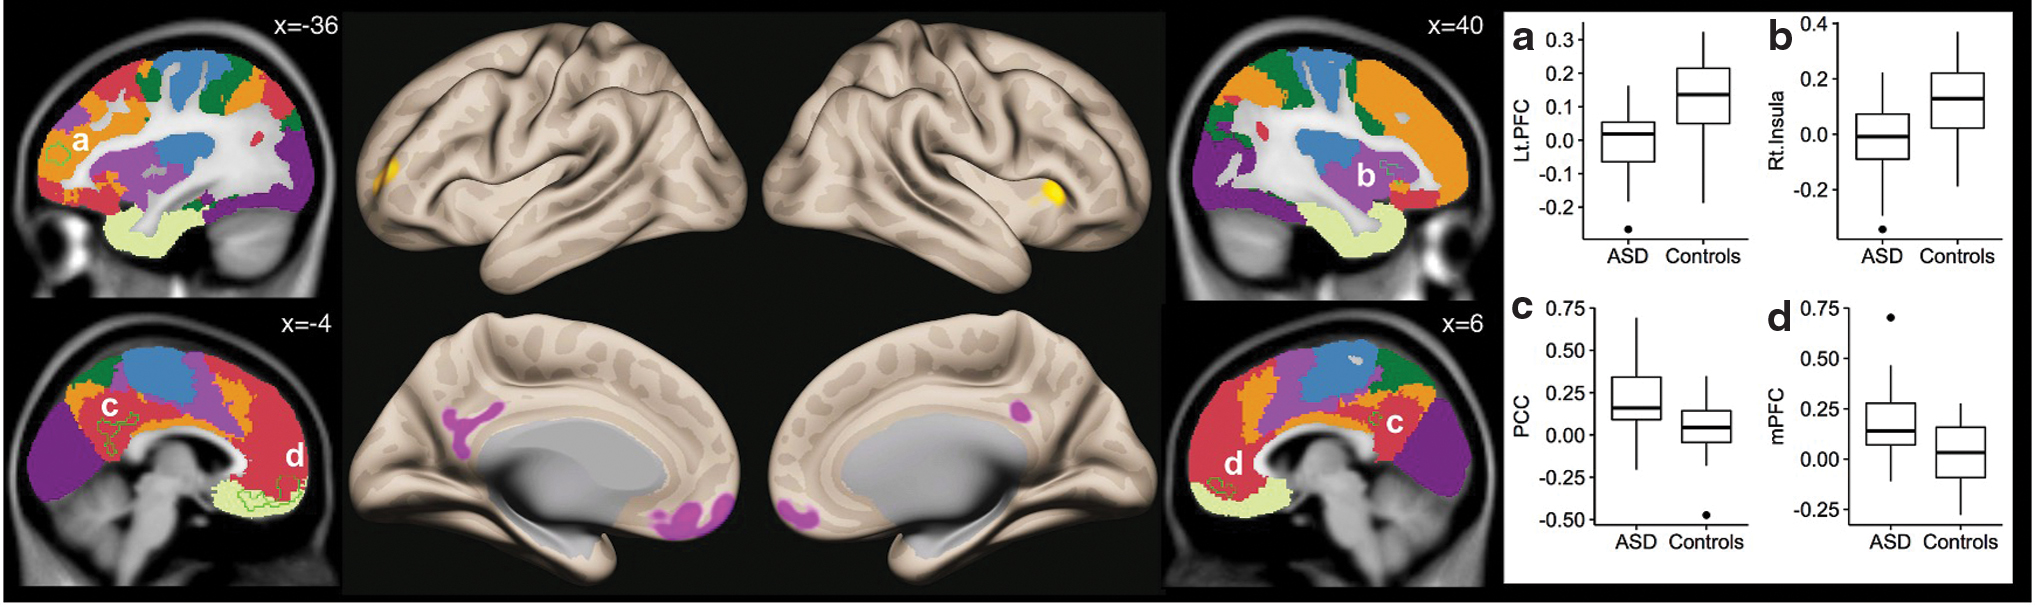
Results from second-level seed-to-voxel RsFc analysis for VBM-derived cluster 2 (two-sided comparison). A height threshold of whole-brain p < 0.005 and FDR-corrected cluster threshold of p < 0.05 were used for between-group comparison. Background colors correspond to a cerebellar resting-state parcellation atlas developed by Yeo et al. (2011) (dark purple, visual; blue, somatomotor; green, dorsal attention; violet, ventral attention; cream, limbic; orange, frontoparietal; red, default network). Color images are available online.
Limitations
Understanding and interpreting brain results in ASD are complex and challenging. Direction of GM abnormality may be affected by confounding factors such as age (e.g., Duerden et al., 2012), gender, intellectual ability, and language skills (e.g., D'Mello et al., 2016). Previous research suggests that these factors may play unique roles in the pathophysiology of ASD and further contribute to the heterogeneity of RsFc findings in ASD populations. Heterogeneity of the ASD group is another limitation as about 40% of the ASD participants were also comorbid with ADHD and another 40% comorbid with major depressive disorder. Hypoconnectivity in regions of the dorsal attention and the DMNs have been shown in ADHD (Tomasi and Volkow, 2012). Likewise, decreased connectivity of prefrontal-posterior brain regions has been shown to be associated with the behavioral traits of absorption and propensity to ruminate in individuals with depression (Reiser et al., 2012). This limitation notwithstanding, our results support evidence in favor of the network degeneration hypothesis in ASD (Drzezga, 2018).
Conclusion
The combination of structural and functional analyses is a biologically valid approach that offers methodological advantages in ASD neuroimaging science. The paucity of studies combining these methods constitutes an important knowledge gap. This is the first study to investigate structural abnormalities and their associated functional differences using strict statistical thresholds in a developmentally homogeneous ASD cohort. Structural abnormalities were diverse in location (cortical and subcortical) and direction (volumetric increase and decrease). Functional abnormalities were detected from cerebellar regions of abnormal structure, highlighting the potential role of cerebellum in ASD, while cerebral cortical regions of abnormal structure did not reveal a significant functional difference. Taken together, our findings provide additional support indicating that structural abnormalities exist in ASD, and that the cerebellum is one fundamental component of this pathological structural phenotype. Our findings also provide additional support indicating that functional abnormalities as indexed by RsFc exist in ASD, and highlight that there is likely a relationship between structural and functional abnormalities in this disorder. Future developments in neuroimaging research should continue investigating structural and associated functional differences in ASD, and in this way complement the behavioral characterization of this disorder, potentially improving diagnosis, prognosis, and prediction.
Footnotes
Author Disclosure Statement
No competing financial interests exist.
Funding Information
This work is funded, in part, by the Athinoula A. Martinos Imaging Center, MIT, and the Alan and Lorraine Bressler Clinical and Research Program for Autism Spectrum Disorder Council Fund.