
Abstract
Background:
The nodal brain network measures (e.g., centrality measures) are defined for a single node and the global network measures (e.g., global efficiency) are defined for the whole brain in the literature. But a meaningful group of nodes will be benefited from a formulation that applies to a group of nodes rather than a single node or the whole brain. The question such as “which brain lobe is more structurally central in the older-adult brain?” could be answered to some extent by the application of a centrality measure that applied to the group of nodes from each lobe. In the brain asymmetric studies, path-based global measures were applied to the left and right hemispherical networks separately, considering only intrahemispheric edges. However, for a valid comparison, such global measures should include the interhemispheric edges as well. This problem can be solved by considering both hemispherical nodes as two groups in one network.
Methods:
Novel definitions for group nodes network measures are presented in this study, to solve a number of such group-context problems in the brain networks analysis. We apply the group measures to the structural connectomes of older adults and Alzheimer's disease (AD) subjects based on the brain lobes and hemispherical groups to demonstrate the effectiveness of the proposed measures.
Results:
The temporal and parietal lobes are the most central lobes in older adults and AD, but the strength of these lobes has been heavily affected in AD. However, the rewiring of the AD brain preserves the paths for communication between other regions through these lobes. Leftward efficiency revealed in older adults and the asymmetry disappeared in the rewired AD.
Conclusion:
We prove that the concepts of group network measures have the potential to solve a number of such group-context problems in the brain networks analysis and the group network measures change the way of analyzing brain networks.
Impact Statement
The novel definitions and descriptions of network measures are proposed for a group of nodes in brain networks. Two fundamental problems in the network analysis are described and we showed how the group network measures can solve those problems. The group measures were applied to structural brain networks of older-adults and Alzheimer's disease subjects based on the Lobes' group-level and hemispheric group-level studies. The results proved the effectiveness of the proposed measures.
Introduction
T
Node definition is the fundamental step of creating brain networks and the connectome studies have used a variety of gray-matter parcellations, either random or anatomical parcellation criteria, to define a node (Zalesky et al., 2010). The size of the divisional area varies from a voxel size to a hemisphere size at macroscales. Voxel-wise brain networks define a node as a voxel (equally sized brain area) and atlas-based networks define a node as an atlas-based region (Stanley et al., 2013). However, in the brain network analysis, the choice of the region size must be as small as possible to consider all the individual connections at macroscales (Stanley et al., 2013).
The detail of the brain connectivity is characterized by network measures and the existing measures are classified into nodal measures and global measures (Rubinov and Sporns, 2010). However, the full potential of the graph theory on brain networks has not been fully exploited by the research community as the studies have used similar measures and techniques. The nodal measures refer to a single value for each node of the network (Rubinov and Sporns, 2010) and the global measures refer to a single value for the whole network (Rubinov and Sporns, 2010). The division of the brain into meaningful brain regions is used for different purposes in modern brain science (Eickhoff et al., 2018; Kim et al., 2015). A meaningful brain region, such as a brain lobe, has a specific structure and is responsible for carrying out unique functions. In the atlas-based networks, a brain lobe is represented by a group of nodes. If we compare the lobes in the context of centrality in the whole brain network, lobes should be individually analyzed and the centrality measures should be applied to the groups of nodes from lobes. It is impossible to apply the existing nodal measures for these meaningful groups of nodes. However, Kim et al. (2015) measured the betweenness centrality of a lobe using the average of the individual betweenness centrality values of the lobe's nodes. But the average of the individuals' centralities (degree or betweenness centrality) does not represent the lobe's centrality as from the definition of the centrality of a region. Another important limitation of this method is that the average value fails to address the fact that nodes may be central to the same group nodes or a different group of nodes. Network measures for groups of nodes enable researchers to solve these kinds of problems and explore a new direction to analyze and interpret any size of meaningful brain regions as groups.
The brain network measures of integration, such as global efficiency, are defined based on the concept of paths (Rubinov and Sporns, 2010). In the previous structural and functional brain network-based asymmetric studies (Chen et al., 2019; Daianu et al., 2013; Iturria-Medina et al., 2011; Li et al., 2018; Ratnarajah et al., 2013; Sun et al., 2017; Yang et al., 2017), global integration measures were applied to the left and right hemispherical networks separately as two brain networks, considering only intrahemispheric edges and eliminating interhemispheric edges. However, the interhemispheric paths (Corpus callosum fiber tracts) must be considered for the computation of the path-based measures of a hemisphere as the real connections of the left and right hemispheres consist of interhemispheric edges as well. To compute the global integration measures correctly, which need to be addressed by group concepts and left hemispherical nodes and right hemispherical nodes should be considered as two groups in one network. It turned out that there is a strong need to develop further the existing network measures in a group context.
The main aim of this article is to develop novel definitions and descriptions for group network measures based on the existing network measures (Rubinov and Sporns, 2010) to the group context. In addition, we show how the group network measures can be used to solve such fundamental network analysis problems using structural brain networks of Alzheimer's and healthy older adult subjects with the lobe-level and hemispheric-level group studies. The group centrality measures were significantly higher in temporal and parietal lobes in older adults. The strength of these central regions has been affected in Alzheimer's disease (AD), but the rewiring of the AD brain still preserves the paths of the other regions through temporal and parietal lobes. Leftward efficiency revealed in the older-adult brains with the new approach of considering interhemispheric and intrahemispheric connections and the asymmetry disappeared in the rewired AD patients, as the left hemisphere is heavily affected compared with the right. The new outcomes of this study will push forward the understanding of brain connectivity.
Materials and Methods
Group network measures
Group of nodes
A graph G is a pair,  , respectively. Let C be a set of nodes (group) of a brain network G such that C is a nonempty subset of V.
To develop the definitions of network measures for a group of nodes, we consider the following criteria: The features and the properties of the existing definitions and the fundamental meaning of the measures will remain the same. The network measures for a group of nodes are derived from existing nodal and global measures. The group network measures make sure a proper specialization of the corresponding existing nodal measures such that when applied to a group consisting of a single node, the group network measure produces the same value as the existing nodal measure. The group network measures make sure a proper generalization of the corresponding existing global measures such that when applied to a group consisting of all nodes of the network, the group network measure produces the same value as the existing global measure. The definitions of the group network measures are described for unweighted graphs and weighted graphs separately.
Figure 1 illustrates how a group of nodes is considered for the development of group network measures and the specialization and generalization processes.

The relationship and the transformation between existing nodal and global measures and group network measures. Specialization and generalizations are the main principles to prove the group network measures consistent with the existing measures.
Group centrality measures
Group degree
The degree of a group of nodes
and for a weighted graph G as
Specialization
Suppose a group C consists of only one node i (
Normalization gives greater significance in group centrality than in single-node centrality as the different sizes of groups and the transformation is nonlinear. Normalized group degree of a group of nodes C for an unweighted graph G is defined as
and for a weighted graph G as
The high value of
Group betweenness centrality
Group betweenness centrality (GBC) is introduced to identify the most central groups in a network that act as hubs in the network. The GBC of C,
where
Specialization
Suppose a group C consists of only one node
Group integration measures
Group characteristic path length
Group characteristic path length is defined by the average shortest path length of the group of nodes (C) with all the nodes in the network, including the group nodes. Group characteristic path length describes how the group nodes integrated with the whole network and how easy information can flow from the group nodes to all nodes in the network. Group characteristic path length of a group of nodes C for an unweighted graph G is defined as
and for a weighted graph G as
where
Generalization
Suppose a group C consists of all the nodes of the network (
Specialization
Suppose a group C consists of only one node i (
Group efficiency
Group efficiency is defined as the average inverse shortest path length of the group of nodes (C) with all the nodes in the network, including the group nodes. Group efficiency quantifies how efficiently the information can be exchanged between the group nodes to all the nodes in the network. A high value of group efficiency reflects high information flows of the group region in the brain. The group efficiency of a group of nodes C for an unweighted graph G is defined as
and for a weighted graph G as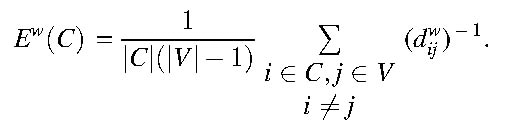
Generalization
Suppose a group C consists of all the nodes of the network (
Specialization
Suppose a group C consists of only one node i (
Application on older adults and Alzheimer's brain networks
Application of this study of group network measures used patients with AD and normal control subjects, with three main objectives: (1) exploration of the proper lobes comparison in terms of centrality, (2) exploration of hemispheric asymmetry in the most effective way, and (3) demonstration of the brain network analysis in a new different direction.
Magnetic resonance imaging data
The T1-weighted brain images and diffusion magnetic resonance imaging (MRI) brain images of Alzheimer's and normal healthy control subjects (older adults) selected from the Alzheimer's Disease Neuroimaging Initiative (ADNI) project database (Jack et al., 2008). The study subjects were recruited from over 50 sites across the United States and Canada. Study subjects gave written informed consent at the time of enrolment for data collection and completed questionnaires approved by each participating site's Institutional Review Board (IRB). The complete list of ADNI sites' IRBs can be found at (
The imaging data used to analyze in this study acquired at a specific time and the imaging data consist of 63 right-handed AD (age: 72.1 ± 5.8, M:F = 30:33, and Mini-Mental State Examination [MMSE]: 23.04 ± 1.7) subjects and 62 right-handed cognitively normal subjects (normal controls [NC]; age: 73.7 ± 4.4, M:F = 32:30, and MMSE: 27.43 ± 1.1). There were no differences in age (two-sample t-test, p = 0.0852) and gender (chi-square test, p = 0.65) between AD and NC subjects. These results confirm that the effect of age and gender were removed from the comparison test models of AD subjects and NC subjects for the other variables. As expected, the group difference was observed in the MMSE score (p < 0.01).
All subjects underwent whole-brain MRI scanning on 3-Tesla GE Medical Systems scanners. Anatomical T1-weighted sequence images (256 × 256 matrix; slices = 196; voxel size = 1.0 × 1.0 × 1.2 mm3; slice thickness = 1.2 mm; TI = 400 msec; TE = 2.84 msec; TR = 6.98 msec; flip angle = 11°) and diffusion MR images (5 T2-weighted images with no dedicated diffusion sensitization (b 0 images) and 41 diffusion-weighted images (b = 1000 sec/mm2) with the following parameters: 256 × 256 matrix size; 1.36 × 1.36 × 2.7 mm3 voxel size; flip angle = 90°; pulse sequence = EPI/SE; slice thickness = 2.7 mm; TE = 68.3 msec; and TR = 13,000 msec) were acquired.
Brain network construction
FMRIB Software Library (FSL) (Smith et al., 2004) was used for the image preparation procedures for all the subjects' imaging data, including noise removal, correction for subject motion and geometrical distortions, Eddy current correction for the diffusion MRI data, and brain extraction. Each individual T1-weighted image was first coregistered to the b0 image in the DTI space using a linear transformation (Jenkinson et al., 2002). All the resultant T1-weighted images were registered to Montreal Neurological Institute (MNI)152 space using a nonlinear transformation. Finally, the inverse transformations were applied to the Desikan–Killiany atlas template (Desikan et al., 2006) in the MNI space, resulting in diffusion tensor imaging (DTI) native space parcellations for each subject. Eighty cortical and subcortical regions (40 for each hemisphere) were created and each region representing a node of the brain network (Table 1).
List of Nodes for the Brain Network and the Classification of Nodes for Each Lobe Group
Number of nodes in each group is shown with the lobe names.
High angular resolution diffusion imaging (HARDI) whole-brain fiber tractography was performed using CAMINO (Cook et al., 2006) for every subject. The orientation distribution functions (ODFs) were reconstructed with the sixth order spherical harmonic series. A maximum of three peaks were detected from the ODF at each voxel. Seed voxels were chosen as voxels with
The tractography streamlines connecting different cortical and subcortical regions were considered as edges of the brain network. Adjacency matrices of brain networks weighted graph with 80 × 80 elements were constructed for every subject as described hereunder:
where
Small-worldness
A “small-world” network model was originally proposed by Watts and Strogatz (1998), relating to network clustering coefficient and characteristic path length. A real network is small-world if it meets the criteria:
Group centrality measures on lobes
The concept of cerebral lobe division into frontal, occipital, parietal, and temporal lobes and subcortical regions are accepted by the neuroscience community (Casillo et al., 2019). To compare and contrast the brain lobes of NC and AD subjects, based on the group centrality network analysis, lobe-level groups (Fig. 2 and Table 1) were created. The group centrality measures were computed for the five groups of lobes and for every AD and NC subjects' weighted brain networks. The group centrality measures were analyzed by a two-way analysis of variance (ANOVA), with lobe groups and subject groups (NC and AD) as independent factors and followed by Tukey's multiple comparison post hoc test at 95% significance level (p < 0.05).

Illustration of 80 nodes that were classified into five lobes groups with different colors (frontal: red, occipital: green, parietal: dark blue, temporal: light blue, and subcortex: magenta). Color images are available online.
Group integration measures on asymmetry study
In this study, we aimed to investigate in a correct approach, including interhemispheric paths, whether the two brain hemispheres of older adults and AD demonstrate dissimilar structural attributes. We computed group integration measures
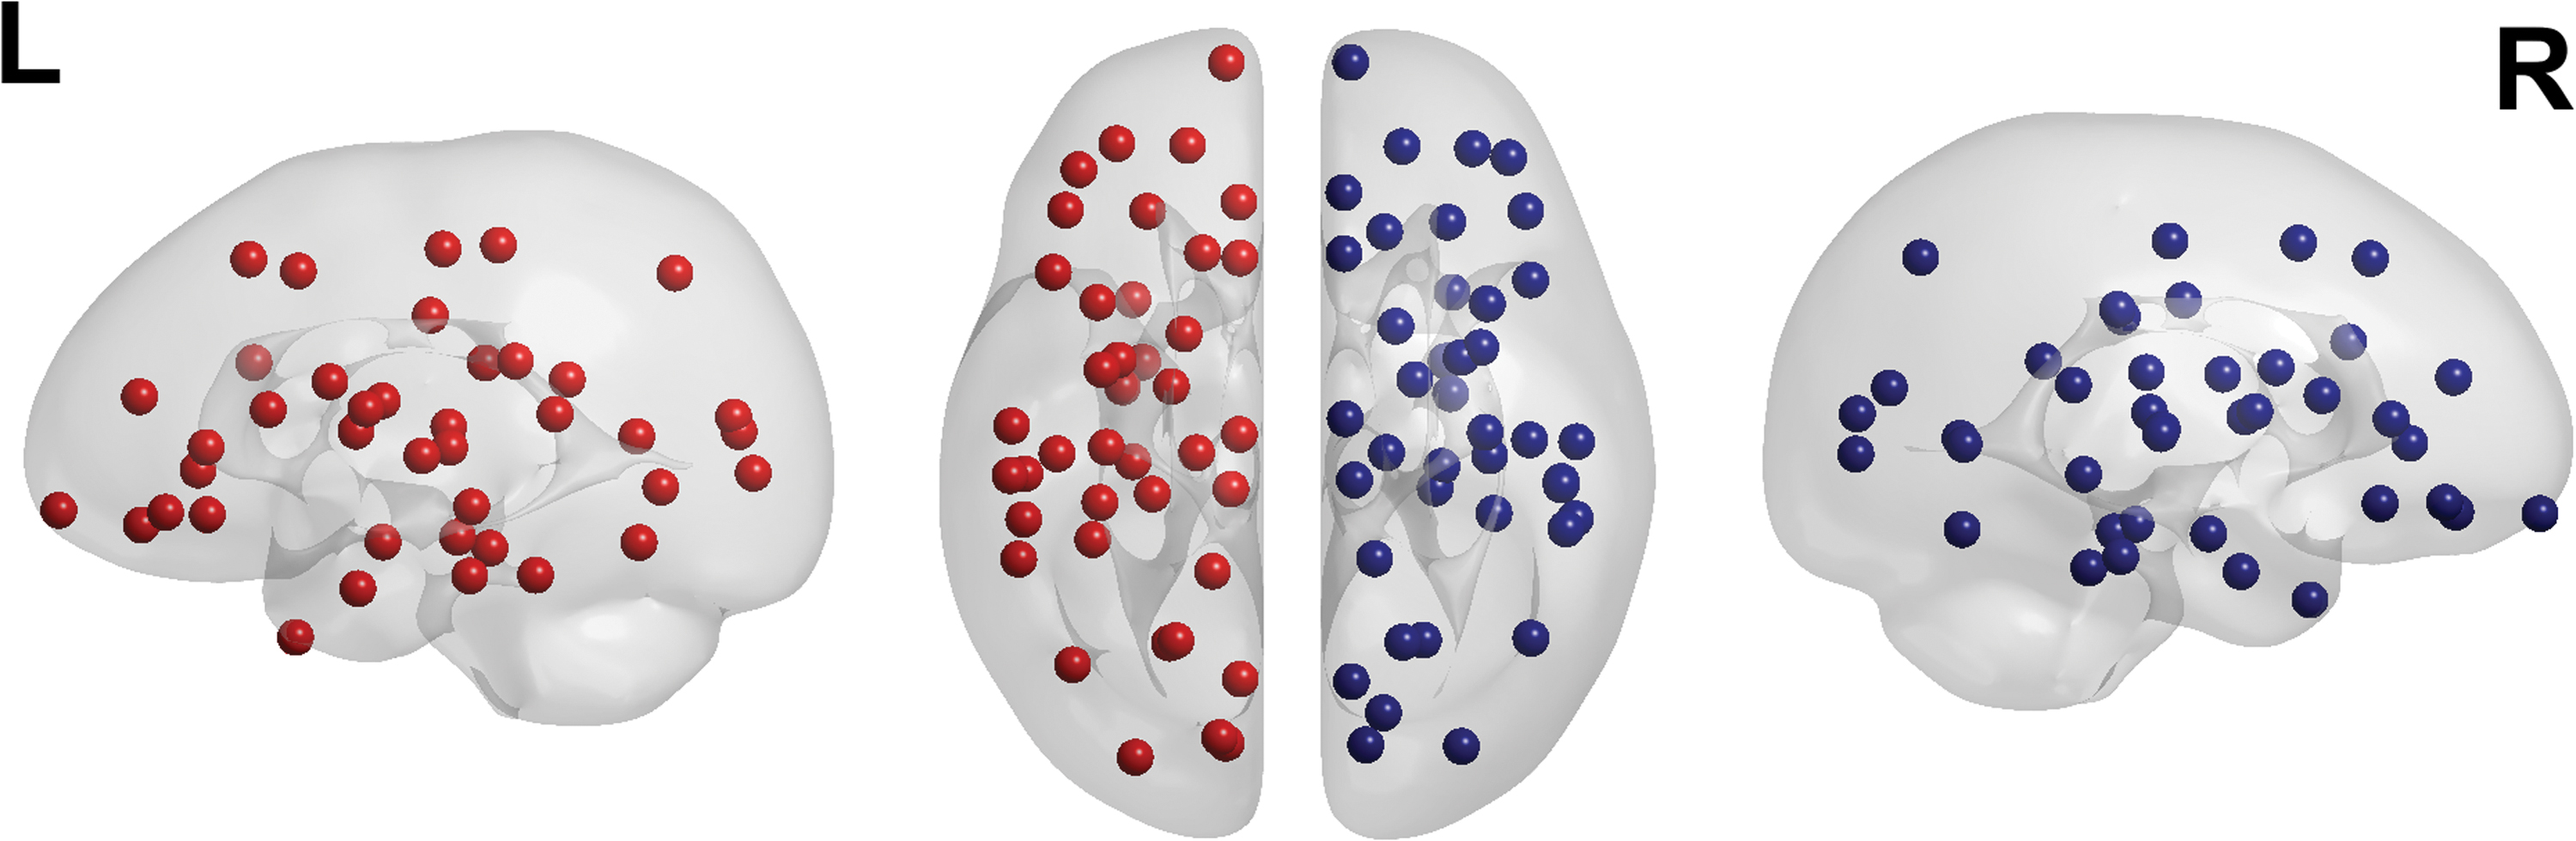
Illustration of 80 nodes that were classified into left and right hemispheric groups with different colors (left hemisphere: red and right hemisphere: dark blue). Color images are available online.
Results
Small-worldness
Compared with random networks with the same nodes and degree distribution, we found that the normalized clustering coefficient
Group centrality measures of lobes
Table 2 shows the mean and standard deviation values of the group centrality measures ( ) for each lobe of the NC and AD subjects. The descriptive statistics are graphically represented as a bar chart in Figure 4. Two-way ANOVA showed significant main effects for lobe groups (p < 0.001 for
  ) and subject groups (p < 0.001 for
  ) and the Tukey's multiple comparison test results of every possible pair of all groups revealed the following important findings.

Average group centrality network measures of NC subjects and AD subjects: ]  ). The error bars represent the standard deviation. Significance is represented by an asterisk (*p < 0.05).
Mean ± Standard Deviation of the Group Centrality Measures (, ) for Each Lobe of Normal Controls and Alzheimer's Disease Subjects
AD, Alzheimer's disease; NC, normal controls.
Group centrality measures of older adults (NC)
Comparing among lobes with centrality measures, we found that both group centrality measures significantly higher in the temporal lobe comparing with other lobe groups (temporal vs. parietal [p < 0.01]). The parietal lobe has next higher group centrality measures (parietal vs. subcortical [p < 0.01]) among the lobe groups.
Group centrality measures of AD
Generally, AD patients demonstrated decreased group centrality measures values in all the lobes compared with NC. Group degrees of AD subjects were significantly less than the NC subjects in parietal (p < 0.01), temporal (p < 0.01), and subcortical (p < 0.01) lobe groups. However, the temporal lobe and parietal lobes have higher GBC measures among the lobe groups (temporal vs. subcortical [p < 0.01] and parietal vs. subcortical [p < 0.01]) in AD as like older adults and more importantly, the GBC measures of AD did not show any significant differences with NC measures in these lobes only (temporal [p = 0.081] and parietal [p = 0.357]).
Group integration measures of hemispheres
We assessed the group differences between left and right hemispherical weighted brain networks based on the group integration measures for NC and AD subjects separately. Table 3 shows the mean and standard deviation values of the group integration measures  for each hemisphere of the NC and AD subjects. The descriptive statistics are graphically represented as a bar chart in Figure 5. AD Patients showed decreased group efficiency and increased characteristic path length compared with NC in both hemispheres (two-sample t-test, p < 0.01).

Average group integrity network measures of NC and AD of left and right hemispheres. . The error bars represent the standard deviation. Significance is represented by an asterisk (*p < 0.05).
Mean ± Standard Deviation of the Group Integration Measures (
The sign tests revealed that the median values of the LIs of the group efficiency measures of NC were significantly less than 0 (sign test: p < 0.01), suggesting the leftward asymmetry in the older adults. However, we found that the group efficiency (sign test: p = 0.79) and the group characteristic path length (sign test: p = 0.74) were nearly the same in the two hemispheres of AD. Alzheimer's reduces the hemispheric asymmetry and the leftward lateralization pattern observed in the older adults disappeared in the patients with AD.
The mean and standard deviation values of the global efficiency and characteristic path length measures ( ) for the left and right hemispheres of NC and AD subjects are presented in Table 3. AD patients showed decreased global efficiency and increased characteristic path length compared with NC as like group global efficiency and group characteristic path length. However, the global efficiency values are less than the group efficiency measures significantly in both hemispheres of AD and NC (two-sample t-test, p < 0.01 for left and right hemispheres of AD and NC). The sign tests revealed that the median values of the
Discussion
Group centrality measures of lobes
The higher group centrality measures in the temporal and parietal groups in older adults reflect the importance of the lobes in information transfer with other nodes during the late age too. The regions with high centrality values are structural cores of the brain and usually defined hubs (Hagmann et al., 2008). For the normal middle-aged brain, the hub regions of the rich club were mainly distributed in the medial frontal, parietal, and medial temporal cortices largely overlap with the regions of the default mode network (Zhao et al., 2015). However, age-related changes make a heavy loss of frontal regional hubs and their connections for older adults (Zhao et al., 2015). These previous findings are in line with our centrality measures of older adults, where group centrality measures significantly higher in temporal and parietal lobes among the lobes. Frontal hubs contribute an efficient backbone for whole-brain communication during the early and middle age and are replaced by other rich-club members at the late age because of maturation/normal aging, but the rewiring still preserves the regional centrality in temporal and parietal regions.
AD patients showed decreased group centrality measures values in all the lobes compared with NC and the previous studies on Alzheimer's (Mayo et al., 2017; Pereira et al., 2016; Rasero et al., 2017) confirmed this, the AD network disorganized and less clustered with few hub regions and weaker connections compared with NC.
AD is a disconnection syndrome in which brain regions become successively disconnected both structurally and functionally during the course of AD (Weiner et al., 2017). Increased
Group integration measures of hemispheres
The healthy brain exhibits structural asymmetries in efficiency (e.g., cortical thickness, white-matter integrity, and fractional anisotropy) throughout the lifespan (Zhou et al., 2013) as the brain matures with the progressive myelination (Benes et al., 1994) and synapse elimination (Huttenlocher and Dabholkar, 1997). The previous non-network-based structural asymmetry neuroimaging studies have demonstrated that the leftward asymmetry observed at birth (Gilmore et al., 2007), rightward asymmetry in older children and adults (Barrick et al., 2005; Caviness et al., 1996; Giedd et al., 1996; Good et al., 2001) and leftward asymmetry in older adults (Albert and Moss, 1988; Brown and Jaffe, 1975). Developmental changes in structural asymmetry between the left hemisphere and right hemisphere from birth to older adults show a left–right–left lateralization pattern and this evolution model of the structural asymmetrical efficiency consistent with this study, which revealed a significant leftward asymmetry in older adults.
In this study, older adults showed leftward efficiency, but the group integration measures of the left hemisphere were similar to the right hemisphere, indicating no obvious asymmetry in AD. The apparent reason for these results is that the left hemisphere is significantly more impaired than the right in AD, with a greater reduction in gray matter and white matter relative to the right hemisphere (Thompson et al., 2003; Wessa et al., 2016).
Contrasting and complicated findings revealed in the previous structural brain network efficiency studies with a virtual cut of the interhemispheric callosal connections [adults R > L (Iturria-Medina et al., 2011; Li et al., 2014), all age groups L > R (Caeyenberghs and Leemans, 2014), older adults L > R (Sun et al., 2017), older adults L = R (Daianu et al., 2013), adolescents L > R (Dennis et al., 2013), adolescents and young adults R > L (Zhong et al., 2016), 12 years old L = R (Dennis et al., 2013), AD R > L (Chen et al., 2019; Yang et al., 2017), and AD L = R (Daianu et al., 2013)]. Left-Right hemisphere differences are not well-known by the research community, and as interhemispheric connectivity paths may play a significant role in asymmetric studies, we compared left and right hemisphere networks considering the interhemispheric connections using group network measures. During the brain development, the dominance of interhemispheric connectivity at birth slowly shifts to intrahemispheric connectivity in adults (Tzourio-Mazoye, 2016), and it may be reversed in later ages, and interhemispheric connectivity became more important for information processing in the older adults.
Decreased global efficiency and increased characteristic path length of AD compared with NC in both hemispheres demonstrate the same results as the results of group efficiency and group characteristic path length measures. This proves that Alzheimer's brains become less integrated, less efficient, less organized, and less robust against attacks. The left = right and right>left lateralization patterns in older adults and AD using global efficiency compared with left>right and left = right lateralization patterns in older adults and AD using group efficiency confirm again that the left hemisphere is more affected than the right in AD. However, eliminating a part of the edges (interhemispheric pathways) from the network and computing efficiency (a shortest path-based measure) of a hemisphere provides only the intrahemispheric efficiency but not the natural efficiency of the hemispheres. This is proved with the proposed group efficiency measures as (1) increased group efficiency compared with global efficiency in both hemispheres of older adults and AD since the hemispheres use interhemispheric pathways to make efficient communication all over the brain regions; (2) lateralization pattern using global efficiency is different from the pattern using group efficiency and the lateralization pattern of the older adults using group efficiency for the right-handed subjects was matched with the non-network-based structural asymmetry neuroimaging studies.
Importance of the group network measures in brain network analysis
In this study, we answered some critical questions such as “how central is the frontal lobe in the brain network of the healthy older brain? or among hemispheres in an Alzheimer's disease brain, which one is more efficient, the left or the right?” by analyzing the group network measures. Group of nodes, such as a lobe or a hemisphere, are benefited from the group network measures that apply to a group of nodes rather than a single node or the whole set of nodes. There are no measures available for a group of nodes and there are many situations when it will be helpful to apply the existing nodal and global measures to a group of nodes.
The group network measures will enable the researchers to answer the inverse question such as “how can we find a group of nodes that is maximally central in a given brain network?” The group network measures, therefore, can be used as a criterion to form certain modules. Another important advantage of these group network measures is that the groups of nodes can be overlapped, unnecessary disjoint sets since the group network measures are computed directly from the network of relationships among individual nodes.
The parcellation of the brain into meaningful brain regions is employed for different purposes in modern brain science. In principle, our results could be biased by the chosen gray matter parcellation scheme to create nodes of the network or chosen nodes for the lobes' groups. A node of a brain network is defined as a gray matter voxel or a small atlas-based gray matter region (set of voxels). Voxel-based nodes of the brain anatomical networks will be benefited from the group network measures as a small atlas-based region consists of a set of voxels (set of nodes), which forms a group.
Conclusion
Novel concepts and definitions of global network measures were presented in this study to solve the brain network analysis problems related to the group context. A comprehensive evaluation was made on the group network measures to prove the effectiveness and accuracy using older adults and Alzheimer's structural neuroimaging data sets and obtained a number of significant results with the two group-level studies. Both group centrality measures of older adults are significantly higher in temporal and parietal lobes among the lobes' groups, but the strength of these most central regions has been heavily affected in AD subjects. However, the rewiring of the AD brain still preserves the paths for communication between nodes from other groups through temporal and parietal lobes. The group network measures, from both group-level studies, significantly decreased in AD, which shows that the AD network becomes less clustered and less efficient. Asymmetric studies performed on left and right hemispheres as groups, including interhemispheric edges. Leftward efficiency revealed in the older adults' brains and the asymmetry disappeared in the rewired AD patients as the left hemisphere is very much affected compared with the right hemisphere in the AD.
These kinds of group brain network analyses are not possible without using group network measures and we showed a novel way of brain network analysis to the research community. The concepts and definitions of group network measures will give a window to get a better understanding of the architecture and the functioning human brain in the studies of brain development, aging, and disease.
Footnotes
Authors' Contributions
S.S. was in charge of software, methodology, analysis, and writing the article. A.A.I.P. was responsible for review, methodology, writing, and supervision. A.H. performed review, editing, and supervision. N.R. contributed toward conceptualization, investigation, writing, data, review, and editing the article.
Author Disclosure Statement
No competing financial interests exist.
Funding Information
The authors declare no funding for this research.