
Abstract
Stroke is known to cause widespread activation and connectivity changes resulting in different levels of functional impairment. Recovery of motor functions is thought to rely mainly on reorganizations within the sensorimotor cortex, but increasing attention is being paid to other cerebral regions. To investigate the motor task-related functional connectivity (FC) of the ipsilesional premotor cortex (PMC) and its relation to residual motor output after stroke in a population of mostly poorly recoverd patients. Twenty-four stroke patients (23 right handed, mean age = 52.4 ± 12.6 years) with varying levels of motor deficits underwent functional magnetic resonance imaging while performing different motor tasks (passive mobilization, motor execution, and motor imagery of an extension movement of the unaffected hand [UH] or affected hand [AH]). For the different motor tasks, analyses of cerebral activation and task-related FC of the ipsilesional lateral sensorimotor network (SMN), and particularly the premotor cortex (PMC), were performed. Compared with UH data, FC of the ipsilesional lateral SMN during the passive or active motor tasks involving the AH was decreased with regions of the ipsilesional SMN and was increased with regions of the bilateral frontal and the ipsilesional posterior parietal cortices such as the precuneus (Pcu). During passive wrist mobilization, FC between the ipsilesional PMC and the contralesional SMN was negatively correlated with residual motor function, whereas that with nonmotor regions such as the bilateral Pcu and the contralesional dorsolateral prefrontal cortex was positively correlated with the residual motor function. Cross-modal FC of the ipsilesional PMC may reflect compensation strategies after stroke. The results emphasize the importance of the PMC and other nonmotor regions as prominent nodes involved in reorganization processes after a stroke.
Introduction
Stroke is the leading cause of persistent motor deficits. It causes local and long-distance changes of cerebral activation and connectivity resulting in varying levels of motor impairment. Functional magnetic resonance imaging (fMRI) studies using motor tasks have been conducted on stroke patients to investigate changes in brain activation related to recovery (Kim et al., 2006; Tombari et al., 2004) and/or to the effects of specific therapeutic interventions (Saleh et al., 2014; Veverka et al., 2012). After a stroke, an initial contralesional shift of activation resulting in a bilateral overactivation of the sensorimotor network (SMN) occurs. Although sometimes reduced, activation returns to a more ipsilesional pattern during the course of recovery. Some studies highlighted the contribution of ipsilesional surviving regions (Calautti and Baron, 2003; Kim et al., 2006) and nonprimary motor areas (Chollet et al., 1991; Rehme et al., 2012; Szameitat et al., 2012) to residual cortical output.
Alterations of resting-state functional connectivity (FC), characterized by changes in low-frequency fluctuations of the blood oxygenation level-dependent (BOLD) signal, have also been demonstrated in many cerebral networks after a stroke (Chen and Schlaug, 2013; Fan et al., 2015; Grefkes and Fink, 2014; Park et al., 2011). FC normalization, compared with FC of healthy subjects, has been shown to correlate with behavioral improvement during recovery (Fan et al., 2015; Rosso et al., 2013; Zhang et al., 2016, 2017). Functional changes were observed mainly in lesioned networks of the affected hemisphere and were significantly correlated with clinical improvements as, for example, assessed by the National Institutes of Health Stroke Scale, NIHSS (Ovadia-Caro et al., 2013). One month after stroke, a higher FC of the ipsilesional primary motor cortex (M1) with ipsilesional frontal, parietal, and cerebellar regions was observed in stroke patients in comparison with healthy subjects (Park et al., 2011). The M1 FC observed at stroke onset with particularly the contralesional supplementary motor area (SMA) and the middle frontal gyrus was positively correlated with motor recovery assessed 6 months after (Park et al., 2011). Connectivity measures may thus be used as biomarkers of residual cerebral function and recovery potential of these patients (Wu et al., 2015).
Changes observed during the course of motor recovery are thought to rely on behavioral restitution or compensation mechanisms (Bernhardt et al., 2017). Whereas behavioral restitution requires neural repair, behavioral compensation relies rather on learning processes. Increasing evidence suggests that the cortical reorganizations contributing to the compensation of neuronal loss and the return of function after stroke rely on other regions than those of the contralesional SMN (Grefkes et al., 2010b; Schulz et al., 2015) especially in severely affected patients (Dechaumont-Palacin et al., 2008; Rehme et al., 2011). Despite the rich literature on the brain activity and connectivity changes after a stroke, few studies have explored FC of ipsilesional secondary motor areas during motor tasks and their functional relevance regarding the residual motor deficits (Westlake and Nagarajan, 2011). These areas are prone to take over the function in severely impaired patients (Dechaumont-Palacin et al., 2008; Ward and Cohen, 2004; Ward et al., 2006). Many studies have included subcortical stroke patients (Loubinoux et al., 2007; Takechi et al., 2014; Ward et al., 2006) and explored mainly resting-state FC (Park et al., 2011; Thiel and Vahdat, 2015; Zhang et al., 2017). Therefore, the aim of this study is to investigate and compare the FC profile of the ipsilesional SMN during different motor tasks between the affected hand (AH) and unaffected hand (UH) and to investigate the FC of a secondary motor area, the ipsilesional premotor cortex (PMC) in relation to the motor deficits of a heterogeneous population of stroke patients. A main goal is to assess the relevance of task-based FC analysis to find biomarkers for predicting stroke recovery prognosis.
Methods
The neuroimaging data were acquired from patients included in a clinical protocol that tested the electrophysiological and behavioral effects of the association of motor imagery (MI) training and Paired Associative Stimulation (PAS) (MIPAS protocol). During the inclusion visit, motor deficits and ability of patients to perform MI were assessed. They also completed an fMRI examination. The transcranial magnetic stimulation (TMS) procedure used in MIPAS is precisely described in Tarri et al. (2018).
Patients
Between December 2013 and December 2017, 25 patients (24 right handed, mean age = 53 ± 12.7 years) were included during their stay in the rehabilitation and physical medicine department of the Toulouse hospital. Written informed consent was obtained from all the patients in accordance with the Declaration of Helsinki and the study was approved by the local institutional review board (Comité de Protection des Personnes Sud-Ouest et Outre-Mer II; RCB 2012-A01419-34) in January 2013.
The inclusion criteria were a first ever stroke, a motor deficit of the contralateral upper limb, an ability to perform MI as assessed with the time-dependent motor imagery (TDMI) screening test (Malouin et al., 2008), and the presence of a motor evoked potential for the Extensor Carpi Radialis longus (ECR) muscle. The exclusion criteria were a history of epileptic events and the presence of any contraindication to TMS or MRI.
Motor deficit and MI ability assessment
For each subject, upper limb motor deficits were assessed with the upper extremity section of the Fugl-Meyer scale (UE-FMS) (Fugl-Meyer et al., 1975) upon inclusion and at the end of the protocol, 4 weeks later. The UE-FMS evaluates aspects of movement, reflex, coordination, and speed. Specifically, it addresses volitional movement within synergies or mixing synergies and volitional movement with little or no synergy dependence at the level of the shoulder, elbow, forearm, wrist, and hand of patients seated comfortably. Each domain contains multiple items, each scored on a 3-point ordinal scale (0 = cannot perform, 1 = performs partially, 2 = performs fully). The item scores are summed to provide a maximum score of 66. The extension amplitudes of the wrists (EA, angle in degrees) were assessed during the course of the protocol with an electronic goniometer (Biometrics LtD®) by measuring the angles of wrist voluntary extension from 0° to its maximum amplitude. MI ability was evaluated with the TDMI screening test, a chronometric test in which the number of imagined movement is recorded over three time periods (15, 25, and 45 sec) and compared between the AH and UH. The movement assessed during the TDMI was the active extension of each wrist. The Kinesthetic and Visual Imagery Questionnaire (KVIQ) (Malouin et al., 2007), which is a questionnaire that scores the clarity of mental images and the intensity of associated sensations, was also used to assess MI performance.
Experimental design and analysis
Experimental fMRI paradigm
Before each scanning session, the instructions were given and all the subjects were familiarized with the fMRI paradigms. Task instructions were presented to the patients through headphones and on a screen reflected on a mirror placed in front of them.
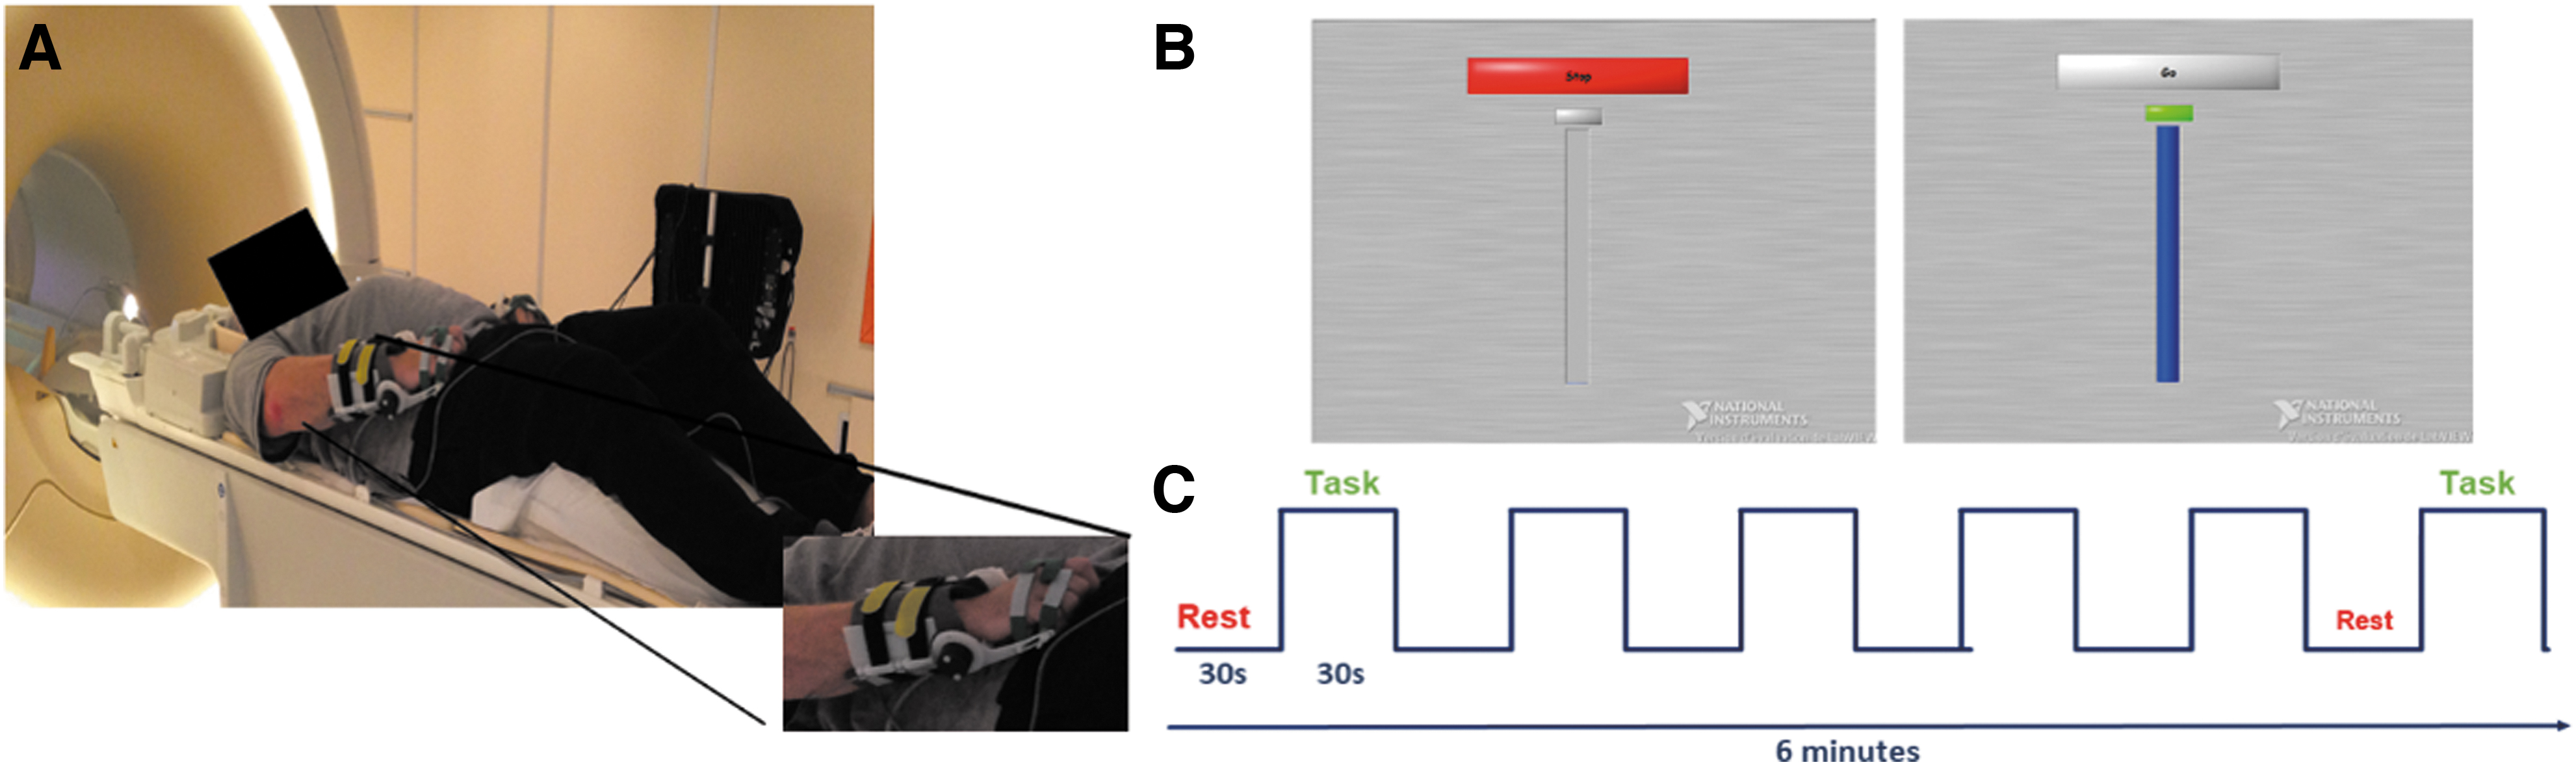
Patients were lying in the fMRI scanner in supine position with their eyes open (Fig. 1). The wrist active and passive extension amplitudes were recorded using MRI-compatible goniometers developed in our laboratory (Fig. 1A). The stimulation paradigm was constructed using Labview software, installed on a computer placed in the MRI room and synchronized to the MRI acquisition trigger signal and to the goniometers. The software allowed the display of a metronome on the screen, animated by the movement performed by the patient in real time. The stimulation paradigm was also used to visually indicate to the patient when to start (Go) and when to stop (Stop) the movement (Fig. 1B). Ten movements were, therefore, performed per task block. The wrists' extension amplitudes were recorded and stored, which allowed us to control for movements amplitudes across blocks, runs, and patients.
Experimental design description.
Three functional tasks were studied in this order: passive mobilization (PM), motor execution (ME), and MI of wrist extension movements at a frequency of 0.33 Hz, assessed in block design paradigms (Fig. 1C). Each task was performed with the UH and then with the AH to ensure correct comprehension of instructions especially for active tasks. During the PM condition, an experimenter, present in the MRI room with the patient, mobilized his/her wrist by raising and lowering it from 0° to its maximum amplitude. During the ME condition, the patient had to perform voluntarily the wrist extension movements during the “Go” blocks. Finally, during the MI one, the patient had to imagine him-/herself performing the wrist extension movements from a first-person perspective.
Each of the three runs consisted of 12 blocks (succession of Stop–Go blocks), lasted 6 min and was repeated twice, using either the UH or the AH of the patient.
fMRI data acquisition
Images were acquired using a Philips Achieva 3T MRI scanner equipped with a 32-channel head coil (Philips Medical Systems, Best Netherlands) and dsTream technology.
High-resolution weighted T1 images (3D MPRAGE) were first acquired for each patient (TR = 8 msec, TE = 3.7 msec, TI = 520 msec, flip angle = 8°, FOV = 240 × 240 mm2, Voxel size = 1 × 1 × 1 mm3, 170 sagittal sections). Secondly, functional images were recorded using T2-weighted EPI sequences. Thirty-four contiguous axial images, parallel to the inter-commission plane, were obtained (TR = 2500 msec; TE = 35 msec; FA = 90°; 230 × 230 of FOV; matrix 96 × 96; voxel size = 2.4 × 2.4 mm2; slice thickness = 4 mm). Thus, 144 volumes were acquired for each of the six functional runs.
Data analysis and statistics
Functional data were preprocessed with SPM12 (Statistical Parametric Mapping, Wellcome department of Cognitive Neurology, London, United Kingdom;
Nine patients had a lesion in the right hemisphere; their images were flipped, across the mid-sagittal plane, to the left hemisphere, for comparison purposes (Chollet et al., 1991). This is a recommended approach for creating group-level maps in population with different lesioned hemisphere (Crinion et al., 2007). Moreover, FC in motor areas is relatively symmetric across hemisphere and does not significantly differ between left-handed and right-handed subjects (Wang et al., 2014). For each patient, a binary lesion mask was created using MRIcron software (
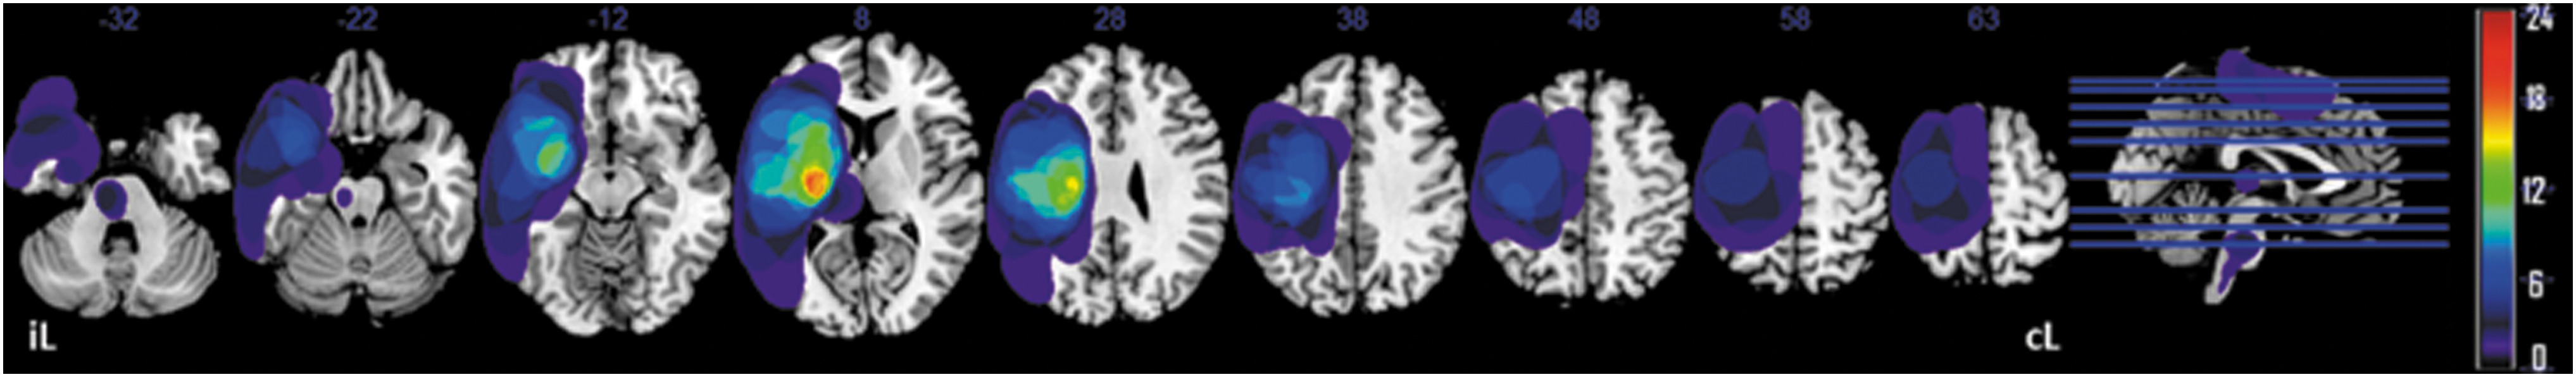
Lesion overlap map of individual lesions of the stroke patients. Maps are overlaid on a T1-template in the MNI space. Right lesions were flipped to the left hemisphere. MNI coordinates of each transverse section (z-axis) and a sagittal slice for visualization are given. Color scale indicates the number of patients having a lesion in a given voxel. MNI,
Activation analysis
For the functional images, a first-level general linear model (GLM) was applied for each subject. The pattern of activation in each condition was studied using simple effect comparisons (contrast between task and resting blocks). The small sample size would make multiple comparisons using parametric analyses too conservative; a nonparametric approach was thus preferred. The single subject contrasts were then moved into second level models using the Statistical nonParametric Mapping toolbox (SnPM13,
FC analysis
The data were also processed using the CONN toolbox ver. 17a (
Tables 2 –4 show the coordinates in the MNI space of activation peak during movement of the unaffected (Table 2) and affected (Table 3) hands and of regions functionally connected to the ipsilesional SMN (Table 4).
In addition, the TDMI scores were analyzed with a two-way repeated measures ANOVA (two sides [affected vs. unaffected] × 3 time periods [15, 25, and 45 sec]). Similarly, the kinesthetic and visual subscores relative to both sides of the upper limb were analyzed using a two-way repeated measures ANOVA (two modalities [visual vs. kinesthetic] × upper limbs [affected vs. unaffected]). If significant, Tukey HSD post hoc tests were performed. A p < 0.05 was set as statistical threshold.
Results
Behavioral results
Of the 25 patients included, 1 (#20) could not complete the fMRI examination because of pain in her AH due to movements. Thus, we report the results from 24 patients. The characteristics of the participants are reported in Table 1.
Patient Demographic and Clinical Data
Gender—M: male, F: female; PST—poststroke time in months, mo; affected hemisphere—L: left hemisphere, R: right hemisphere; stroke type—I: ischemic, H: hemorrhagic; lesion volume in cubic centimeter (cc); UE-FMS at the inclusion—upper extremity Fugl-Meyer score, total score, max 66; UE-FMSB—part B of the FM scale specific in the assessment of the wrist, max 10; UE-FMSC—part C of the FM scale specific in the assessment of the hand, max 14;
Clinically meaningful improvement (Hiragami et al., 2019).
The median poststroke time was 5 months (interquartile range = 3 months) with a mean UE-FMS = 27 ± 13.5/66. There was no effect of hand dominance nor affected hemisphere on UE-FMS. Over the 1-month study period, we considered the patients stable in terms of the motor function of their wrists and hands (as shown by the absence of significant changes in terms of wrist EA measures [not shown] and of the relative scores of the UE-FMS, cf. ΔFMS_B, C in Table 1). The lesion overlap map (Fig. 2) shows a predominance of injuries to the territory of the middle cerebral artery and posterior limb of the internal capsule, which may explain the severity of motor deficits in our population.
As expected from Malouin et al. (2008), the result of the TDMI revealed an increase of movement number with the increase of the time period (average number of movements ± SD at 15 sec: 5 ± 2 [UH] vs. 4 ± 2 [AH]; at 25 sec: 8 ± 4 [UH] vs. 7 ± 3 [AH] and at 45 sec: 14 ± 7 [UH] vs. 10 ± 6 [AH]; F 2,46 = 64.55, p < 0.001, partial η 2 = 0.74) with a side effect (F 1,23 = 94.03, p < 0.001, partial η 2 = 0.80) and a side by time period interaction effect (F 2,46 = 13.80, p < 0.001, partial η 2 = 0.38). Tukey HSD post hoc test indicated that the increase in the number of imagined movements with the AH, between 25 and 45 sec time periods was lower than that with the UH (p < 0.05). The mean KVIQ for the population was 117 ± 24.1/170 (Table 1). The two-way ANOVA revealed a main effect of modality (F 1,24 = 13.9, p = 0.001, partial η 2 = 0.37), a main effect of side (F 1,24 = 4.51, p = 0.04, partial η 2 = 0.04), and no modality × side interaction effect. Tukey HSD post hoc tests revealed higher visual scores compared with kinesthetic scores (VIQ: 11.2 ± 0.51 vs. KIQ: 9.2 ± 0.54, p = 0.04) and higher scores for the UUL compared with the AUL (UUL: 10.6 ± 0.51 vs. KIQ: 9.8 ± 0.48, p = 0.001). No correlation was found between the UE-FMS scores and the MI scores.
Brain activation
Figure 3 and Tables 2 and 3 show the group activation maps and the corresponding MNI coordinates of the activated brain regions during the different motor tasks performed with the AH and the UH.
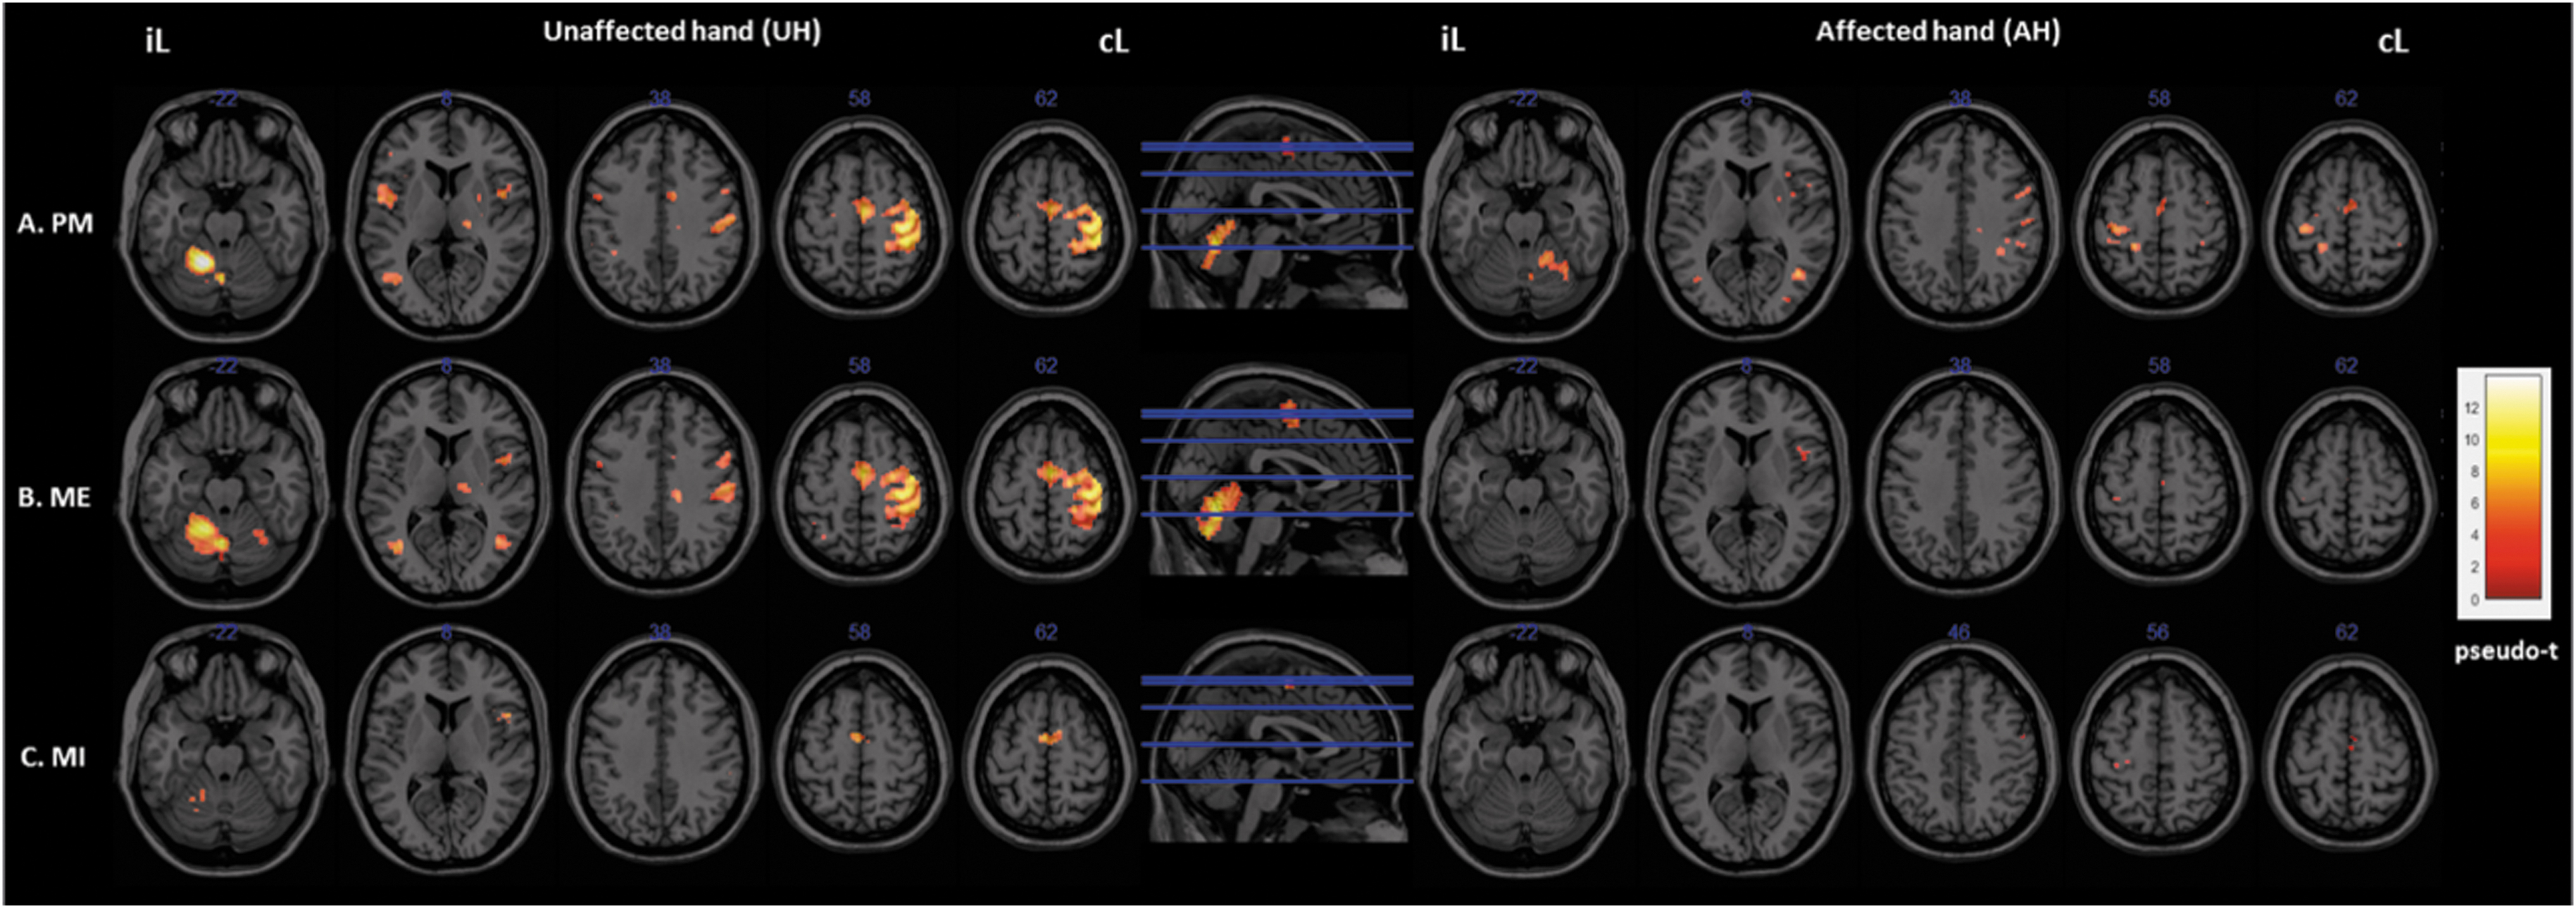
Activation maps. Brain activity associated with the different experimental conditions.
Coordinates in the Montreal Neurological Institute Space (with the Corresponding Statistics [t-Values] and Brodmann Areas) of the Activated Brain Regions During the Three Conditions of Interest (Passive, Executed, and Imagined Movements of Wrist Extension) Involving the Unaffected Hand
IPL, inferior parietal lobule; MFG, middle frontal gyrus; SMA, supplementary motor area; S1M1, sensorimotor cortex; UH, unaffected hand.
Coordinates in the Montreal Neurological Institute Space (and Their Corresponding Statistics [t-Values] and Brodmann Areas) of the Activated Brain Regions During the Three Conditions of Interest (Passive, Executed, and Imagined Movements of Wrist Extension) Involving the Paretic Affected Hand
AH, affected hand
During PM
Passive extension of the UH resulted in significant (pseudo-p < 0.05, FWE corrected) activation of the right contralesional sensorimotor cortex (S1M1), ipsilesional cerebellum, SMA, motor cingulate gyrus, regions of the frontal gyrus (BA6, 9, 45), right thalamus and putamen, left inferior parietal lobule (IPL, BA40), and insula (BA13). Activation of other nonsensorimotor regions was also observed, in the middle occipital and temporal gyri. We observed a similar pattern of activation for the AH, but with much lower intensities. Indeed, we found significant activation of the ipsilesional S1M1, contralesional cerebellum, frontal regions (BA 9, 44), inferior and superior parietal lobules (SPL, BA7; IPL), insula, motor cingulate and the putamen, as well as the occipital gyri.
During ME
Globally, the UH active extension movement induced a similar pattern of activation to that induced by PM. We observed activations in the contralateral SMN and the ipsi- and contralesional cerebellum. During active extension of the AH, the activation pattern was much less intense and less extended. Nevertheless, we observed a significant activation of sensorimotor areas (ipsilesional S1M1, SMA, and PMC) and contralesional regions of the frontal gyri (BA44, 6) (pseudo-p < 0.05, FWE corrected).
During MI
MI of UH extension movement induced a significant activation of the SMA and the Broca area (BA44), ipsilesional cerebellum and supramarginal gyrus (BA40) and areas of the superior and middle frontal gyri (BA6, 9), the SPL and IPL. Activation was also low but significant in the primary motor cortex (BA4) and the motor cingulate cortex. Although much less intense and extended for the AH, we can, however, note the significant activation of sensorimotor regions (the primary motor cortex, BA4; the SMA and the PMC, BA6) (pseudo-p < 0.05, FWE corrected).
FC profile
Seed-to-voxels FC
Seed-to-voxels FC analyses with the ipsilesional lateral SMN as a seed were conducted to compare the FC profiles obtained during the three different motor tasks performed with the AH and the UH.
During PM, we observed a significant decrease in FC of the ipsilesional lateral SMN with regions of the ipsilesional S1M1 and contralesional cerebellum and an increase of its FC with the precuneus (Pcu), areas of the ipsilesional visual and fusiform gyri (BA18, 19, 36, 37) as well as with bilateral frontal regions (BA11, 6, and 8) (Fig. 4A and Table 4A). During ME (Fig. 4B and Table 4B), a significant decrease in FC of the ipsilesional lateral SMN was observed with regions of the ipsilesional SMN (BA6, 4, 3) and with associative somatosensory cortex (BA 7 and 5 specifically) compared with the movement of the UH. Finally, during MI (Fig. 4C and Table 4C), there was a significant increase of the FC of the ipsilesional lateral SMN with the ipsilesional cerebellum.

Functional connectivity difference maps of the ipsilesional lateral sensorimotor network (SMN seed, left panel) during the different experimental conditions. Differences between affected- and unaffected hand movements.
Coordinates in the Montreal Neurological Institute Space (with Their Corresponding Statistics [t-Values] and Brodmann Areas) of the Brain Regions Functionally Connected to the Ipsilesional Lateral Sensorimotor Cortex During Different Movements (Passive, Executed, and Imagined) of the Paretic Affected Hand in Comparison with Movements of the Unaffected Hand
FC, functional connectivity; Pcu, precuneus; PM, passive mobilization; PMC, premotor cortex.
Simple regression analyses with motor deficit scores
Taking the ipsilesional PMC as a seed, no significant results were found for the ME and MI tasks. However, and interestingly, the residual motor function of the patients, as assessed with the UE-FMS, was a predictor of the FC of the ipsilesional PMC (left BA6) during PM of the AH (Fig. 5). We found that FC between the ipsilesional PMC and the contralesional S1M1 [BA4(18;−14;76), β = −0.011, p < 0.001; BA3/2(30;−28;60), β = −0.014, p < 0.001] and contralesional PMC [BA6(2;−8;56), β = −0.016, p < 0.001] was negatively correlated with the UE-FMS measured at the inclusion (Fig. 5B); whereas FC with the Pcu [ipsilesional BA7 (−6;−72;34), right BA7 (18;−68;38), β = 0.013, p < 0.001] and the contralesional dorsolateral prefrontal cortex [dlPFC, contralesional BA9 (48;20;24), β = 0.013, p < 0.001] was positively correlated with the UE-FMS scores of the patients (Fig. 5A). No outliers were found for these analyses and the PMC FC was not found to be correlated with lesion volumes.
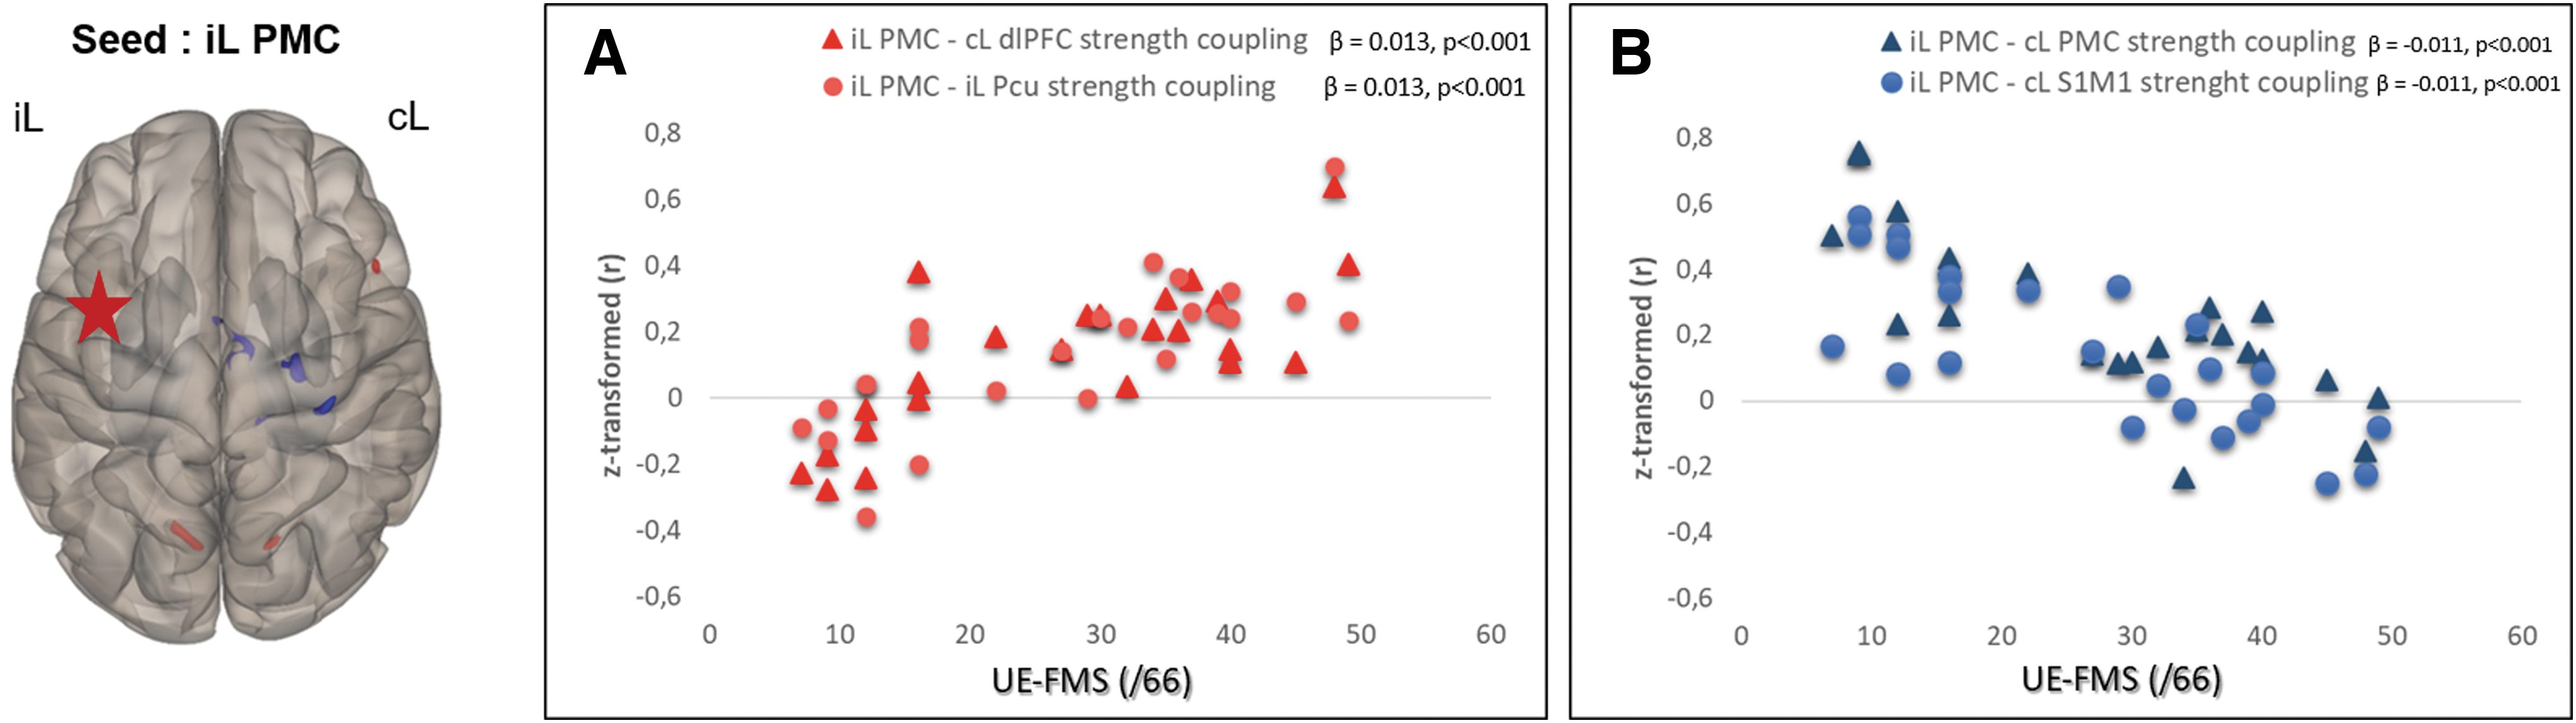
Regression analysis results. Left panel: functional connectivity pattern of the iL PMC during passive movement of the AH in relation to the initial motor deficits of the stroke patients as assessed with the UE-FMS at the inclusion.
Discussion
In this study, we highlighted poststroke neuroplasticity processes in terms of both activation and FC changes during motor tasks involving the AH and UH. Interestingly, the FC profile of the PMC during passive extension of the AH correlated with motor deficit severity of the patients. We have indeed observed in a large population of mostly poorly recovered patients that better motor function was associated with a decrease in FC with contralesional sensorimotor regions and an increase in cross-modal FC with nonmotor regions such as the bilateral Pcu and the contralesional dIPFC.
Brain activation and FC profiles
Decreases in cerebral activation and FC often described after stroke (Almeida et al., 2017; Rehme et al., 2012; Sharma et al., 2009a) are thought to be caused by the ineffective information processing between regions of the SMN. These decreases are thought to explain the motor deficits of the patients at early stages (Grefkes and Fink, 2011), deficits that may still persist for months after the stroke onset (Park et al., 2011). A normalization of activation and FC profiles of the ipsilesional SMN (Ovadia-Caro et al., 2013; Ward et al., 2003a), due to poststroke reorganization processes, is often reported especially in well-recovered patients (Feydy et al., 2002; Tombari et al., 2004; Ward et al., 2003b) with better motor performances (Calautti et al., 2001; Rehme et al., 2012) compared with those of the present population. Indeed, neither activation nor FC patterns appear to have fully normalized in our population of nonwell-recovered patients, although most of them appear to have reached a stable state in their recovery, according to the criterion proposed by Hiragami et al. (2019).
The decrease in SMN activity and FC seems more pronounced in the case of ME compared with PM and MI. This can be explained by the fact that regions of the motor network are known to be more involved during the voluntary execution of the movement than during PM or MI (Qiu et al., 2005; Szameitat et al., 2012). Moreover, in our patient population, the corticomotor tract was often injured, whereas the ascending sensory tracts seem to be comparatively spared (Fig. 2). During PM, the ascending sensory tract plays a predominant role (Patestas and Gartner, 2013), whereas MI is known to rely more on high-level order and nonmotor regions than motor regions (Hanakawa et al., 2008). In addition, we observed that MI of the AH movement induces significant although weak activation of ipsilesional M1. This latter result obtained with a heterogeneous patient population in terms of stroke location and type contributes to the debate about the M1 involvement during MI (Dechent et al., 2004; Sharma et al., 2006). It also suggests that MI may be successfully used in rehabilitation protocols to stimulate M1 excitability after stroke (Kho et al., 2014).
SMN FC increase with nonprimary motor regions and nonmotor ipsi- and contralesional regions was also observed. These increases may reflect neuronal compensation mechanisms for the weakened ipsilesional networks (Levin et al., 2009; Zhang et al., 2017) that could improve motor recovery (Levin et al., 2009). Our results also revealed increased ipsilesional SMN FC with the ipsilesional cerebellum during MI of the AH in comparison with the UH. Neuroimaging studies have shown that corticomotor–cerebellar interactions are relevant for motor output after stroke and may reflect the effects of therapeutic interventions (Vahdat et al., 2019). In fact, structural imaging studies have found an association between these connections and the residual gross motor function of well-recovered chronic stroke patients (Schulz et al., 2017). The increase of the SMN FC with the ipsilesional cerebellum in our study supports the importance of this region in reorganization processes after a stroke.
FC profile of the PMC and its relevance to motor function
The involvement of secondary motor areas has been suggested to benefit the motor recovery of patients, especially after subcortical strokes (Fridman et al., 2004) and when M1 is injured (Gerloff et al., 2006). Early involvement of the SMA during passive flexion/extension of the paretic wrist reportedly correlates positively with motor improvement (Loubinoux et al., 2003). The PMC is thought to undergo a series of reorganizations to restore the control of the basic parameters of movements; a function usually dependent on M1 (Fridman et al., 2004).
In our study, FC between the ipsilesional PMC and the contralesional S1M1 and PMC during PM of the AH was negatively correlated with the patients' residual motor function. As already mentioned, the recovery-supportive role of the contralesional SMN in the reorganization processes that occur after stroke is still under debate (Almeida et al., 2017; Dodd et al., 2017; Loubinoux et al., 2017). The contralesional M1 is thought to exert excessive inhibition on the ipsilesional M1 during paretic hand movement and this phenomenon was positively correlated with the degree of motor impairment (Grefkes et al., 2008). Furthermore, inhibitory rTMS applied over the contralesional M1 enhanced the connectivity between the ipsilesional M1 and SMA and was associated with an improvement of motor performance (Grefkes et al., 2010a). Interestingly, even in the context of a passive task, persistent high FC between ipsi- and contralesional sensorimotor regions seems to be related to the persistence of motor deficits. Our results support the increasing evidence suggesting that a strong persistent involvement of the contralesional SMN may not be as beneficial to the recovery of motor function as previously thought (Grefkes and Fink, 2011). They also make this view generalizable for the first time to a heterogeneous patient population of patients who suffered ischemic or hemorrhagic stroke with cortical and/or subcortical lesions.
Another interesting and original finding was the positive correlation found between PMC FC with the Pcu and the dlPFC and the UE-FMS scores of the patients. These functional connections may be classified as “cross-modal.” Indeed, the observed regions belong to different modality networks. Whereas the PMC is known to be part of the SMN, the Pcu is an important node of the default mode network (DMN), which is known to be involved in the processing of self-information and memories collection (Fransson and Marrelec, 2008). As for the dlPFC, which is activated in response to a wide range of demanding task conditions, is a region of the control executive network (Brosnan and Wiegand, 2017). Thus, patients with the less severe motor deficits had increased cross-modal FC during PM of the AH. A decrease of FC was observed between nodes of the DMN, that is, the bilateral Pcu and the angular gyrus in chronic subcortical stroke patients (Zhang et al., 2017). Over the course of recovery, this FC decrease may allow the reallocation of certain DMN regions in favor of the continuous reorganization of other networks such as the SMN. The Pcu is involved in the reallocation of attentional and neural resources (Brihmat et al., 2017; Leech et al., 2014). Given its functional connections with motor regions and particularly M1 (Zhang and Li, 2013), the Pcu may be a crucial region to compensate for loss of connectivity with the damaged area by reallocating the residual resources after stroke. Regarding the dlPFC, a study investigating effective connectivity during MI of well recovered subcortical stroke patients found enhanced coupling between the PMC and prefrontal areas. This finding was hypothesized to reflect the cortical reorganization processes that facilitate the motor performance (Sharma et al., 2009b). The dlPFC may also be a substrate for continuous motor relearning, and is as such an important node that may facilitate motor recovery (Krakauer, 2006). Structural imaging studies have shown direct connections between the dIPFC and the PMC (Tomassini et al., 2007). However, Schulz et al. (2019) found no clear evidence for a significant association between these structural connections and the residual motor functions of well-recovered chronic patients with mainly subcortical strokes. Our results revealed that mild residual motor deficits were associated with PMC-dlPFC increased functional connections in heterogeneous stroke patients with more widespread lesion locations. Thus, our findings support the involvement of more high-level and cognitive related brain areas such as the Pcu and the dlPFC in poststroke reorganization processes and that such cross-modal FC would facilitate effective motor output after a stroke (Sharma et al., 2009b).
Our results argue in favor of the use of PM tasks to study FC changes after stroke. This task is simple to set up, highly controllable in terms of compliance, movement frequency and amplitude, and is commonly used in standard rehabilitation protocols after a stroke. Although connectivity between cerebral regions is dynamic and changes with the context (Grefkes and Fink, 2011) and task specifications, the results reported in this study are in line with those observed in previous rs-fMRI studies. Thus, the FC of the ipsilesional PMC during PM may serve as an important cerebral biomarker, which may provide critical information about the residual motor function of not fully recovered stroke patients. The PMC is usually associated with the descending motor pathways (the corticospinal and the alternate rubro- and reticulospinal tracts) (Lindenberg et al., 2010). However, the enhanced corticocortical connections observed in our study are a reflection of cross-modal plasticity (Leung et al., 2015); a phenomenon observed after sensory loss (Merabet and Pascual-Leone, 2010) and which may also be beneficial after brain damage. In fact, in patients in whom the integrity of the S1M1 is compromised, increased recruitment of other nonmotor regions may be necessary to achieve a meaningful degree of motor recovery. These regions may also be targeted by innovative therapeutic interventions (Popa et al., 2013; Saimpont et al., 2016).
Limitations
The patient sample included a wide range of poststroke delays, stroke types, and lesion locations. Interindividual variability may contribute to the absence of significant results of the regression analyses on ME and MI conditions involving the AH. However, the results were not different when we ran the same analyses with patient subgroups (subcortical vs. cortical strokes), suggesting that our findings may be generalizable to a heterogeneous stroke patient population. Finally, we did not use a control group to confirm the specificity of the observed results. We can, however, assume that the observed hemispheric difference are not caused by handedness, for example, since on the 24 patients included 23 are right handed.
Conclusion
Among the different reorganization processes occurring after stroke, the role of the contralesional S1M1 is often debated. We highlight that processes relying on contralesional sensorimotor regions contribute less to a positive motor outcome of poorly recovered patients than those involving ipsilesional secondary motor areas (PMC and cerebellum) and nonmotor regions (Pcu and dlPFC). Altogether, these results provide support for the clinical significance of PMC cross-modal functional connections for motor recovery after stroke and give new insights on potential therapeutic leads for interventional studies.
Footnotes
Acknowledgments
We thank also the Inserm/UPS UMR1214 Technical Platform for their help in setting up and for the acquisitions of the MRI sequences and Alice Le Friec for English editing.
Authors' Contributions
M.T. was in charge of study concept and design, and experiment conduct; N.B. contributed toward experiment conduct, analysis and interpretation of the results, and preparation and writing of the article; I.L. did interpretation of the results, and helped in the preparation and writing of the article; P.M. was responsible for the concept and regulatory aspects of the study, and patients' recruitment; E.C.-L. performed the study design, patients' recruitment, experiment conduct, and helped in the interpretation of the results; D.G. helped with the patients' recruitment.
Author Disclosure Statement
No competing financial interests exist.
Funding Information
MIPAS study was supported by a grant from the “Fondation de l'Avenir” (trial n°ET2-669) and the local tender of the Toulouse University Hospital in 2012.