
Abstract
Introduction:
High variability between individuals (i.e., interindividual variability) in response to transcranial direct current stimulation (tDCS) has become a commonly reported issue in the tDCS literature in recent years. Inherent genetic differences between individuals have been proposed as a contributing factor to observed response variability. This study investigated whether tDCS interindividual variability was genetically mediated.
Methods:
A large sample size of 61 healthy males received cathodal tDCS (c-tDCS) and sham-tDCS of the primary motor cortex at 1 mA and 10 min via 6 × 4 cm active and 7 × 5 cm return electrodes. Corticospinal excitability (CSE) was assessed via 25 single-pulse transcranial magnetic stimulation motor-evoked potentials (MEPs). Intracortical inhibition was assessed via twenty-five 3 msec interstimulus interval (ISI) paired-pulse MEPs, known as short-interval intracortical inhibition (SICI). Intracortical facilitation (ICF) was assessed via twenty-five 10 msec ISI paired-pulse MEPs. Gene variants encoding for excitatory and inhibitory neuroreceptors were determined via saliva samples. Predetermined thresholds and statistical cluster analyses were used to subgroup individuals.
Results:
Two distinct subgroups were identified, “responders” reducing CSE following c-tDCS and “nonresponders” showing no reduction or even increase in CSE. Differences in CSE between responders and nonresponders following c-tDCS were not explained by changes in SICI or ICF.
Conclusions:
No significant relationships were reported between gene variants and interindividual variability to c-tDCS, suggesting that the chosen gene variants did not influence the activity of the neuroreceptors involved in eliciting changes in CSE in responders following c-tDCS. In this largest c-tDCS study of its kind, novel insights were reported into the contribution genetic factors may play in observed interindividual variability to c-tDCS.
Impact statement
This study adds insight into the issue of interindividual variability to c-tDCS. It highlights not all individuals respond to c-tDCS similarly when exposed to the same stimulus parameters. This disparity in response to c-tDCS between individuals does not appear to be genetically mediated. For c-tDCS to progress to large-scale clinical application, reliability, predictability and reproducibility are essential. Systematically investigating factors contributing to interindividual variability take steps towards this progress the c-tDCS field towards the potential development of screening tools to determine clinical suitability to c-tDCS to ensure its application in those who may benefit the most.
Introduction
Variation between individuals in the magnitude of change in corticospinal excitability (CSE) following transcranial direct current stimulation (tDCS) has become a prominent discussion point in the tDCS literature in recent years. Termed interindividual variability, it defines the dichotomous nature by which individuals respond to administered tDCS, with some individuals responding as expected and others not responding as expected (Horvath et al., 2014; Li et al., 2015; Pellegrini et al., 2018a, 2018b; Ridding and Ziemann, 2010). For the long-term potentiation (LTP)-like effects of excitatory anodal tDCS (a-tDCS) (Nitsche and Paulus, 2000; Nitsche et al., 2003, 2007), individuals displaying increases in overall CSE are categorized as “responders,” while those showing no increase or even reductions in CSE are categorized as “nonresponders.”
Conversely, the long-term depression (LTD)-like effects of inhibitory cathodal tDCS (c-tDCS) elicit reductions in overall CSE in “responders” and no reduction or even increases in “nonresponders.” A number of previous large-scale studies have investigated interindividual variability to a-tDCS (Bashir et al., 2019; Chew et al., 2015; López-Alonso et al., 2014, 2015; Puri et al., 2015, 2016; Strube et al., 2015, 2016; Tremblay et al., 2016; Wiethoff et al., 2014), however, only a small number have investigated the same phenomenon in c-tDCS.
To date, just three previously published studies have investigated interindividual variability in healthy young participants following c-tDCS, through which responders and nonresponders were identified (Labruna et al., 2016; Strube et al., 2016; Wiethoff et al., 2014). With similar study designs, including similar electrode montages and stimulus parameters, comparable responder and nonresponder rates were reported via two different subgrouping techniques between two of these previous studies (Strube et al., 2016; Wiethoff et al., 2014).
The dichotomous breakdown of the responses to c-tDCS was not reported by Labruna et al. (2016). Via statistical cluster analyses and whether or not an individual's post-DCS normalized grand average response was below 1 mV, approximately just 48% of healthy individuals responded to c-tDCS, at the commonly administered stimulus parameters, with reductions in CSE (Strube et al., 2016; Wiethoff et al., 2014). This being the case, there has not been thorough investigation into mechanisms behind why just 48% of individuals respond to c-tDCS as expected, and why 52% do not. This is of particular importance and relevance to the use of c-tDCS in the clinical setting where allocation of resources is crucial and predictability, reliability, and reproducibility of therapeutic effects are essential.
Previous investigations into mechanisms behind interindividual variability have focused on a number of factors. Technical factors specific to tDCS protocols and stimulus parameters such as adjusting the stimulus duration (Monte-Silva et al., 2013; Puri et al., 2015, 2016) or current intensity (Ammann et al., 2017; Batsikadze et al., 2013; Chew et al., 2015; Tremblay et al., 2016) have been investigated, as well as sensitivities to transcranial magnetic stimulation (TMS), the CSE assessment tool (Labruna et al., 2016). In addition to these, there has been a growing narrative in the tDCS literature that not all healthy young individuals who participate in studies respond to tDCS protocols in the same manner, with intrinsic differences between individuals potentially contributing that may otherwise go unnoticed and not included in the selection criteria.
Differences in intrinsic factors between healthy young individuals that have previously been investigated as contributing have included a series of anatomical, biological, and physiological factors. For comprehensive reviews on intrinsic factors contributing to interindividual variability, refer to Li et al. (2015), Pellegrini et al. (2018a), and Ridding and Ziemann (2010).
Variations in genes that encode for regulators of cortical plasticity are one factor that has previously been investigated. Variations in a gene that encodes for the nerve growth factor brain-derived neurotrophic factor (BDNF) and their effects on response to noninvasive brain stimulation (NIBS) and TMS measures of CSE and cortico-cortical excitability have been extensively investigated (Antal et al., 2010; Brunoni et al., 2013; Chhabra et al., 2016; Di Lazzaro et al., 2015; Frazer et al., 2016; Fujiyama et al., 2014; Hwang et al., 2015; Puri et al., 2015; Teo et al., 2014).
However, with lack of definitive conclusions on the role BDNF in LTP-like and LTD-like cortical plasticity, following NIBS protocols such as tDCS (Brunoni et al., 2013; Chhabra et al., 2016; Di Lazzaro et al., 2015; Fujiyama et al., 2014; Mastroeni et al., 2013) has encouraged investigations into gene variations of other regulators of cortical plasticity. The LTP-like mechanisms of a-tDCS led a recent large-scale study to investigate the role of genetic variations in the genes that encode for N-methyl-
This was on the background of previous reports that variations in the expression of genes encoding for NMDA receptors were associated with reduced intracortical inhibition (ICI) and enhanced intracortical facilitation (ICF) (Mori et al., 2011), while variations in the expression of genes encoding for GABA receptors were associated with a reduced capacity for ICI and an increased likelihood of excitotoxicity (Hung et al., 2013).
It was additionally on the background of the knowledge that cortical output is regulated by GABAergic neurons (Murakami et al., 2012; Nitsche et al., 2004, 2012), and a balance between NMDA receptor-mediated excitation and GABA receptor-mediated inhibition is required to maintain normal neuronal functioning (Rozov et al., 2017; Tatti et al., 2017). Therefore, when compared with normal expression, variations in the expression of either NMDA or GABA receptors resulting in an increased capacity for ICF and reduced capacity for ICI as described above may influence the responses to c-tDCS by reducing the likelihood of responding as expected with reductions in CSE. Novel large-scale investigations into genetic variations and their predictive value for c-tDCS interindividual variability are yet to be conducted in the tDCS literature.
The basis for investigating interindividual variability to c-tDCS lies in its potential use as an adjunct or alternative therapy to neurological conditions such as excitotoxicity associated with epilepsy and seizures, as well as psychological conditions such as anxiety disorders. A number of recent case reports and studies have reported improvements in seizure severity and frequency following trials of c-tDCS (Assenza et al., 2017; Lin et al., 2018; Tecchio et al., 2018; Tekturk et al., 2016; Yook et al., 2011; Zoghi et al., 2016) as well as fear response extinction in anxiety (Ganho-Ávila et al., 2019). With drug resistance a common problem in those who suffer seizures (Assenza et al., 2017; Tecchio et al., 2018), investigating adjunct noninvasive therapies such as c-tDCS is justified.
This highlights even further the need for reliable and predictive application of c-tDCS, with investigation into c-tDCS interindividual variability aimed at ultimately optimizing the number of responders and minimizing the number of nonresponders. By investigating potential intrinsic factors that may serve as predictive tools (i.e., genetic markers), the administration of c-tDCS may be allocated to those who will benefit the most. This theoretical framework, combined with previous reports that specific variations in genes that encode for the inhibitory GABA receptors were associated with drug resistance in epilepsy (Hung et al., 2013), highlights the need for investigation into the role of genetic variants in interindividual variability to c-tDCS.
This study therefore aimed to be the first of its kind to investigate the relationship between NMDA and GABA receptor gene variants and interindividual variability to c-tDCS. In a large sample size, this study also aimed to investigate the predictive value of the selected gene variants for response to c-tDCS. We hypothesized there would be an association and predictive capacity between the selected gene variants and c-tDCS response.
We hypothesized that normal expression of genes encoding for GABA receptors would be associated with reductions in CSE and categorization as c-tDCS responders, while variations in GABA receptor genes would be associated with increases in CSE and c-tDCS nonresponders.
We also hypothesized that normal expression of NMDA receptor genes would be associated with c-tDCS nonresponders, while variant expression would be associated with c-tDCS responder categorization. Changes in cortico-cortical excitability measures of ICI and ICF were also investigated and whether the relationship between c-tDCS response and ICI and ICF was different between responders and nonresponders. We hypothesized that individuals with reductions in CSE and subsequent categorization as c-tDCS responders would also report increases in ICI (i.e., reductions in short-interval intracortical inhibition [SICI]) and reductions in ICF following c-tDCS when compared with nonresponders.
Methods
Subjects
Monash University Human Research Ethics Committee granted approval of this study. Sixty-one healthy male volunteers provided written informed consent to attend two experimental sessions. Fifty-four subjects were right-handed and seven left-handed as determined by the Edinburgh handedness questionnaire (Oldfield, 1971). All subjects refrained from consuming caffeine at least 12 h before experimental testing (Chew et al., 2015; Fujiyama et al., 2017; Hermsen et al., 2016; Matamala et al., 2018; O'Leary et al., 2015) to minimize the confounding effects of caffeine (Cerqueira et al., 2006; Concerto et al., 2017).
Inclusion criteria
Participants were included in this study if they were healthy young males, age older than 18 years, and were able to speak, write, and read in English in accordance with the safety screening questionnaire for the use of the TMS device (Keel et al., 2001).
Exclusion criteria
Given the repeated measures study design, females were excluded to maximize homogeneity between experimental testing sessions to control for effect that fluctuating estrogen and progesterone hormones across the menstrual cycle may have on CSE, ICI, and ICF (Inghilleri et al., 2004; Smith et al., 2002; Zoghi et al., 2015). Previous studies have reported that the level of CSE is significantly different between the follicular and luteal phases of the menstrual cycle (Hattemer et al., 2007; Smith et al., 2002; Zoghi et al., 2015) and the levels of CSE are significantly different between males and females during the menstrual cycle early follicular phase (Inghilleri et al., 2004).
In addition, participants were also excluded if they reported a history of psychiatric or neurological illness, seizures, headaches or migraines, or any other exclusion criteria outlined in the safety screening questionnaire for the use of the TMS device (Keel et al., 2001).
Sample size
Sample size (with 80% power) was based on pilot data of 15 subjects (Pellegrini et al., 2020b). An effect size of 0.45 (α = 0.05) required sample sizes between 17 and 26 (Portney and Watkins, 2009). Sample size was adjusted to allow for responders and nonresponders. Previous literature report that the proportion of c-tDCS responders ranges from 40% to 55%, with average responder rates ∼47% (Strube et al., 2016; Wiethoff et al., 2014). To ensure the numbers of c-tDCS responders were between 17 and 26, sample size was adjusted to at least 57 (i.e., 26/0.47 = 57).
Study design
A repeated-measures randomized crossover design was utilized. Subjects attended two identical sessions in randomized order (c-tDCS or sham-tDCS). Sessions were conducted at similar times-of-day to reduce cortisol diurnal effects (Sale et al., 2007, 2008) and separated by at least a week ensuring no carryover effects (Nitsche et al., 2008).
Electromyography recording
Electromyography (EMG) was recorded for the dominant first dorsal interossei (FDI). Skin was abraded and cleaned to minimize skin impedance (Gilmore and Meyers, 1983). Pregelled self-adhesive bipolar Ag/AgCl disposable surface electrodes were used and placed over the FDI with 2 cm interelectrode distance and reference electrode over the ulna styloid process (Kendell et al., 2010). EMG signals were filtered, amplified (10–500 Hz × 1000), and sampled at 1000 Hz and collected via a laboratory analogue/digital interface (LabChart™ and PowerLab; ADInstruments).
Intrarater reliability for assessment of CSE
Single-assessor (M.P.) intrarater reliability for the assessment of CSE via TMS has been previously established (Pellegrini et al., 2018c). CSE, as measured by peak-to-peak amplitude of motor-evoked potentials (MEPs), was recorded in several TMS test intensities: 105%, 120%, 135%, 150%, and 165% of resting motor threshold (RMT). Significant interclass correlations ranging from 0.660 to 0.968 (p < 0.05) were reported both within-sessions and between-sessions for TMS test intensities 120–165% of RMT (Pellegrini et al., 2018c).
TMS procedure
Single- and paired-pulse stimuli were delivered to the dominant primary motor cortex (M1) by a 70 mm figure-of-eight TMS coil (Magstim Limited Company). Held over M1, the coil was oriented 45° to the midline and tangential to the scalp for posterior/anterior current flow (Rossini and Rossi, 1998) and repositioned to determine the cortical area eliciting the greatest FDI motor response. This hotspot was marked for consistent coil placement.
RMT was defined as the percentage of TMS device maximal stimulator output (MSO) required for MEP peak-to-peak amplitude >50 μV in 5/10 consecutive stimuli (Devanne et al., 2006). Test intensity was defined as the percentage of TMS MSO required to elicit an MEP peak-to-peak amplitude of ∼1 mV. The intensity was adjusted in 1–2% intervals until RMT and test intensity were determined (Rothwell et al., 1999). These were recalculated post-tDCS intervention for each session.
Outcome measures
To assess CSE, 25 MEPs at the test intensity with 6-sec intertrial interval (ITI) were recorded. Cortico-cortical excitability was assessed via TMS paired-pulse paradigms. A conditioning pulse at 80% RMT was followed by a pulse at the test intensity separated by 3 msec interstimulus interval (ISI) for SICI and 10 msec for ICF (Di Pino et al., 2014; Kujirai et al., 1993). Fifty paired-pulse MEPs (25 with 3 msec ISI, 25 with 10 msec ISI) were delivered with 6-sec ITI. Mean values were calculated for SICI and ICF, then expressed as a percentage of single-pulse MEPs, and were considered an index of M1 ICI and ICF (Di Pino et al., 2014; Kujirai et al., 1993).
Transcranial direct current stimulation
To maintain consistency with previous literature, tDCS was delivered at the common parameters of 1 mA current intensity (Labruna et al., 2016; Strube et al., 2016) and 10-min stimulus duration (Labruna et al., 2016; Strube et al., 2016; Wiethoff et al., 2014) with 30-sec fade-in/fade-out periods (NeuroConn DC-stimulator). These parameters were also chosen to minimize the effect adjusting the stimulus parameters may have on responses, as adjusting stimulus parameters has been previously reported to influence responses to c-tDCS (Batsikadze et al., 2013).
Two rectangular saline-soaked surface electrodes fixed to the scalp via Velcro straps delivered the tDCS. The active electrode (5 × 7 cm, 0.0417 mA/cm2) was placed over the contralateral supraorbital area and the return electrode (4 × 6 cm, 0.0286 mA/cm2) was placed over the dominant M1, focusing current under the anode and away from the cathode (Nitsche et al., 2007). For sham-tDCS, electrode placements were the same, with current increasing from 0 to 1 mA for a 30-sec fade-in period then reducing to 0 mA for the remaining 9.5 min. Participants were blinded to the intervention, with blinding integrity assessed by asking participants on the nature of both interventions at the conclusion of both sessions.
While considered a safe intervention (Nitsche et al., 2008), tDCS tolerability and side effects were assessed during and after tDCS was administered. Sensations of itching, tingling, or discomfort were monitored throughout the application of tDCS via participants being asked to rate the presence of sensations on a scale of 1–10 at the beginning and middle of tDCS application. The presence of headache or other sensory complaints following tDCS was also assessed on a scale of 1–10.
Genotyping procedure
Oragene-DNA self-collection kits (DNA Genotek) were used to obtain the saliva samples. Ten genetic single-nucleotide polymorphisms (SNPs) were chosen based on a previous similar study investigating the role of genetic polymorphisms in interindividual variability to tDCS (Pellegrini et al., 2020a).
The 10 SNPs were selected as they are involved in synaptic transmission. SNPs for the BDNF gene (Antal et al., 2010; Cheeran et al., 2008; Di Lazzaro et al., 2015; Frazer et al., 2016; Puri et al., 2015) and glutamate NMDA receptor genes GRIN1 (Lee et al., 2016; Mori et al., 2011; Rossi et al., 2013) and GRIN2B (Mori et al., 2011; Narita et al., 2018) were selected based on their involvement in excitatory glutamatergic cortical pathways. GABA receptor genes GABRA1, GABRA2, and GABRA3 (Hung et al., 2013) were selected for their involvement in inhibitory GABAergic cortical pathways (Table 1).
Selected Genes and Single-Nucleotide Polymorphisms
Summary of selected genes and SNPs with normal expression (common homozygous) and variant expression (heterozygous and rare homozygous) with accompanying sample sizes.
BDNF, brain-derived neurotrophic factor; GABA, gamma-aminobutyric acid; NMDA, N-methyl-
Genotyping was performed by the Australian Genome Research Facility (AGRF, St Lucia, Australia) once all data collection of all participants was completed to avoid assessor bias. Subjects classification was either “normal expression” (i.e., common homozygote) or “variant expression” (i.e., heterozygous or homozygous for the substituted nucleotide) for each of the selected gene SNPs.
Experimental procedure
The sessions (c-tDCS, sham-tDCS) were conducted in randomized order. Subjects sat relaxed in an adjustable chair with their hand at rest. RMT and test intensities were determined and then baseline measures were collected. One of the two tDCS interventions was then delivered and immediately followed by CSE, via single-pulse MEPs, outcome measure data collection at 0 min post-tDCS. RMT and test intensities were then reestablished for SICI and ICF data collection at 10 min post-tDCS. Single-pulse MEPs were collected at 30 min post-tDCS using the baseline intensity, while SICI and ICF were collected at 40 min post-tDCS using the adjusted intensity to investigate whether outcome measures had returned to baseline values (Bastani and Jaberzadeh, 2013a, 2013b). Saliva samples were collected at the conclusion of the second session.
Statistical analyses
Statistical analyses were conducted using SPSS (version 25.0).
Group-level analysis
Each outcome measure (CSE, SICI, ICF) was assessed for each intervention (c-tDCS, sham-tDCS) and time point (baseline, 0–10 min, 30–40 min). The Shapiro–Wilk test assessed data normality for each outcome measure. Nonparametric statistical tests were used if data violated normality.
Comparison of baseline values for each session assessed the effect of intervention on within-subject reliability to ensure no carryover effects between sessions (Portney and Watkins, 2009). Nonparametric Friedman's two-way analysis of variance was used to investigate the overall effect of time and intervention on CSE, SICI, and ICF data, which violated normality. Nonparametric Wilcoxon matched-paired test was then used post hoc where appropriate to investigate whether outcome measures at post-tDCS time points were significantly different from baseline values following both c-tDCS and sham-tDCS. Five percent significance level was used for all statistical tests (α = 0.05).
Subgroup-level analysis
Two subgrouping techniques were used to categorize subjects as defined and described in detail previously (Pellegrini et al., 2018b). First, subjects were categorized based on their post-tDCS responses exceeding a predetermined threshold or not. Normalized to baseline, MEP amplitudes at 0 min post-tDCS were compared with the predetermined threshold of standard deviation (SD) of sham-tDCS baseline values (Ammann et al., 2017).
This accounted for natural response variability in the current sample size as well as the inherent variability in measuring CSE via TMS-evoked MEPs. In the current study, using a grand average of all post-tDCS time points as previously conducted (Ammann et al., 2017; Chew et al., 2015; López-Alonso et al., 2014; Puri et al., 2015, 2016; Tremblay et al., 2016; Wiethoff et al., 2014) would not have provided an inaccurate representation of how each subject immediately responded to c-tDCS because MEP data collection at 30 min post-tDCS has been reported to return to baseline levels (Bastani and Jaberzadeh, 2013a, 2013b). Sham-tDCS baseline SD calculated at 0.324 therefore classified subjects as “responders” (post-c-tDCS normalized MEP [nMEP] <0.676) or “nonresponders” (post-c-tDCS nMEP >0.676).
The second subgrouping technique was the SPSS TwoStep cluster analysis. Based on normalized data, analysis of trends or patterns in the data highlights distinct subgroups of individuals (Hair et al., 1998; SPSS, 2001). Cluster predictors were normalized MEP amplitude at 0 min post-c-tDCS.
Nonparametric Mann–Whitney U test was conducted on MEP data to investigate significant differences between the two distinct subgroups identified (i.e., responders/non-responders and cluster1/cluster 2).
Subgroups were then analyzed separately to investigate the effect of time and intervention on SICI and ICF. Nonparametric Friedman and Wilcoxon matched-paired tests were used to investigate whether there were significant changes in SICI and ICF at post-tDCS time points compared with baseline following both c-tDCS and sham-tDCS for each subgroup. Nonparametric Mann–Whitney U tests were then conducted to determine significant differences between subgroups (i.e., responders vs. nonresponders or cluster 1 vs. cluster 2) at each time point.
Genotype analysis
Genotype results were analyzed against both subgroup categorization techniques for investigation of associations between gene expression and c-tDCS response categorization. This was to test whether gene expression had predictive capacity for c-tDCS response category.
Chi-squared tests analyzed each gene individually against subgroup category and cluster membership tested for associations/dependency between gene expression and c-tDCS response. Univariate binary logistical regression analysis then quantified the association (i.e., odds ratio [OR]) between each gene variant independently and subgroup category to assess the predictive value of each gene variant in isolation for c-tDCS response. Dependent variable was the subgroup category and each gene was the independent variable. Multivariate binary logistical regression analysis was then conducted as above to investigate associations and predictive value of each gene variant for c-tDCS response while controlling for all other gene variants.
Results
All 61 participants, aged 26.82 ± 7.62 years (mean ± SD), attended each session with mean (±SD) 13.58 ± 15.91 days between each session. Mean RMT and test intensity were 37% (36.55% ± 7.59%) and 46% (45.58% ± 9.88%) of the TMS MSO.
Tests for normality of data
Shapiro–Wilk tests for normality revealed single-pulse MEP (c-tDCS: p = 0.001; sham-tDCS: p = 0.05), SICI (c-tDCS: p < 0.001; sham-tDCS: p < 0.001), and ICF (c-tDCS: p = 0.035; sham-tDCS: p = 0.000) data violated normality.
Carryover effects
Friedman's test revealed no significant differences in baseline values between c-tDCS and sham-tDCS for single-pulse MEP (p = 0.370), SICI (p = 0.249) or ICF (p = 0.701) indicating no carryover effects between sessions.
Group-level analysis
Corticospinal excitability
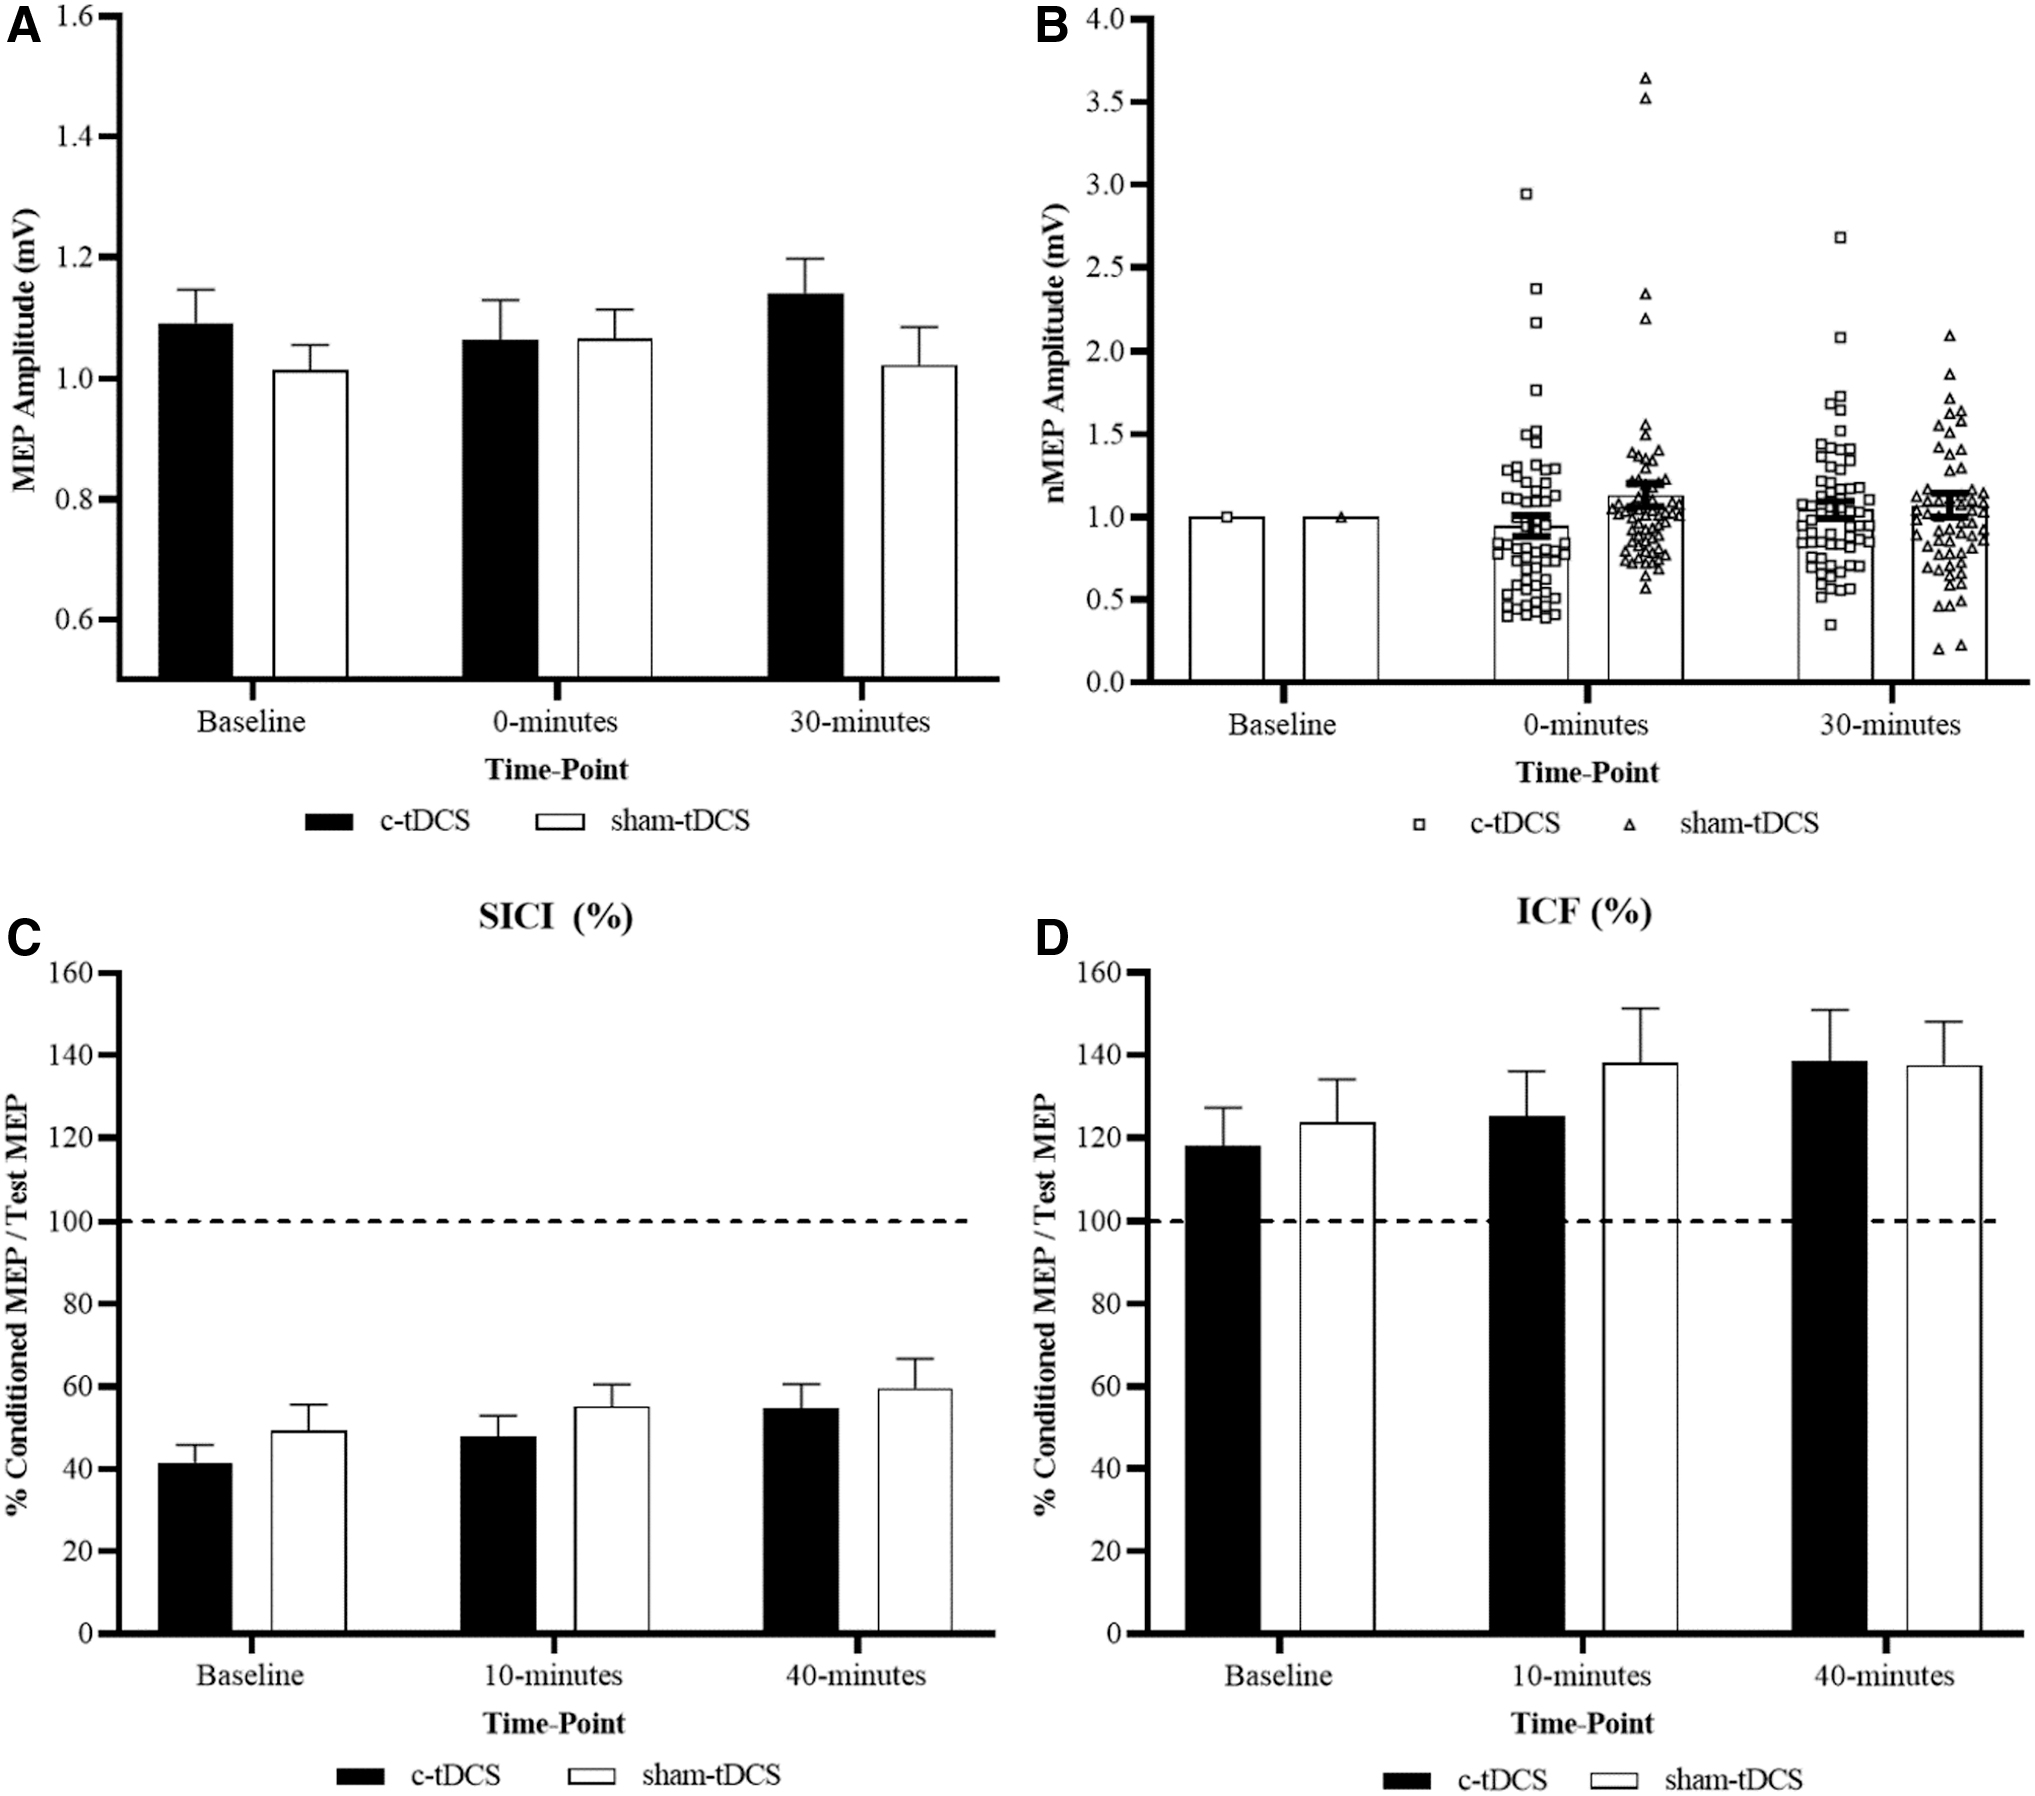
Nonparametric Friedman's test and post hoc Wilcoxon matched-paired test revealed no significant effect of time for c-tDCS (p = 0.069) and sham-tDCS (p = 0.218), but a significant effect of intervention with MEP amplitude significantly reduced at 0 min following c-tDCS compared with the same time point following sham-tDCS (p = 0.001). Differences in MEP between interventions at 30 min were not significantly different (p = 0.096) (Fig. 1A, B, and Table 2).
Group-level c-tDCS versus sham-tDCS for each time point.
Group-Level Corticospinal Excitability and Cortico-Cortical Excitability
Mean (±SD) MEP peak-to-peak amplitude (mV), SICI (%), and ICF (%) data for each intervention and time point. Post-tDCS time point 1 is 0 min for MEP and 10 min for SICI and ICF. Post-tDCS time point 2 is 30 min for MEP and 40 min for SICI and ICF.
Denotes significant difference in MEP amplitude between interventions at a particular time point (p < 0.01).
c-tDCS, cathodal transcranial direct current stimulation; ICF, intracortical facilitation; MEP, motor-evoked potential; SD, standard deviation; SICI, short-interval intracortical inhibition; tDCS, transcranial direct current stimulation.
Cortico-cortical excitability
Nonparametric Friedman's test and post hoc Wilcoxon matched-paired test revealed no significant effect of time or intervention for SICI (c-tDCS: p = 0.894; sham-tDCS: p = 0.051) and ICF (c-tDCS: p = 0.502; sham-tDCS: p = 0.642) (Fig. 1C, D, and Table 2).
Individual-level analysis
Subgrouping based on a predetermined threshold
Subgrouping based on normalized responses at 0 min post-c-tDCS with a 32.4% threshold revealed two different subgroups. Following c-tDCS, 30% (n = 18) of subjects responded with reductions in MEP that exceeded the predetermined threshold of 0.324 and were subsequently categorized as “responders” (nMEP <0.676 at 0 min post-c-tDCS), while 70% (n = 43) responded with no reductions or even increases in MEP and were categorized as “nonresponders” (nMEP >0.676 at 0 min post-c-tDCS) (Fig. 2C).

Subgrouping based on predetermined threshold. Responders versus nonresponders before and after c-tDCS at each time point.
Corticospinal excitability
Mann–Whitney U tests revealed that MEP amplitudes were significantly different between responder and nonresponder subgroups for c-tDCS at baseline (p = 0.048) and 0 min post-tDCS (p = 0.000), but not at 30 min post-tDCS (p = 1.000). No differences between responders and nonresponders for sham-tDCS were reported (Baseline: p = 0.058; 0 min: p = 0.457; 30 min: p = 0.088). In addition, for responders, MEP values did not differ between c-tDCS and sham-tDCS interventions at baseline (p = 1.000) or 30 min post-tDCS (p = 1.000) but were significantly different at 0 min post-tDCS (p = 0.000). For nonresponders, MEPs were not significantly different between interventions at baseline (p = 0.286) or 0 min post-tDCS (p = 0.170) but were at 30 min post-tDCS (p = 0.047) (Fig. 2A–C and Table 3).
Corticospinal Excitability for Responders/Nonresponders and Cluster 1/Cluster 2 Subgroups
Mean (±SD) MEP peak-to-peak amplitude (mV) for both interventions and time point.
Denotes significant difference within a subgroup MEP amplitude at a time point compared with baseline (p < 0.05).
Denotes significant difference in MEP amplitude at a particular time point between responder and nonresponder subgroups as well as between cluster 1 and cluster 2 subgroups (p < 0.05).
Denotes significant difference between tDCS interventions for a particular subgroup (p < 0.05).
Cortico-cortical excitability
For SICI, in the responder subgroup, nonparametric Friedman's test revealed a significant effect of time for c-tDCS (p = 0.029), with post hoc Wilcoxon matched-paired tests revealing significant increases in SICI values, indicating significant reductions in ICI at 40 min following c-tDCS compared with baseline (p = 0.010). No significant differences were reported between interventions for the responder subgroup (Baseline: p = 0.059; 0 min: p = 0.157; 40 min: p = 0.637).
For sham-tDCS, no significant effect of time was reported for both responder (p = 0.311) and nonresponder subgroups (p = 0.159). The Mann–Whitney U test revealed no significant differences between subgroups at all time points for both c-tDCS (Baseline: p = 0.327; 0 min: p = 0.457; 40 min: p = 0.740) and sham-tDCS (Baseline: p = 0.912; 0 min: p = 0.912; 40 min: p = 0.975) (Fig. 2D and Table 4).
Cortico-Cortical Excitability for Responder and Nonresponder Subgroups
Mean (±SD) SICI and ICF data for each intervention and time point.
Denotes significant difference within a subgroup at a time point compared with baseline (p < 0.05).
Denotes significant difference at a particular time point between responder and nonresponder subgroups (p < 0.05).
For ICF, in the responder subgroup, a significant effect of time for c-tDCS was reported (p = 0.004), with post hoc Wilcoxon matched-paired tests revealing significant increases in ICF at 40 min following c-tDCS compared with baseline (p = 0.001), while no significant differences were reported between interventions for the responder subgroup (Baseline: p = 0.346; 0 min: p = 0.157; 40 min: p = 0.346). For sham-tDCS, no significant effect of time was reported for both subgroups (Responders: p = 0.486; Nonresponders: p = 0.486). The Mann–Whitney U test revealed no significant differences between responder and nonresponder subgroups at baseline (c-tDCS: p = 0.001; sham-tDCS: 0.008), but not at 0 min (c-tDCS: p = 0.064; sham-tDCS: p = 0.304) and 40 min (c-tDCS: p = 0.125; sham-tDCS: p = 0.200) post-tDCS (Fig. 2E and Table 4).
Two-step cluster analysis
Subgrouping based on SPSS statistical cluster analysis revealed two distinct subgroups. Cluster 1 comprised 74% (n = 45) of subjects who responded with an overall average reduction in MEP. Cluster 2 comprised 26% (n = 16) of subjects who responded with either no reduction or overall increase in MEP (Fig. 3C).

Subgrouping based on cluster analysis. Cluster 1 (responders) versus cluster 2 (nonresponders) before and after c-tDCS at each time point.
Corticospinal excitability
For c-tDCS, Mann–Whitney U tests reported no significant differences in MEP amplitude between cluster 1 and cluster 2 subgroups at baseline (p = 0.055) and 30 min post-tDCS (p = 0.265), but revealed that MEP amplitude was significantly greater in cluster 2 at 0 min following c-tDCS compared with cluster 1 (p = 0.000).
Significant differences were reported between subgroups for sham-tDCS at baseline (p = 0.045), but not for 0 min (p = 0.831) and 30 min post-tDCS (p = 0.451). For cluster 1, no significant differences in MEP amplitude were reported between c-tDCS and sham-tDCS at baseline (p = 0.655) and 30 min (p = 0.456), but were reported at 0 min post-tDCS (p = 0.000). For cluster 2, significant differences were reported between c-tDCS and sham-tDCS at 30 min (p = 0.046), but not at baseline (p = 0.317) or 0 min (p = 0.617) post-tDCS (Fig. 3A–C and Table 3).
Cortico-cortical excitability
For SICI, in the cluster 1 subgroup, Friedman's test and post hoc Wilcoxon matched-paired tests revealed significant increases in SICI values at 10 min (p = 0.008) and 40 min (p = 0.001) following c-tDCS when compared with baseline, indicating significant reductions in ICI. Similarly for sham-tDCS, significant increases were reported at 10 min (p = 0.008) and 40 min (p = 0.000) compared with baseline. For the cluster 2 subgroup, nonparametric Friedman's test revealed no significant effect of time following c-tDCS (p = 0.829) or sham-tDCS (p = 0.646). For clusters 1 and 2, no significant differences were reported between c-tDCS and sham-tDCS interventions at baseline (Cluster 1: p = 0.297; Cluster 2: p = 0.617), 0 min (Cluster 1: p = 0.297; Cluster 2: p = 1.000), and 40 min (p = 0.180; Cluster 2: p = 0.317).
Mann–Whitney U tests revealed no significant differences in SICI between cluster subgroups at all time points for both c-tDCS (Baseline: p = 0.385; 0 min: p = 0.793; 40 min: p = 0.342) and sham-tDCS (Baseline: p = 0.77; 0 min: p = 0.961; 40 min: p = 0.844) (Fig. 3D and Table 5).
Cortico-Cortical Excitability for Cluster 1 and Cluster 2 Subgroups
Mean (±SD) SICI and ICF data for each intervention and time point.
Denotes significant difference within a subgroup at a time point compared with baseline (p < 0.05).
Denotes significant difference between tDCS interventions for a particular subgroup at a particular time point (p < 0.05).
For ICF, in the cluster 1 subgroup, Friedman's test and post hoc Wilcoxon matched-paired tests reported no significant changes in ICF at 10 min following c-tDCS compared with baseline (p = 0.276) but revealed significant increases at 40 min following c-tDCS (p = 0.001). For the cluster 2 subgroup, nonparametric Friedman's test revealed no significant effect of time following c-tDCS (p = 0.829) or sham-tDCS (p = 0.779).
No differences were reported between interventions at each time point for both cluster 1 (Baseline: p = 0.180; 0 min: p = 0.101; 40 min: p = 0.456) and 2 (Baseline: p = 0.134; 0 min: p = 0.617; 40 min: p = 0.617) subgroups. Mann–Whitney U tests revealed that ICF values were significantly greater at c-tDCS baseline in the cluster 2 subgroup compared with cluster 1 (p = 0.007). No other significant differences were reported between cluster subgroups for c-tDCS (0 min: p = 0.179; 40 min: p = 0.743), or at all sham-tDCS time points (Baseline: p = 0.461; 0 min: p = 0.441; 40 min: p = 0.394) (Fig. 3E and Table 5).
Genotype analysis
Association/dependency between gene expression and interindividual variability
Genotyping of this cohort of subjects (n = 61) revealed that three of the gene SNPs (i.e., GRIN2B rs1805247, GABRA1 rs6883877, and GABRA2 rs511310) had disproportionate sample sizes in each dichotomous subgroup (i.e., “normal expression” and “variant expression”) to carry out comparative analysis and were therefore excluded from statistical analysis. Refer to Table 1 for subgroup sample sizes.
Chi-squared analysis on the remaining seven gene SNPs revealed no significant associations between subgroup category based on predetermined threshold or cluster analysis and genotype subgroup indicating dependency between expression of the selected genes and responder/nonresponder or cluster 1/cluster 2 subgroups (Table 6).
Odds Ratio and Logistical Regression Analysis Results Comparing Each of the Selected Gene Single-Nucleotide Polymorphisms with Both Responder/Nonresponder and Cluster 1/Cluster 2 Subgroups
Univariate logistic regression analysis and OR calculation revealed no significant predictive value for each of the selected gene SNPs when analyzed in isolation for either subgroup categorization based on predetermined threshold (i.e., responder/nonresponders) or cluster membership. Refer to Table 6 for OR and significance values for each of the selected SNPs in isolation.
When all of the selected SNPs were controlled and accounted for, multivariate logistic regression analysis with OR calculation again revealed no significant predictive value of each of the selected SNPs for response subgroup categorization (Table 6). It is worth noting, however, that subjects with GABRA3 gene SNP rs1112122 “normal expression” were five times (OR = 4.746) more likely to be categorized as a c-tDCS responder based on a predetermined threshold compared with subjects with “normal expression,” with “variant expression” subjects less likely (OR = 0.211) to be categorized as c-tDCS responders. These results were approaching significance (p = 0.099). Therefore, when each of the selected gene SNPs were controlled and accounted for, no significant associations suggest any predictive value for subgroup response category (Table 6).
Discussion
This study investigated response variability to c-tDCS and the role genetic variations played in the observed interindividual variability. We hypothesized that variations in genes encoding for excitatory NMDA and inhibitory GABA receptors would influence observed interindividual variability to-tDCS. Two distinct subgroups of individuals were determined via two different subgrouping techniques. Both techniques yielded a group of individuals who responded as expected with reductions in CSE (i.e., responders) and another group who responded with no reduction or even increases in CSE (i.e., nonresponders). Changes in both ICI and ICF were reported in both responder and nonresponder subgroups. No significant relationships, however, were identified between c-tDCS response and the expression of both NMDA and GABA receptor genes.
Group- and subgroup-level analysis
A sample size of 61, to our knowledge, is the largest in the tDCS literature that investigates c-tDCS interindividual variability. Consistent with previous large-scale c-tDCS studies (Strube et al., 2016; Wiethoff et al., 2014), no overall effects were reported in the entire cohort, but distinct subgroups were reported. Building upon the results from previous studies investigating interindividual variability to c-tDCS, the subgrouping criteria implemented in the current study aimed to take into account the natural variation that may occur when assessing CSE via TMS-evoked MEPs by setting the response threshold as the SD of the baseline sham-tDCS condition (Ammann et al., 2017). The resultant c-tDCS responder rate of 30% is considerably lower than the 53% (Strube et al., 2016) and 41% (Wiethoff et al., 2014) as previously reported.
The discrepancy between our current results and previous studies may be a reflection of the more strict and controlled subgrouping threshold specific to our current cohort of individuals. The individual data points normalized to baseline in Figure 2B provide a visual representation of the spread of responses between the 61 participants, with a considerable number of individuals responding to c-tDCS with reductions in CSE that did not exceed our predetermined threshold of 32.4%.
Having a more generalized subgrouping criteria of whether an individual increases or decreased CSE, that being whether their post-c-tDCS normalized responses were greater than or less than 1 mV (Strube et al., 2016; Wiethoff et al., 2014), would have yielded a higher percentage of responders in the current study, but may not have been a true reflection of responses to c-tDCS when inherent variability in the assessment tool is not considered.
Subgrouping individuals via statistical cluster analyses did not support the findings when subgrouping individuals based on a predetermined threshold. In comparison with the 30% of individuals who responded to c-tDCS with reductions in CSE that exceeded the predetermined threshold, 74% of the individuals were categorized into a cluster group that reported overall reductions in CSE (Fig. 3B). This percentage is considerably greater than that reported in previous studies of 51% (Strube et al., 2016) and 47% (Wiethoff et al., 2014).
Reasons for this discrepancy with not only previous literature but also with the other utilized subgrouping techniques may again lie in the spread of the normalized data between all 61 individuals. Working on a similar concept, statistical cluster analyses scan the data for trends, patterns, and thresholds that may divide the data into distinct groups or clusters (Hair et al., 1998; SPSS, 2001). A large proportion of the participating individuals responded with small-magnitude changes in CSE, as displayed by the large grouping of responses around 1 mV at 0 min following c-tDCS (Fig. 3B).
Given cluster analyses divide data into clusters with no previous information regarding the expected responses, in the current data set, the cluster analysis prioritized those individuals who had large responses in the opposite direction to expected (i.e., large increases in CSE) and were therefore considered a distinct cluster. While the two selected subgrouping techniques did not report subgroups of similar sample sizes with similar magnitude changes in CSE, the wide-ranging magnitudes of responses add further weight to the presence of interindividual variability to c-tDCS and highlight a need for investigating factors, which may contribute.
One such investigation involved reporting whether or not the observed changes in CSE and the differences between the dichotomous subgroups of responders and nonresponders could, in part, be explained by measures of cortico-cortical excitability.
To our knowledge, this was the first study of its kind to investigate interindividual variability to c-tDCS and also compare changes in cortico-cortical excitability measures ICI and ICF in responder and nonresponder subgroups. No overall changes were reported in both ICI, as measured by SICI, and ICF following c-tDCS (Fig. 1C, D, and Table 2). When subgrouped into responders and nonresponders, significant changes were reported in both SICI and ICF at 40 min following c-tDCS in the responder subgroup with a trend toward facilitation, that being increased ICF and reduced ICI as indicated by increases in SICI values (Figs. 2C, 2D, 3C, 3D, and Tables 4 and 5).
This trend toward facilitation in the responder subgroup at 40 min post-c-tDCS may provide an explanation for the increases in CSE returning toward baseline at the second post-tDCS time point at 30 min (Fig. 2A, B, and Table 3). At 0 min following c-tDCS, however, small nonsignificant increases in both SICI and ICF were reported for the responder subgroup that were not significantly different from the nonresponder subgroup (Fig. 2C, D and Table 4). While not significant, these small increases in both SICI and ICF indicate an increase in ICF and reduction in ICI, which are opposite to the hypothesized expected changes of reductions in ICF and increases in ICI following c-tDCS.
These results therefore do not provide an explanation for the differences in CSE between the two subgroups at the 0 min following c-tDCS.
Despite this, these results appear consistent with previously published studies investigating changes in cortico-cortical excitability following c-tDCS. Recent studies have reported no changes in SICI (Di Lazzaro et al., 2012; Sasaki et al., 2016) and ICF (Di Lazzaro et al., 2012; Vaseghi et al., 2016) following standard protocols of c-tDCS.
The results of the current study regarding cortico-cortical excitability may therefore suggest that inhibitory circuits, other than GABA-A receptor-specific GABAergic circuits, which is measured via SICI, may explain the discrepancies in CSE between responders and nonresponders following c-tDCS. With the balance between ICI and ICF ultimately determining the cortical output and magnitude of CSE (Tatti et al., 2017), it may be that the immediate large inhibitory effect of c-tDCS in the responder subgroup is mediated by inhibitory circuits other than GABA-A receptors.
There is therefore an opportunity to investigate other cortico-cortical excitability mechanisms to explain discrepancies in CSE between responders and nonresponders immediately following c-tDCS. These may include investigating changes in long-interval intracortical inhibition (McDonnell et al., 2006), cortical silent period (McDonnell et al., 2006; Poston et al., 2012; Wu et al., 2011), both measures of GABAergic inhibitory circuits involving GABA-B receptors, as well as short-interval afferent inhibition, a measurement of cholinergic circuitries that has been previously associated with changes in CSE following c-tDCS (Sasaki et al., 2016).
To our knowledge, exploring other inhibitory circuits in c-tDCS responder and nonresponders subgroups is yet to be conducted and future studies investigating these different inhibitory circuitries may generate deeper insights into explanations behind interindividual variability to c-tDCS.
Genetic analysis
In conjunction with a previously published study (Pellegrini et al., 2020a), this study is the first and largest of its kind to investigate interindividual variability to c-tDCS and the involvement of specific variants in genes that encode for key regulators along excitatory and inhibitory cortical pathways. The novel findings that when all genetic variants were accounted for, a trending toward significance association exists between a GABRA3 gene variant, and c-tDCS nonresponder categorization suggests a potential relationship between GABRA3 gene variants and reduced capacity for ICI and c-tDCS nonresponder categorization. A potential relationship that warrants further large-scale investigation.
With no previous studies in the tDCS literature investigating variants in genes that encode for GABA receptors, looking to epilepsy and seizure literature for the influence of genetic variations may offer insight into the role genetic variations play in cortico-cortical excitability and CSE changes following c-tDCS. This is particularly important for potential future application of c-tDCS, known to historically induce inhibition, in neurological excitotoxic conditions such as epilepsy and seizures. Drug resistance is considered common in epilepsy (Abou El Ella et al., 2018; Assenza et al., 2017; Hung et al., 2013; Naimo et al., 2019; Tecchio et al., 2018). Links between drug resistance and particular gene variants (Baghel et al., 2016; Hung et al., 2013) offer insight into the role gene variants play in the activity of inhibitory cortical pathways.
Specific to the selected gene variants in the current study, variants in the GABRA3 gene, responsible for encoding GABA-A receptors, have been associated with antiepileptic drug resistance in epilepsy (Hung et al., 2013). Gene variants associated with resistance to drugs that aim to reduce cortical excitation suggest that the resultant GABA receptor activity and overall GABAergic inhibitory regulation of cortical excitability may be impacted.
In the current study, an association approaching significance, that being those with GABRA3 gene variants less likely to respond to c-tDCS as expected with reductions in CSE, suggests a potentially reduced capacity for GABAergic inhibitory regulation in individuals categorized as c-tDCS nonresponders. This potential relationship is consistent with recently published results suggesting a link between variants in genes that encode for GABA receptors and an increased likelihood of responding to excitatory a-tDCS with increases in CSE (Pellegrini et al., 2020a).
It is important to acknowledge that the current research findings regarding responder/nonresponder rates and their relationship to GABA receptor gene polymorphisms in healthy populations may not be generalizable to neurological conditions such as epilepsy and seizures. To our knowledge, responder/nonresponder rates following c-tDCS in individuals with epilepsy have not been conducted. Future studies investigating this may offer novel insight into the efficacy of utilizing c-tDCS in individuals with epilepsy or those who suffer seizures.
These novel preliminary suggestions of potential predictive value of genetic variants to tDCS interindividual variability should become a focus of future large-scale research. Larger sample sizes should be recruited to facilitate analysis of the interactions between a number of gene variants and subsequent responses to tDCS. This is with the ultimate aim to identify a predictive genetic marker or series of genetic markers to detect likely tDCS responders that may be developed into a point-of-care screening tool for suitability to tDCS in the clinical setting.
Limitations
In an attempt to minimize potential sources of interindividual variability, the cohort of participants recruited was strictly specified as health young males. These attempts, however, do restrict the capacity to extrapolate our findings to the wider community that includes females, as well as older and neurological or psychological conditions that include epilepsy or seizures.
In additional attempts to report findings that were relatable to similar previously published studies, conventional electrode montages were utilized with common stimulus parameters. It is therefore unclear whether our current results can be extrapolated to other forms of tDCS such as high-definition tDCS, or whether similar responder/nonresponder rates would apply if tDCS was administered with different stimulus parameters.
Lastly, the outcome measures for this study focused on cortico-cortical and corticospinal measures, and therefore, the current results do not offer insight into the effect of c-tDCS on motor behavioral tasks, whether there is a difference in motor performance between responders and nonresponders and whether any differences are genetically mediated. These listed limitations offer suggestions for future research into interindividual variability to c-tDCS.
Future directions
No relationships were reported between interindividual variability to c-tDCS and genetic variations in the selected SNPs. While an association between the GABRA3 gene SNP rs1112122 was approaching significance (p = 0.099), suggesting that those individuals with a variation in this GABA receptor gene may be more likely to be c-tDCS nonresponders, a nonsignificant association meant at this stage that there was no relationship between specific genetic variations and response to c-tDCS.
This highlights the opportunity for future research to investigate this potential relationship further to determine whether the c-tDCS response categorization is genetically mediated. To achieve this, continuing the trend from the current study and recently published study (Pellegrini et al., 2020a), future studies should aim to recruit even larger sample sizes such that higher powered analysis can be conducted on larger genetic subgroups, and such that investigation into the interaction between a number of selected gene variants can be conducted.
For example, while acknowledging an even larger sample size bears a large administrative burden, larger sample sizes will allow individuals to be subgrouped based on the presence or absence of multiple GABA receptor gene variants at once, or the presence of GABA receptor gene variants paired with the absence of excitatory NMDA receptor gene variants. This may provide insight into combinations of inherent genetic expressions that increase the likelihood of responding to c-tDCS as expected that may form the basis of a genetic screening and predictive tool for suitability to c-tDCS as an intervention in the clinical setting.
Furthermore, future studies investigating the role genetic expression has on c-tDCS responses and interindividual variability should aim to investigate the role of gene variants in other key regulators of cortical plasticity as well as on differing cohort demographics. As discussed above, with changes in SICI and ICF offering no insight into the observed differences in CSE between responders and nonresponders following c-tDCS, gene variants that encode for GABAergic and inhibitory cortical circuits other than GABA-A-specific circuits should be investigated.
This may provide additional insight and contribute to greater knowledge of the genetic component of cortical plasticity following c-tDCS and the differences between individuals who respond as expected and those who do not. Addressing the abovementioned limitations by extending these future studies of other genetic variants into all populations such as females, older adults, and neurological and psychological conditions, particularly those prone to increased cortical excitability or excitotoxicity, should also form the basis of future research.
In particular, future studies investigating the effect of genetic polymorphisms on interindividual variability to c-tDCS in females should aim to minimize the influence that estrogen and progesterone hormone fluctuation has on changes in CSE by conducting each experimental testing session during the same phase of the menstrual cycle.
In addition, by not identifying genetic polymorphisms associated with responses to c-tDCS or reporting significant changes in cortico-cortical excitability in c-tDCS responders, as measured by TMS, opportunities to investigate other potential sources of interindividual variability are available. Recent studies have utilized magnetic resonance imaging and spectroscopy to investigate individual differences in cortical morphology and neurotransmitter concentrations (Filmer et al., 2020). Associations were reported between an individual's performance in behavioral tasks following c-tDCS and cortical morphology of prefrontal cortical regions, as well as the localized balance between glutamate and GABA neurotransmitters (Filmer et al., 2020).
With a growing number of studies previously reporting differences in skull thickness and cortical morphology as potential sources of interindividual variability between individuals (Bikson et al., 2012; Datta et al., 2009; Miranda et al., 2013; Opitz et al., 2015), future investigation into potential M1 anatomical and localized neurochemical differences between individuals may offer novel insight into factors contributing to the categorization of individuals as responders and nonresponders following c-tDCS, as well as an additional means of investigating changes in ICI and ICF following c-tDCS.
With future clinical application for c-tDCS in mind, comparisons between healthy and clinical populations across these potential sources of interindividual variability will contribute to the progression of c-tDCS in the clinical setting.
Independent of genetic polymorphisms, future large-scale studies investigating interindividual variability following c-tDCS should carefully consider the importance of the recruited sample size. The findings of the current study reported an overall small effect size nonsignificant change in CSE following c-tDCS in a large sample size (n = 61). While this encompassed both individuals responding as expected with reductions in CSE and individuals responding with no changes in CSE or changes in the opposite direction, the effect size of the responder subgroup is expected to be larger than the overall cohort. Using sample size calculation charts, expecting the c-tDCS responder group to have at least a moderate effect size of 0.5, with 1 degree of freedom and at 80% power, detecting significant changes in CSE following c-tDCS in the responder subgroup requires at least 17 participants (Portney and Watkins, 2009).
With the current study reporting a c-tDCS responder rate of ∼30%, a sample size of at least 57 individuals is required to account for the 70% nonresponder rates (i.e., 17/0.3 = 57). While again acknowledging the administrative burden of recruiting large sample sizes, if an aim of future research is to subgroup the cohort into responders and nonresponders, this large sample size will facilitate sufficient subgrouping to ensure adequate subgroup sample sizes for meaningful comparisons and investigation into factors contributing to interindividual variability following c-tDCS.
On a more general note, future studies on interindividual variability to tDCS should continue on from the growing trend that not all individuals who participate in tDCS are the same. When investigating specific intrinsic factors that may contribute to interindividual variability, it is crucial that all other potential confounding factors such as age range, medication use, caffeine consumption, and attentional focus are kept as consistent as possible between individuals such that one specific factor may be isolated to investigate its involvement in interindividual variability. Future studies should therefore utilize the recently developed checklist (Pellegrini et al., 2020c) to ensure that thorough methodological measures are taken to ensure interindividual variability is minimized.
Conclusions and Implications
The significance of the current study is it provides additional insight into the issue of interindividual variability to c-tDCS. It highlights that not all individuals will respond to c-tDCS in the same manner and therefore may not undergo cortical plasticity to the same extent when exposed to the same stimulus parameters. While trending toward significance for one specific gene variant, the disparity in response between individuals did not appear to be genetically mediated. Implications of this variability in response for future studies are important when considering the clinical setting, particularly where reductions in cortical excitability and CSE are desired such as in excitotoxic neurological conditions such as epilepsy and seizures.
For tDCS to be administered in the clinical setting in a large-scale manner, it must be a reliable, predictable, and reproducible intervention. Studies such as the current study that systematically investigate one potential intrinsic factor and its role in resultant interindividual variability are important steps forward for the development of a screening tool to determine those appropriate for c-tDCS interventions and who may benefit the most. Identifying gene variants or combinations of gene variants that may serve as a screening tool will assist in understanding which individuals will respond as expected to standard c-tDCS protocols and which individuals will not. This may inform the specific c-tDCS parameters to utilize for optimal delivery to all individuals to ensure that the number of c-tDCS responders is maximized.
Footnotes
Authors' Contributions
Conceived and designed the study: M.P., S.J., and M.Z.; carried out data collection: M.P.; conducted statistical analysis: M.P.; interpreted the findings: M.P., S.J., and M.Z.; wrote the article: M.P.; writing and editing of drafts: M.P., S.J., and M.Z.
Author Disclosure Statement
No conflict of interest to the outcomes of the current study.
Funding Information
This research received a small donation of $3,000 from Sonoray Pty Ltd. and MagVenture, Inc.