




Abstract
Background:
Mentally simulating counterfactuals (scenarios that have not actually occurred) is a sophisticated human cognitive function underlying creativity, planning, and daydreaming. One example is the “would you rather” game, in which forced choices are made between outlandish negative counterfactuals.
Materials and Methods:
We measured behavioral and neural correlates while participants made “would you rather” choices framed as approaching or avoiding aversive counterfactual scenarios (e.g., illnesses, car accidents).
Results:
We found in two independent cohorts that participants were highly susceptible to framing effects when making these decisions, taking significantly longer to respond to approach frames compared with avoidance. Brain imaging showed that choices to approach and avoid resulted in a pattern of activation consistent with a network associated with responding to aversive stimuli, identified via a coordinate-based meta-analysis of 238 studies. Bayesian graph connectivity analysis showed that network connectivity differed by choice frame, with significantly stronger connectivity for approach choices compared with avoidance choices among primarily limbic nodes (putamen, insula, caudate, and amygdala). Computational modeling of behavior revealed that approach frames led to significantly longer nondecision times, increased evidence required to make decisions, and faster evidence accumulation than avoidance frames. Stronger network connectivity between corticostriatal and limbic regions was associated with rate of evidence accumulation and length of nondecision time during approach choices. For avoidance choices, prefrontal connectivity was related to nondecision time.
Conclusions:
These results suggest that “would you rather” decisions about aversive counterfactuals differentially recruit limbic circuit connectivity based on choice frame.
Impact statement
We measured brain connectivity and latent cognitive variables underlying aversive counterfactual choices. We found a replicable reaction time effect whereby approach decisions were slower than avoidance decisions. Computational modeling identified that the latent cognitive variable of evidence accumulation was related to strength of connectivity between corticostriatal and limbic nodes during approach decisions. Multidimensional scaling (MDS) and clustering revealed a three-dimensional choice structure that differed between individuals, and between approach and avoidance choices within individuals. Our results suggest that cognitive evaluations of aversive counterfactuals involve flexible representations that can be altered by choice framing. These findings have broad implications for prospective decision making.
Introduction
When we accept a job, start a family, or write a will we typically rely on our mental simulation of the potential positive and negative outcomes involved in those actions. Imagining counterfactual scenarios is a sophisticated, multipurpose cognitive function underlying creativity, planning, and daydreaming (Barbey et al., 2009). However, there is limited knowledge about the contextual factors that may shape these simulations, or the brain processes underlying them.
Decades of research have shown that an emphasis on positive or negative outcomes during decision making (even when actual outcome probabilities are held constant) produces what is known as a framing effect (see Gallagher and Updegraff, 2012; Kuhberger, 1998, for review). Much of the work on the framing effect comes from studies in which a single option is provided. For example, the subject might be asked to choose a procedure knowing that 75% of people survive versus one in which it is known that 25% of people die (e.g., Tversky and Kahneman, 1981, 1986). But, in everyday life, decisions often involve two or more options (e.g., “take a new job” vs. “stay and try for promotion”), choices that may be influenced by a range of individual differences (e.g., personality, past experience). It remains unclear whether framing can influence counterfactual simulations that involve choices between options where the relative value of each option is based on individual likes and dislikes, rather than interpretation of numerical probabilities.
Identifying the computations underlying counterfactual decision making can provide a window into the neural and cognitive processing involved in reasoning and decision making more broadly (Epstude and Roese, 2008; Van Hoeck et al., 2015). Our approach was to adapt the popular “would you rather” game into an experimental protocol. “Would you rather” involves a questioner proposing imaginary forced choices between increasingly negative scenarios. For example, the respondent is asked to choose between contracting malaria or influenza, or being in a car accident involving side swiping or a head-on collision. We tailored the choices to the self-reported dislikes of each participant as a means of increasing motivational potency (Covey, 2014), and we framed choices as “which would you rather have/avoid.” We used this paradigm to explore behavioral and brain responses.
Drawing on a large extant literature reporting results from both animals and humans, we focused on the corticostriatal circuit, which plays a major role in both the motor and cognitive aspects of approach/avoidance (Aupperle et al., 2015; Friedman et al., 2015; Niznikiewicz and Delgado, 2011). The nodes of this network include the striatum and medial and lateral prefrontal cortices, which are also anatomically and functionally connected to limbic regions, including the amygdala and hippocampus, as well as the limbic-adjacent insular cortex. Limbic areas may play a role in counterfactual simulations, particularly when decisions involve negative outcomes. Loss aversion increases when decision options emphasize loss rather than gain (Tversky and Kahneman, 1981), and studies with both animals (Tremblay et al., 2014) and humans (De Martino et al., 2006) implicate the amygdala in decisions involving losses, specifically tracking loss magnitude (Canessa et al., 2013). However, the role of the amygdala in tracking decision variables during counterfactual simulations remains largely undefined. One aim of this study was to characterize the role of corticostriatal-limbic circuits in making choices involving approach or avoidance when choice options are negative.
We extend previous work on counterfactual reasoning (Benoit et al., 2011, 2014, 2019; Sharot et al., 2010) by using Bayesian connectivity and drift diffusion models to quantify task-based network connectivity, latent cognitive processes underlying choice behavior, and their relationship to one another. We hypothesized that approaching aversive stimuli would induce greater choice conflict than avoidance, operationalized as longer reaction times and stronger brain network response, consistent with a previous study of framing effects (Mills-Finnerty et al., 2014).
Materials and Methods
Participants
Participants were recruited from the university community through a department-based subject recruitment system, email, and word of mouth. Undergraduates comprised the majority of participants, and they were awarded course credit for participation after providing informed consent. Thirty-two undergraduate psychology majors completed a behavioral study conducted before the functional magnetic resonance imaging (fMRI) study. A separate cohort of 22 healthy adult participants (10 female, mean age = 26.5, SD = 7) completed the task while they underwent functional MRI conducted at the Rutgers University Brain Imaging Center (N = 14) or Stanford University Center for Neurobiological Imaging (N = 8). Participants met standard MRI exclusion criteria (e.g.,. no metal implants, pregnancy, neurological disorders). Neuroimaging participants were recruited from the Rutgers University Newark and Stanford University communities through a department-based subject recruitment system and word of mouth. Undergraduates were awarded course credit for participation. One participant was left handed. No participants reported taking medication for any psychiatric or neurological disorder. All participants gave informed consent to participate. The study was approved by the Rutgers Institutional Review Board and Stanford University Institutional Review Board.
Procedure
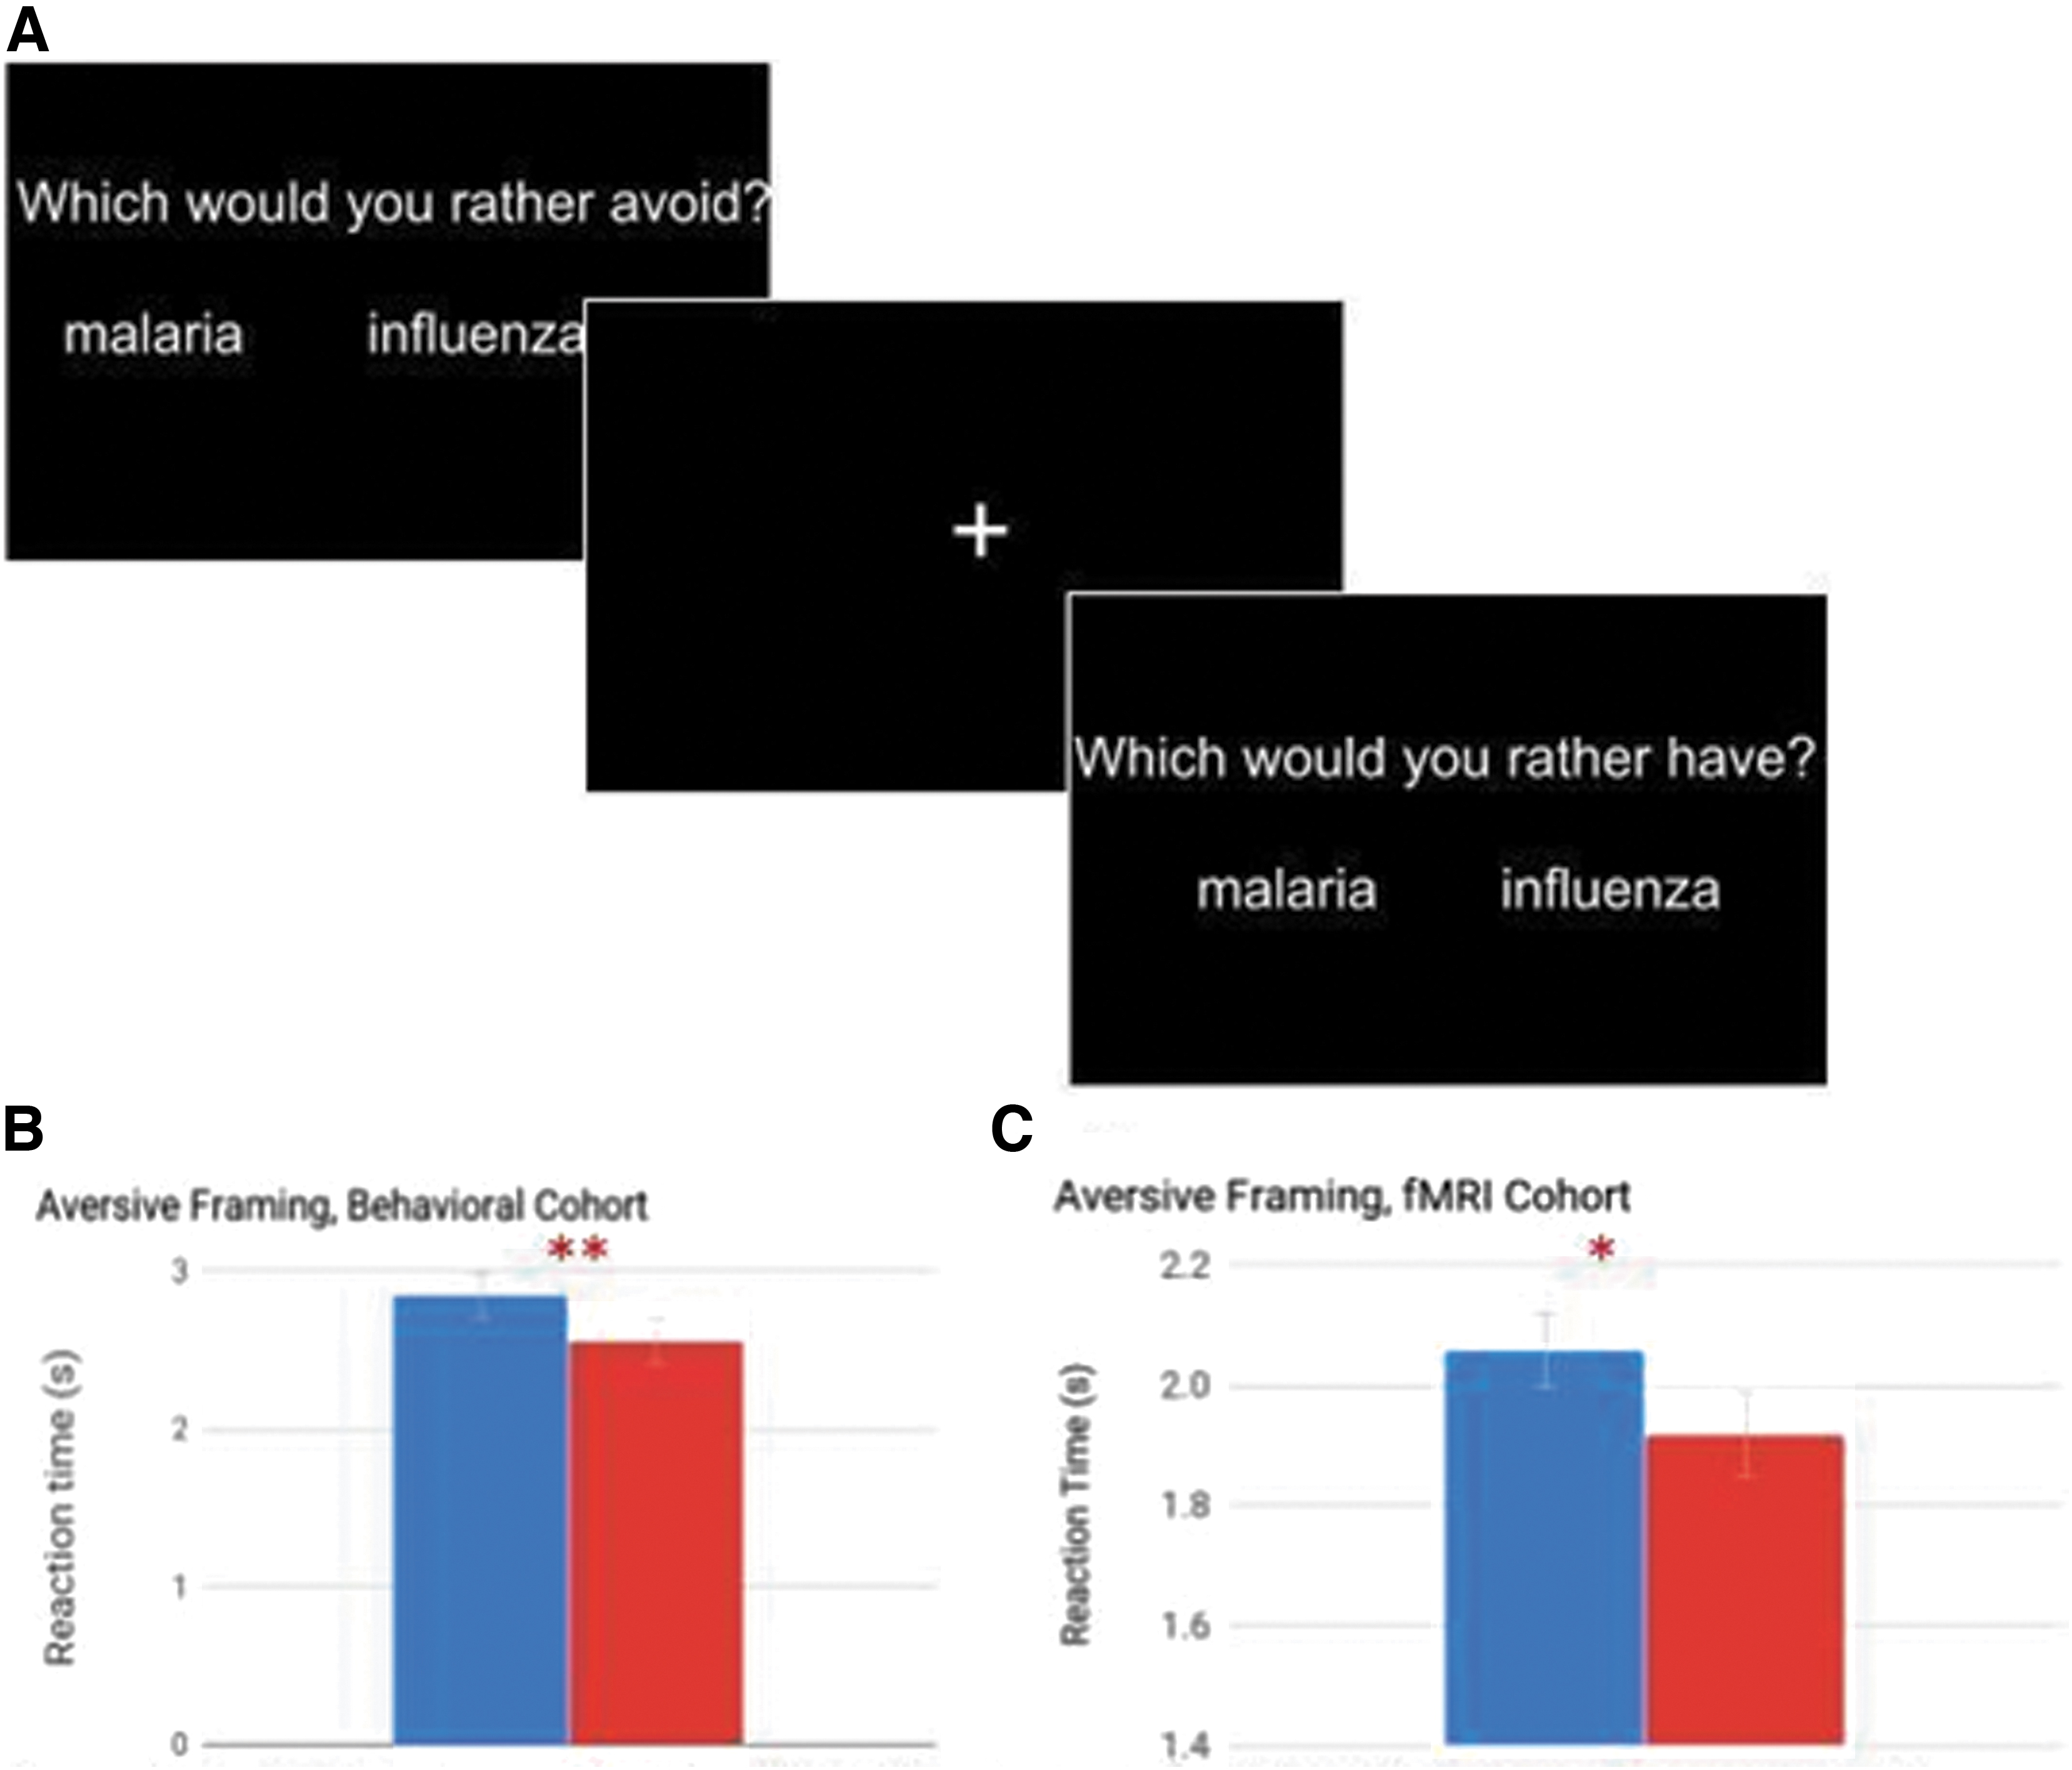
Participants completed a version of the abstract reinforcer task (Mills-Finnerty et al., 2014) with aversive categories. Participants selected from a set of four categories: illnesses, car accidents, train incidents, and house incidents. A full list of category examples is available in the Supplemental Material B. Participants were asked to select the category they found the most negative. Participants who were unsure of how to select the most negative category were given the additional instruction to select the category with stimuli “they are most afraid of, or would least like to happen to them.” All participants made two-alternative forced choices between all possible combinations of category exemplars (i.e., “flu versus cancer”), once with the prompt “which would you rather avoid” (avoidance frame) and once as “which would you rather have” (approach frame; Fig. 1). The behavioral task was self-paced, and the screen was advanced to the next choice on button press. The fMRI scan run took 13 min and 6 sec. Choices were presented in eight 28 sec long blocks with 7 choices per block (except for the final block of each framing condition that contained 10 stimuli), for a total of 66 trials per framing condition and 132 trials total. Participants were given up to 4 sec to respond, and after they selected their answer the screen changed to a crosshair to indicate the response had been logged. Twelve second rest periods divided the approach and avoidance blocks. Stimuli were presented, and responses were recorded by using PsychoPy.
Scanning parameters
Functional imaging at Rutgers University was conducted by using a Siemens 3.0 Tesla Trio MRI scanner to acquire gradient echo T2*-weighted echo-planer (EPI) images with blood oxygenation level dependent (BOLD) contrast. A 12 channel array coil was used. Each volume collected had 32 axial slices. Three hundred ninety-three measurements were acquired in ascending contiguous order with a time to repetition (TR) of 2 sec, for a total scan time of 13 min and 6 sec. Imaging parameters included: field of view, 192 mm; slice thickness, 3 mm; TR, 2 sec; time to echo, 30 ms; and flip angle, 90°. Whole-brain high-resolution structural scans were acquired at 1 × 1 × 1 mm by using an MP-RAGE pulse sequence.
Functional imaging at the Center for Neurobiological Imaging at Stanford University was conducted by using a GE Discovery MR750 scanner to acquire gradient echo T2*-weighted EPI images. A 32 channel coil was used. Parameters were matched to the data acquisition on the Rutgers scanner, with the exception of slice thickness, which was 2.9 mm instead of 3 mm; 45 slices instead of 32; and use of the BRAVO anatomical sequence.
Data and code availability
Data and analysis code for the procedures described later is available on the Open Science Framework:
Behavioral data analysis
Analyses were conducted by using R using the “lme4” and “hBayesDM” packages. Linear mixed-effects models were used to determine whether reaction time differed between approach and avoidance frames, with fixed effects of frame and mixed effect of subject included in the model, using restricted maximum likelihood estimation.
Hierarchical Bayesian drift-diffusion models were calculated to estimate decision bias, nondecision time, decision boundaries, and evidence accumulation rate (Ahn et al., 2017). Drift diffusion models were previously only feasible in studies with large numbers of task trials, but the integration of Bayesian hierarchical analysis methods have made it possible with smaller samples (Ahn et al., 2017). These models are used to estimate latent cognitive processes derived from participant reaction times and accuracy to compute psychologically meaningful individual differences. Drift diffusion makes it possible to evaluate reaction time as a function of individual factors: nondecision time (motor preparatory response), drift rate (rate of evidence accumulation in the ramp up to making a choice), choice bias (whether choices on, say, the right of the screen are responded to faster than those on the left), and decision boundaries (the amount of evidence that must be accumulated before a response is chosen). By incorporating hierarchical Bayesian analysis, in which individual estimates are constrained by the group estimate, parameter estimation is robust even when the number of responses for each participant is small.
We used HBayesDM (Ahn et al., 2017) to estimate the following drift diffusion parameters: nondecision time (thought to reflect motor preparatory responses), drift diffusion rate (rate of evidence accumulation), bias (whether responding is systematically biased toward a particular option), and decision boundary The way HBayesDM works, briefly, is by using the group-level estimates as a hyperparameter that “tunes” or restricts the individual level estimates, improving estimation power. In addition, Markov-Chain Monte Carlo sampling is used to assemble posterior predictive distributions. Parameters used for Markov-Chain Monte Carlo sampling included 1000 warmup iterations, 4000 sampling iterations, 4 chains, and 3 cores. Chain convergence was assessed by using caterpiller plots (Supplemental Material A). Bayesian model comparisons for approach and avoidance model parameters were conducted by using Highest Density Intervals. Models were calculated separately for approach framing and avoidance framing. Erroneous reaction times (<0.09 sec) were removed from analysis. One participant was excluded from analysis, because they used the incorrect response buttons for a portion of the task.
fMRI general linear model
Analysis was performed by using FMRIB's Software Library. Skull stripping was performed by using Brain Extraction Tool, and then individual data were registered to the anatomical standard by using FSL's Linear Registration Tool (FLIRT), in which the BOLD functional data are registered to the anatomical scan and then to the Montreal Neurological Institute (MNI) atlas image. FSL's Expert Analysis Tool was used for all general linear model (GLM) analysis with the following parameters for first-level (individual scan) analysis: motion correction with MCFLIRT; 5 mm full width half max spatial smoothing, highpass filtering using a value of 100 sec, and registration to the MNI atlas. The regressors used in first-level analysis included the timepoints associated with the approach and avoidance frames as well as demeaned reaction time modeled as a regressor of no interest (to control for motor effects); rest periods were used as baseline and therefore not modeled.
At the group level, activation was modeled in several ways: as the average above baseline magnitude (activation) and below baseline magnitude (deactivation) of each framing condition (approach and avoidance); as a t test of the differences between activation in the approach and avoidance conditions; and the average group activation with approach and avoidance conditions collapsed together. This collapsing was done by modeling each subject's approach and avoidance-related timepoints together in a first-level analysis, producing individual files representing the average activation during both the approach and avoidance conditions.
All group models were run by using the Flame 1 mixed-effects model and corrected for multiple comparisons by using cluster estimation at the z = 2.33, p = 0.05 level.
Connectivity analysis
Connectivity analysis was performed to quantify how brain network response during decisions for abstract aversive reinforcers is influenced by framing. Although general linear model analysis addresses how conditions can affect the level of response by various brain regions, it cannot reveal how those brain regions interact. Characterizing the interaction (connectivity) within brain networks rather than changes in BOLD magnitude can provide new information about brain function. A number of methods now exist to identify dynamic interactions among brain regions. In particular, studies using Bayesian graph connectivity have shown that task-based connectivity analysis can accurately recover network connections in both simulated and actual human task fMRI data with high recall and precision (Mill et al., 2016; Ramsey et al., 2010, 2011). This approach has been applied to understand brain-behavior relationships by using tasks such as drug cue processing, working memory, and win/loss anticipation in healthy and clinical samples (e.g., Dobrayakova et al., 2014; Fleischer et al., 2020; Manelis et al., 2016; Ray et al., 2015).
Here, we use an Independent Multi-sample Greedy Equivalence Search (IMaGES). The algorithm starts with an empty graph and searches forward, one new connection at a time, until it finds the set of connections that optimally represents the entire group of subjects, interpolating any missing data. The algorithm searches with the restriction of finding only Markov equivalence classes (MECs) of directed acyclic graphs. The process is penalized to prevent overfitting by using the Bayes Information Criterion (Schwarz, 1978): −2ln(ML) + k ln(n), where ML is the maximum likelihood estimate, k is the dimension of the model (the number of directed edges plus the number of variables), and n is the sample size (number of participants). Orienting edges to be unidirectional rather than bidirectional is done here for the sake of improving model precision and recall based on simulation results (Ramsey et al., 2011), as well as recent empirical validations that this method correctly identifies directionality in experimental conditions where this information is known (Mill et al., 2016).
The regions of interests (ROIs) were chosen based on activation during GLM analysis. Regions that were active in the combined approach and avoidance one-sample T-test at a cluster threshold of z = 2.33, p = 0.05 were considered, and final inclusion was based on whether that region is specifically implicated in decision making or aversive processing. Note that connectivity quantifies different information about brain dynamics than GLM analysis, so deriving ROIs from GLM activations for use in connectivity analysis avoids issues of circularity. The following Harvard-Oxford Atlas ROIs were extracted: left and right middle frontal gyrus [dorsolateral prefrontal cortex (DLPFC)], bilateral insular cortex, bilateral hippocampus, left putamen, left accumbens, left caudate, and left amygdala. The medial prefrontal cortex ROI was derived from the Grecius atlas, as it more accurately matched the GLM prefrontal cluster than the Harvard-Oxford medial prefrontal cortex (mPFC) region.
Average time series for each subject were extracted from these ROIs by using FSL's meanTS module. Timecourses corresponding to blocks of task conditions were arranged into a matrix for each subject, with the ROIs as columns and each row representing a single time point. This IMaGES algorithm was run on these inputs. IMaGES outputs a set of graphs that are all equivalently likely called an MEC. Final graphs were selected by choosing the best scoring graph (lowest Bayes Information Criterion score) within the MEC. Edge (connection) weight T statistics were compared by using paired-sample t-tests. Graph structure was input into Cytoscape for visualization and calculation of graph metrics.
Neurosynth meta-analysis
A search using the term “aversive” was conducted on
MDS and clustering
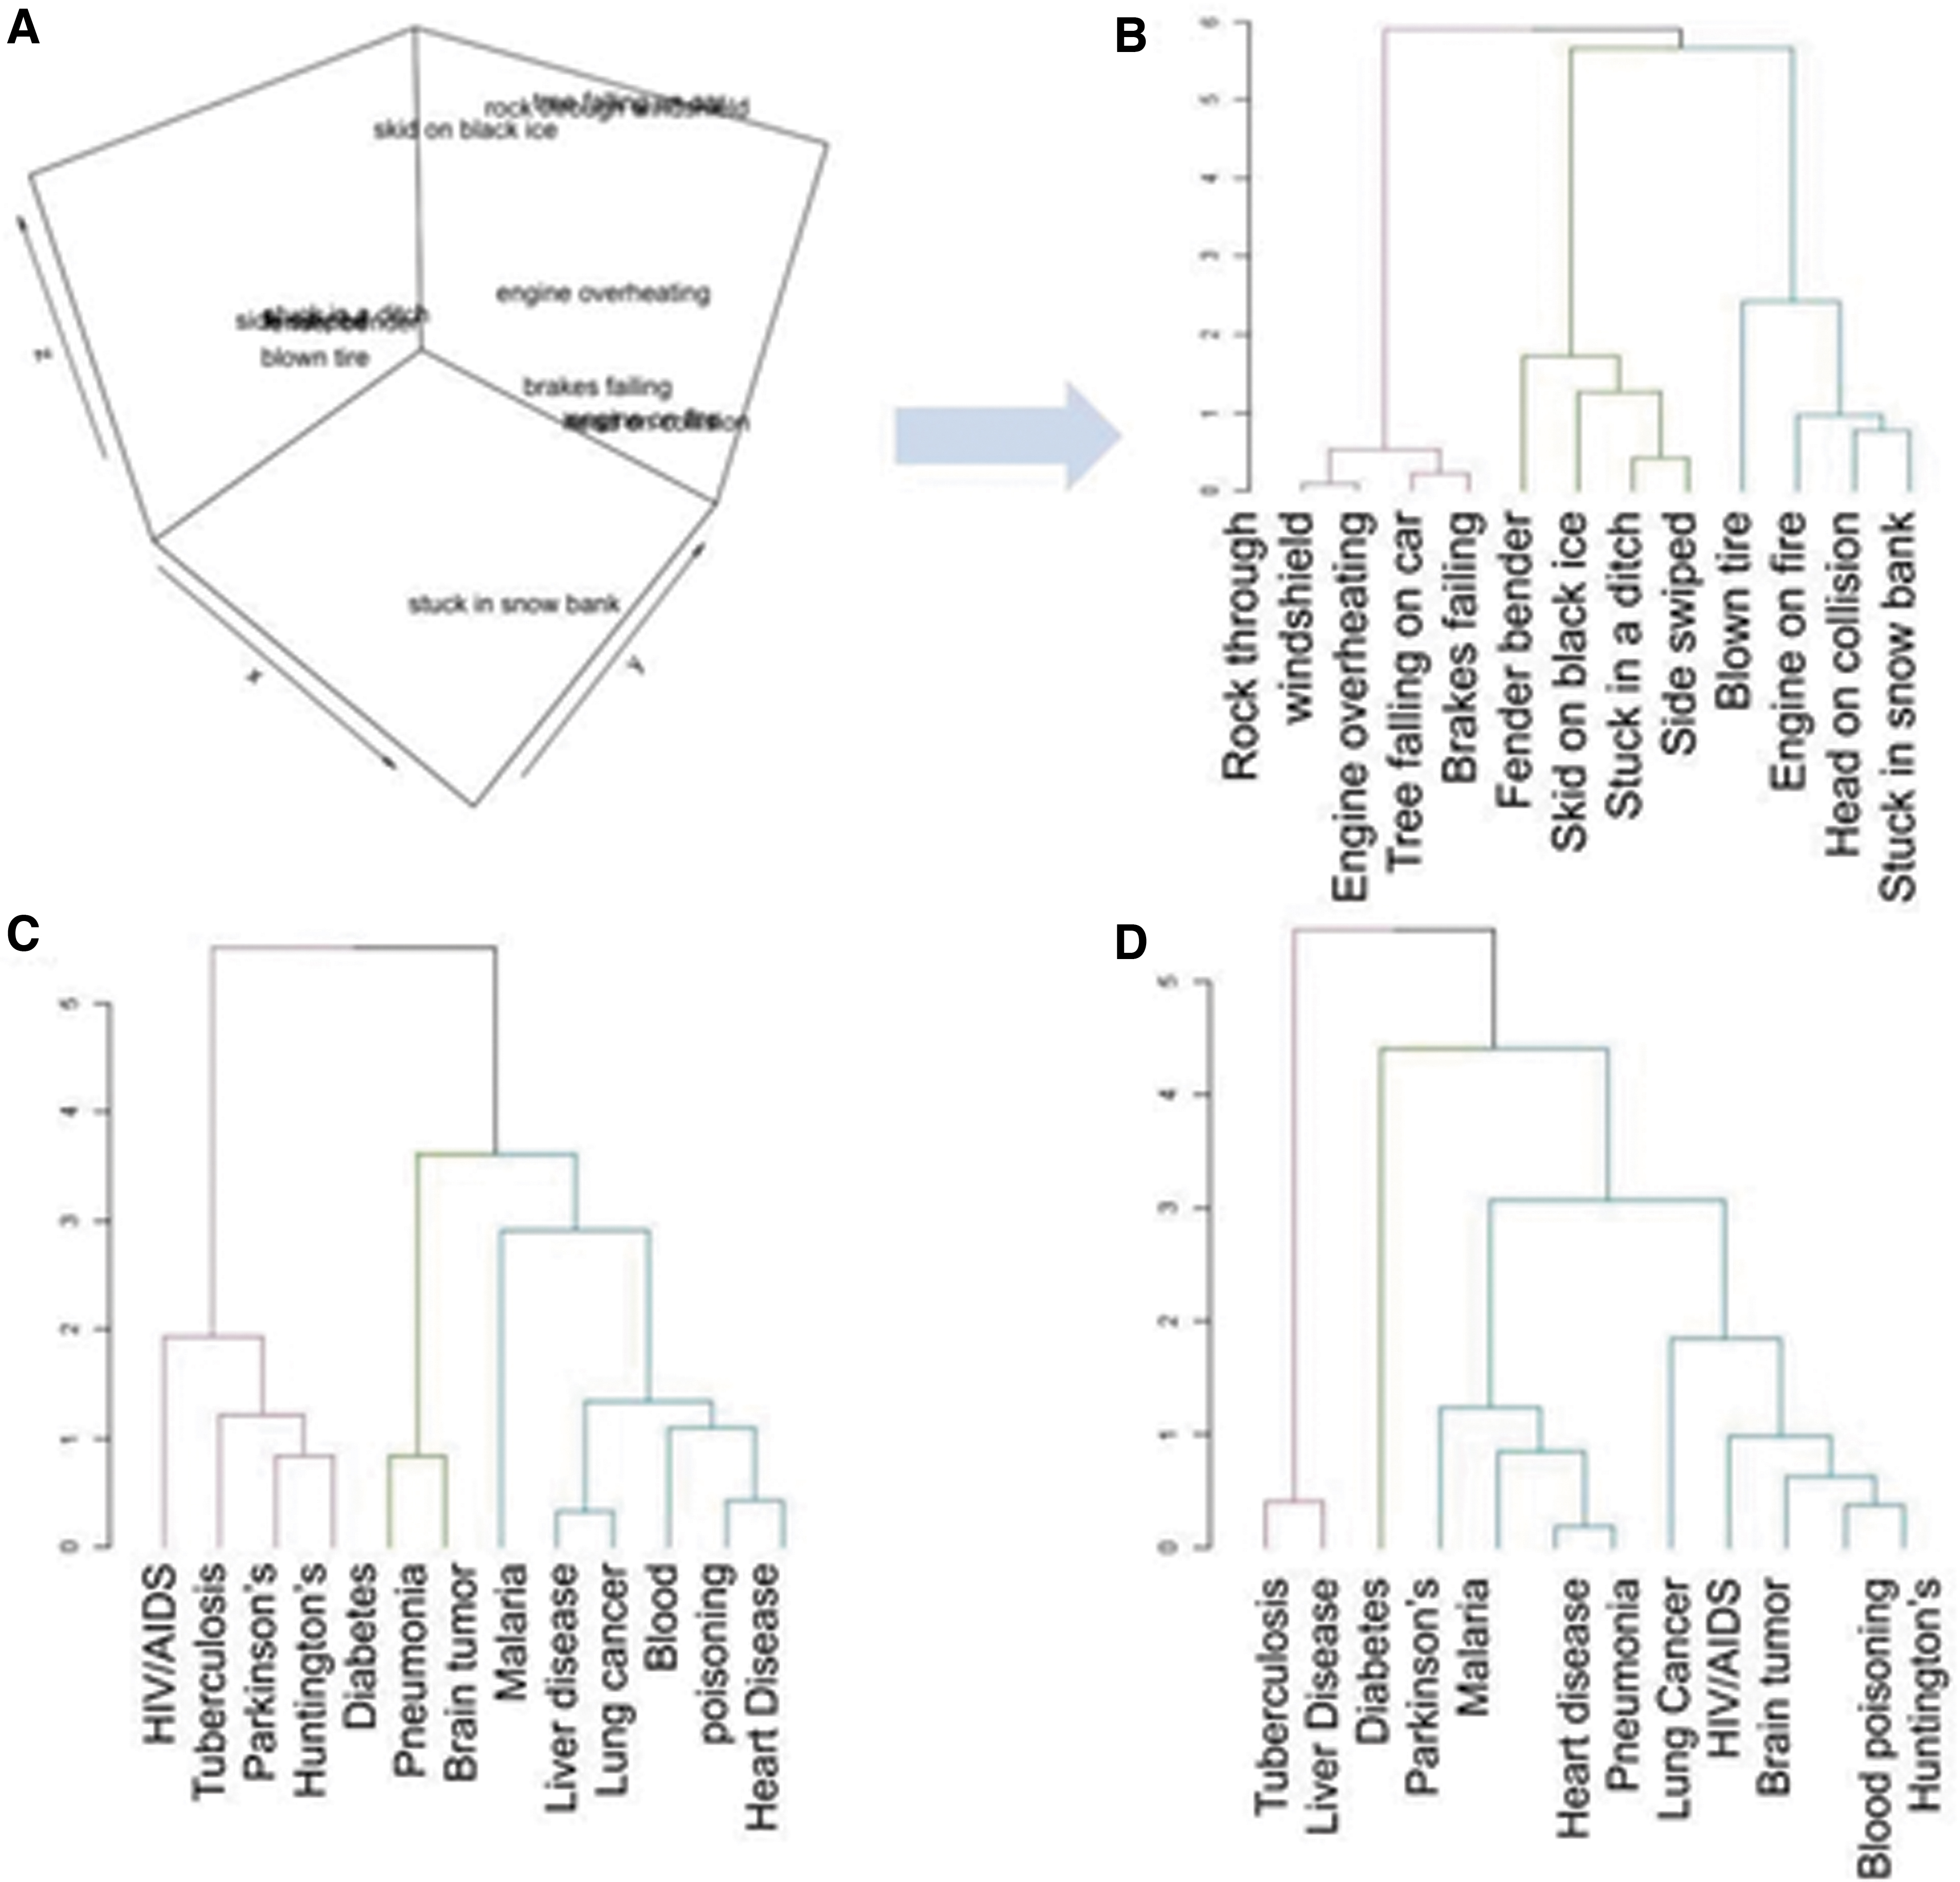
The vegan and dendextend libraries were used to conduct MDS and clustering analysis in R. Inputs were matrices for each subject containing counts of how many times each choice option was chosen over other options, within each condition of approach choices and avoidance choices. These matrices were converted to distance scaling, and MDS was run by using the metaMDS function with three dimensions and 100 iterations. After calculating 100 iterations of the model, the most optimal of the set was selected by minimizing stress. Three-dimensional models resulted in more optimal stress values relative to models with two dimensions. This three-dimensional choice space was then clustered by using the hclust function and Ward's D scaling. Dendograms of these clusters were generated with three branches to mirror the dimensions of the MDS model. Group averages per stimulus class are pictured in Figure 7, and representative participant dendograms can be found in the Supplemental Material A.
Results
Choice frame induces a replicable effect on reaction time
For subjects who participated in the decision tasks without being scanned, linear mixed-effects models confirmed that reaction times were significantly longer for approach framing (M = 2.84 sec, SE = 0.14) compared with avoidance framing (M = 2.56 sec, SE = 0.14, 5 = −0.29, p = 0.007, n = 32, Fig. 1). For those subjects who performed the preference task while being scanned (N = 22, mean age = 26.5, SD = 7, 10 female), reaction time was also significantly longer for the approach frame (M = 2.06 sec, SE = 0.06) compared with the avoidance frame (M = 1.92 sec, SE = 0.07; 5 = −0.14, p = 0.03).
Approach and avoidance choices result in similar changes in BOLD magnitude
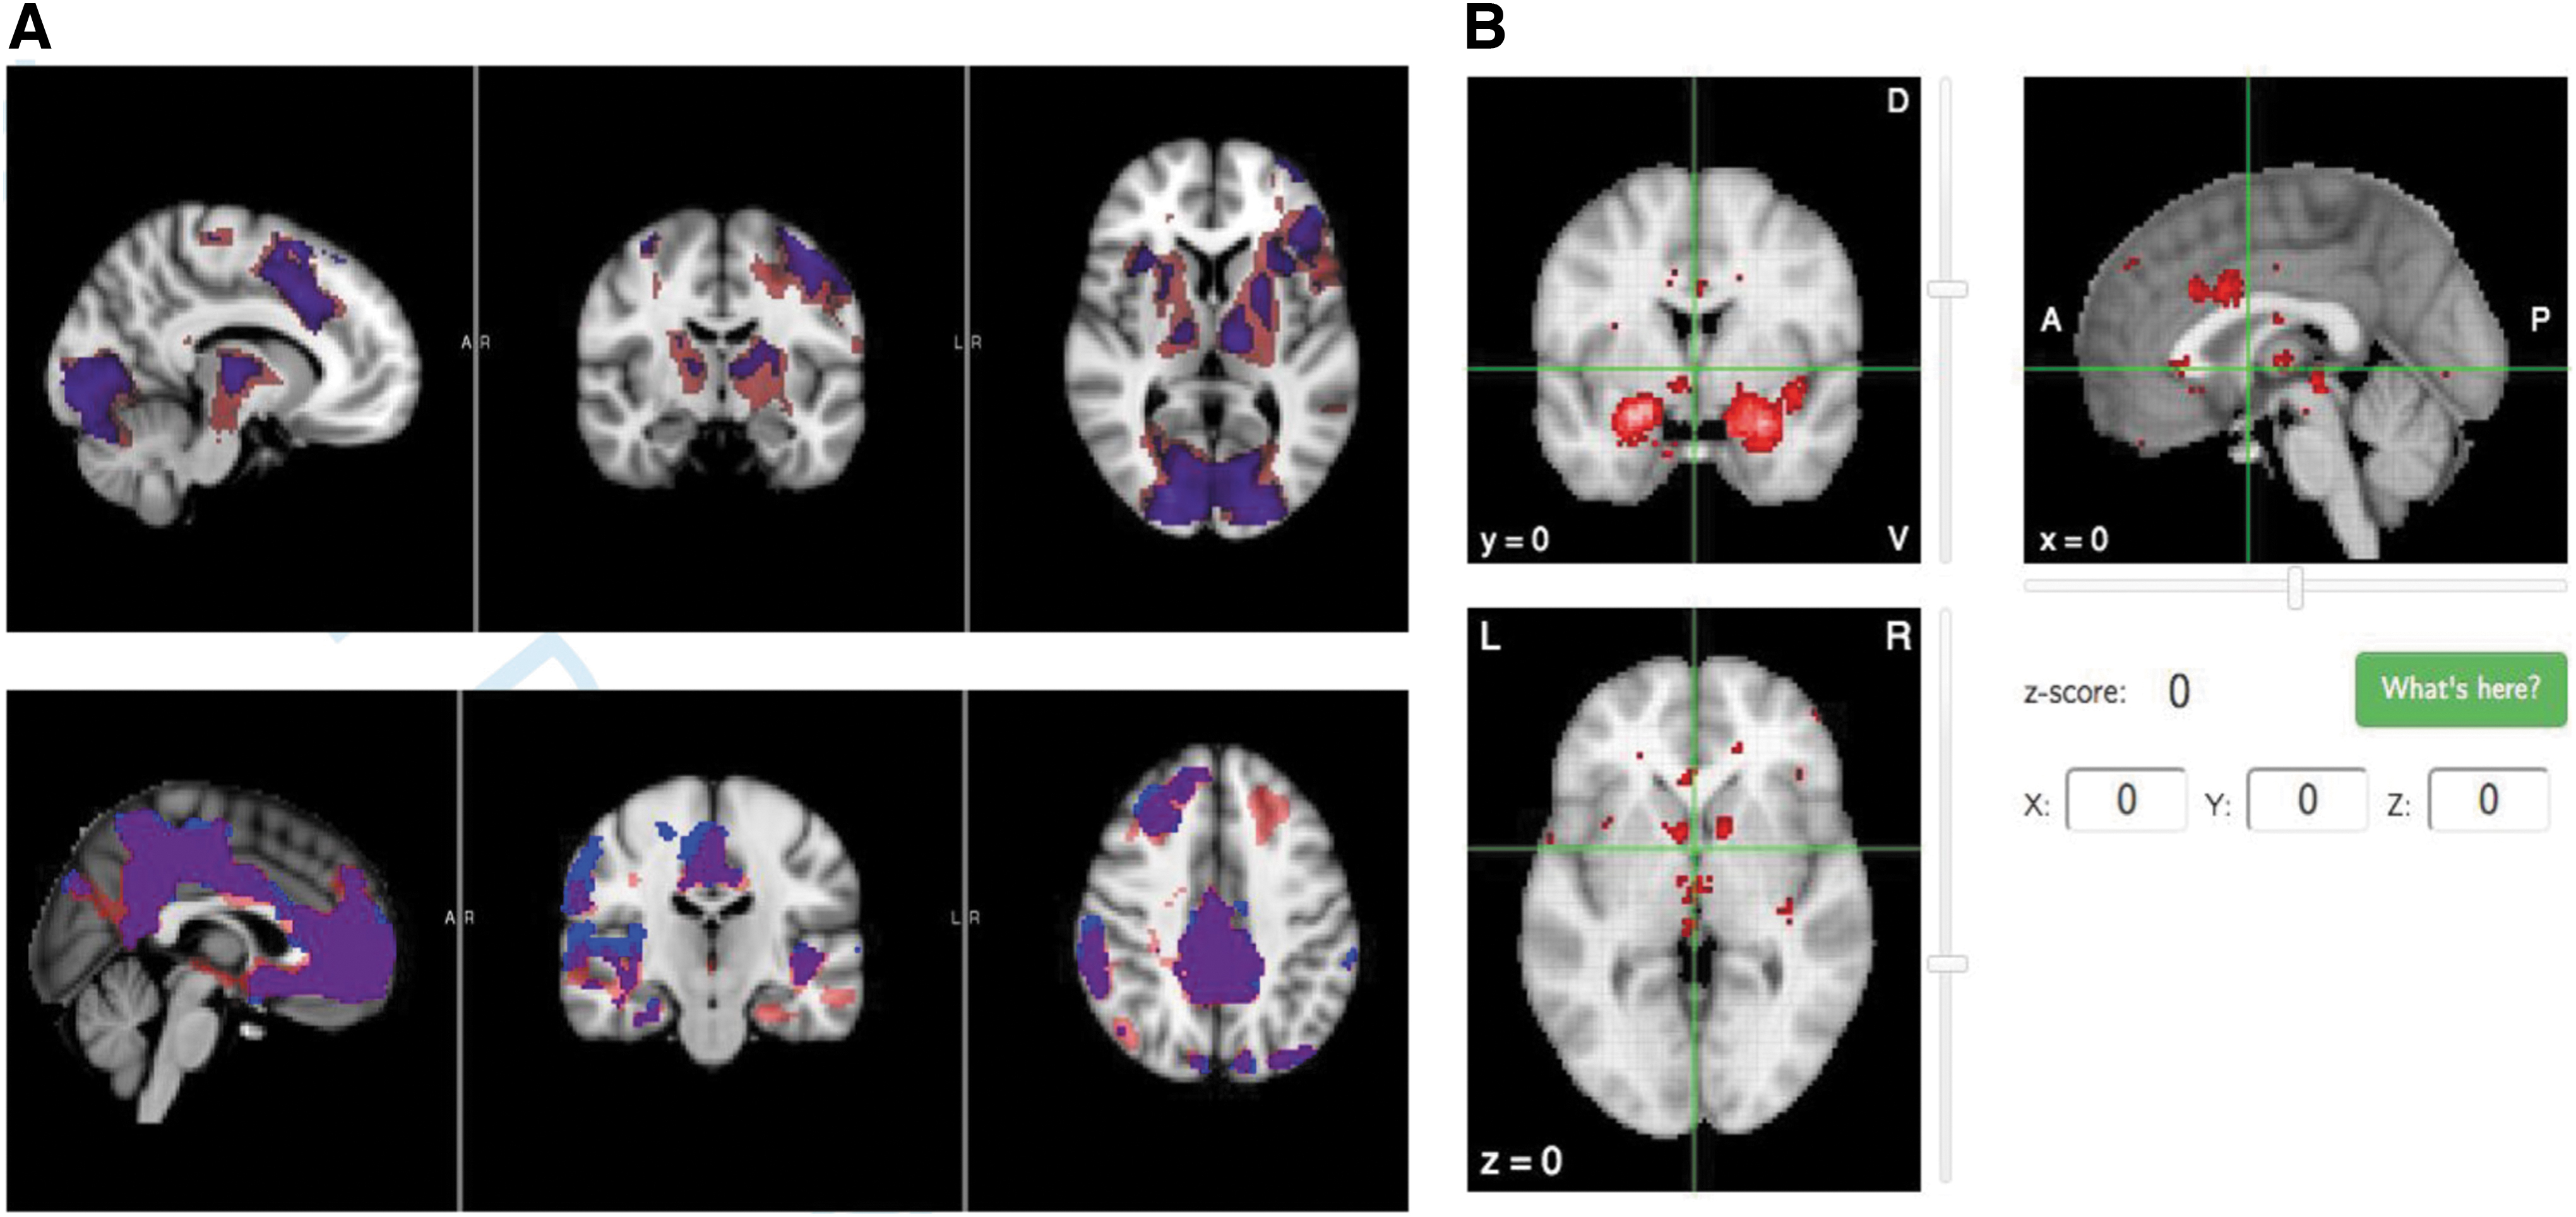
Both approach and avoidance choices led to greater activation than rest baseline in regions, including bilateral striatum, amygdala, insula, hippocampus, mPFC, and anterior cingulate (Fig. 2), cluster corrected at z = 2.33, p = 0.05. No significant differences in magnitude of BOLD activation were observed when the approach and avoidance conditions were compared directly by using a paired-sample voxelwise t-test, disconfirming predictions that activation would differ by choice frame. The cluster locations and spatial extents were highly similar for both conditions (see overlap pictured in purple in Fig. 2), suggesting recruitment of similar neural resources.
Counterfactual choices recruit a network associated with aversive processing in meta-analysis
A neurosynth meta-analysis was conducted by using the search term “aversive” to evaluate overlap between regions activated in the literature and in the present study (Fig. 2). Two-hundred thirty-eight studies were included in the search. Regions that overlapped with the neurosynth cluster coordinates included: an activation cluster in left thalamus during approach framing (x = −6, y = −14, z = 4), and deactivation clusters during approach and avoidance framing in bilateral amygdala (left overlap: x = −24, y = −2, z = −18, right overlap: x = 24, y = −6, z = −22), ventromedial prefrontal cortex (vmPFC) (x = 0, y = 24, z = −8), bilateral orbitofrontal cortex (right: x = 28, y = 18, z = −20, left: x = −26, y = 16, z = 20), right frontomedial cortex (right: x = 12, y = 48, z = −12), and right posterior insular cortex (x = 42, y = 0, z = 8).
Areas that were adjacent but not overlapping with the neurosynth meta-analytic clusters (within five coordinates) included the anterior cingulate during approach framing (x = 10, y = 6, z = 46; neurosynth x = 10, y = 6, z = 42) and left caudate during approach framing (x = −14, y = 2, z = 16; neurosynth x = −14, y = 4, z = 14). The left anterior insula showed task-related activation in the same structure, but opposite hemisphere as the neurosynth clusters (possibly due to the linguistic nature of the task recruiting more strongly a left-lateralized functional response; x = −34, y = 12, z = 10; neurosynth x = 34, y = 12, z = 6).
Areas that were responsive during approach and avoidance choices but were not represented in the neurosynth results include visual regions of occipital cortex, somatomotor regions, and “default mode” regions of mPFC and posterior cingulate/precuneous (which typically “deactivate” during cognitively engaging tasks). These regions are all typically associated with the visual, motor, and executive functioning demands involved in cognitive tasks and therefore may not appear in the meta-analysis, as their role may better reflect processes involved in decision making, such as choice valuation and motor preparation.
Network connectivity strength differs by choice frame
Bayesian graph connectivity analysis was performed to quantify framing-induced changes in connectivity. The ROIs used to extract timeseries are pictured in Figure 3. For approach decisions, 12 connections were identified: left amygdala-left accumbens, left amygdala-left putamen, left caudate-insula, left caudate-mPFC, left caudate-DLPFC, left caudate-hippocampus, insula-left putamen, mPFC-left accumbens, mPFC-left amygdala, mPFC-DLPFC, DLPFC-left amygdala, and hippocampus-left amygdala (Fig. 4, left). For avoidance framing, fifteen connections were identified: left accumbens-left amygdala, left accumbens-left caudate, left accumbens-insula, left accumbens-DLPFC, left amygdala-left putamen, left amygdala-hippocampus, left caudate-left putamen, left caudate-insula, left caudate-mPFC, left caudate-DLPFC, left putamen-insula, left putamen-DLPFC, mPFC-DLPFC, hippocampus-left caudate, and hippocampus-insula.
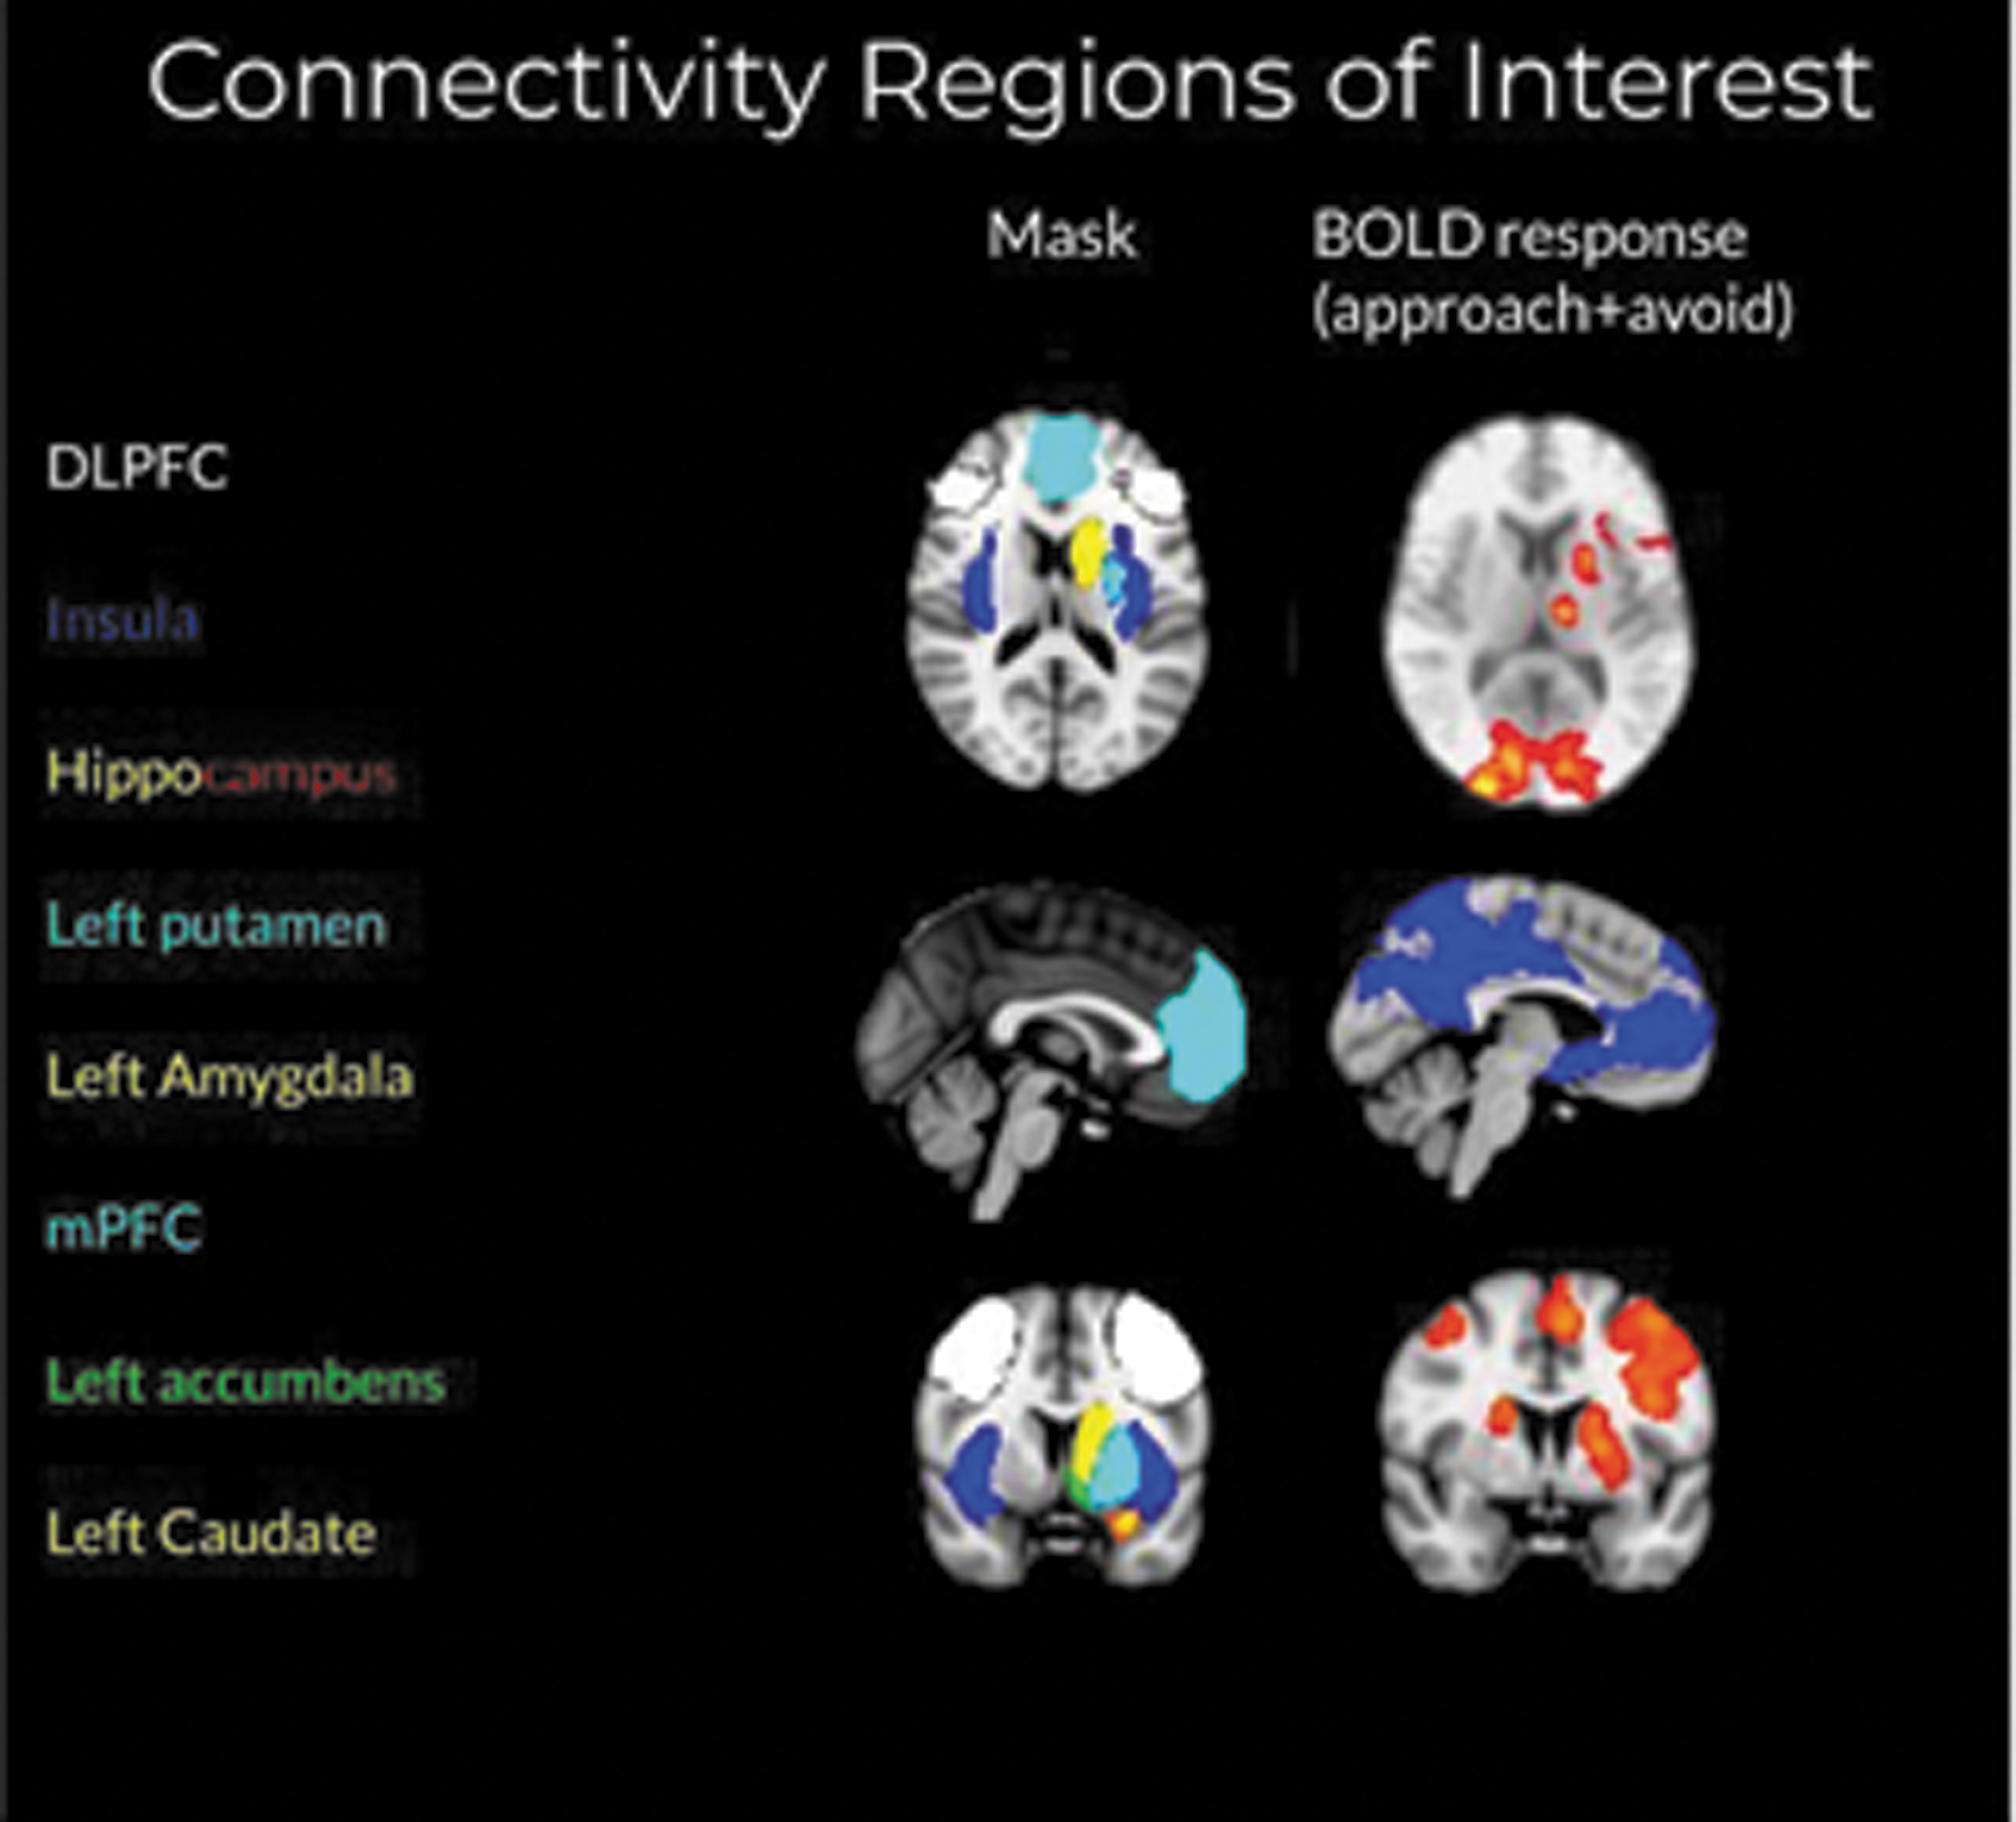
Masks used for timeseries extraction were selected based on activation clusters significant when approach and avoidance framing were collapsed together and analyzed by using a one-sample t-test with a cluster threshold of z = 2.33, p = 0.05. Red-yellow = activation, blue = deactivation. Color images are available online.
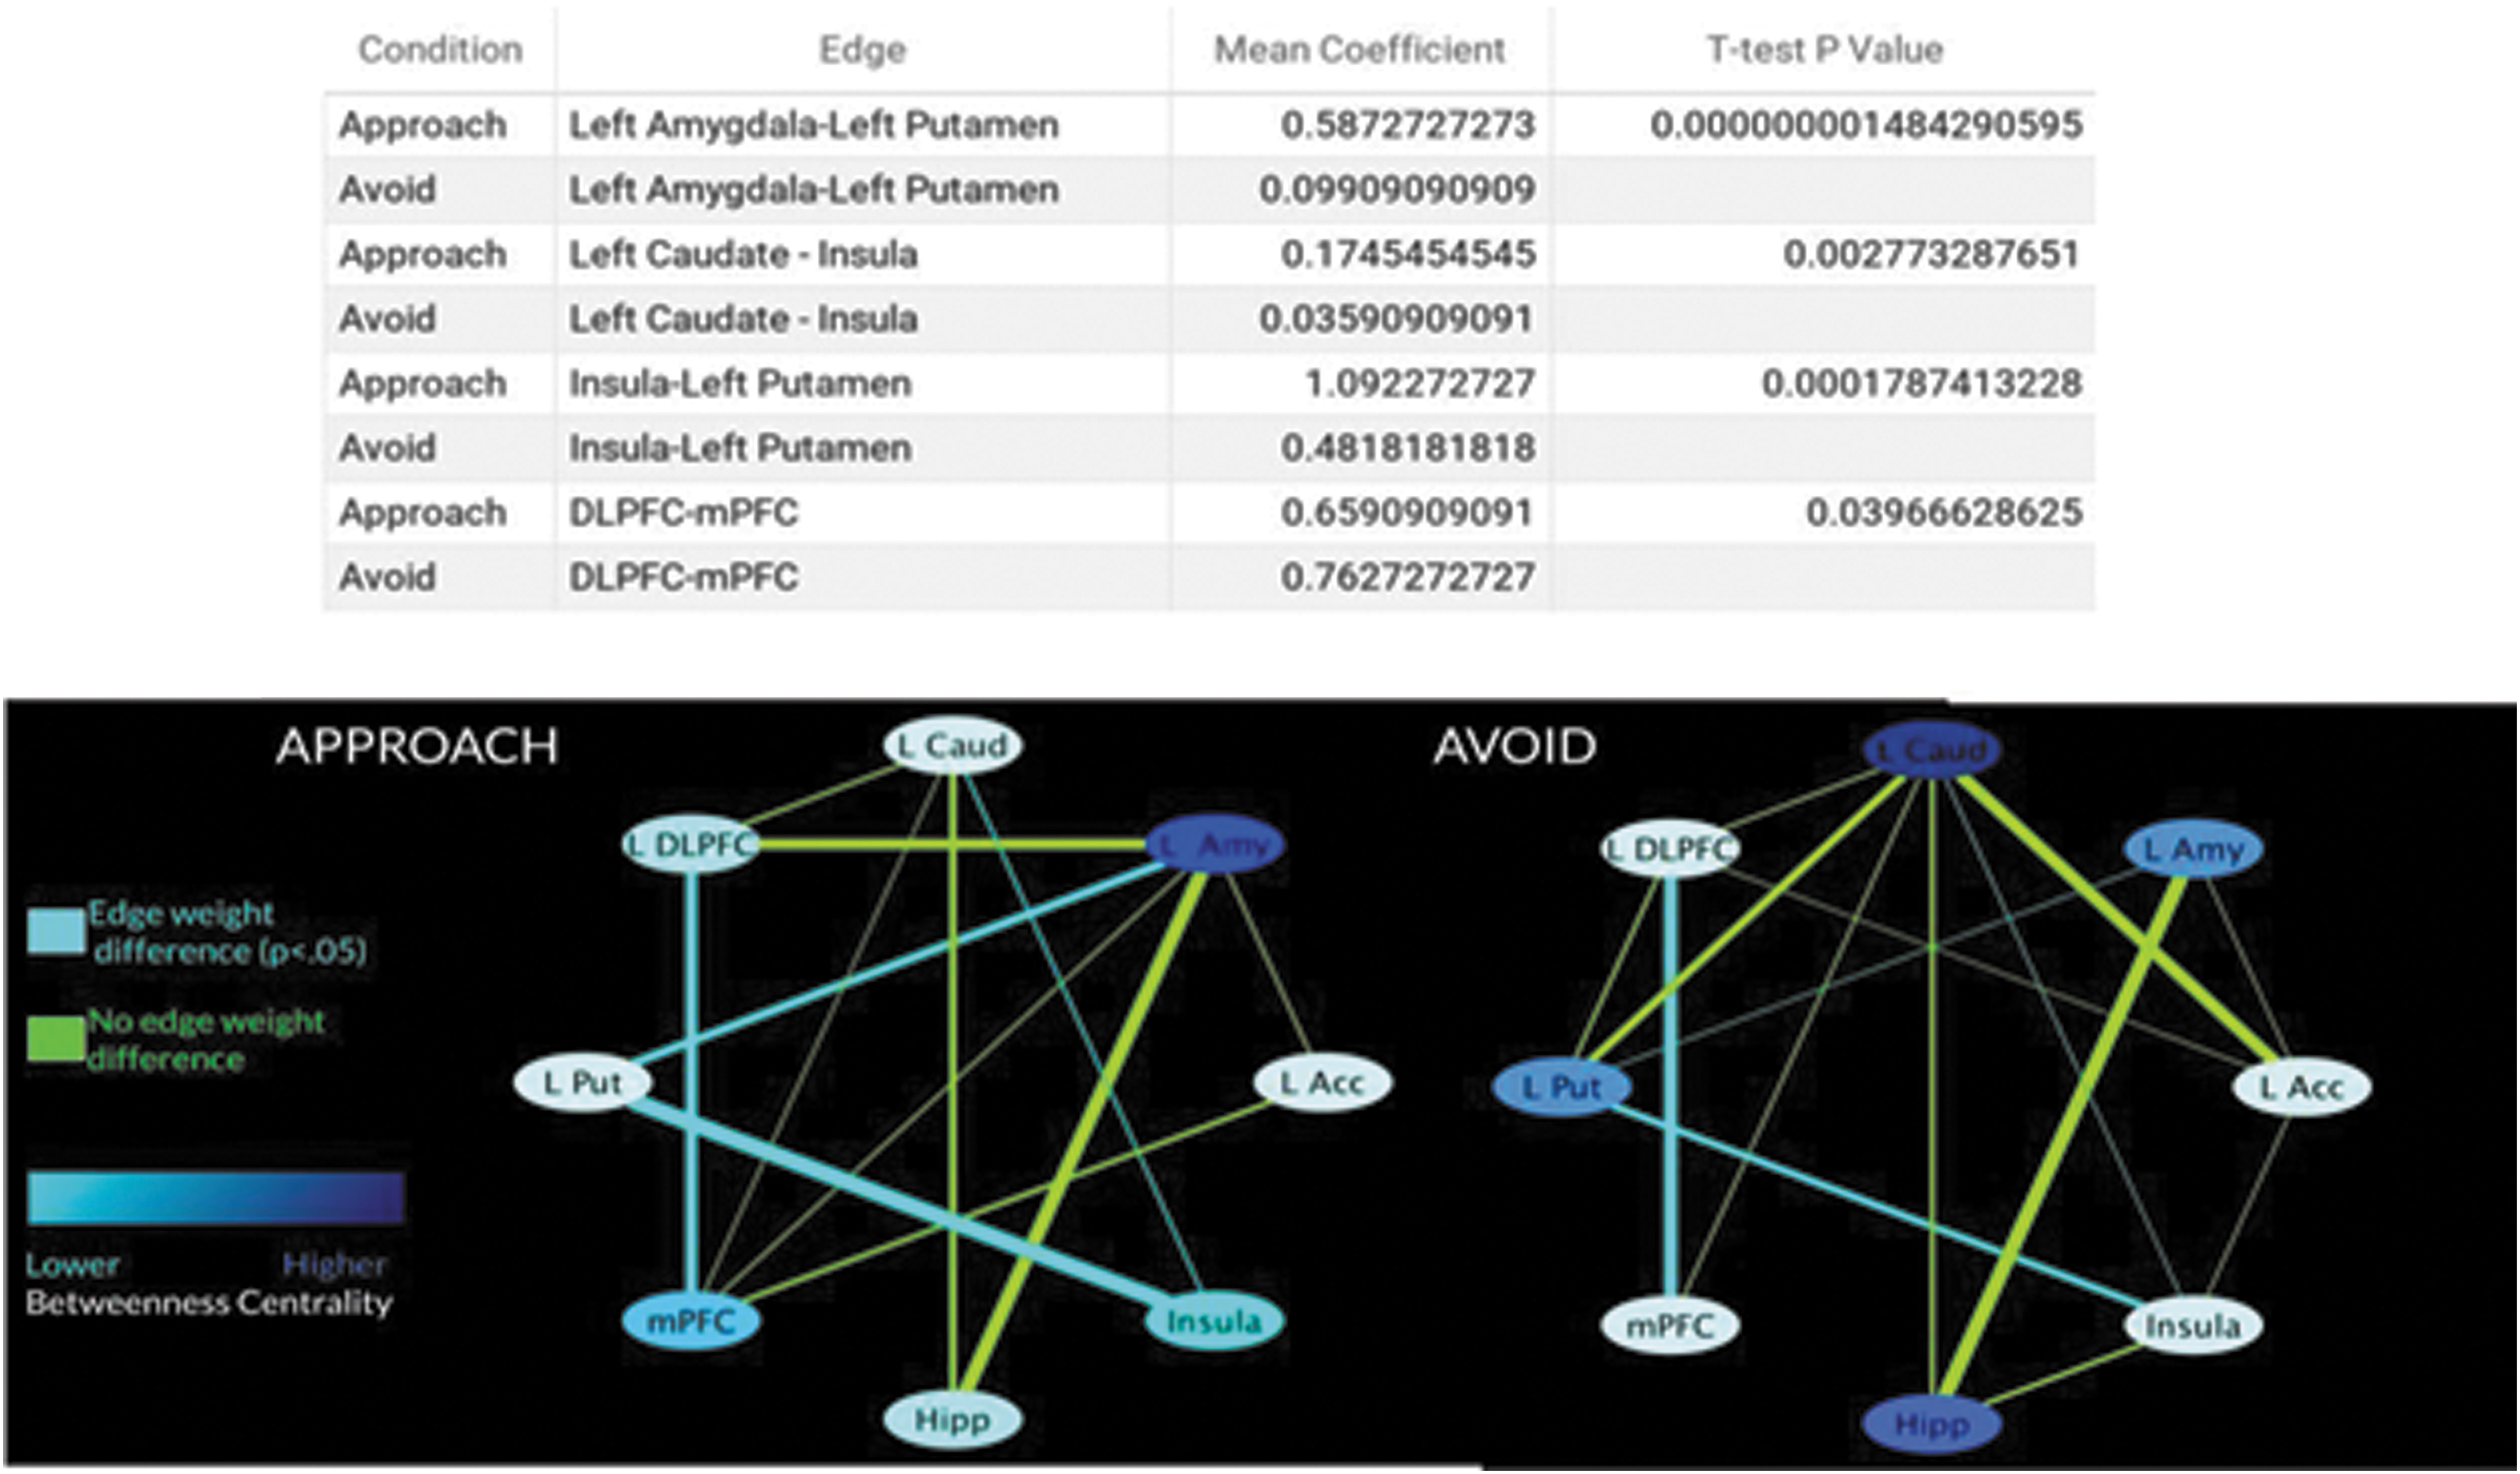
Top, edge coefficients that differed significantly by frame. Bottom, Bayesian graph connectivity analysis of approach and avoidance framing. Left, group graph for approach frame. Right, group graph for avoidance frame. DLPFC, dorsolateral prefrontal cortex; Hipp, hippocampus; L Caud, Left Caudate; L Acc, left accumbens; L Amy, Left Amygdala; L Put, left putamen; mPFC, medial prefrontal cortex. Color images are available online.
Significantly stronger connectivity (higher edge coefficients) was observed for the following connections during approach framing compared with avoidance framing: left putamen-insula, left putamen-left amygdala, DLPFC-mPFC, and left caudate-insula. In the approach condition, the amygdala had the highest betweenness centrality score (the number of shortest paths in the network that pass through this node), whereas in the avoidance graph the caudate had the highest value, suggesting differences in which nodes are central to approach versus avoidance. The IMscore for the approach model was −4615.2, and it was −4393.5 for the avoidance model.
Latent cognitive variables differ by choice frame
Hierarchical Bayesian Drift Diffusion modeling was applied to the behavioral data from the fMRI cohort to estimate latent cognitive variables: nondecision time, response bias, drift rate, and decision boundaries. Values were compared between approach and avoidance by using a paired-sample t test (Fig. 5). Each of the four variables differed by frame, with greater values for approach framing relative to avoidance framing for decision boundaries [approach M = 8.59, SE = 0.12, avoidance M = 7.89, SE = 0.04, t(21) = −6.38, p < 0.001], bias [approach M = 0.65, SE = 0.02, avoidance M = 0.49, SE = 0.03, t(21) = −5.68, p = <0.001], and nondecision time [approach M = 0.45, SE = 0.05, avoidance M = 0.17, SE = 0.01, t(21) = −5.22, p = <0.001]. Drift rate (evidence accumulation) was faster for approach choices compared with avoidance choices [approach M = 1.82, SE = 0.16, avoidance M = 2.27, SE = 0.15, t(21) = 3.69, p = <0.001]. Reported p-values were corrected for multiple comparisons by using the Benjamini–Hochberg equation.
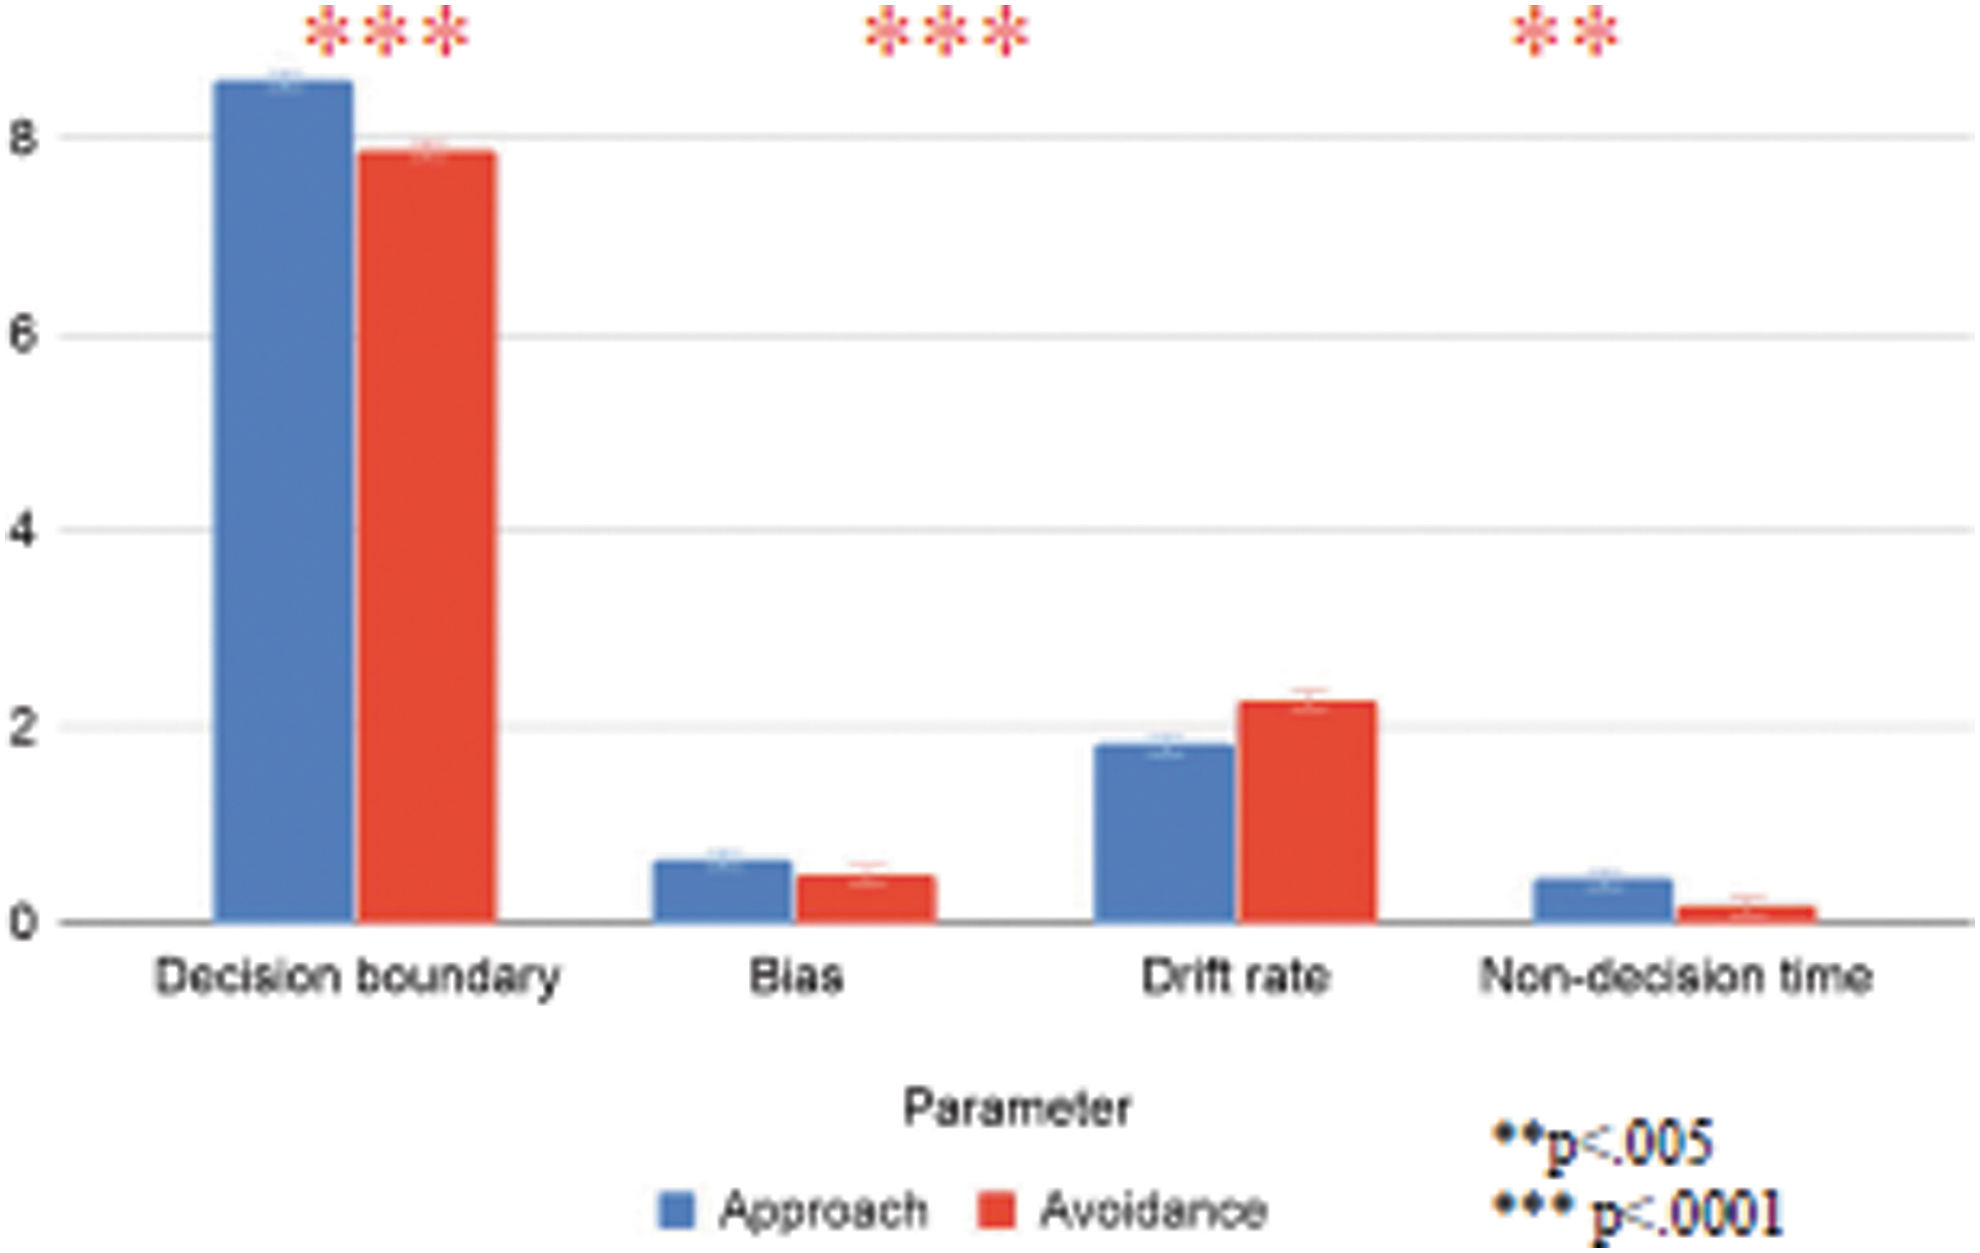
Drift diffusion parameters differ by choice condition. Color images are available online.
Limbic connectivity strength is related to evidence accumulation rate during approach choices
Diffusion rate parameter estimates from the model of approach decisions were correlated with connectivity strength estimates from graph connectivity analysis (Fig. 6). For both the approach and avoidance conditions, all connectivity parameter estimates generated from the IMaGES model were correlated with all four drift diffusion outcomes. The p-values resulting from this analysis were then FDR corrected across all comparisons by using the Benjamini–Hochberg equation. We identified significant correlations between drift rate during approach choices and connectivity strength between left caudate and hippocampus (r = 0.67, p = 0.004), insula and left putamen (r = 0.72, p = 0.003), hippocampus and left amygdala (r = 0.71, p = 0.002), left amygdala and left accumbens (r = 0.52, p = 0.04), and DLPFC and left amygdala (r = 0.65, p = 0.004). For avoidance decisions, mPFC and DLPFC connectivity strength was correlated with nondecision time (r = 0.61, p = 0.003).
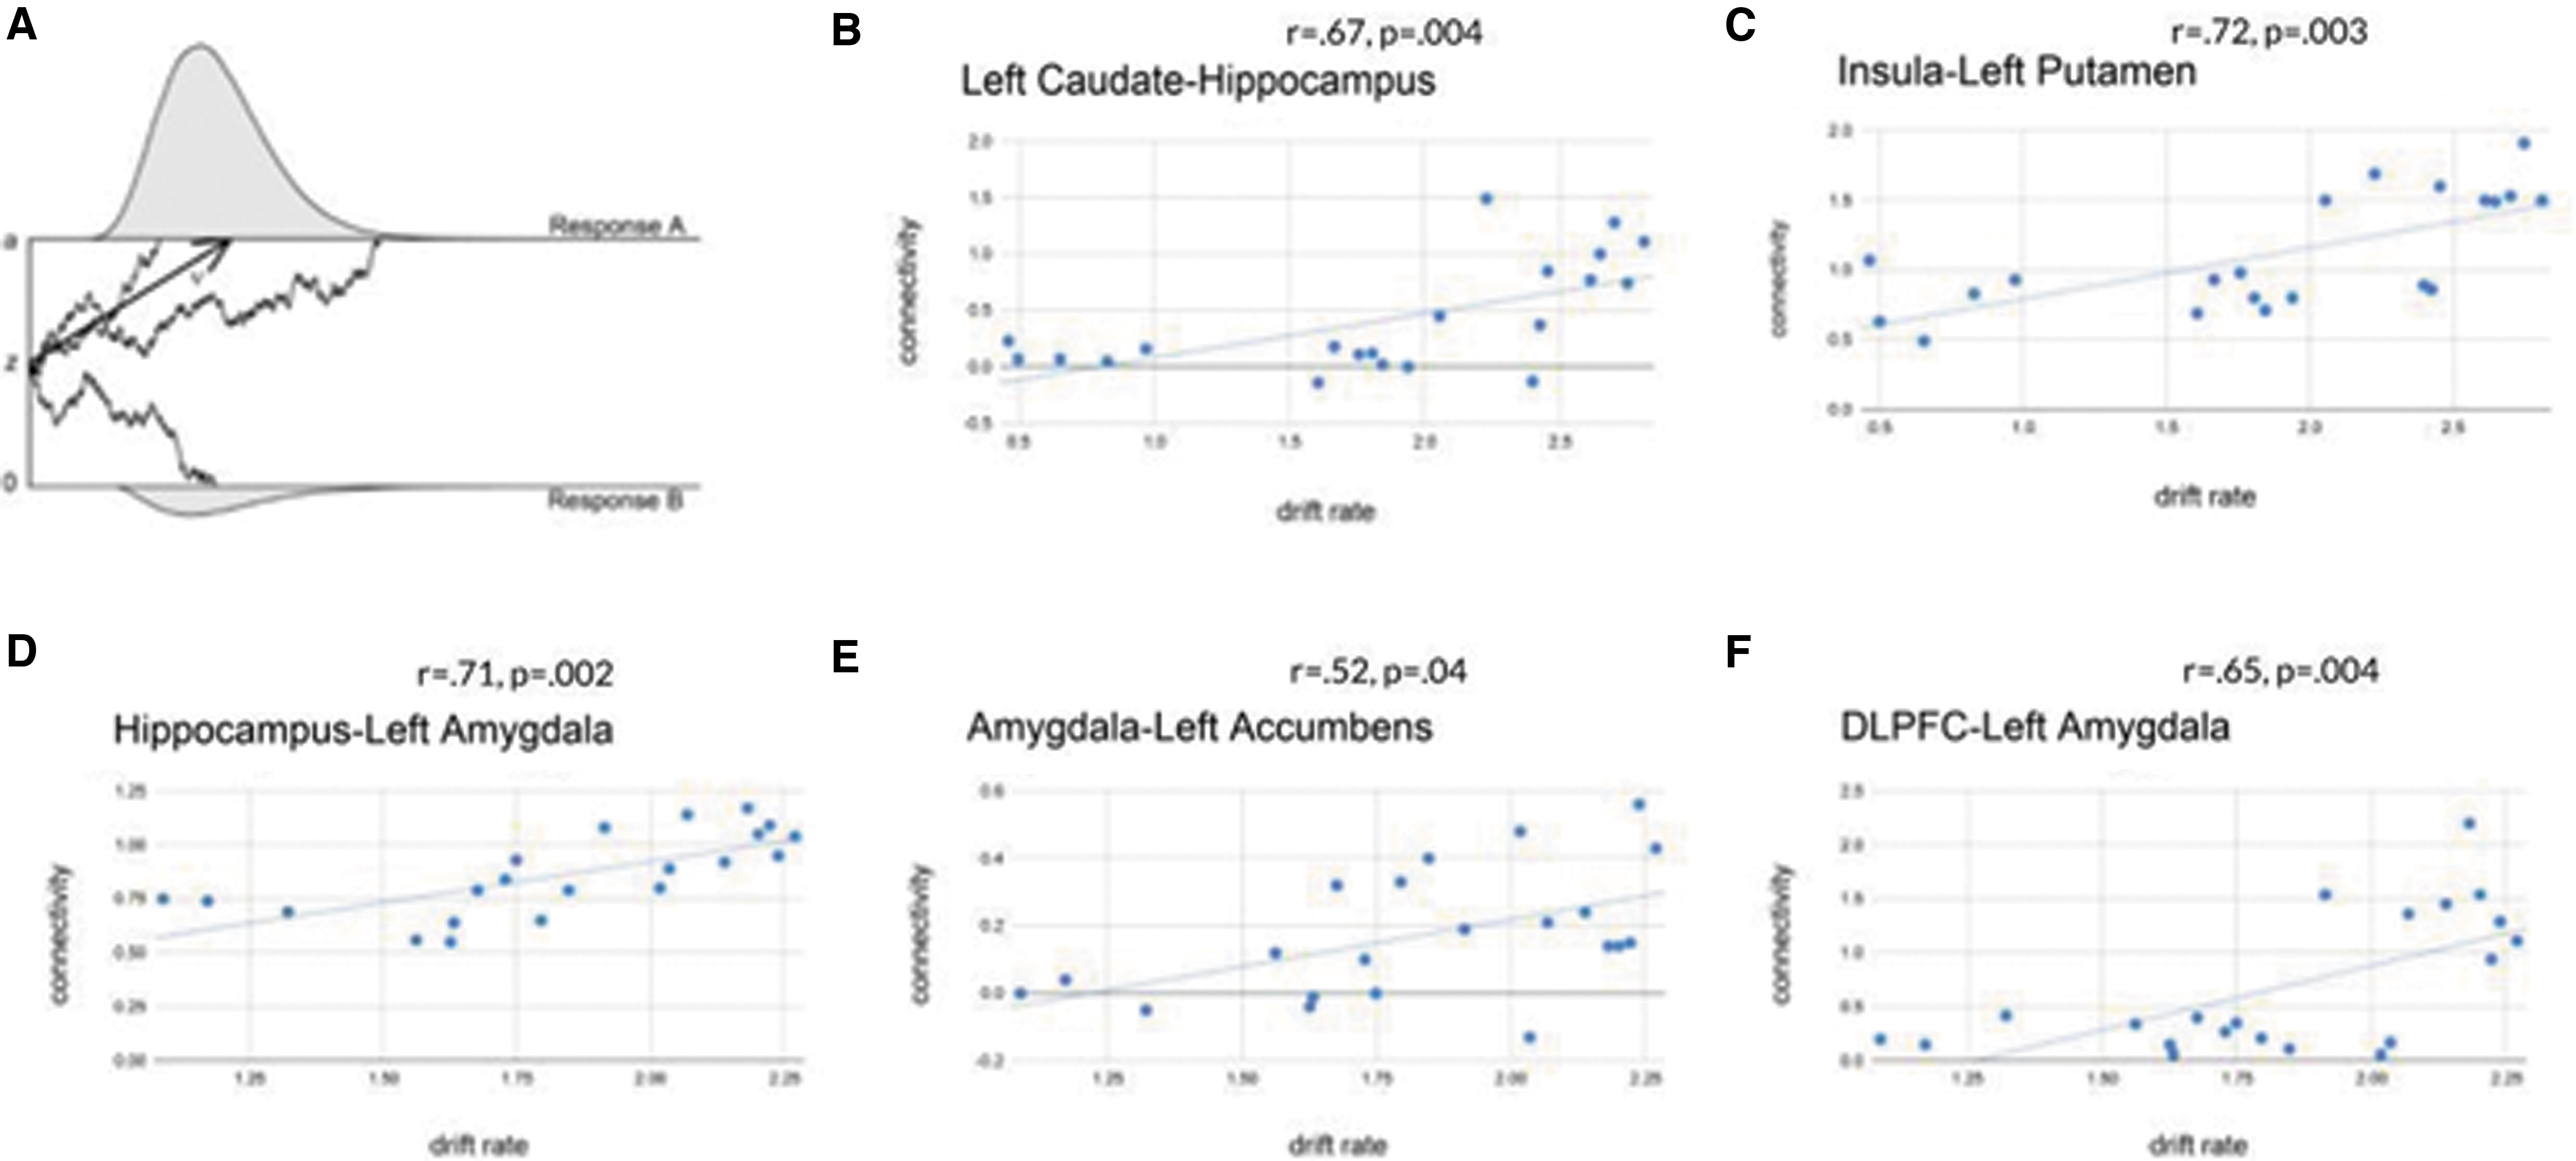
MDS reveals choice structures
To explore how choices are influenced by framing, choice counts for approach and avoidance decisions for each individual were converted to a distance matrix, containing values corresponding to how many times each option was chosen over other options (e.g., revealed preferences). The MDS projects this information into a multidimensional latent space. The MDS was iteratively performed to optimize model fit (minimize stress) and determine the distance/similarity between choice options: Items that are similarly preferred or nonpreferred will cluster together in MDS space. A three-dimensional structure was the best fit across the group. Ward's clustering was performed with three clusters, and the results were visualized as dendograms. Inspection of the clusters revealed that rather than feature-based clusters based on, for example, illnesses with similar symptoms, the clusters varied across participants. Among participants, cluster structure changed markedly based on decision frame; no participant had an identical clustering pattern for both approach and avoidance. Group summary dendograms are pictured in Figure 7, and a representative participant dendogram is available in the Supplemental Material A.
Discussion
To make a good decision about the future, one must make educated guesses about the most important factors involved and project that information onto a “future self.” There is often no objective correct choice in this case, only that which most accurately reflects the preferences and goals of the individual given the available information. We are frequently asked to make such decisions under time or financial constraints, such as picking a health insurance plan, college, or car. Given finite resources and time, we may need to rely on heuristics or “gut feelings” to guide our behavior. However, this can lead us astray if those “gut feelings” are themselves externally manipulated by the decision context, such as a pushy salesperson or overly friendly insurance representative.
Here, we found a replicable reaction time effect in two independent cohorts, whereby approach decisions were slower than avoidance decisions. Computational modeling revealed latent cognitive components of this process. Rate of evidence accumulation during approach decisions was related to strength of connectivity between corticostriatal and limbic nodes. The MDS and clustering revealed a three-dimensional choice structure that differed between individuals, and by frame within individuals. Taken together, these results suggest that cognitive evaluations of aversive counterfactuals involve flexible representations that can be altered by choice framing. These findings have broad implications for prospective decision making.
Our results suggest that both corticostriatal-limbic and limbic-limbic connectivity strength tracks most closely with rates of evidence accumulation when choosing which aversive stimulus to approach. Significantly stronger connectivity was observed during approach framing between left putamen and insula, left putamen and amygdala, DLPFC and mPFC, and left caudate and insula. Limbic-limbic and prefrontal-limbic connections strength were related to rates of evidence accumulation; in all cases, stronger connectivity correlated with longer durations of evidence accumulation. These results suggest two things: that the longer reaction time for approach decisions represents, in part, the latent cognitive process of accumulating evidence in favor or against choosing each option, and that corticostriatal-limbic connectivity strength is a neural index of this process. These results build on previous findings that both cortico-limbic and limbic-limbic connectivity strength differences underlie framing effects during choices between appetitive stimuli (Benoit et al., 2011; Mills-Finnerty et al., 2014). However note that other studies using different choice paradigms have found the greatest response in prefrontal regions (e.g., Foo et al., 2014; Murch and Krawczyk, 2014).
What does “evidence accumulation” mean in the context of counterfactual aversive choice? The MDS results suggest that participants represent the relative ranking, or cognitive distance between options, in complex, idiosyncratic ways that differ by frame. That is, choice rankings are not fixed structures that uphold the transitive property of A>B, B>C, therefore A>C, because the A > C choice may evoke comparison across a different dimensional loading than A > B and B>C. The best MDS fit across participants, optimized iteratively, involved a three-dimensional structure, suggesting at least three evaluative dimensions underlying choices for most individuals. Clustering results showed that these dimensions do not collapse neatly into feature-based sub-categories (such as illnesses with similar symptoms, or car accidents with similar causes). The dimensions may instead represent familiarity, affective value, or intensity. Future studies that quantify these factors could shed light on what dimensional properties underlie flexible representations.
These results extend previous neuroimaging findings related to aversive processing and approach–avoidance more generally, and framing more specifically. The regions identified as processing aversive stimuli in the neurosynth meta-analysis (study N = 238) generally matched the activation pattern observed for approach and avoidance decision making here (Fig. 2). We did not observe differences in BOLD activation for approach and avoidance choices. This may be because these conditions were first contrasted with a baseline rest condition, and then approach>rest was compared with avoidance>rest by using a t-test. It is possible that this might result in patterns of BOLD response related more generally to decision making or aversive processing. Use of a control condition that more closely resembled the task could help in identifying patterns more specific to approach and avoidance.
Our results provide a novel characterization of how brain network interactions support choice behavior. Three of the connections that tracked rate of evidence accumulation for approach choices were between the amygdala and the DLPFC, left accumbens, and hippocampus, resulting in the amygdala having the highest betweenness centrality score in the approach graph (the number of shortest paths in the network that pass through this node, indicating that this region may be a “hub”). These brain regions have shown sensitivity to framing effects in previous studies (De Martino et al., 2006; Foo et al., 2014). In addition, the amygdala has been implicated both causally in responding to loss aversion (Tremblay et al., 2014) and correlationally in responding with loss magnitude (Canessa et al., 2013) though these studies did not assess network connectivity. Our findings suggest that the amygdala may be central to the process of responding to potential losses and becomes more engaged (via strength and number of connections) when the decision scenario involves approach compared with avoidance.
Our results complement other neuroimaging studies of prospective thinking. For example, the vmPFC is implicated in representing emergent properties of imagined future scenarios, such as affective quality (Benoit et al., 2014). The well-known role of the vmPFC in tracking value (Levy and Glimcher, 2012) also seems to extend to encoding the value of specific qualities of imagined scenarios, which can, in turn, shape memory representations of affective value (Benoit et al., 2019). Here, the mPFC had connections to DLPFC and left caudate during avoidance decisions; whereas during approach decisions two additional connections to the left amygdala and left accumbens were identified, resulting in a higher betweenness centrality score. More research is needed to determine whether, as in previous studies, these additional connections support the knowledge integration necessary to encode emergent properties such as affective qualities of choice scenarios to motivate choice behavior.
Greater DLPFC-mPFC connectivity strength during avoidance choices was related to longer nondecision time, which represents the minimum time needed before initiating a choice. Though nondecision times were faster for avoidance, these results show that participants who had a greater lag to initiate choices have stronger prefrontal connectivity. The DLPFC-mPFC connection has been specifically implicated in contexts where attentional shifts are necessary to achieve a goal (Anderson et al., 2016) or executive control resources must be focused on to support task performance (Dixon and Christoff, 2014; Hutcherson et al., 2012). Notably, many studies interpret nondecision time as representing motor preparatory effects; however, our results suggest that prefrontal control mechanisms may also be implicated in a manner dependent on the choice context.
This study has several limitations. First, the network included in the graph analysis is not a comprehensive representation of the regions involved in decision making, which was done to limit model complexity but may negatively impact generalizability. Another limitation of this study is the use of two different scanners for data collection given the reported differences by the MRI manufacturer, make and model (Friedman et al., 2006; Zhao et al., 2018). Analyses incorporating scanner site into models predicting reaction time, drift diffusion parameters, and connectivity values found differences between scanning sites in speed of reaction time and GLM response to approach frames (Supplementary Material C). Computational modeling parameters appeared to be less impacted by scanning site; the original pattern of differences in drift diffusion and connectivity parameters by choice frame held with scanning site added to models, and for all but one connectivity edge, the scanning site did not itself independently predict outcomes. However, these findings do suggest that scanning site differences impact measurement, and they emphasize the importance of quantifying this impact in multi-site studies.
In sum, we show that the computations underlying aversive counterfactuals are complex, rely on connectivity among corticostriatal-limbic regions, and involve flexible representations that can be manipulated by choice framing. Aversive counterfactual choices may rely on phylogenetically older limbic regions more so than rational (prefrontal) brain. These results have wide implications for the optimal context in which decisions about the future should be made to ensure congruence between goals and outcomes (e.g., purchasing life insurance preventatively, vs. in response to a health scare or overbearing sales representative). More work is needed to better help individuals identify their most accurate preferences and make choices resilient to external manipulations.
Footnotes
Authors' Contributions
C.M.F. designed the study, collected the data, performed data analysis, and wrote the article. M.K. performed data analysis. C.H. and S.J.H. designed the study, consulted on data analysis, and edited the article.
Author Disclosure Statement
No competing financial interests exist.
Funding Information
Writing of this article was supported by the Office of Academic Affiliations, Advanced Fellowship Program in Mental Illness Research and Treatment, Department of Veterans Affairs. This work was additionally supported by a grant from the James S. McDonnell Foundation to Dr. S. J. Hanson, a Career Development Award awarded to Dr. Mills-Finnerty (CDA # 1 IK2 CX001916), and a Center for Neurobiological Imaging Innovation Award to Dr. Mills-Finnerty.
Supplementary Material
Supplementary Material A
Supplementary Material B
Supplementary Material C
References
Supplementary Material
Please find the following supplemental material available below.
For Open Access articles published under a Creative Commons License, all supplemental material carries the same license as the article it is associated with.
For non-Open Access articles published, all supplemental material carries a non-exclusive license, and permission requests for re-use of supplemental material or any part of supplemental material shall be sent directly to the copyright owner as specified in the copyright notice associated with the article.
