
Abstract
Background:
Alzheimer's disease (AD) is associated with impairment of large-scale brain networks, disruption in structural connections, and functional disconnection between distant brain regions. Although decreased functional connectivity has been thoroughly investigated and reported by existing functional neuroimaging literature, this study investigated network-based differences due to the structural changes in white matter pathways in AD patients. We hypothesize that diffusion metrics of disrupted tracts that go through cognitive networks related with intrinsic awareness, motor movement, and executive control can be utilized as biomarkers to distinguish prodromal stage from AD stage.
Methods:
Diffusion MRI data of a total 154 subjects, including patients with clinical AD (n = 47) and patients with mild cognitive impairment (MCI) (n = 107) was used. To study structural changes associated with white matter fiber pathways voxel-averaged diffusion metrics and fiber density metrics were calculated.
Results:
Study revealed that AD patients exhibit disruptions in intrahemispheric tracts and projection fiber tracts as suggested by diffusion indices. Our whole brain analysis revealed that network differences within default mode network (DMN), sensory motor network, and frontoparietal networks are associated with disruption in inferior fronto-occipital fasciculus (IFOF), corticospinal tract, and superior longitudinal fasciculus. Global function revealed by Mini Mental State Examination correlate with those fiber pathways that form reciprocal connections within networks associated with motor movement and executive control.
Conclusion:
Diffusion metrics appear to be more sensitive than fiber density metrics in differentiating the structural changes in the white matter. Decreased fractional anisotropy along with increased mean diffusivity and radial diffusivity in forceps minor, corticospinal tract, and IFOF as an imaging biomarker would be ideal to distinguish AD patients from MCI patients. Difference of DMN, sensory motor network, and frontal parietal network in our study reveals that AD patients may suffer from poor motor movement and degraded executive control.
Impact statement
This study presents ongoing mechanism of atrophy and degeneration in white matter fiber tracts in the prodromal stage and Alzheimer's disease (AD) state along with network-based alteration. Another interesting finding is that diffusion metrics appear to be more sensitive than fiber density metrics in differentiating the structural changes in the white matter between mild cognitive impairment and AD patients. This study reveals that diffusion metrics of disrupted tracts that go through the brain networks related with intrinsic awareness, motor movement, and executive control can be utilized as imaging biomarkers.
Introduction
Alzheimer's disease (AD) is a progressive disorder and the most common cause of dementia (Burns and Iliffe, 2009). Dementia is characterized by decline in thinking, behavioral, and social skills that alter a person's ability to perform daily task (Cunningham et al., 2015). Mild cognitive impairment (MCI) is a prodromal stage for AD in which decline in memory or other thinking skills is greater than what would be expected for a person's age, but this decline does not prevent a person's ability to perform daily tasks (Neugroschl and Wang, 2011). Neurodegenerative disorders are consistent with molecular neuropathological features along specific neuronal brain networks that cause impairment of brain networks (Drzezga, 2018). Recent studies suggest that default mode network (DMN) in AD patients exhibit metabolic disruptions and atrophy that was consistent with decreased functional connectivity (Buckner et al., 2008; Drzezga, 2018; Zhou et al., 2012). Simultaneous molecular, metabolic, and functional changes in brain networks could be explained by the presence and disruption of structural connections (Mito et al., 2018). Network-based changes can be identified by understanding the disruptions and the structural changes in white matter pathways that connect or pass through these networks.
To study structural changes associated with fiber tracts diffusion-weighted imaging (DWI) has been widely used, which is based on the principle of rate of water diffusion. Most of the DWI studies have used a special kind of DWI, diffusion tensor imaging (DTI) as it provides voxel-averaged metrics that reflect the degree and direction of water diffusion that further reflect the integrity of white matter. DTI offers range of measures or metrics that might be sensitive to pathology such as fractional anisotropy (FA), mean diffusivity (MD), axial diffusivity (AxD), and radial diffusivity (RD). FA is the degree to which diffusion of water molecules is anisotropic, whereas rate of diffusion in the principal diffusion direction is AxD and rate of diffusion perpendicular to the principal diffusion direction is RD. MD captures the average rate of diffusion in all directions (Feldman et al., 2010). In earlier studies Increased MD, RD in AD patients was suggested to be consistent with decreased connectivity in networks, highly statistically significant and far more sensitive than FA reductions (Acosta-Cabronero et al., 2009).
Fixel-based analysis (FBA) is based on the analysis of DWI data using constrained spherical deconvolution, which enables characterization of multiple fiber orientations within voxels (Tournier et al., 2004). FBA technique offers metrics such as fiber density (FD), fiber density cross section (FDC) that can reflect differences in the density of fibers within a fiber bundle along with differences in the fiber-bundle cross section or diameter. Fiber density cross section (FDC) metric is a product of FD and FC, which reflect differences arising from both density and cross-sectional loss of fiber bundles (Raffelt et al., 2017). In a recent study, some fiber pathways such as the parahippocampal cingulum reported fiber density decrease >40% and superior longitudinal fasciculus (SLF) reported for fiber bundle cross section decrease in AD patients compared with healthy subjects (Mito et al., 2018).
To understand the mechanism of atrophy and changes in white matter fiber tracts during prodromal stage and AD stage in Chinese population we will calculate diffusion indices, fiber density reductions in white matter fiber tracts, and try to find if these indices have any relationship with cognitive scores. We hypothesize that diffusion metrics of disrupted tracts that go through cognitive networks related with intrinsic awareness, motor movement, and executive control can be utilized as biomarkers to distinguish prodromal stage from AD stage. In addition, we selected specific fiber tracts so as to test if the loss of fiber density and fiber cross-section (FC) in white matter pathways is higher in AD patients as compared with MCI cohort. MCI being a transitional stage between normal aging and AD makes it critical to identify disruption of fiber tracts suggested by FA and MD along with changes in FDC between MCI and AD patients.
Biomarkers that point toward relevant network connectivity, pattern of alteration in fiber tracts, region-specific structural change can provide doctors more clues to understand conversion to AD state from the prodromal stage. Existing neuroimaging results from T1-weighted three-dimensional high-resolution images suggest prefrontal cortex and the hippocampal volume loss as a potential signature to detect conversion from MCI to AD (Uylings and de Brabander, 2002). Functional connectivity results suggest difference in DMN connectivity along with hyperconnectivity in the anterior DMN and hypoconnectivity in the posterior DMN as biomarkers to diagnose AD (Marquez and Yassa, 2019). Past study on AD patients used cross-sectional data from very mild and mild AD patients as well as a longitudinal data to suggest increased AxD and MD as “state-specific” markers that would distinguish very mild and mild AD patients, whereas increased RD along with decreased FA as “stage-specific” that would be ideal for monitoring disease progression (Acosta-Cabronero et al., 2012). In this study, we will investigate difference in pattern of white matter changes or structural change and if those can be utilized as imaging biomarker.
Materials and Methods
Participants
The present study was granted IRB approval by Taipei Tzu Chi General Hospital, Taipei, Taiwan. This study consisted of a total 154 subjects, including patients with clinical AD (n = 47, mean age = 74.8, standard deviation [SD] = 10.7) and patients with MCI (n = 107, mean age = 76.9, SD = 8.09). Patients were recruited at Taipei Tzu Chi Hospital, Taiwan. Mini Mental State Examination (MMSE) and CDR scores were collected for 47 AD patients and 107 MCI subjects (Table 1).
Clinical and Demographic Data of Participants
AD, Alzheimer's disease; MCI, mild cognitive impairment; SD, standard deviation.
Image acquisition
Data were acquired using a 3 T Siemens, with a 12-channel head coil receiver. DWI acquisition was performed with the following parameters: 154 axial slices, repetition time/echo time = 6000/80.3 msec, 128 × 128 acquisition matrix, and diffusion-weighted images (b = 1000 sec/mm2), and one volume without diffusion weighting (b = 0 sec/mm2) were obtained with echo planar imaging. Whole-brain DTI acquisition was performed with a multislice single-shot spin echo planar pulse sequence (TE = 76 msec, TR = 9000 msec) using 78 diffusion-encoding directions, isotropically distributed over the surface of a sphere with electrostatic repulsion, acquired at b = 1000 sec/mm2, one acquisition at b = 0 sec/mm2, slices of 4 mm thickness each, and a 128 × 128 acquisition matrix.
Tract-based spatial statistics
DICOM files were converted to NIfTI using dcm2nii (Li et al., 2016). Tract-based spatial statistics (TBSS) were carried out using FMRIB Software Library (FSL) (Smith et al., 2006). The preprocessing steps included EDDY current correction and motion correction. Brain extractions were completed using the FSL brain extraction tool (bet) from the FSL GUI, and DTIFit was used to calculate diffusion parameters using the bvecs files. FA images were normalized to an FA template in Montreal Neurological Institute (MNI) space using the nonlinear registration algorithm FNIRT. Nonlinear registration was performed by using FNIRT tool, used for small-displacement nonlinear registration. Past study proposed FNIRT algorithm, which is a nonlinear optimization procedure that aims to minimize the sum-of-squared differences between two images (input and reference) (Andersson et al., 2008). Mean FA image was calculated from the spatially normalized images of all subjects and then “skeletonized” to allow for the comparison of FA values across spatially matched tract structures across all subjects. FA data of each subject were projected on the mean sample-based FA skeleton. Similar procedure was followed to calculate the MD, RD, and AxD. Connectivity was calculated based on TBSS analysis as it allows to see voxel to voxel connectivity in white matter tracts. Similar to a past study, atlas provided in FSL was used to extract the networks through which the affected or disrupted tracts pass through (Mito et al., 2018).
Statistical analyses
The projected FA data were fed into generalized linear model (GLM) and voxelwise whole-brain statistical analyses (two sample t tests) were performed to visualize FA skeleton voxels that were significantly different between two groups of subjects in terms of FA values. Whole-brain familywise error (FWE) corrected p-maps were thresholded at an FWE of 0.05 to visualize significant tracts. To present TBSS results, FMRIB 58 FA Image was used as a background image where the FA statistics were projected. The anatomic locations of significant voxel clusters with respect to WM tracts were determined in MNI152 atlas space using the Johns Hopkins University (JHU) ICBM-DTI-81 White-Matter Labeled Atlas and the JHU White-Matter Tractography Atlas both available in FSL. Similar procedure was followed to visualize skeleton voxels that were significantly different between two groups of subjects in terms of MD and RD values.
Fixel-based processing and analysis
All fixel-based processing steps were carried out using MRtrix3 (Raffelt et al., 2017). The DWI DICOM images were converted to NIfTI format. Furthermore, the data were converted to MRtrix3 format (“.mif”) using mrconvert. The preprocessing of diffusion-weighted images included denoising the data followed by motion and distortion correction. Bias field correction was done as a preprocessing step to eliminate low-frequency intensity inhomogeneities by first estimating the bias field from the DWI b = 0 data, then applying the field to correct all DW volumes. This was followed by performing Global intensity normalization across subjects.
After computing a group white matter response function by averaging white matter response function from every subject Upsampling of DWI data to an isotropic voxel size of 1.3 mm was done to increase anatomical contrast and improve downstream template building, registration, tractography, and statistics. After these steps fiber orientation distributions (FODs) for each subject were estimated using single-shell constrained spherical deconvolution using group average response function obtained before. A study-specific population FOD template was produced by iterative nonlinear registration and averaging of the FODs of 40 subjects (20 AD and 10 MCI). Subsequently, FODs of all subjects were nonlinearly registered to the population template.
A tractogram was produced using the whole-brain probabilistic tractography on the population template. First, 20 million streamlines were generated, which were then filtered down to 100,000 streamlines using the spherical deconvolution informed filtering of tractogram (SIFT) algorithm to reduce reconstruction biases.
Statistical analysis
Statistical analysis using connectivity-based fixel enhancement was performed separately for each metric [FD, log (FC), and FDC], using 100,000 streamlines from the template tractogram, and with default smoothing parameters (Raffelt et al., 2015). FWE-corrected p-values were then assigned to each fixel using permutation testing >5000 permutations (Nichols and Holmes, 2002). Significant fixels (FWE-corrected p-value <0.05) were then displayed using the mrview tool in MRtrix3.
Data availability
The data that support the findings of this study are available from the corresponding authors upon reasonable request.
Results
FA, MD, AxD, and RD differences in AD and MCI patients
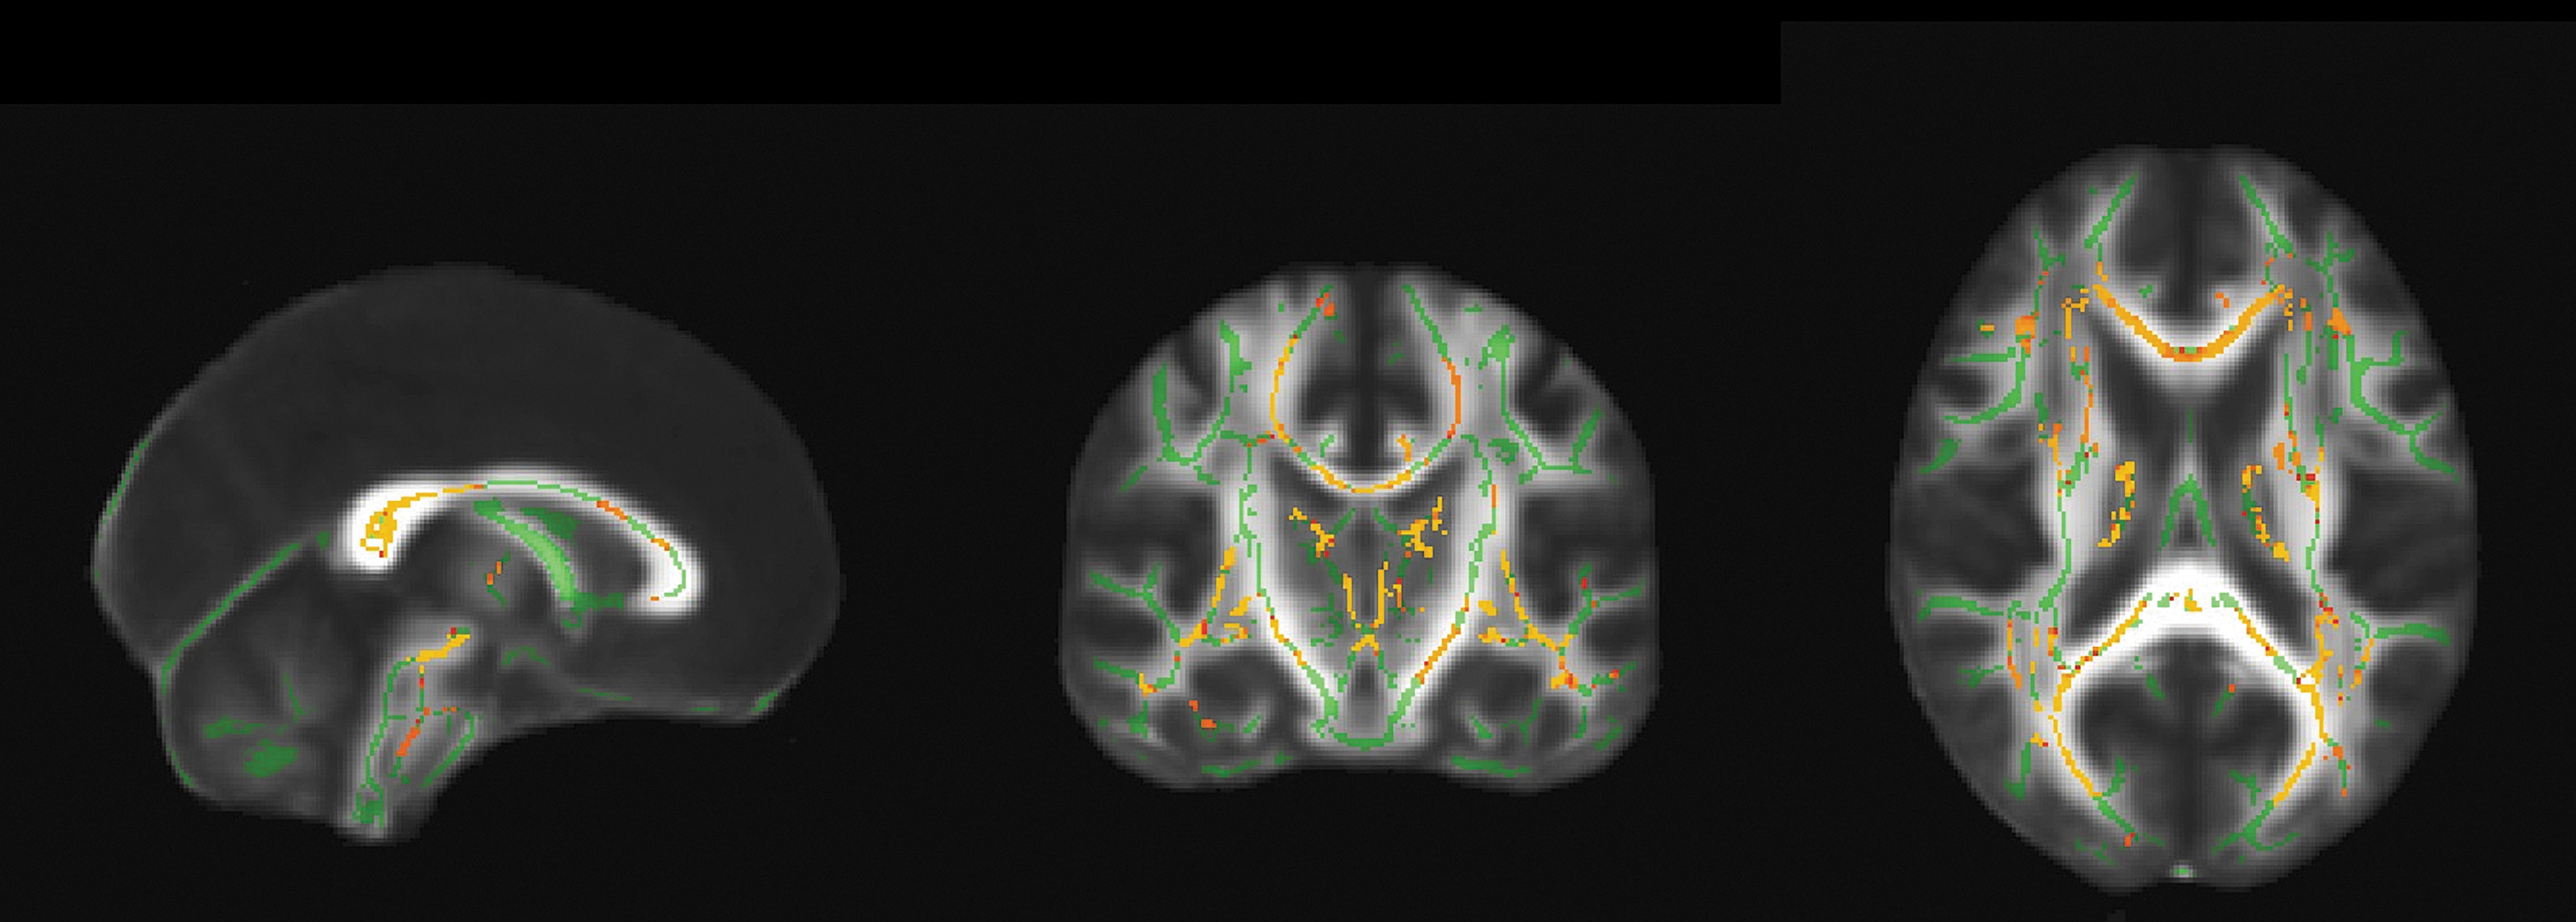
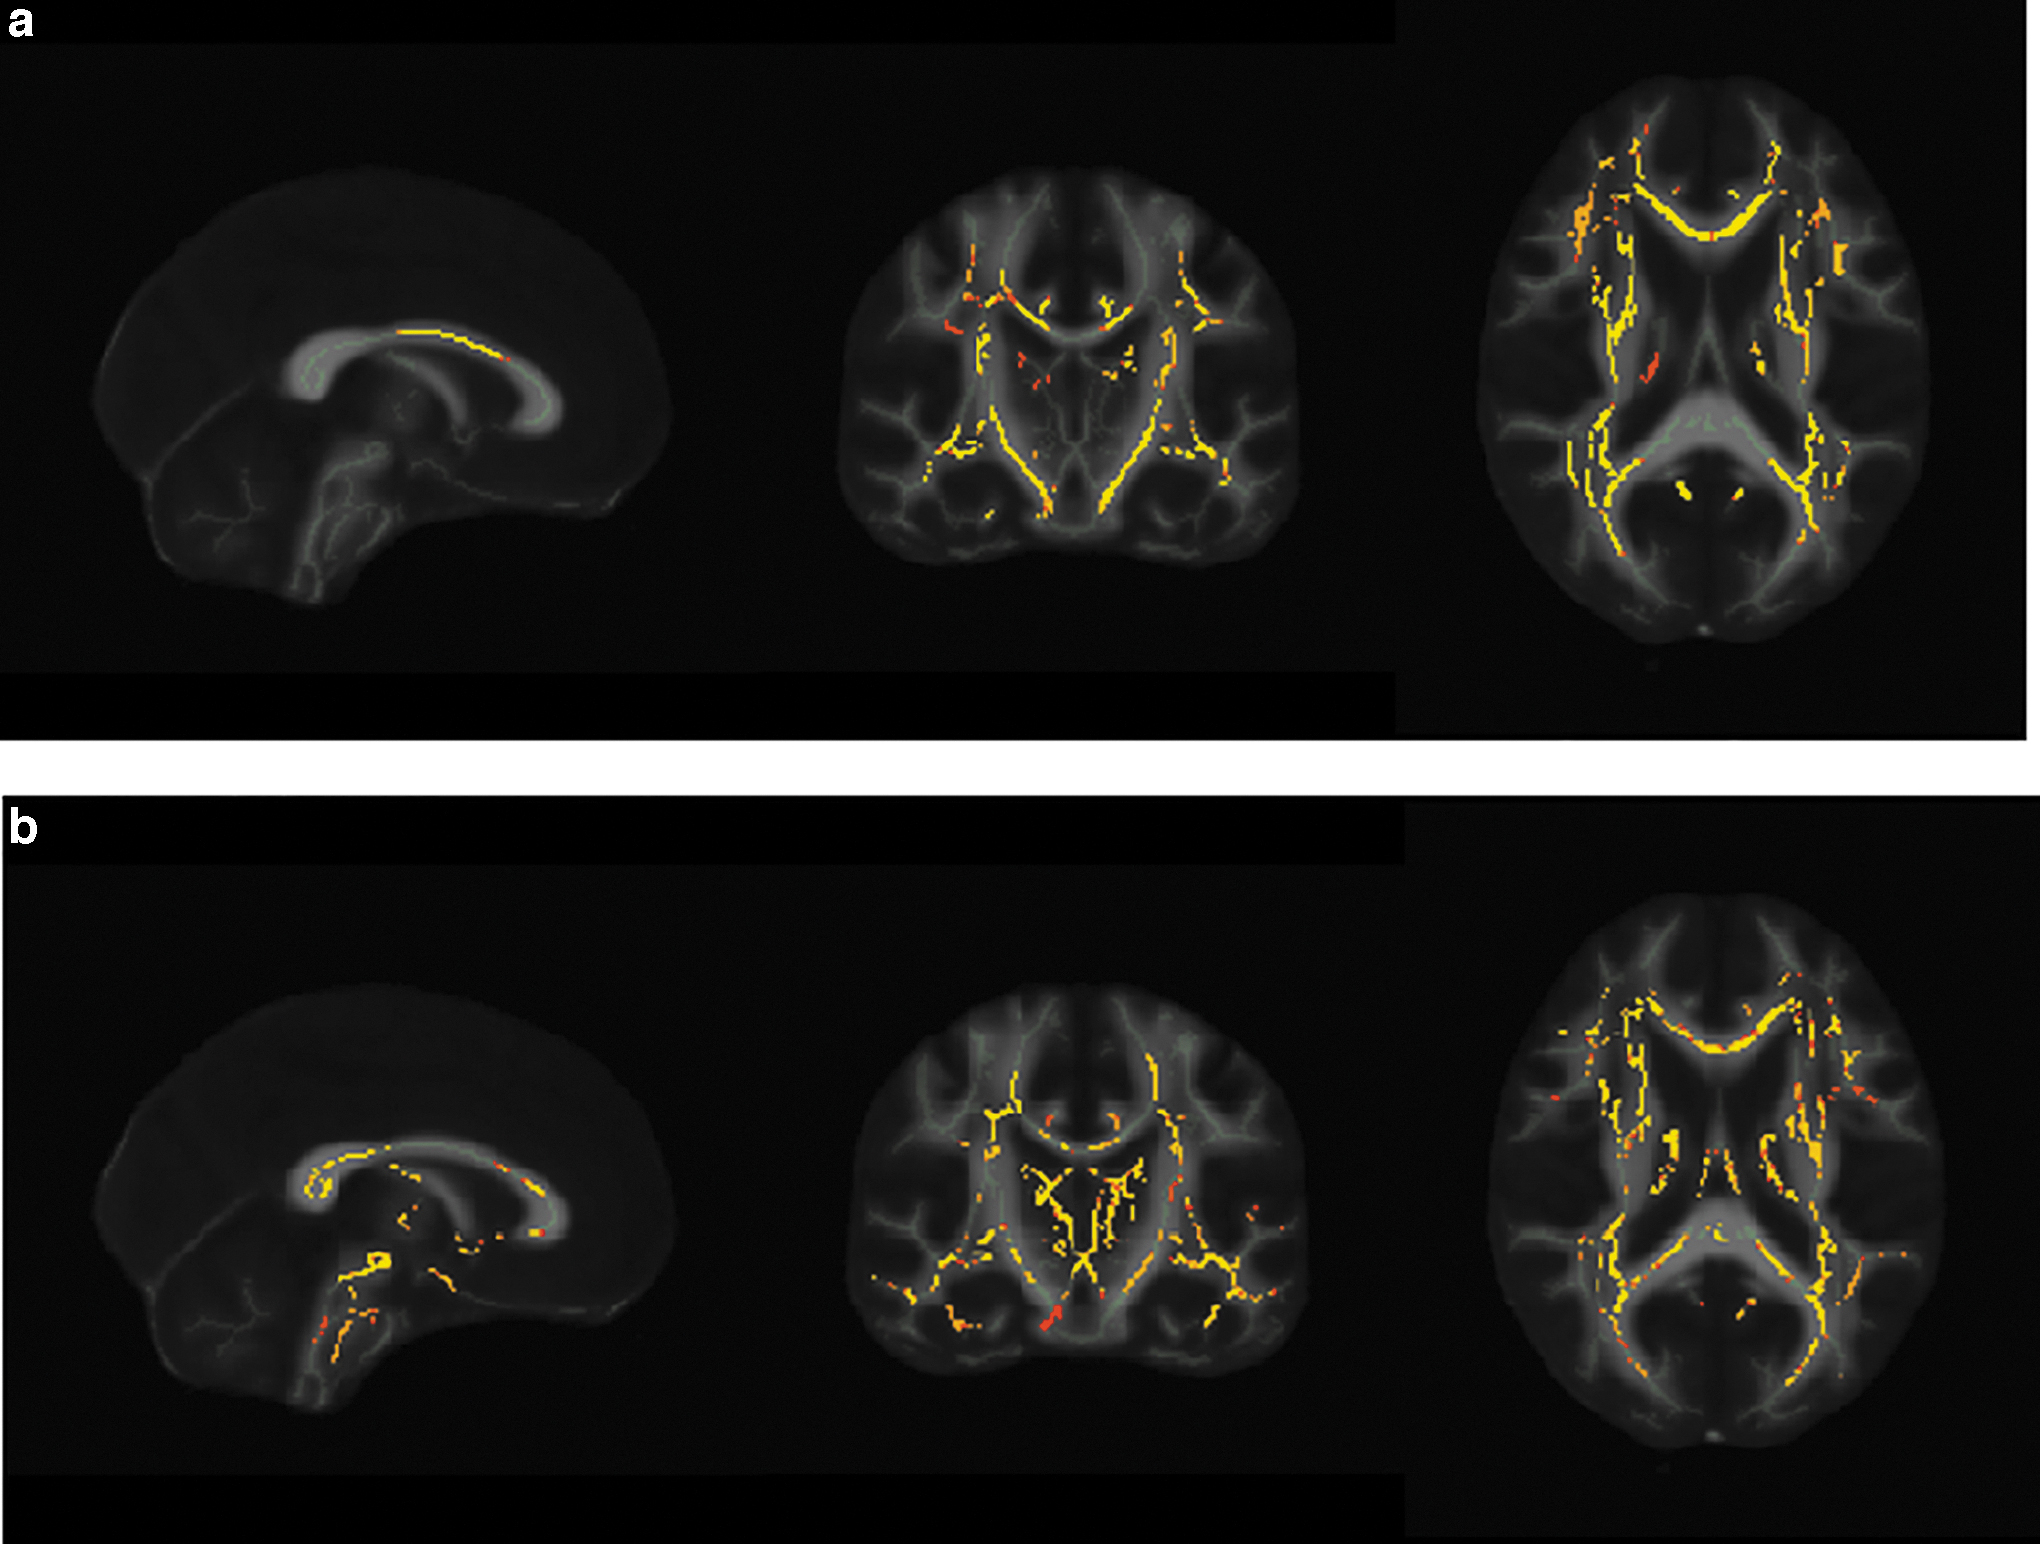
AD patients had lower FA value in certain white matter fiber pathways in contrast to MCI group .The white matter regions that reported for a decreased FA were inferior longitudinal fasciculus, forceps minor, forceps major, SLF, anterior thalamic radiation, inferior fronto-occipital fasciculus (IFOF), and corticospinal tract (Fig. 1). TBSS analysis showed that AD patients had higher MD in contrast to MCI group. The white matter tracts that accounted for high MD in AD patients as compared with MCI group were forceps minor, corticospinal tract, SLF R, and IFOF (Fig. 2a; Table 2). No significant decrease was accounted for AxD when the AD group was compared with MCI group. AD patients accounted for higher RD than the patients of the MCI group. The white matter tracts that reported higher RD in AD patients were forceps major, forceps minor, anterior thalamic radiation, corticospinal tract inferior longitudinal fasciculus, and IFOF (Fig. 2b; Table 2).
FA reductions in AD patients. Pattern of decreased FA (yellow–red) in AD cohort in contrast to MCI group overlaid on white matter skeleton (green) corresponding to significant voxels on white matter tracts (p < 0.05, FWE corrected). AD, Alzheimer's disease; FA, fractional anisotropy; FWE, familywise error; MCI, mild cognitive impairment.
MD and RD increases in AD patients.
Comparison of Fractional Anisotropy, Mean Diffusivity, and Radial Diffusivity Values Between Mild Cognitive Impairment and Alzheimer's Disease Cohorts
p < 0.05, *significant, **highly significant.
FA, fractional anisotropy; MD, mean diffusivity; RD, radial diffusivity.
Correlation with MMSE scores
Negative effect of MD with MMSE scores was seen in forceps minor, corticospinal tract, SLF, and inferior longitudinal fasciculus when the AD and MCI patients were treated as one group (Fig. 3). Insignificant positive correlation of FA with MMSE scores in the inferior longitudinal fasciculus, SLF, and IFOF was seen when the AD and MCI patients were treated as one group.

Correlation of MD with MMSE scores. Pattern of negative correlation of MD (yellow–red) with MMSE scores visualized on significant voxels of white matter fiber tracts (p < 0.05, FWE corrected). MMSE, Mini Mental State Examination.
Difference in fiber density cross section in specific tracts
The tracts that earlier reported for decreased anisotropy and increased diffusivities (mean, radial) were investigated for change in FDC (product of FD and FC), to encapsulate changes related both to micro- and macrostructural axonal loss. This analysis investigated FDC changes in corticospinal tract, forceps minor, and IFOF. All the mentioned tracts reported decrease in terms of fiber density cross section in AD patients as compared with MCI patients; however, the decrease was statistically insignificant (Fig. 4).

FDC reductions in AD patients as compared with MCI patients. Significant streamlines are displayed across axial slices of the population template map colored by effect size decrease (red–yellow) of FDC in the AD patients as compared with the MCI group for
Discussion
In this study, we calculated diffusion metrics and measures of fiber density to detect structural changes in white matter as indicator to distinguish AD patients from MCI patients. This thorough investigation about fiber tract disruptions and networks associated with these degenerated tracts offers valuable findings pertaining to changes in white matter during conversion from a prodromal stage to AD. The significant findings of the study revealed that AD patients exhibit disruptions in intrahemispheric tracts and projection fiber tracts suggested by diffusion indices. The disrupted intrahemispheric tracts included the inferior longitudinal fasciculus, SLF, and IFOF. Corticospinal tract was the disrupted projection fiber along with disruptions in forceps minor and forceps major. Second, network differences within DMN, sensory motor network (SMN), and frontoparietal networks are associated with disruption in white matter pathways that have reciprocal connections within these networks. Our study reports for negative relationship of MD with MMSE scores in forceps minor, corticospinal tract, SLF, and inferior longitudinal fasciculus.
Disruptions in intrahemispheric and projection fiber tracts and white matter changes related to aging
Decreased FA was spatially extensive in AD subjects; however, significant effects of decreased FA in comparison with MCI cohort were observed in voxels of specific fiber pathways; in particular, the inferior longitudinal fasciculus, forceps minor, forceps major, SLF, anterior thalamic radiation, IFOF, and corticospinal tract. These findings were consistent with existing literature (Chen et al., 2015; Mayo et al., 2019; Serra et al., 2010). Lower FA reflects extensive demyelination and light axonal packing as it would leave more intercellular water than dense packing (Feldman et al., 2010). Existing literature reports that inflammation and edema is consistent with decreased FA (Alexander et al., 2007). This situation suggests that disruption in SLF, forceps minor, corticospinal tract, forceps major, and inferior fronto-occipital fasciculus can be associated with inflammation and edema.
Our results revealed increased MD and RD in forceps minor, corticospinal tract, and IFOF for AD patients. In addition, SLF accounted only for higher MD, whereas inferior longitudinal fasciculus, anterior thalamic radiation accounted for higher RD. Increased RD reflects myelin disruption along with axonal loss (Feldman et al., 2010; Reginold et al., 2016). Demyelination and the inability of the oligodendrocytes cells to repair myelin damage are reported consistent with AD (Nasrabady et al., 2018). This situation suggests that forceps minor, corticospinal tract, IFOF, and inferior longitudinal fasciculus undergo demyelination and axonal loss suggested by increased RD. Disruption of corticospinal tract and IFOFs in patients with parkinsonian disorder has been revealed earlier by diffusion tractography (Kvickström et al., 2011). Difference of diffusivity metrics between AD and MCI patients reveal that decreased FA along with increased MD and RD in forceps minor, corticospinal tract, and IFOF as an imaging biomarker can distinguish AD patients from MCI patients.
FD represents axonal density, whereas FC approximates relative fiber bundle diameter or size and the FDC, which is product of FD and FC, encapsulates changes related both to micro- and macrostructure. Studies suggest increased axonal packing and fiber bundle size to be consistent with increase in structural connectivity over the course of neurodevelopment (Dennis et al., 2013; Hagmann et al., 2010). This increase in structural connectivity has also been related to developmental increases in network connectivity (Bennett and Rypma, 2013; Hagmann et al., 2010). On the contrary, decreased fiber bundle size and lower axonal density reflects decrease in structural as well as network connectivity. Results of the study revealed for decrease in axonal density and fiber bundle size for AD patients in contrast to MCI subjects; however, the decrease was statistically insignificant. This situation suggests that elderly people undergo significant loss in terms of fiber density with aging such that conversion from an MCI stage to AD involves minor changes in terms of loss of density and bundle diameter of fiber tracts. These findings provide support to theories that report for white matter changes reflected by loss in axonal density and fiber bundle size in the MCI stage.
Past study used DTI to reveal substantial differences in white matter tracts with aging, where association fibers were found to be associated with most pronounced declines and advanced age was associated with greater changes in RD and FA, independent of fiber type (Bender et al., 2016). Recent study examined the alteration of fiber bundle density and fiber cross-section with aging using FBA (Choy et al., 2020). This study observed widespread age-related changes in FD and FC across the whole brain. The degree of the linear association between fiber density and age was not homogeneous across major fiber tract groups as some fiber tract groups were found to be more vulnerable to aging process than others. Fiber tracts connecting to the frontal lobe, including the cingulum of the cingulate gyrus and forceps minor, reported significantly lower FD and FC values in the aging brain than other tracts.
Network-based differences in DMN, SMN, and frontal parietal network
The disrupted fiber pathways identified in the study connect those brain networks that have been earlier reported as functionally declined in AD in particular the DMN (Brier et al., 2014; Delbeuck et al., 2003; Jones et al., 2016; Palop et al., 2006; Zhou et al., 2012). IFOF is believed to be connected with angular gyrus, which is one of the functional hub of the DMN (Fig. 5a) (Mito et al., 2018). Disconnections in DMN regions would be consistent with disruption of the IFOF as it is connected to hubs of DMN. The results of the study are consistent with existing neuroimaging literature as degeneration of DMN has been suggested by using approaches that include measurement of glucose metabolism, measurement of structural atrophy, and measurement of intrinsic and task-evoked brain activity (Buckner et al., 2008).

Fiber pathways connecting brain networks.
High-dimensional independent component analysis in AD patients reveals that functional connectivity damage in AD is not only restricted to DMN, but SMN regions also exhibit decreased functional connectivity (Dipasquale et al., 2015). The decrease in functional connectivity has also been related to decreased structural network connectivity (Bennett and Rypma, 2013; Hagmann et al., 2010) .The corticospinal tract connects regions of SMN as it originates in several parts of the brain, including the primary somatosensory cortex and premotor areas (Fig. 5b) (Chenji et al., 2016; Mollet, 2008). Difference in SMN regions would be consistent with disruption of the corticospinal tract as it forms reciprocal connections between sensory motor regions.
Previous studies suggest reduced functional connectivity is not only within DMN, but also within frontal parietal network (FPN) (Zhang et al., 2019). Furthermore, neuroimaging literature suggests that decrease in functional connectivity is also related to decreased structural network connectivity (Bennett and Rypma, 2013; Hagmann et al., 2010). SLF connects the frontal, occipital, parietal, and temporal lobes (Kamali et al., 2014; Wang et al., 2016). FPN includes regions of the lateral prefrontal cortex and posterior parietal cortex that are connected by SLF (Fig. 5c). Network changes in FPN would be consistent with disruption of SLF as this fiber pathway likely connects lateral prefrontal cortex and posterior parietal cortex. These findings reveal that structural changes in white matter cause network-based changes and AD is associated with the disconnectivity of large-scale functional networks.
Correlation of diffusion metrics with measures of cognitive function
A previous study revealed that although no strong correlation was observed between DTI metrics and MMSE scores but DTI metrics together with clinical features such as MMSE scores have the capability to classify AD patients from healthy controls (Patil and Ramakrishnan, 2014). Maximum classification accuracy was achieved when FA along with MMSE score were used as the feature set for classifier. Another study reported that there may not be a linear relationship between the degree of white matter disruption suggested by DTI metrics and memory scores in AD (Mayo et al., 2019). FA and MD did not correlate with MMSE score when Parkinson's disorder and Parkinson's disorder-dementia groups were examined separately but when both groups were combined the FA values correlated positively with the MMSE scores (Kamagata et al., 2013). Consistent with aforementioned studies no significant relation between MMSE score and diffusion metrics was found in our study when both the groups were examined separately. In contrast to earlier studies that suggest insignificant relation between MMSE scores and DTI metrics, our results show negative relationship of MD with MMSE scores in forceps minor, corticospinal tract, SLF, and inferior longitudinal fasciculus when both the AD and MCI patients were combined (Kamagata et al., 2013; Mayo et al., 2019; Patil and Ramakrishnan, 2014).
Study on relationship between white matter lesion and cognition impairment in early-stage AD reveals that white matter lesions are prevalent in early-stage AD, and their presence influences cognitive impairment (Burns et al., 2005). White matter lesions are distinct from pathological changes associated with AD, but when combined the level of global cognitive impairment increases. Reduced ability of brain to compensate for white matter lesions due to presence of AD neuropathological changes increases the relationship between white matter lesions and cognitive impairment. Global cognitive impairment was consistent with impairments in visual memory, processing speed, and executive function in AD patients. Difference of DMN, SMN, and FPN in our study reveals that AD patients may suffer from poor motor movement and degraded executive control.
Another study revealed that in patients with extensive white matter lesions reduced callosal diffusion anisotropy and callosal atrophy were strongly correlated with global cognitive impairment (Otsuka et al., 2012). Correlation of reduced callosal diffusion anisotropy also termed as deep white matter diffusivity with global cognitive impairment was stronger than correlation of white matter lesion volume with cognitive impairment. Callosal atrophy was suggested as surrogate marker of hemispheric deep white matter tract damage, and callosal as well as DTI parameters of the white matter were suggested useful for monitoring disease progression. However, in our study we do not see any strong correlation between the MMSE score and callosal parameters instead the projectional and interhemispheric tracts play more important roles in global functioning measured by MMSE.
Limitations
There are certain limitations to our study. The cross-sectional study design limited our ability to investigate stage-specific white matter degenerative changes over the progression from MCI to AD in the same cohort. Future longitudinal studies that investigate the white matter degeneration of MCI patients who progress to AD are likely to provide more sensitive imaging biomarkers pertaining to individual variability. Our study recruited twice the number of MCI patients than the AD patients, recruiting an equal sample of both the diseased cohorts can improve the sensitivity of results.
Conclusion
Our findings suggest that AD patients undergo network-based changes in large-scale brain networks such as DMN, SMN, and FPN. Diffusion metrics of disrupted tracts that go through these brain networks can be utilized as biomarkers. Decreased FA along with increased MD and RD in forceps minor, corticospinal tract, and IFOF can distinguish AD patients from MCI patients. Diffusion metrics appear to be more sensitive than fiber density metrics in differentiating the structural changes in the white matter between MCI and AD patients. Difference of DMN, SMN, and FPN in our study reveals that AD patients may suffer from poor motor movement and degraded executive control.
Footnotes
Acknowledgment
We thank the assistant Miss. Han-Ru Tsai for her help in recruiting the patients.
Authors' Contribution
All the authors had significant contributions in this study.
Author Disclosure Statement
No competing financial interests exist.
Funding Information
The study was supported by grants from the Taipei Tzu Chi Hospital, Buddhist Tzu Chi Medical Foundation (TCRD-TPE-106-RT-13, TCRD-TPE-107-57).