
Abstract
Background/Purpose:
Psychometric intelligence is closely related to working memory (WM) and the associated brain activity. We aimed to clarify the associations between psychometric intelligence and WM-induced functional connectivity changes.
Materials and Methods:
Here we determined the associations between psychometric intelligence measured by nonverbal reasoning (using the Raven's Advanced Progressive Matrices) and WM-induced changes in functional connectivity during the N-back paradigm, in a large cohort of 1221 young adults.
Results:
We observed that the measures of general intelligence showed a significant positive correlation with WM-induced changes in the functional connectivity with the key nodes of the frontoparietal network, such as the bilateral premotor cortices and the presupplementary motor area. Those significant correlations were observed for (1) areas showing a WM-induced increase of the functional connectivity with the abovementioned key nodes, such as the lateral parietal cortex; (2) areas showing a WM-induced decrease of the functional connectivity with the abovementioned key nodes (2-a) such as left perisylvian areas and cuneus, the fusiform gyrus, and the lingual gyrus, which play key roles in language processing, (2-b) hippocampus and parahippocampal gyrus, which play key roles in memory processing, and (2-c) the key node of the default mode network such as the medial prefrontal cortex; as well as (3) the border areas between (1) and (2).
Conclusion:
Psychometric intelligence is associated with WM-induced changes in functional connectivity, influencing the way in which WM key nodes dynamically modulate the interaction with other brain nodes in response to WM.
Impact statement
Psychophysiological interaction analysis is an old, widely used method to detect functional connectivity changes between different areas in response to task conditions. However, the associations of these task-related functional connectivity changes with cognitive functions remain poorly substantiated. We examined the associations between psychometric intelligence and working memory (WM)-induced changes in functional connectivity in a large cohort of young adults. We discovered that psychometric intelligence is associated with WM-induced changes in functional connectivity with WM key nodes and other brain areas.
Introduction
Psychometric intelligence is associated with the performance of a wide range of cognitive academic and job-related tasks (Cattell, 1971). Performance in nonverbal reasoning tasks constitutes a representative measure of psychometric intelligence, which is strongly correlated with the general intelligence factor associated with performance in a wide range of cognitive tasks (Cattell, 1971). On the contrary, working memory (WM) refers to the limited-capacity storage system involved in the maintenance and manipulation of information over short periods of time (Baddeley, 2003). The WM span is also strongly correlated with general intelligence and with the performance on a wide range of tasks (Baddeley, 2003; Engle et al., 1999).
The neural mechanisms underlying individual differences in psychometric and general intelligence have been investigated by numerous functional and structural studies (Jung and Haier, 2007). Those studies suggest that not only the lateral prefrontal cortex regions but also the network involving the frontoparietal areas (frontoparietal network) plays a key role in psychometric intelligence (Basten et al., 2015). Studies using functional magnetic resonance imaging (fMRI) have investigated the associations between psychometric intelligence and neural activation during the N-back WM paradigm (Takeuchi et al., 2018). We have previously investigated the associations between psychometric intelligence and brain activity during the N-back task, analyzing data from over 1200 subjects with robust voxel-by-voxel permutation-based statistics (Takeuchi et al., 2018). Our results revealed that subjects with greater cognitive ability generally have a lower brain response to task demand (i.e., a lower increase in the activation of the network that is activated during the task, and a lower task-induced deactivation of the network that is deactivated during the task [particularly in the default mode network (DMN), which consists of the medial prefrontal cortex (mPFC), medial parietal cortex, and other areas]). Individuals with higher fluid intelligence scores have demonstrated greater WM-related activity in the presupplementary motor area (SMA), suggesting that this area plays a unique role during WM. Among these findings, the associations between lower task-induced activation and greater intelligence are partly consistent with the neural efficiency theory, which suggests lower prefrontal activity during tasks of low to moderate difficulty (Neubauer and Fink, 2009). However, it should be noted that multiple studies investigating children showed that greater cognitive competence (including psychometric intelligence) is associated with greater task-induced activation and deactivation during WM (Darki and Klingberg, 2015; Rosenberg et al., 2020; Satterthwaite et al., 2013). Given that blood-oxygen-level-dependent (BOLD) responses (task-induced activation and deactivation) become larger as children age (Satterthwaite et al., 2013), advanced neurocognitive development may be associated with a larger BOLD response, and thus, the possible age specificity of the associations between intelligence and BOLD response should be noted.
On the contrary, several studies have previously investigated the associations between functional connectivity and individual cognitive abilities, although these studies are mostly based on resting-state functional connectivity (RSFC) analyses. For example, Song et al. (2008) revealed that individuals with higher psychometric intelligence scores show greater RSFC between dorsolateral prefrontal cortex (DLPFC) and other areas of the frontoparietal network and lower RSFC between DLPFC and the key nodes of the DMN. Similar conclusions were reported in the more recent study of RSFC (Hilger et al., 2020). Other RSFC studies also reported the importance of the RSFC between the key nodes of the frontoparietal network for psychometric intelligence (Langeslag et al., 2013; Thatcher et al., 2016). Numerous recent studies have reported that whole-brain network characteristics across resting or task sessions (profiles of connectivity between whole-brain nodes or networks) can accurately predict psychometric intelligence and WM performance; among them, connectivity involving the frontoparietal network plays an important role in such predictions (Avery et al., 2020; Finn et al., 2015; Yamashita et al., 2018). Furthermore, Greene et al. (2018) showed that these whole-brain network characteristics across task sessions can better predict individual cognitive abilities than those derived from resting-state scanning sessions. Van Den Heuvel et al. (2009) also reported the associations between psychometric intelligence and greater efficiency of the functional network during rest, although this was not replicated in a larger sample size (Kruschwitz et al., 2018). On the contrary, another study showed that the multivariate pattern of voxel-wise dynamic, trial-to-trial, interareal functional connectivity (defined by the correlation strength between the activation of each area in response to each WM trial) among occipitoparietal nodes significantly predicted WM performance (Weber et al., 2017). Structural connectivity analyses using the fractional anisotropy (FA) measure of diffusion tensor imaging also revealed the importance of brain connectivity for intelligence (Schmithorst, 2009).
Psychophysiological interaction (PPI) analysis (Friston et al., 1997) is an old, widely used method to detect functional connectivity changes between different areas in response to task conditions. Through this method, it has been shown that the increase of functional connectivity within the frontoparietal network (which is activated during WM) is in response to WM demands (Takeuchi et al., 2012). Furthermore, Nagel et al. (2011) investigated the associations between this functional connectivity change, in response to WM load and WM task accuracy, although only a nonsignificant tendency was found. On the contrary, a difference in functional connectivity change in response to task demand, as analyzed by PPI, was found to be associated with aging, caudate dopamine D1 receptor density, and autistic diseases (Nagel et al., 2011; Rieckmann et al., 2011; Simard et al., 2015), suggesting that PPI measures reflect meaningful individual differences.
To date, the associations between psychometric intelligence and WM-induced functional connectivity changes remain to be investigated. The abovementioned studies that used connectivity data from task sessions studied the correlation of brain activity between different brain regions during the task (i.e., they did not investigate the differences or changes in strength of connectivity between the different conditions) (Avery et al., 2020; Finn et al., 2015; Greene et al., 2018). Moreover, although we showed previously that individuals with high fluid intelligence scores showed greater brain activity in pre-SMAs, the interactions between this and other brain areas in individuals with high fluid intelligence scores remain unknown. The present study aimed to clarify these issues, analyzing the data of N-back fMRI tasks of the huge sample used in the previous study (Takeuchi et al., 2018).
We hypothesized that greater psychometric intelligence is associated with a greater WM-induced functional connectivity change between the nodes of the frontoparietal network. This reasoning is based on the previous findings that showed a decrease of these functional connectivity changes was previously found to be associated with aging, and aging is associated with a reduction of fluid intelligence (Nagel et al., 2011).
Understanding the neural bases of individual intelligence is of great scientific and social interest, and PPI analysis is a widely used method to investigate task-induced functional connectivity changes. Therefore, investigating the nature of this measure in terms of association of intelligence comprises an important topic.
Materials and Methods
Subjects
The present study is part of an ongoing project investigating the associations among brain imaging, cognitive function, and aging. This study included relevant and reliable cognitive measures and imaging data from 1221 healthy right-handed individuals (700 males and 521 females). The present study investigated associations between psychometric intelligence and WM-induced functional connectivity changes through PPI analyses. Based on apparent abnormalities of the results of individual PPI analyses, 15 subjects were removed from the 1236 subjects whose data were used in our previous study that investigated the association between brain activity during N-back tasks and psychometric intelligence (Takeuchi et al., 2018).
The subjects' mean age was 20.7 years (standard deviation [SD], 1.8 years; age range, 18–27 years). For detailed information on the subjects and limitations imposed by the cohort selection, see the Supplementary Methods and Supplementary Discussion S1, respectively. Written informed consent was obtained from all the participants or their guardians. The study protocol was approved by the Ethics Committee of Tohoku University and performed in accordance with the tenets of the old Declaration of Helsinki (1991) as well as the newer Declaration of Helsinki (2013). This experiment's ID in UMIN is UMIN000028817.
Assessment of psychometric measures of general intelligence
The Raven's Advanced Progressive Matrices (RAPM) (Raven, 1998), a measure of nonverbal reasoning considered the most strongly correlated with general intelligence (Raven, 1998), was used to assess psychometric intelligence. This test contains 36 nonverbal items, which require a fluid reasoning ability. Each item consists of a 3 × 3 matrix with a missing piece to be completed by selecting the best among eight alternatives. The test score, corresponding to the number of correct answers in 30 min, was used as an index of individual psychometric intelligence. The test was performed as described previously in a study by our group, using the same assessment methods (Takeuchi et al., 2015b). Total score is used in this study as is the cases with previous studies (Raven, 1998).
fMRI task
fMRI was used to map brain activity during cognitive tasks. The descriptions of this task are reproduced from our previous study using the same methods (Takeuchi et al., 2015d). The N-back task, which is typically used for fMRI studies, was used with conditions of 0-back (simple cognitive processes) and 2-back (WM). A simple block design (each block lasting 20 sec) and the N-back WM task (Callicott et al., 1999) were used to map brain activity during WM. The N-back task was performed during fMRI scanning as described previously (Takeuchi et al., 2011a, 2011b, 2014). See Supplementary Methods S1 for more details. Sufficient practice was allowed to ensure that the subjects understood the tasks and the item updating strategy to remember two by two during the 2-back task (Takeuchi et al., 2012). Reaction time (RT) and accuracy on 0-back and 2-back tasks were used in the analyses.
Image acquisition
MRI data were acquired using a 3T Philips Achieva scanner. Forty-two transaxial gradient-echo images (echo time, 30 msec; flip angle, 90°; slice thickness, 3 mm; field of view, 192 mm; matrix, 64 × 64) covering the entire brain were acquired at a repetition time of 2.5 sec using an echo-planar sequence. A total of 174 functional volumes were obtained for the N-back session. Diffusion-weighted data were acquired using a spin-echo echo-planar imaging sequence, as described previously (Takeuchi et al., 2015c). The FA and mean diffusivity (MD) maps were calculated from the acquired images (Takeuchi et al., 2011c) and used for preprocessing of BOLD images. The descriptions of this subsection are mostly reproduced from our previous study using the exact same methods (Takeuchi et al., 2015d).
Imaging data preprocessing
Preprocessing and analysis of functional connectivity data were performed using SPM8 implemented in MATLAB. Here we provide a summary, while the full details and methodological considerations are provided in our previous study (Takeuchi et al., 2018). Briefly, before analysis, individual BOLD images were realigned and resliced to the mean BOLD image, which was then realigned to the mean b = 0 image, as described previously (Takeuchi et al., 2011b). As the mean b = 0 image was aligned with both FA image and MD map, the BOLD image, b = 0 image, FA image, and MD map were all aligned. Then BOLD images were slice timing corrected.
Then, all images were normalized using a previously validated two-step “new segmentation” algorithm for diffusion images, and the previously validated diffeomorphic anatomical registration through exponentiated lie algebra-based registration (Takeuchi et al., 2013). The voxel size of normalized BOLD images was 3 × 3 × 3 mm3. The processed images were spatially smoothed with 8-mm full width at half maximum. The descriptions in this subsection are mostly reproduced from our previous study using the exact same methods (Takeuchi et al., 2018).
The reasons why BOLD images were registered to diffusion-weighted images instead of to T1-weighted structural images for normalization can be found in Supplementary Methods S1.
PPI analysis
PPI analysis was performed using SPM8 (Friston et al., 1997) to identify individual WM-induced functional connectivity changes within the regions of interest (ROIs).
Before PPI analyses, individual functional activation analyses were performed.
Individual-level statistical analyses were performed using a general linear model. A design matrix was fitted to each participant with one regressor in each N-back task condition (i.e., 0- or 2-back), using a standard hemodynamic response function. The cue phases of the N-back task were modeled in the same manner, but were not analyzed further. Six parameters obtained by rigid body correction of head motion were regressed through inclusion in the regression model. Low-frequency fluctuations were removed using a high-pass filter with a cutoff value of 128 sec. Serial correlations in fMRI time series were accounted for using an autoregressive AR(1) model during classical parameter estimation, as implemented in SPM. The descriptions in this subsection are mostly reproduced from our previous study using the similar methods (Takeuchi et al., 2015d).
PPI analysis was performed using the SPM8, as described previously (Takeuchi et al., 2012). The following five regions were seed ROIs because of the described reasons. The areas of the bilateral premotor cortices and bilateral DLPFC were chosen because they comprise key prefrontal nodes of the areas critical for WM (Baddeley, 2003). The selection of bilateral premotor cortices and the pre-SMA as seed ROIs was because these three areas showed the strongest peaks within the anterior brain area for the 2-back–0-back contrast, which demonstrated that these nodes are important for the execution of the N-back task.
The coordinates of the peak voxels from the contrast for the effect of WM (2-back–0-back) from analyses involving all subjects were used as a landmark for each individual's seed voxel (left premotor cortex [x, y, z = −27, 0, 57], right premotor cortex [x, y, z = 30, 6, 66], left DLPFC [x, y, z = −48, 24, 33], right DLPFC [x, y, z = 45, 36, 36], pre-SMA = [x, y, z = −6, 12, 54]) (since these peak coordinates are those of the contrast for the effect of WM, and not those of the correlation between intelligence and WM-related brain activity in the present sample, this analysis is not circular). A spherical ROI with a diameter of 6 mm was identified around the peak voxel in the seed areas activated during the 2-back task (the landmarks for the individual seed voxel were those described in the previous sentence).
For each ROI analysis, the time series was extracted for each ROI, and a PPI regressor was calculated as the element-by-element product of the ROI's mean corrected activity, and a vector coding for the differential task effect of WM (2-back–0-back). In addition to the regressor representing the interaction between the time series and the task, the main contributing effects of that interaction (task and time series) were also included. Thus, in each PPI analysis, the PPI regressor reflected the interaction between psychological variables (2-back–0-back) and the activation time-course of the seed area (in other words, the PPI regressor reflects how the functional connectivity with the seed region changes in response to the task condition (here, 2-back–0-back). Note that inclusion of these three regressors is standard procedure for PPI analyses. Without the inclusion of these, the effects of the interaction regressors can be confounded by the effects of the task and activation time-course regressors of the seed ROI area.
Group-level whole-brain imaging data analysis
At the group level, the relationship between individual general intelligence and WM-specific (2-back–0-back contrast) functional connectivity change was determined. In the whole-brain analysis, multiple linear regression was used to identify the areas in which the contrast beta-estimates were significantly related to the individual cognitive ability. The effects of sex, age, accuracy, and RTs of the 2-back task and 0-back task, and the volume-level mean framewise displacement during the scan for the N-back task (Power et al., 2012) were corrected for, by entering these parameters as covariates into the multiple regression model. Since the dependent variable of each whole-brain analysis corresponded to the PPI map of each ROI, we performed five whole-brain multiple regression analyses.
The correction for multiple comparisons was performed using threshold-free cluster enhancement (TFCE) (Smith and Nichols, 2009) with randomized (5000 permutations) nonparametric testing using the TFCE toolbox. The family-wise error threshold was corrected at p < 0.025 (p < 0.05/2, two-tailed).
All analyses were adjusted for accuracy and RT. While this is considered the gold standard for such analyses, we are aware that some of these adjustments may regress out some relevant general intelligence and WM components, such as cognitive speed. However, without such adjustment, it becomes unclear whether the observed neural activity differences simply reflect behavioral differences (meaning, whether the observed brain activity differences reflect the movement of finger or recognition of errors).
Results
Basic psychological data
Supplementary Table S1 presents the mean (±SD) age, RAPM score, accuracies, and RTs of the 0-back and 2-back tasks, as well as the volume-wise framewise displacement.
Response accuracies on the 2-back and 0-back tasks showed a ceiling effect (average, >99.0% correct) and the RAPM score did not show a significant relationship with the response accuracy on the 0-back task (p = 0.871, r = −0.005), but showed a significantly positive relationship with the response accuracy on the 2-back task (p = 0.035, r = 0.060; a low level of correlation might arise from the ceiling effects of performance as the average accuracy of the 2-back task was 99.2%), (the response accuracy on the 2-back task—the response accuracy on the 0-back task) (p = 0.012, r = 0.072). The RAPM score was significantly and negatively correlated with the 0-back task RT (p < 0.001, r = −0.119), 2-back task RT (p < 0.001, r = −0.194), (2-back task RT–0-back task RT) (p < 0.001, r = −0.177). These results are mostly similar to our previous study that investigated the association between brain activity during the N-back tasks and psychometric intelligence (Takeuchi et al., 2018). Statistics of correlations among psychological variables in this study are presented in Supplementary Table S2.
RAPM scores and other independent variables of the whole-brain multiple regression analyses did not show simple correlation coefficients higher than 0.2, excluding the possibility of the existence of multicollinearity problems in estimating the neural correlates of RAPM.
WM-related brain activation and functional connectivity changes with seed ROIs
The contrast of WM-specific effects (2-back vs. 0-back) on brain activity revealed significant effects on the areas of the frontoparietal network as well as other areas critical for WM, such as the bilateral caudate, while the opposite effect (0-back vs. 2-back) on brain activity revealed significant effects on the typical nodes of the DMN as well as occipital and pre-and postcentral gyrus (p < 0.05, corrected for multiple comparisons at voxel-level false discovery rate (FDR) at the whole-brain level; Fig. 1a–c). These areas are highly consistent with those identified in a previous meta-analysis of verbal N-back tasks (Owen et al., 2005), thus confirming this task's validity.

Regions activated or deactivated and showing increased or decreased functional connectivity with the seed regions of interest.
The contrast of WM-specific (2-back vs. 0-back) and opposite (0-back vs. 2-back) effects on functional connectivity with the seed ROIs (i.e., left premotor cortex, right premotor cortex, pre-SMA) revealed similar areas to those of the network that was activated in response to the contrast of 2-back versus 0-back and the contrast of 0-back versus 2-back (p < 0.05, corrected for multiple comparisons at voxel-level FDR at the whole-brain level; Fig. 1b–l). However, marked differences were also observed in some areas. For example, the left pre- and postcentral gyrus showed effects of 2-back versus 0-back on functional connectivity with seed ROIs, but no effects of 2-back versus 0-back on brain activity.
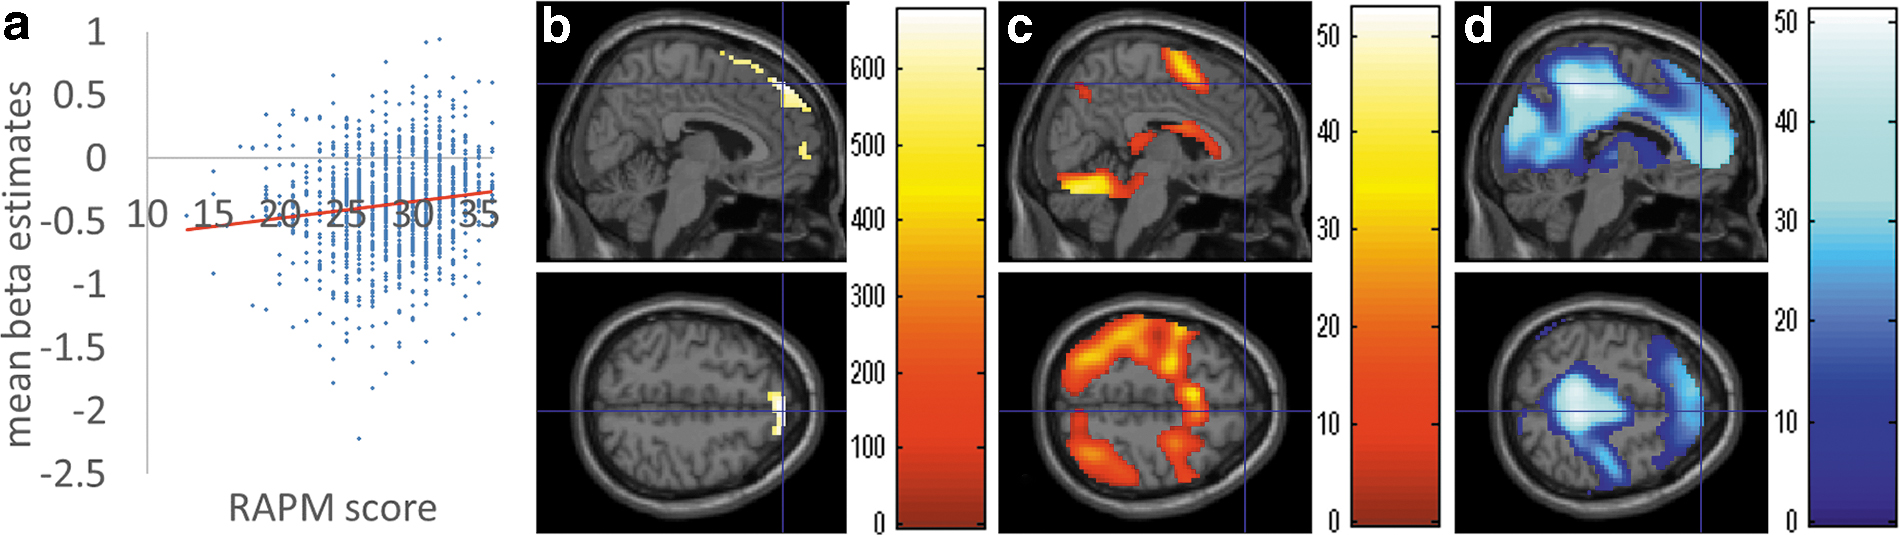
Correlation between WM-related functional connectivity changes with the left premotor cortex and psychometric intelligence
Following confounding variable adjustment, multiple regression analysis revealed that the RAPM score was significantly and positively correlated with WM-related (2-back–0-back) change of the functional connectivity with the left premotor cortex, in the cluster spreading around the anterior and middle cingulate cortex, dorsomedial prefrontal cortex (dmPFC), and right superior frontal cortex, the bilateral caudate (about 1/3 of this cluster showed a WM-related increase of the functional connectivity with the left premotor cortex, while 2/3 of this cluster showed a decrease), the cluster that mainly spread around the bilateral calcarine cortex, bilateral cuneus, bilateral hippocampus, bilateral parahippocampal gyrus, bilateral lingual gyrus, bilateral precuneus and bilateral thalamus and the bilateral fusiform gyrus, and parts of the areas around the right sylvian fissure (about 8% of this cluster showed a WM-related increase of the functional connectivity with the left premotor cortex, while 86% of this cluster showed a decrease), the cluster that spread around the left pre- and postcentral gyrus (about 14% of this cluster showed a WM-related increase of the functional connectivity with the left premotor cortex, while 79% of this cluster showed a decrease), the cluster spreading mainly around the bilateral SMA (about 53% of this cluster showed a WM-related increase of the functional connectivity with the left premotor cortex, while 38% of this cluster showed a decrease), the cluster in the middle cingulate gyrus (all areas of this cluster showed a WM-related decrease of the functional connectivity with the left premotor cortex), and the area in the dmPFC (all areas of this cluster showed a WM-related decrease of the functional connectivity with the left premotor cortex) (Fig. 2, Table 1).

Brain regions showing significant correlations between WM-related increase of the functional connectivity with the left premotor cortex and the RAPM score. RAPM score and specific changes of the functional connectivity with the left premotor cortex in response to WM demand (2-back–0-back) showed significant positive correlations in
Brain Regions Showing Significant Correlations Between Working Memory-Related Increase of Functional Connectivity with the Left Premotor Cortex and the Raven's Advanced Progressive Matrix Score
Labelings of the anatomical regions of gray matter were based on the WFU PickAtlas Tool (Maldjian et al., 2003, 2004) and on the PickAtlas Automated Anatomical Labeling atlas option (Tzourio-Mazoyer et al., 2002). In this atlas, temporal pole areas and some other areas include all subregions. The superior frontal other areas include the areas in the superior frontal gyrus, other than the medial, orbital, and medial/orbital parts of the superior frontal gyrus.
Simple correlation coefficients between mean beta-estimates of significant clusters (mean values of the beta-estimates of the target contrast of all voxels within the significant clusters) and RAPM score. Note that due to overfitting in whole-brain analyses (Vul et al., 2009), the correlation coefficients of significant areas are overestimated to a degree depending on the sample size and number of comparisons.
This area is classified as the SMA in this atlas. However, as noted in the Results section, it has been pointed out that this area mostly specifically corresponds to pre-SMA (Picard and Strick, 1996; Zilles et al., 1995), and therefore called so in this table, too.
FWE, family-wise error; RAPM, Raven's Advanced Progressive Matrices; SMA, supplementary motor area; TFCE, threshold-free cluster enhancement.
Correlation between WM-related functional connectivity changes with the right premotor cortex and psychometric intelligence
After confounding variable adjustment, multiple regression analysis revealed a significant positive correlation between the RAPM score and the WM-related (2-back–0-back) change of the functional connectivity with the right premotor cortex, in the cluster spreading mainly around the left hippocampus, left insula, left perisylvian areas (all areas of this cluster showed a WM-related decrease of the functional connectivity with the right premotor cortex), in the cluster spreading mainly around the left supramarginal gyrus, left superior temporal gyrus, left inferior parietal lobule, and left angular gyrus (about half of this cluster showed a WM-related increase of the functional connectivity with the right premotor cortex, while half of this cluster showed a decrease), and the cluster that spread around the left lingual gyrus, left parahippocampal gyrus, left hippocampus, left fusiform gyrus, left cerebellum, and left precuneus (most of the areas of this cluster showed a WM-related decrease in the functional connection with the left premotor cortex) (Fig. 3, Table 2).

Brain regions showing significant correlations between WM-related increase of the functional connectivity with the right premotor cortex and the RAPM score. The RAPM score and change of the functional connectivity with the right premotor cortex in response to WM demand (2-back–0-back) showed significant positive correlations in
Brain Regions Showing Significant Correlations Between Working Memory-Related Increase of the Functional Connectivity with Right Premotor Cortex and the Raven's Advanced Progressive Matrix Score
Labelings of the anatomical regions of gray matter were based on the WFU PickAtlas Tool (Maldjian et al., 2003, 2004) and on the PickAtlas Automated Anatomical Labeling atlas option (Tzourio-Mazoyer et al., 2002). In this atlas, temporal pole areas and some other areas include all subregions. The superior frontal other areas include areas in the superior frontal gyrus, other than the medial, orbital, and medial/orbital parts of the superior frontal gyrus.
Simple correlation coefficients between mean beta-estimates of significant clusters (mean values of the beta-estimates of the target contrast of all voxels within the significant clusters) and RAPM score. Note that due to overfitting in whole-brain analyses (Vul et al., 2009), the correlation coefficients of significant areas are overestimated to a degree depending on the sample size and number of comparisons.
Correlation between WM-related functional connectivity changes with the pre-SMA and psychometric intelligence
Following confounding variable adjustment, multiple regression analysis revealed a significant positive correlation between the RAPM score and the WM-related (2-back–0-back) change of the functional connectivity with the pre-SMA, in the cluster spreading mainly around the dmPFC, superior frontal cortices, SMA, and the anterior cingulate gyrus (most of the areas of this cluster showed a WM-related decrease of the functional connection with the pre-SMA) (Fig. 4, Table 3).
Brain regions showing significant correlations between WM-related increase of the functional connectivity with the presupplementary motor cortex and the RAPM score. The RAPM score and change of the functional connectivity with the pre-SMA in response to WM demand (2-back–0-back) showed significant positive correlations in
Brain Regions Showing Significant Correlations Between Working Memory-Related Increase of the Functional Connectivity with the Presupplementary Motor Cortex and the Raven's Advanced Progressive Matrix Score
Labelings of the anatomical regions of gray matter were based on the WFU PickAtlas Tool (Maldjian et al., 2003, 2004) and on the PickAtlas Automated Anatomical Labeling atlas option (Tzourio-Mazoyer et al., 2002). In this atlas, temporal pole areas and some other areas include all subregions. The superior frontal other areas include areas in the superior frontal gyrus, other than the medial, orbital, and medial/orbital parts of the superior frontal gyrus.
Simple correlation coefficients between mean beta-estimates of significant clusters (mean values of the beta-estimates of the target contrast of all voxels within the significant clusters) and RAPM score. Note that due to overfitting in whole-brain analyses (Vul et al., 2009), the correlation coefficients of significant areas are overestimated to a degree depending on the sample size and number of comparisons.
Correlation between WM-related functional connectivity changes with the left DLPFC or right DLFPC and psychometric intelligence
No significant correlations were observed between the RAPM score and WM-related (2-back–0-back) changes of the functional connectivity with the left DLPFC or right DLFPC in any of the regions.
Discussion
The present study reveals, for the first time, the associations between psychometric intelligence and WM-related changes in the functional connectivity with the WM key nodes in a very large cohort (n > 1200), using robust permutation-based statistics at the whole-brain level. All significant correlations identified between psychometric intelligence and WM-induced functional connectivity changes were positive. Psychometric intelligence was significantly and positively correlated with WM-induced change in the functional connectivity between the premotor cortex and inferior parietal lobule, which is partly consistent with one of our hypotheses of the associations between greater psychometric intelligence and a greater WM-induced functional connectivity change between the lateral prefrontal cortex, the pre-SMA, and the lateral parietal cortex. The inferior parietal lobule is the posterior WM key node and increases the functional connectivity with the premotor cortex in response to WM. Moreover, a positive correlation between greater general intelligence and lower WM-induced functional connectivity decrease was observed in key nodes within the frontoparietal network.
Psychometric intelligence is associated with WM-induced change in the functional connectivity with the bilateral premotor cortex and the pre-SMA, but not with the bilateral DLPFCs. The premotor cortex is closely related with the DLPFC, both anatomically and functionally (Fuster, 2006; Takeuchi et al., 2012), playing an important role in several executive functions of WM (Wager et al., 2008), and being most robustly active during WM (Reuter-Lorenz et al., 2000). The activity of the pre-SMA during WM is positively correlated with psychometric intelligence, in a unique way (Takeuchi et al., 2018). This area is activated during WM, increasing its activity as the memory load increases (Owen et al., 2005). The pre-SMA is involved in higher level planning processes and in the more abstract aspects of cognition (Cona and Semenza, 2017; Picard and Strick, 1996; Seitz et al., 2006), sequence operations in a variety of cognitive domains (Cona and Semenza, 2017), aspects of task switching, and changing of plans in cognitive control (Nachev et al., 2008). These processes of both the premotor cortex and pre-SMA play key roles in WM, updating, and remembering sequential information. Therefore, functional interaction with these regions is also likely to play a key role in WM. The reason why we could not obtain significant results in the DLFPC itself is not clear, but we previously failed to find significant associations between brain activities in the DLFPC and psychometric intelligence (Takeuchi et al., 2018), perhaps for the task execution of N-back task, the regions such as the premotor cortex and the SMA and related functions such as updating, planning, task switching, and sequential information processing, as described above, may be more critical due to the nature of the task.
In the present study, the simple correlation coefficients between the beta-estimates of functional connectivity changes in areas of significance and the RAPM score were relatively small (<0.15). Relatively weak correlations (r < 0.2) between individual cognitive differences and neuroimaging measures are a universal phenomenon in studies using huge samples of young normal adults (i.e., n > several hundreds) regardless of the type of imaging measures (i.e., functional activity, functional connectivity, gray and white matter structures) (Magistro et al., 2015; Schilling et al., 2012; Takeuchi et al., 2015a, 2017, 2018). Therefore, they do not indicate that the task-related functional connectivity changes are not important. In significant areas of the whole-brain analyses with small samples, large correlation coefficients are not indicative of true correlation strengths, since in whole-brain analyses, especially those performed on small samples, the effect sizes may be extremely overestimated due to strong overfitting (e.g., Murphy et al., 2012; Vul et al., 2009).
Among the areas presenting significant positive correlations, some show a WM-related decrease in functional connectivity with the seed ROI. These connections include functional connectivity changes between the seed ROIs and the areas in the DMN, which are deactivated during WM. These findings can have several interpretations. First, in response to WM load, the functional connectivity between the areas of the task-positive network and those of the DMN mostly decreased. Thus, the observed positive correlation may be interpreted as indicating a lower neural response to WM load, reflecting the fact the individuals with higher intelligence scores have a more efficient network. In other words, for individuals with higher intelligence scores, the neural response (WM-induced functional connectivity change) to the 2-back task was similar to that of the 0-back task. This finding is consistent with our previous findings showing that individuals with higher intelligence scores tend to show a lower increase of the WM-related brain activity, and a lower task-induced deactivation in response to WM demand (Takeuchi et al., 2018). This is in accordance with the concept of the “neural efficiency theory,” which suggests that individuals with higher intelligence scores show lower prefrontal cortex activation during an easy task (Neubauer and Fink, 2009). Consistent with this notion, greater visual perceptual skills were negatively associated with task-induced changes of brain activity as well as functional connectivity (Danti et al., 2018). This is a possible interpretation for the positive correlation between WM-induced change of the functional connectivity with the pre-SMA and the RAPM score in the dmPFC. Alternatively, the positive correlation between the psychometric intelligence and WM-related change of the functional connectivity with the premotor cortex areas such as the hippocampus, the parahippocampal gyrus, the lingual gyrus, and the fusiform gyrus, and perisylvian areas, may reflect that individuals with higher intelligence scores tend to present an increased interaction between key nodes of the frontoparietal network (premotor cortex), and the areas involved in memory, letters, and languages, and successfully involve those areas and relevant functions during WM performance (Burgess et al., 2002; Price, 2010).
Among the areas showing significant positive correlations, a minority shows a WM-related increase of the functional connectivity with the seed ROIs, some of which are located between areas showing a WM-induced increase in functional connectivity with the seed ROIs and those showing a WM-induced decrease in functional connectivity. A typical example is the positive correlation between the RAPM score and WM-related changes in functional connectivity between the right premotor cortex (seed ROI) and the areas in the left inferior parietal lobule, left supramarginal gyrus, and left temporoparietal junctions. In areas showing a WM-induced increase in functional connectivity with the seed ROIs, the findings may indicate that individuals with higher intelligence scores show a successful increase of the functional connectivity between the key nodes of the network that is active during WM, thus performing better, and the lack of negative correlations in these areas contradicts our hypothesis that individuals with higher intelligence scores show a lower response of WM-induced functional connectivity in these areas. Regarding the border region between the areas showing a WM-induced increase of the functional connectivity with seed ROIs and those showing a WM-induced decrease of the functional connectivity, the findings regarding the positive correlation with psychometric intelligence suggest that in WM key nodes, individuals with higher intelligence scores may increase functional connectivity with wider areas than other subjects. These findings may be parallel to those showing that cognitive abilities and brain activity are often significantly correlated in the border between the areas that are active during WM and those that are deactivated (Takeuchi et al., 2018). In border areas, significant correlations may be easily found since their activation or deactivation may be less affected by the various types of noise.
The findings from the present study suggest task-related changes in functional connectivity, as measured by PPI analyses, which can robustly detect individual differences in cognitive abilities. Various functional connectivity characteristics during resting sessions have been shown to be associated with psychometric intelligence (Langeslag et al., 2013; Thatcher et al., 2016). Recent studies have shown that functional connectivity characteristics during the task fMRI sessions are associated with psychometric intelligence, but these studies have not examined the associations of psychometric intelligence with changes of functional connectivity between different conditions within the scanning session (Avery et al., 2020; Finn et al., 2015; Greene et al., 2018). Previous studies have shown that these task-related changes in functional connectivity within sessions measured using PPI, reflect disease states, aging, and dopaminergic activity (Nagel et al., 2011; Rieckmann et al., 2011; Simard et al., 2015). The present study suggests that psychometric intelligence is associated with WM-induced changes in functional connectivity. Future studies are needed to understand the physiological and cognitive bases underlying these individual differences in task-related functional connectivity changes.
It has been shown previously that caudate dopamine D1 receptor density is positively correlated with task-related changes in the functional connectivity between the lateral prefrontal and the parietal cortices (Rieckmann et al., 2011). Therefore, such physiological mechanism may partly contribute to form associations between task-related changes in functional connectivity and psychometric intelligence. On the contrary, the association between RSFC and brain structural connectivity has already been shown (Greicius et al., 2009). Moreover, psychometric intelligence has been shown to be associated with brain structural connectivity (Schmithorst, 2009). Therefore, it is possible that structural connectivity underlies task-related changes in functional connectivity, and further studies are needed to understand these issues in detail.
At least one limitation exists in this study. Only fMRI data from the N-back task were obtained from a sufficient number of subjects for the task fMRI data in this study. Therefore, we were only able to investigate WM-induced changes in functional connectivity measured by PPI analysis. Whether the observed relationship between task-induced changes in functional connectivity and intelligence is specific to changes in functional connectivity related to WM or not is not clear. This needs to be clarified in future studies.
In conclusion, psychometric intelligence was found to significantly and positively correlate with WM-specific changes of the functional connectivity with WM key nodes, such as the bilateral premotor cortex and pre-SMA. In other words, psychometric intelligence is associated with the way the key nodes of the frontoparietal network dynamically modulate the interaction with other brain nodes in response to WM demand. Significant correlations were found in areas (1) showing WM-specific increase of the functional connectivity with WM key nodes, such as the lateral parietal cortex, and those (2) showing a WM-specific decrease of the functional connectivity with WM key nodes such as (2-a) the left perisylvian areas and cuneus, fusiform gyrus, and the lingual gyrus, which play key roles in language processing, (2-b) the hippocampus and parahippocampal gyrus, which play key roles in memory processing, and (2-c) the key nodes of the DMN, such as the mPFC and (3) the border areas of (1) and (2).
Footnotes
Authors' Contributions
H.T., Y.T., and R.K. launched the idea of this experiment. H.T. and R.K. were involved in deciding the details of the experimental design. H.T., Y.T., R.N., R.Y., Y.K., S.N., A.S., K.I., S.H., T.A., C.M.M., K.S., Y.S., T.N., S.I., S.Y., and M.D. were involved in performing the MRI and psychological experiments and data acquisition. H.T. was involved in data analysis. H.T., Y.T., R.N., R.Y., Y.K., S.N., A.S., K.I., S.H., T.A., C.M.M., K.S., Y.S., T.N., S.I., S.Y., M.D., and R.K. were involved in interpretation of the data. H.T. was involved in writing the article.
Acknowledgments
The authors thank Yuki Yamada for operating the MRI scanner, Haruka Nouchi for conducting the psychological tests, all other assistants for helping with the experiments and the study, the study participants, and all the other colleagues at IDAC, Tohoku University, for their support. They also thank Enago for the English language review.
Compliance with Ethical Standards
All procedures performed in the studies involving human participants were in accordance with the ethical standards of the institutional and/or national research committee and with the 1964 Helsinki Declaration and its later amendments or comparable ethical standards including those of the newest one (Declaration of Helsinki, 2013).
Ethical Approval
This study was approved by the Ethics Committee of Tohoku University.
Informed Consent
Informed consent was obtained from all individual participants included in the study.
Data and Code Availability Statement
All the experimental data obtained in the experiment of this study will be available to ones that were admitted in the Ethics Committee of Tohoku University, School of Medicine. All the data sharing should be first admitted by the Ethics Committee of Tohoku University, School of Medicine.
Author Disclosure Statement
No competing financial interests exist.
Funding Information
This study was supported by JST/RISTEX, JST/CREST, a Grant-in-Aid for Young Scientists (B) (KAKENHI 23700306) and a Grant-in-Aid for Young Scientists (A) (KAKENHI 25700012) from the Ministry of Education, Culture, Sports, Science, and Technology.
Supplementary Material
Supplementary Data
Supplementary Table S1
Supplementary Table S2
References
Supplementary Material
Please find the following supplemental material available below.
For Open Access articles published under a Creative Commons License, all supplemental material carries the same license as the article it is associated with.
For non-Open Access articles published, all supplemental material carries a non-exclusive license, and permission requests for re-use of supplemental material or any part of supplemental material shall be sent directly to the copyright owner as specified in the copyright notice associated with the article.