
Abstract
Purpose:
To investigate the relationships between white matter hyperintensities (WMH) and hippocampal volume and their influence on brain networks by using resting-state functional connectivity (rs-fc) magnetic resonance (MR) according to their localization.
Methods:
In this exploratory cross-sectional study, 38 subjects from the public “Leipzig Study for Mind/Body/Emotion Interactions” (LEMON) data set were selected. Morphometric analyses of both WMH burden and the total hippocampal relative volume (tHRV) were performed for each subject with two automated software. The WMH were then categorized as total (tWMH), periventricular (pvWMH), deep (dWMH), and juxtacortical (jcWMH). Spearman's correlation analyses were performed to evaluate the relationships between the following variables: age, tWMH, pvWMH, dWMH, jcWMH, and tHRV. Subsequently, three different rs-fc MR group analyses were performed using a multiple regression model that included age, pvWMH, dWMH, and jcWMH as second-level covariates. The graph theoretical analysis was applied to evaluate the effects of pvWMH (analysis 1), jcWMH (analysis 2), and dWMH (analysis 3).
Results:
Spearman's correlation analysis revealed several statistically significant (p < 0.05) positive and negative correlations, in particular positive between age and tWMH, and negative between dWMH and tHRV. rs-fc MR analysis 1 and 2 did not reveal statistically significant results; analysis 3 revealed that dWMH influenced network properties of several cerebral regions, in particular global and local efficiency of both the hippocampi.
Conclusion:
The localization of WMH influences brain activity in healthy subjects. In particular, dWMH are inversely correlated with tHRV and influence several properties of different cerebral areas, included both the hippocampi.
Impact statement
In this exploratory research we evidenced how both the load and the localization of white matter hyperintensities influence brain activity; in particular, we evidenced an inverse correlation between the volume of the deep white matter hyperintensities and hippocampal volume, as well as a direct influence on the connectivity properties of this important cerebral region. This finding represent a new element for understanding the effects of white matter hyperintensities on brain networking, and a cue that could be taken into account for possible future studies investigating brain connectivity and cognitive functions in healthy and pathological conditions.
Introduction
“White matter hyperintensities (WMH) of presumed vascular origin,” also known as white matter (WM) lesions, are small lesions of the cerebral WM that appear hyperintense on T2-weighted and T2-weighted fluid-attenuated inversion recovery (FLAIR) sequences, in the absence of signs of cavitation (Wardlaw et al., 2013). Even though the pathogenesis of these lesions is still not fully understood, it is likely that this process is multifactorial, and it includes acute thromboembolism and/or chronic local hypoperfusion followed by inflammation and focal tissue loss (Gouw et al., 2011; Lin et al., 2017). The presence of supratentorial bilateral and mostly symmetrical WMH is a common finding in older individuals (Wardlaw et al., 2013). It has been observed that the WMH load (in terms of the global volume of WMH) increases with aging (Sachdev et al., 2007), and it is higher in pathological conditions such as carotid artery stenosis (Saba et al., 2013; Ye et al., 2018); furthermore, the WMH burden is associated with increased risk of cognitive decline and dementia in the general population (Debette and Markus, 2010; Salvadó et al., 2019). It has been also demonstrated that the effects of WMH on brain functions vary according to their localization (Debette and Markus, 2010). Periventricular WMH (pvWMH), deep WMH (dWMH), and juxtacortical WMH (jcWMH), for example, have different functional and clinical correlates: pvWMH are associated with impaired cognitive function, especially in processing speed and executive function (Debette and Markus, 2010; Griffanti et al., 2018), dWMH are associated with impairments in basic activities of daily living (Park et al., 2011), whereas the jcWMH are associated with multiform clinical symptoms, including headache, depression, anxiety, and insomnia (Shan et al., 2017).
The effects of global WMH load on brain network have been studied by resting-state functional connectivity (rs-fc) both in healthy subjects (HS) (Benson et al., 2018; De Marco et al., 2017; Leuchter et al., 1994; Reijmer et al., 2015) and in subjects with different pathologies, including individuals with carotid artery stenosis (Porcu et al., 2020a) and with Alzheimer's disease (Chong et al., 2017). It has been suggested that the WMH interfere in brain networking by decreasing tract-specific functional connectivity, both directly and indirectly (Langen et al., 2017). To the best of our knowledge, no studies have analyzed the effects of the localization of WMH on brain connectivity, but according to the abovementioned evidences it is possible to speculate that this feature influences brain networking.
Hippocampus is a fundamental structure of the human brain that plays a critical role in different tasks, including memory formation and spatial orientation (Bird and Burgess, 2008). This region is able to connect and integrate multiple sensory, emotional, and cognitive components in a unique spatiotemporal framework, although the underlying mechanisms of these processes are still unclear (Knierim, 2015). Moreover, as aging is associated with cognitive decline and memory impairment (Harada et al., 2013), it seems likely that hippocampal atrophy, which is often observed in normal aging, could be at least partly responsible of these symptoms (Bettio et al., 2017). A correlation between WMH load and longitudinal hippocampal volume loss in cognitively normal adults was recently demonstrated (Fiford et al., 2017). Even if the exact mechanisms underlying hippocampal shrinkage have still not been clarified, it has been proposed that the axonal damage of the fibers within the WMH could eventually lead to hippocampal shrinkage, as a final result of Wallerian degeneration (von Bohlen und Halbach and Unsicker, 2002).
Starting from these evidences, we aimed to investigate whether the localization of supratentorial WMH load (jcWMH, dWMH, and pvWMH) plays a role in hippocampal shrinkage in HS and if it has also an impact on the global cerebral functional connectivity, assuming the involvement of the hippocampal regions. We designed an exploratory cross-sectional study, exploiting the public available data set “Leipzig Study for Mind/Body/Emotion Interactions” (LEMON) (Babayan et al., 2019). First, we investigated the relationships between supratentorial hippocampal volume and WMH load of each zone of the WM (juxtacortical, deep, and periventricular); we subsequently analyzed the influence of the jcWMH, dWMH, and pvWMH load on global brain networking by making an rs-fc analysis. The graph theory, which is a set of mathematical approaches developed for the study of complex networks (Albert and Barabasi, 2002), was applied to rs-fc analysis for the interpretation of the results.
Materials and Methods
Study population
The HS included in the study were from the LEMON data set (Babayan et al., 2019). The whole data set consisted of 227 subjects. In accordance with the fact that this data set provided a 5-year range of age and not the exact age for every subject included in the study, we categorized the age in 16 progressive grades: grade 1 = 0–5 years, grade 2 = 5–10 years, and so on, up to grade 16 = 75–80 years.
The following exclusion criteria were applied to minimize the risk of potential biases related to the presence of neurological or other medical conditions, and to optimize the data for the subsequent volumetric analysis (see in the paragraph “volumetric analysis of the WMH and hippocampus”): (1) subjects who had only performed a two-dimensional FLAIR instead of the three-dimensional (3D) FLAIR; (2) left-handed and ambidextrous subjects; (3) subjects with urine test positive for the presence of drugs or who did not undergo the test; (4) smokers, occasional smokers, and subjects without this information; (5) subjects with psychiatric disease diagnosed in the anamnestic phase or with no data relative to the presence/absence of psychiatric disease; and (6) subjects with alcohol dependence and subjects without alcohol information. The sequences extracted from the data set for the morphologic and rs-fc analyses were the following (Babayan et al., 2019): (1) 3D SPACE sequence with FLAIR preparation; (2) structural isotropic magnetization prepared 2 rapid acquisition gradient echo (MP2RAGE) T1-weighted sequences; (3) T2-weighted sequences; and (4) functional multiband spin echo planar imaging (SE-EPI) sequences. The details of the sequences are reported in the data set publication (Babayan et al., 2019) and in Supplementary Table S1. As reported also in the article of the LEMON data set, the researchers used MP2RAGE T1-weighted sequence for assessment of brain structure: compared with the magnetization prepared rapid acquisition gradient echo (MPRAGE) T1-weighted sequence, MP2RAGE offers the advantage of being uniform and free of other imaging properties (proton density and T2*) that could affect the morphometric measurements (Babayan et al., 2019). For further details about the LEMON data set, the authors suggest that the readers refer to the article cited in the reference list (Babayan et al., 2019).
Volumetric analysis of the WMH and hippocampus
WMH volumetric data were obtained from the isotropic 3D SPACE sequence with FLAIR preparation and structural MP2RAGE T1-weighted sequences by using the lesion Brain online tool (Coupé et al., 2018). This automated tool works by exploiting a group of shallow neural networks; it is based on a three-stage strategy that includes multimodal patch-based segmentation, regularization of probability map, and error correction (Coupé et al., 2018). The pipeline consists of the following phases: (1) preprocessing for the normalization of the intensity of the images and for their registration into the Montreal Neurological Institute (MNI) space; (2) structural segmentation; (3) WMH segmentation; and (4) WMH classification (Coupé et al., 2018). Regarding the classification, the WMH located within three voxels (i.e., 3 mm in the MNI space) from the lateral ventricles were classified as pvWMH, those within three voxels, the gray matter (GM) map was classified as jcWMH, those located below the union of brain stem and cerebellum are classified as infratentorial, and the remaining as dWMH (Coupé et al., 2018). With this tool, we calculated the WMH load (i.e., the WMH absolute volume divided by the WM absolute volume, expressed in percentage). Patients with infratentorial lesions were excluded from the analysis. WMH were quantified in terms of total (tWMH), pvWMH, dWMH, and jcWMH load. An example of WMH segmentation with lesion brain is reported in Figure 1.
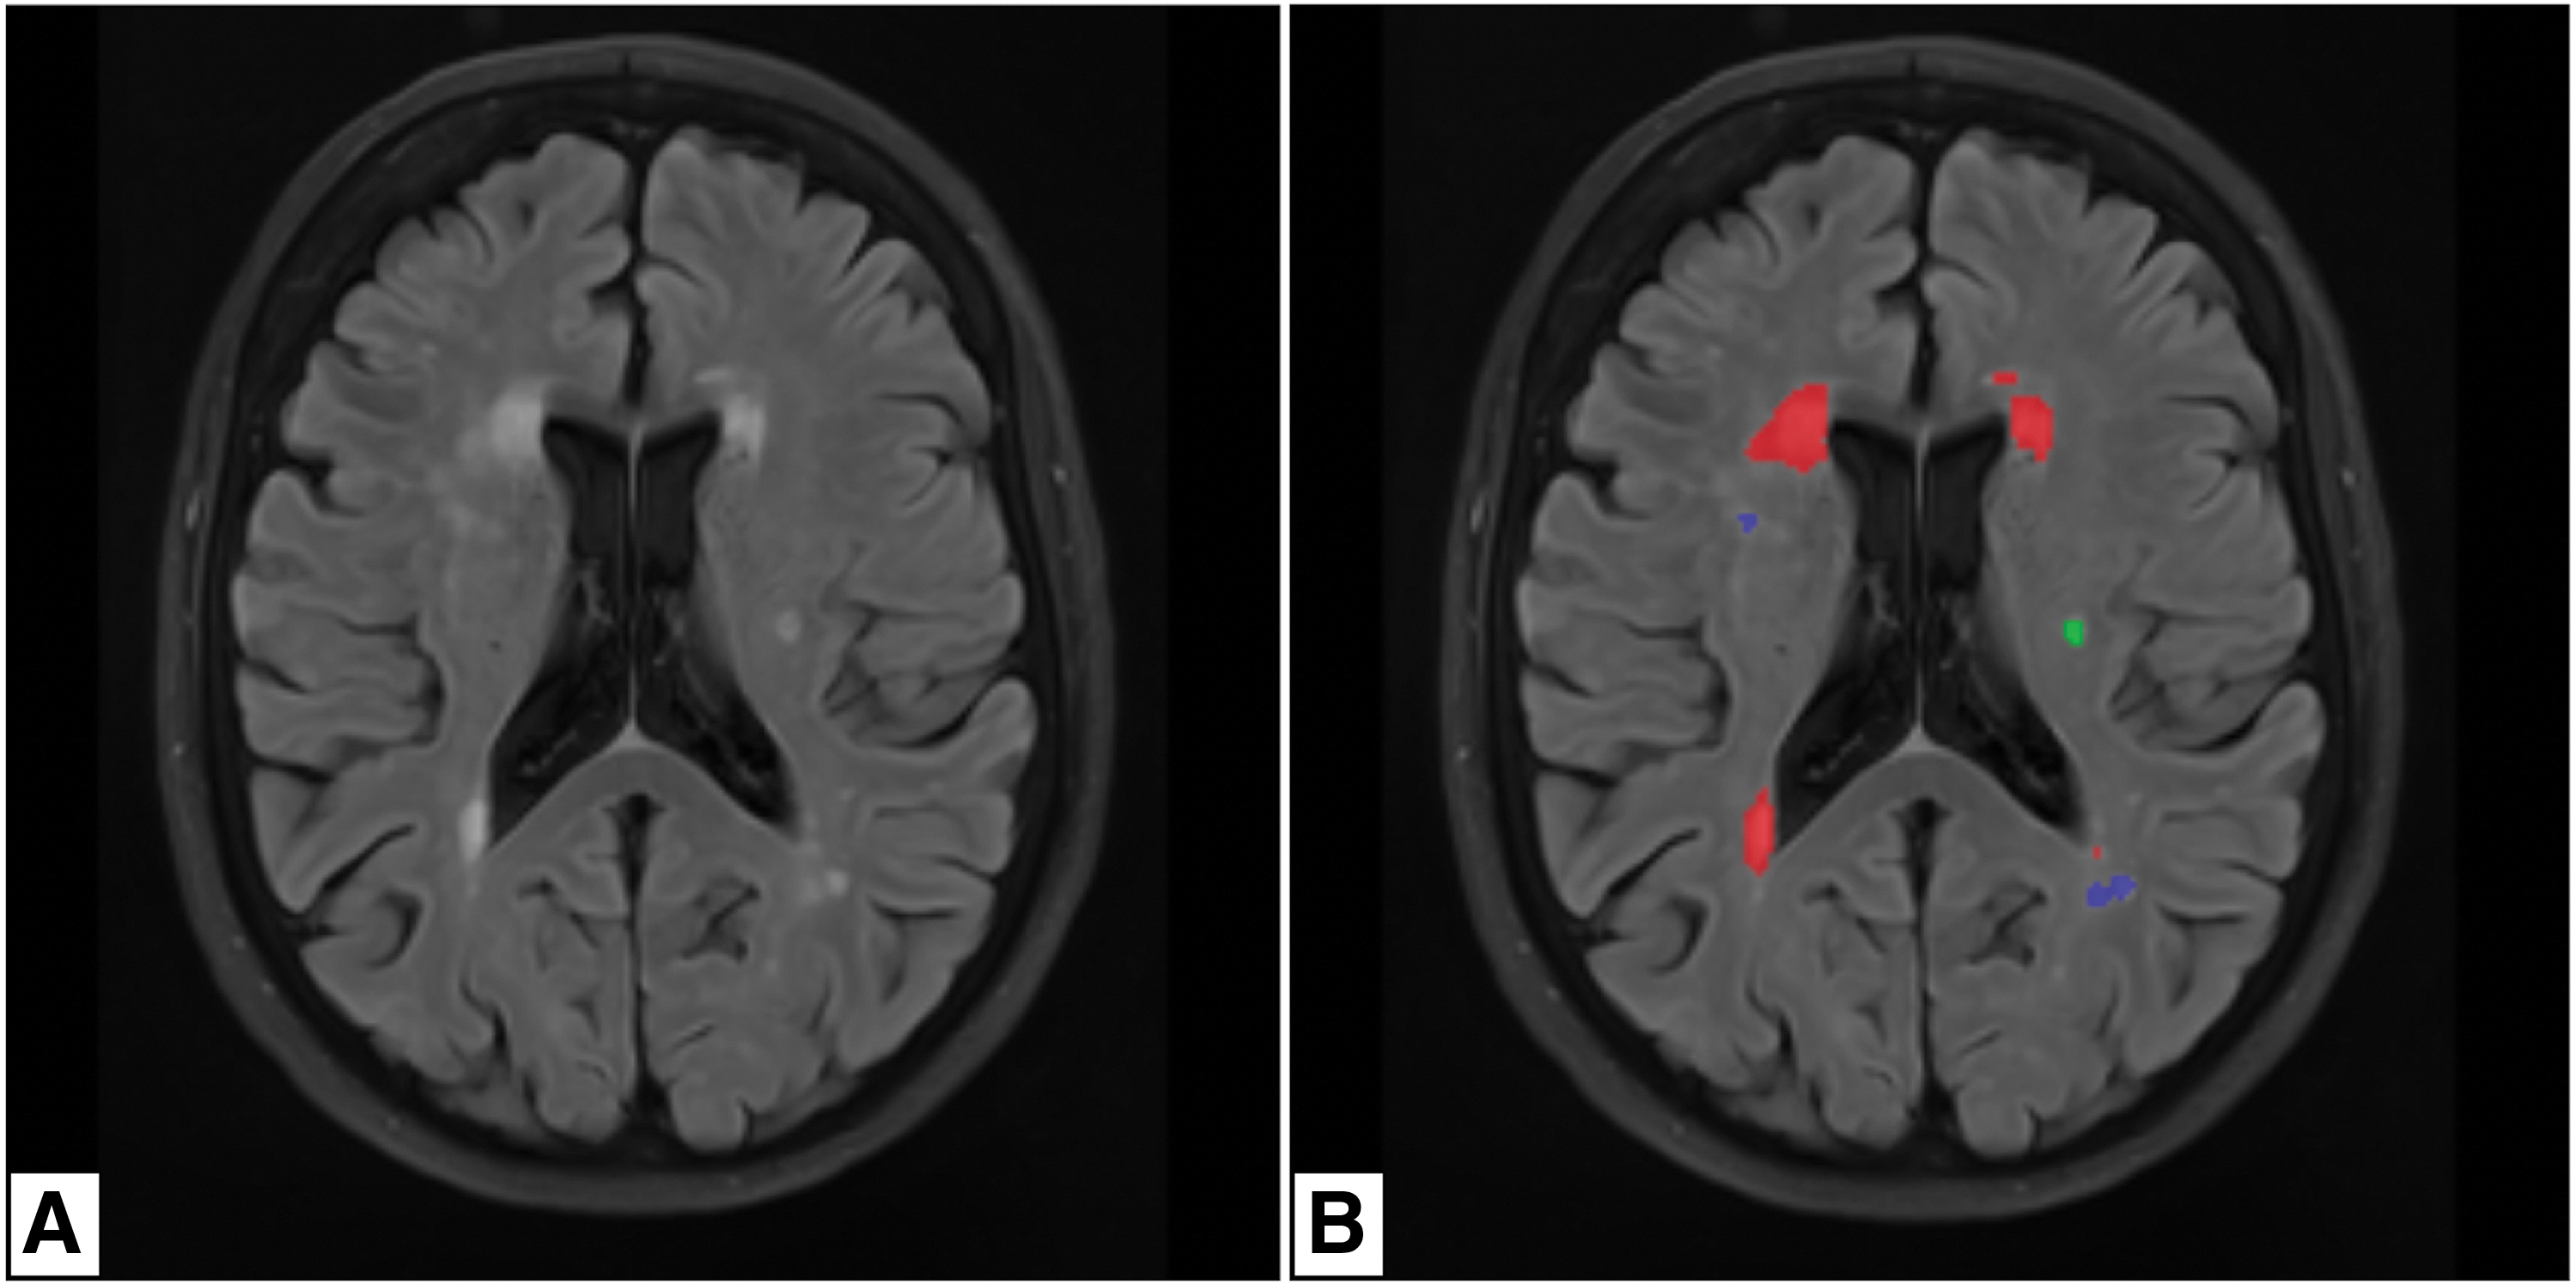
Example of WMH segmentation with brain lesion (Coupé et al., 2018).
The hippocampal volumetric data were obtained from structural MP2RAGE T1-weighted sequence and T2-weighted sequence by using the HIPS online tool (Romero et al., 2017) (Fig. 2). HIPS is a patch-based segmentation automated tool that exploits the sole T1-weighted images (monospectral modality) or both the T1- and T2-weighted images (multispectral modality) for the segmentation of the hippocampus and its subfields (Romero et al., 2017). The pipeline consists of (1) preprocessing for the normalization of the intensity of the images and for their registration into the MNI space; and (2) hippocampus segmentation associated with a systematic error corrector method based on a patch-ensemble of neural networks (Romero et al., 2017). Starting from the MP2RAGE T1-weighted sequences and the isotropic T2-weighted sequences, we exploited the multispectral modality of HIPS with the Kulaga-Yoskovitz protocol (Kulaga-Yoskovitz et al., 2015) for extrapolating the total hippocampal relative volume (tHRV—i.e., the sum of the absolute volumes of right and left hippocampus [Hippocampus L] divided by the absolute intracranial volume, expressed in percentage).

The data accuracy of the segmentation analyses was verified by two expert neuroradiologists, who were blinded (L.S. and M.P., 12 and 7 years of experience, respectively), and the subjects whose WMH and/or hippocampal volumetric analyses were judged not correct were excluded from the study. The statistical analysis was conducted using the SPSS 24.0 statistical package (SPSS, Inc., Chicago, IL). We performed the Kolmogorov/Smirnov test applying the Lilliefors significance correction, assuming a p-value = 0.200 as a statistical threshold, to verify the normal/non-normal distribution of the following parameters: age of the subjects (expressed in grades), tWMH, pvWMH, dWMH, jcWMH, and tHRV. This test revealed that only tHRV values followed a normal distribution (see below), and for this reason, we choose to perform one-tailed Spearman's correlation analysis for testing the correlations between the abovementioned variables. The correlation coefficient (ρ) was calculated for every single relationship, and p-value <0.05 was used as a statistical threshold to identify statistically significant correlations. In accordance with one of the aims of the study (evaluation of the relationships between supratentorial hippocampal volume and WMH load according to the localization of lesions), a Bonferroni corrected p-value = 0.017 was also taken into account as a statistical threshold for the following three correlations: tHRV–jcWMH, tHRV–dWMH, and tHRV–pvWMH (αcorrected = 0.05/3 = 0.017).
rs-fc group analysis
The rs-fc group analysis was performed exploiting the CONN-fMRI (functional connectivity magnetic resonance imaging) fc toolbox v18b (Whitfield-Gabrieli and Nieto-Castanon, 2012) and SPM 12 tool (Wellcome Department of Imaging Neuroscience, London, United Kingdom) on the MATLAB platform vR2019b (MathWorks, Inc.). Similarly to previous studies (Porcu et al., 2019, 2020a), all the structural MP2RAGE T1-weighted and functional SE-EPI sequences were preprocessed using the CONN's default pipeline for volume-based analysis. The pipeline followed these steps: (1) functional label current functional files as a part list of secondary data sets (“original data label”); (2) functional realignment and unwarping; (3) functional center to (0, 0, 0) coordinates; (4) functional slice-timing correction; (5) functional outlier detection using intermediate settings (97th percentile in normative sample in functional outlier detection system, adopting global-signal z-value threshold = 5 and subject-motion mm threshold = 0.9); (6) functional direct simultaneous segmentation of GM, WM, and cerebrospinal fluid (CSF), and normalization to MNI adopting default tissue probability maps (target resolution = 2 mm); (7) functional label current functional files as a part list of secondary data sets (“mni space data label”); (8) structural center to (0, 0, 0) coordinates; (9) structural simultaneous segmentation of GM, WM, and CSF, and normalization to MNI space adopting default tissue probability maps (target resolution = 2 mm); (10) functional smoothing (8 mm full-width half-maximum Gaussian kernel filter); and (11) functional label current functional files as a part list of secondary data sets (“smoothed data label”). At the end of preprocessing, the correct alignment of structural and functional sequences was visually checked by the same two expert neuroradiologists who checked the data accuracy of the segmentation analyses.
The first 5 volumes of functional sequences were excluded from analysis to limit the bias derived by the achievement of the steady-state magnetization (Chiacchiaretta and Ferretti, 2015). Blood oxygen-level-dependent (BOLD) signals registered in CSF and cerebral WM were removed by exploiting the principal component analysis of multivariate BOLD signals within these masks (Porcu et al., 2019; Whitfield-Gabrieli and Nieto-Castanon, 2012). Afterward, the denoising process was applied to the BOLD data using a band-pass filter (0.008–0.09 Hz) to reduce noise effects and low-frequency drift (Porcu et al., 2019; Whitfield-Gabrieli and Nieto-Castanon, 2012).
Finally, a region-of-interest to region-of-interest (ROI-to-ROI) analysis was made. The ROIs were defined by using the CONN's default atlas, which consists of 132 ROIs, the Harvard/Oxford atlas (Desikan et al., 2006; Goldstein et al., 2007) was used for the definition of cortical and subcortical ROIs, and the automated anatomical labeling (AAL) atlas (Tzourio-Mazoyer et al., 2002) for the definition of cerebellar ROIs. Individual correlation maps of the whole brain were created by the mean resting-state BOLD time course of every single ROI, obtaining the correlation coefficients with the BOLD time-course between ROIs (Porcu et al., 2019; Whitfield-Gabrieli and Nieto-Castanon, 2012). Correlations were generated by using the general linear model and bivariate correlation analysis weighted for hemodynamic response function: higher Z-scores indicated positive correlations, indicating increased connectivity between ROIs as a reflection of increased synchronicity between them; lower Z-scores indicated negative correlations, indicating decreased connectivity between ROIs as a reflection of decreased synchronicity between them (Porcu et al., 2019; Whitfield-Gabrieli and Nieto-Castanon, 2012). Fisher's transformation was then applied to all Z-scores, and correlation coefficients were converted into standard scores (Porcu et al., 2019; Whitfield-Gabrieli and Nieto-Castanon, 2012). The group rs-fc ROI-to-ROI analyses were made, including age, pvWMH, dWMH, and jcWMH as second-level covariates. Three multiple regression analyses were then performed: pvWMH were the dependent variable for the first analysis (analysis 1), jcWMH for the second one (analysis 2), and dWMH for the third one (analysis 3). Collinearity diagnostics were performed prior the rs-fc analyses for evaluating the presence of multicollinearity among independent variables by checking the variance inflation factor (VIF): multicollinearity was considered absent when all the independent variables showed VIF = 1, mild when all the independent variables showed VIF <4, and severe if at least one independent variable showed VIF >4 (Hair et al., 2010).
The graph theoretical analysis (Achard and Bullmore, 2007) was made with the CONN's integrated tool, considering the ROIs as nodes and the suprathreshold connections as edges of the network (Nieto-Castanon, 2020). The following values were calculated for every ROI of the network (Nieto-Castanon, 2020): (1) degree (the number of edges from/to each ROI); (2) average path length (the average path distance between the considered ROI and all other ROIs in the subgraph of connected ROIs); (3) clustering coefficient (the proportion of connected edges in the local neighboring subgraph for an ROI); (4) global efficiency (the average inverse distances between the ROI and all other ROIs in the same graph); (5) local efficiency (global efficiency of the neighboring subgraph of the ROI); and (6) betweenness centrality (the proportion of times that an ROI is part of a shortest path between any two pairs of ROIs within a graph). For the calculation, a two-sided p-value corrected for false discovery rate (p-FDR) <0.05 as a statistic threshold for identifying statistically significant correlations between ROIs and a two-sided cost value = 0.15 as an adjacency matrix threshold for network edges were adopted (Alexander-Bloch et al., 2013; Dalong et al., 2020; Porcu et al., 2020b).
Results
Demographic and volumetric data
Of the 227 subjects included in the original data set, 182 were excluded because they had one or more of the exclusion criteria cited in the “population” section, and other 7 subjects were excluded after the volumetric analysis of WMH because they were not judged correct (no patients with infratentorial lesions were found); no subjects were excluded because of incorrect volumetric evaluation of the hippocampal volume, neither because of the presence of motion artifacts detected in the rs-fc analysis. The final population study consisted of 38 subjects. The details of the population selection are reported in Supplementary Tables S2 and S3.
The demographic data are reported in Table 1, as well as the results of the volumetric analysis of WMH and hippocampus. The population study included 9 females and 29 males between 20 and 75 years of age (between grade 5 and 15 according to the age categorization; median grade: 6). The mean tWMH value was 0.963% (lower value = 0%; upper value = 6.392%), the mean pvWMH value was 0.152% (lower value = 0%; upper value = 1.230%), the mean jcWMH value was 0.800% (lower value = 0%; upper value = 5.420%), the mean dWMH value was 0.012% (lower value = 0%; upper value = 0.021%), and the mean tHRV value was 0.494% (lower value = 0.395%; upper value = 0.617%).
Demographic Data and Data Derived from Volumetric Analysis of White Matter Hyperintensities and Hippocampus
The subject corresponds to the one reported in the LEMON data set [22].
dWMH, deep white matter hyperintensity; jcWMH, juxtacortical white matter hyperintensity burden; LEMON, Leipzig Study for Mind/Body/Emotion Interactions; pvWMH, periventricular white matter hyperintensity; subject ID, subject identifier; tHRV, total hippocampal relative volume; tWMH, total white matter hyperintensity.
The Kolmogorov/Smirnov test revealed that only the tHRV scores showed normal distribution (Table 2). The following Spearman's correlation tests identified 10 statistically significant correlations (p < 0.05), 9 positive and 1 negative (Table 3). One statistically significant negative correlation was found between dWMH and tHRV (ρ = 0.331, p = 0.042) (Fig. 3). No statistically significant positive or negative correlations were found between age and dWMH, age and tHRV, tWMH and tHRV, pvWMH and tHRV, and between jcWMH and tHRV, When the Bonferroni corrected p = 0.017 was taken into account as statistical threshold for the correlations between tHRV–jcWMH, tHRV–dWMH, and tHRV–pvWMH, no statistically significant findings were found.
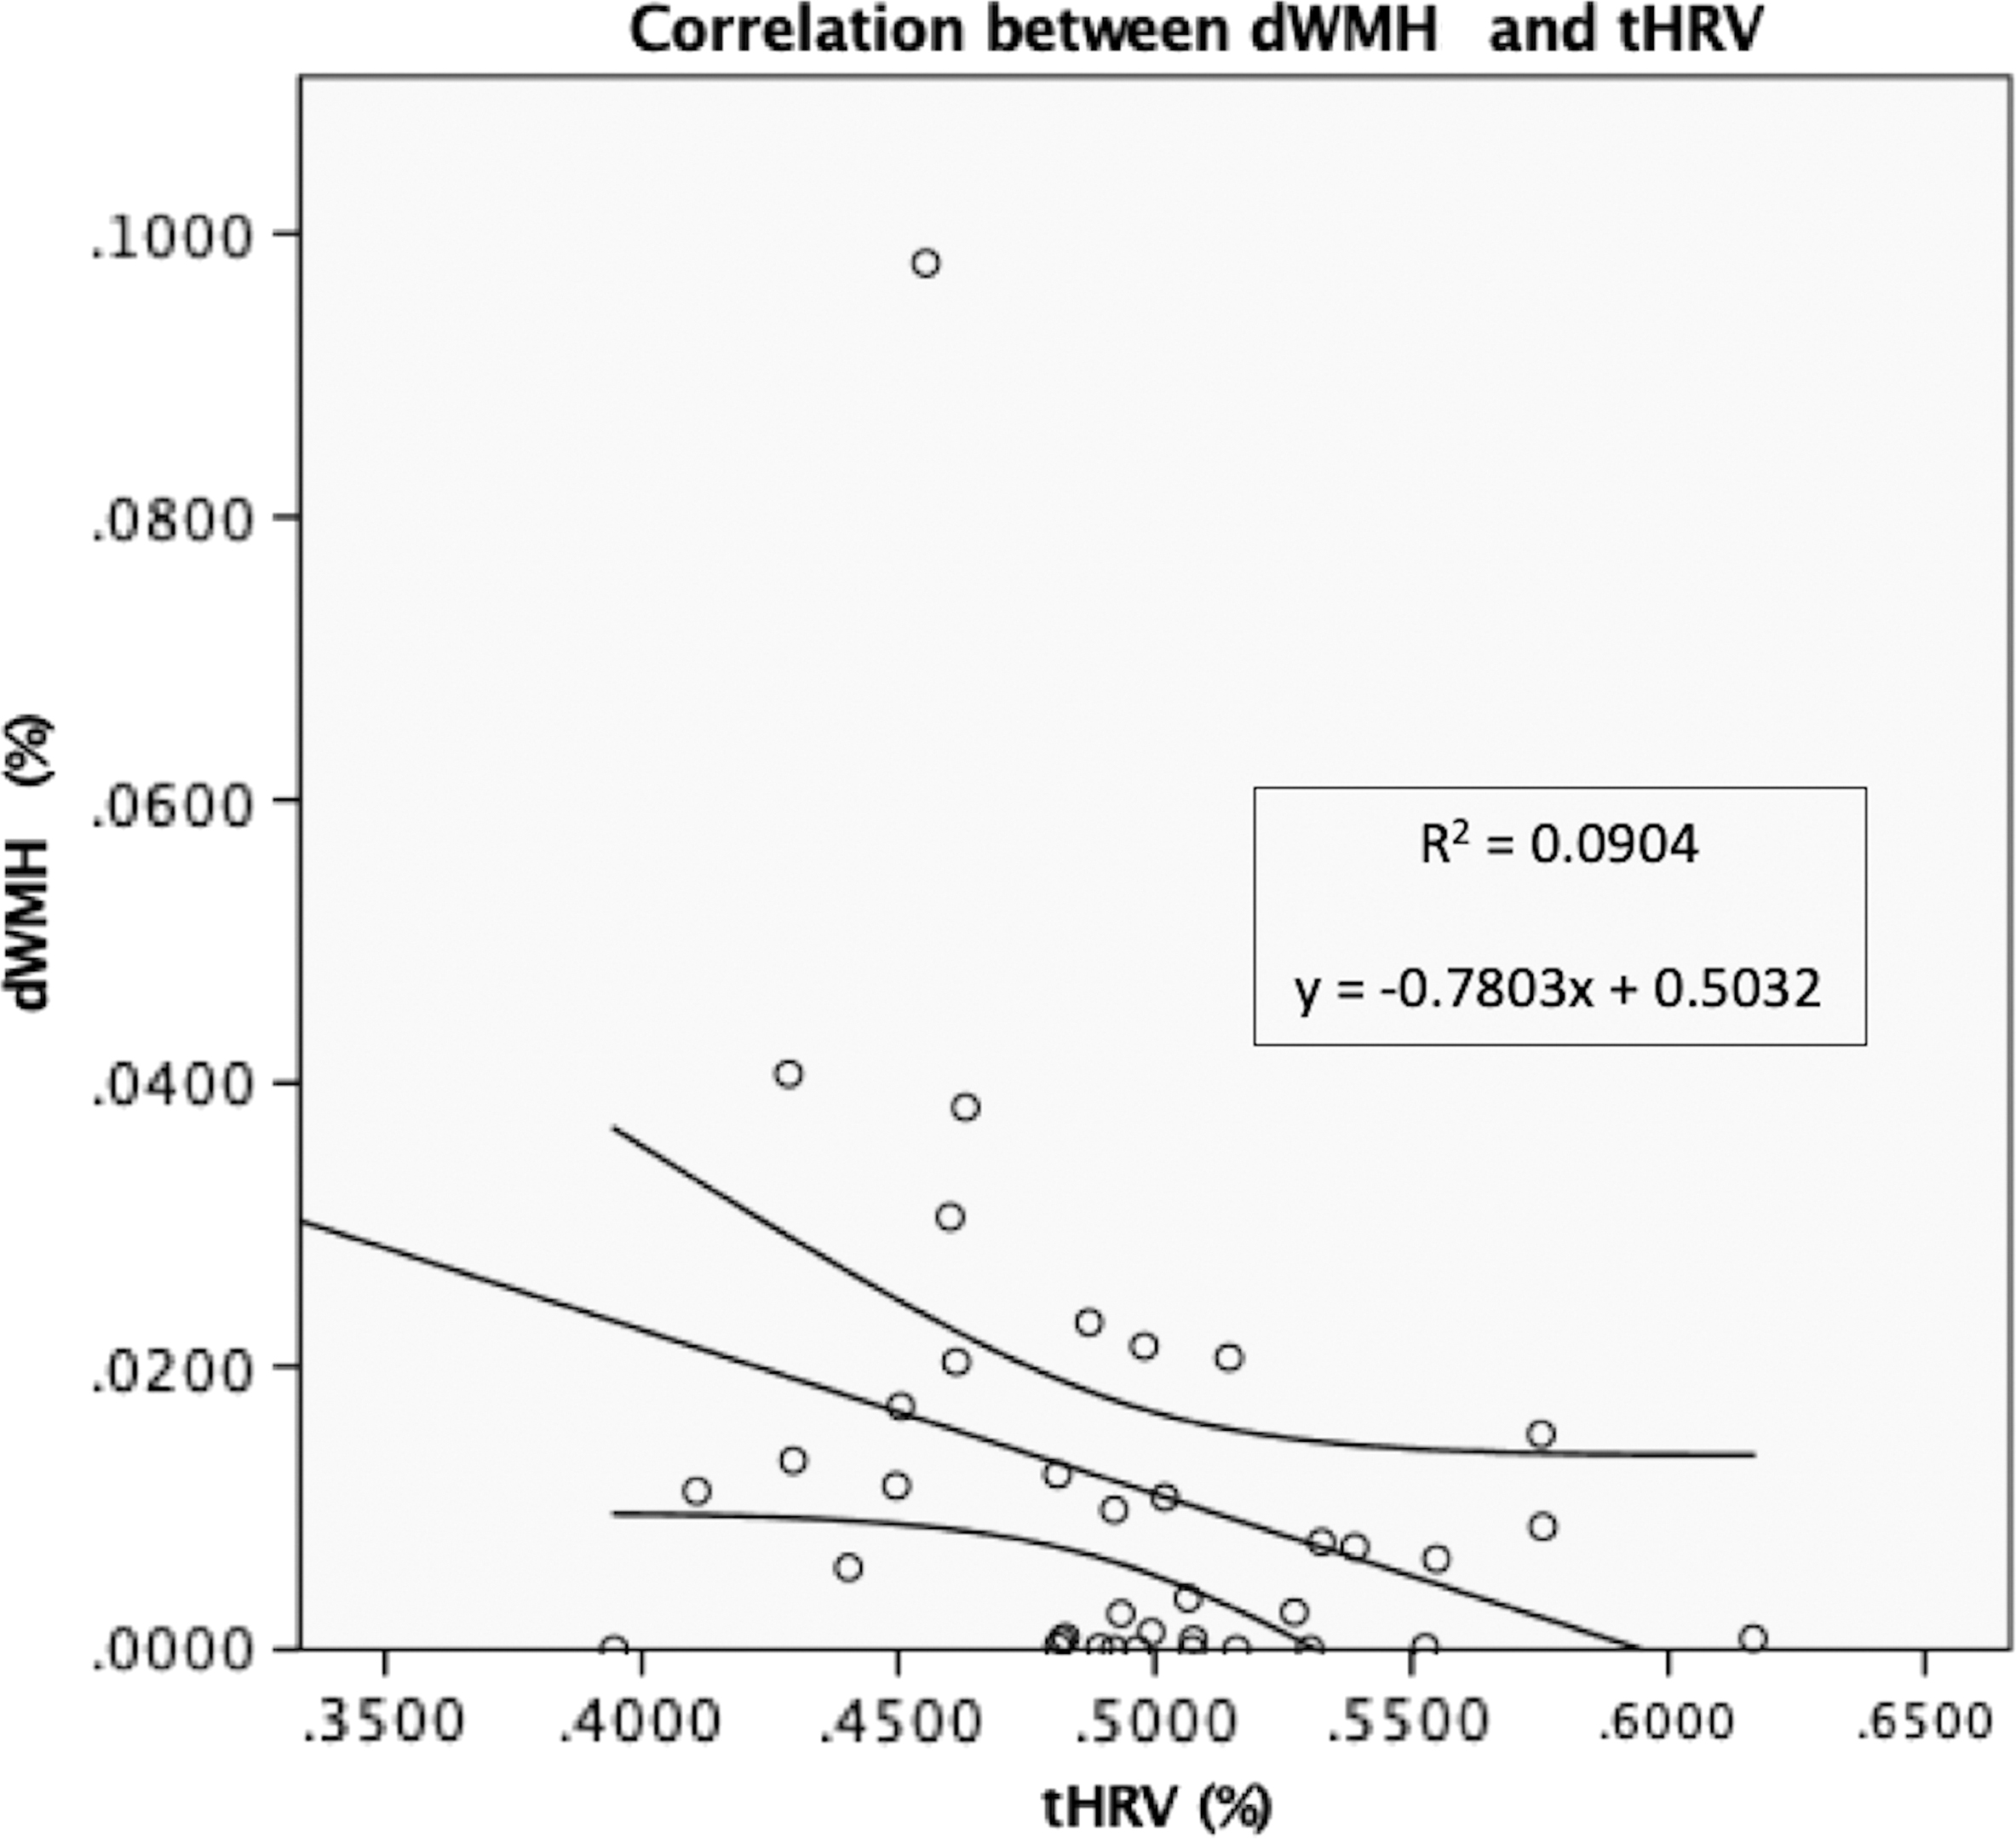
Negative correlation between dMWH and tHRV. R 2 = 0.0904; equation: y = −0.7803x + 0.5032. tHRV, total hippocampal relative volume.
Results of Kolmogorov/Smirnov Test with Lilliefors Significance Correction
This is a lower bound of the true significance.
df, degree of freedom; jcWMH, juxtacortical white matter hyperintensity burden.
Spearman's Correlations
Statistically significant result (p < 0.05).
No statistically significant results for Bonferroni-corrected p-value (p < 0.017).
ρ, Spearman's correlation coefficient.
rs-fc group analysis
The quality check results are reported in Supplementary Table S4. The alignment of structural and functional data was considered correct for every subject included in the analyses by both the neuroradiologists.
The independent variables showed VIF <2 in all the analyses, indicating mild multicollinearity (Table 4).
Results of Collinearity Diagnostics
VIF, variance inflation factor.
Analyses 1 (effects of pvWMH) and 2 (effects of jcWMH) did not reveal any statistically significant results. Analysis 3, focalized on the effects of dWMH, revealed several statistically significant results. The properties of several ROIs of the network resulted being influenced by dWMH: Global efficiency resulted reduced in the posterior division of the left parahippocapal gyrus (pPaHC L—beta = −4.36; t = −6.41; p-FDR = 0.000033), hippocampus L (beta = −2.84; t = −5.47; p-FDR = 0.000277), and right hippocampus (hippocampus R—beta = −2.53; t = −5.05; p-FDR = 0.000649). Average path length resulted increased in hippocampus L (beta = 21.54; t = 8.46; p-FDR <0.000001) and hippocampus R (beta = 14.32; t = 6.21; p-FDR = 0.000035). Local efficiency resulted reduced in hippocampus R (beta = −6.73; t = −6.44; p-FDR = 0.000036) and left putamen (putamen L—beta = −6.9; t = −4.11; p-FDR = 0.0016099). Betweenness centrality resulted increased in the right amygdala (amygdala R—beta = 0.4; t = 4.42; p-FDR = 0.007308) and in cerebellum 3 left (cereb3 L—beta = 0.24; t = 4.39; p-FDR = 0.007308).
No ROIs were influenced in terms of degree and clustering coefficiency. The results of analysis 3 are reported in Table 5 and Figure 4.
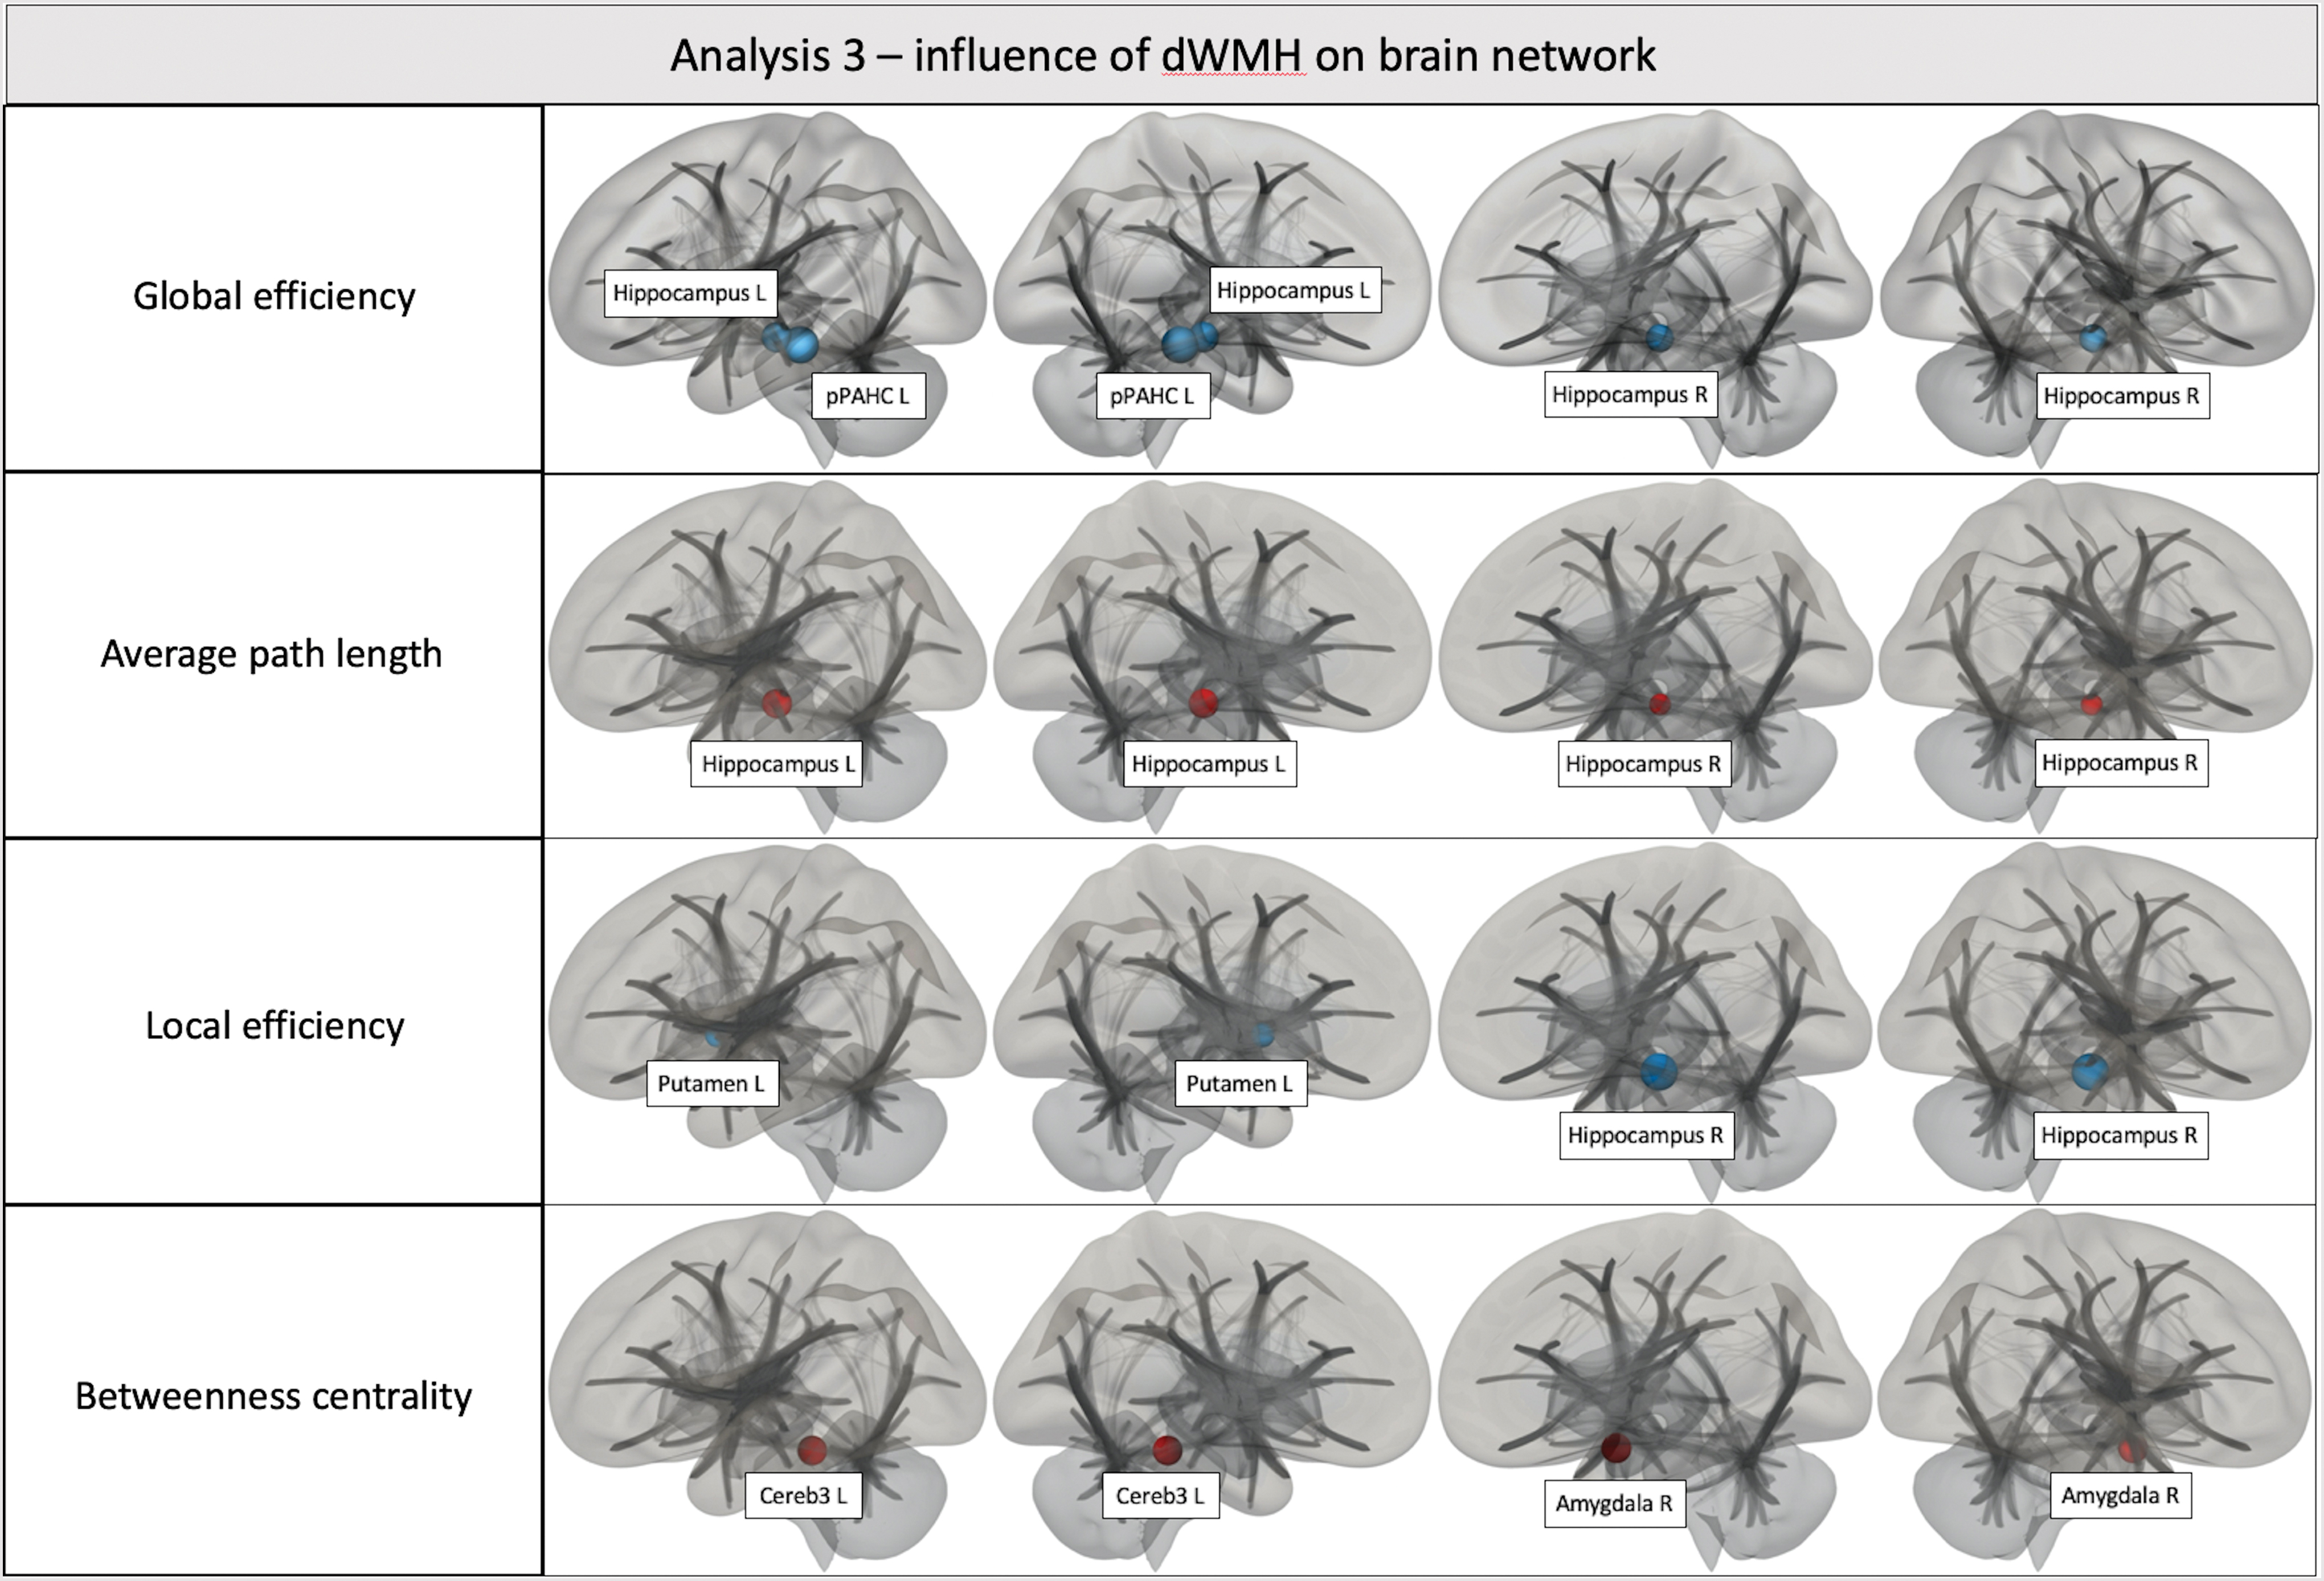
Analysis 3—effects of dWMH on brain network. Amygdala R, right amygdala; Cereb3 L, cerebellum 3 left; hippocampus L, left hippocampus; hippocampus R, right hippocampus; pPaHC L, posterior division of the left parahippocampal gyrus; putamen L, left putamen. Color images are available online.
Results of the Region-of-Interest to Region-of-Interest Analysis Following the Application of the Graph Theory
Amygdala R, right amygdala; Cereb3 L, cerebellum 3 left; hippocampus L, left hippocampus; hippocampus R, right hippocampus; MNI, Montreal Neurological Institute; p-FDR, p-value corrected for false discovery rate; pPaHC L, posterior division of the left parahippocampal gyrus; p-unc, p uncorrected; putamen L, left putamen; ROI, region-of-interest.
Discussion
The relationship between WMH and age (Sachdev et al., 2007) has been described in several previously published articles, whereas the correlation between WMH load and hippocampal shrinkage was recently demonstrated by Fiford et al. (2017). In addition, some fc-rs magnetic resonance studies already investigated the influence of WMH burden on brain connectivity in HS (Benson et al., 2018; De Marco et al., 2017; Leuchter et al., 1994; Reijmer et al., 2015). In the current study, our results showed how the distribution of WMH influences both the hippocampal volume and the architecture of brain networks in HS.
The morphometric analysis confirms that tWMH burden tends to increase with aging (Sachdev et al., 2007). However, although tWMH load is positively correlated to pvWMH and jcWMH, no statistically significant correlations were found between tWMH and dWMH and between age and dWMH. According to these findings, we hypothesize that the expression of dWMH follows an independent pathway compared with pvWMH and jcWMH due to the different suggested etiopathogenesis of these lesions (Gouw et al., 2011). For example, it has been hypothesized that pvWMH recognized in chronic hemodynamic abnormalities the more likely development mechanism, whereas dWMH seem to be more likely related to ischemic changes due to atherosclerosis or microembolic events (Kim et al., 2008). Moreover, previous studies found an association between dWMS and cardiovascular risk factors: Strassburger et al. (1997) showed that subjects with hypertension showed increased dWMH load (but not pvWMH) when compared with age-matched normotensive individuals. More recently it was shown that dWMH and pvWMH have different progression rates with aging, and that the progression of dWMH is associated with cardiovascular mortality (Sabayan et al., 2015). The same study, interestingly, evidenced that the progression of pvWMH was associated with noncardiovascular mortality (Sabayan et al., 2015). The impact of jcWMH on hippocampal volume loss would be less evident due to the involvement of short association fibers (U-fibers); similarly, the impact of pvWMH on hippocampal shrinkage would be minimal due to the low number of long-association fibers directed to the limbic region, although the periventricular fiber system consists of important crossroad areas (Judas et al., 2005). Another interesting finding derived from these correlation analyses is related to the fact that only dWMH load resulted to be inversely correlated to tHRV. We know from neuroanatomic studies that the long association fibers of the brain pass mainly through the deep WM, and that lesions of these nerve bundles alter the connection between cortical areas engaged in different cognitive fields (Schmahmann et al., 2008). According to this, we assume that dWMH could prevent the regular interconnection between cortical areas, in particular the fibers of the corticolimbic system, leading to hippocampal volume loss, as the final result of Wallerian degeneration (von Bohlen und Halbach and Unsicker, 2002). A recent diffusion tensor imaging (DTI) study by Reginold et al. (2018), which evidenced the alteration of diffusion properties of the WM tracts surrounding WMH along with WM pathways crossing the WMH, represents another evidence in support of this hypothesis.
The rs-fc analysis revealed that dWMH load represents the most relevant element that influences the weight of brain networks, whereas no significant results were found in analysis 1 (focused on the pure effects of pvWMH) and analysis 2 (focused on the effects of jcWMH). In particular, increased values of dWMH load were associated with increased average path length and reduced global efficiency in both the hippocampi. These data suggest that dWMH influence the activity of both hippocampi by reducing the centrality of these ROIs within the cerebral network or, in other words, reducing the degree of global connectedness of both the hippocampi within the network (Nieto-Castanon, 2020). Hippocampus R showed also reduced local efficiency, indicating a reduction of the ability of this ROI to transfer information at the local level. Reduced local efficiency was also found in the putamen L, whereas the pPaHC L resulted reduced in global efficiency. Finally, the amygdala R and the Cereb3 L showed increased betweenness centrality, indicating increased centrality of these structures within the network.
Although to the best of our knowledge the present study is the first to address these features in HS, it is worthwhile to interpret more holistically our data according to other investigations led in previous subjects. It is pertinent to recall that the most relevant hippocampal efferents return to the subicular complex and to the most inner part of the entorhinal cortex from where the information is routed back to several parts of the neocortex, giving rise to a complex choreography of a recurrent multiplexed loop (Buzsáki et al., 2003; Buzsáki, 1996); based on these considerations it becomes intuitive that even a small interruption in this circuitry of recurrent pathways, which integrate the process of sophisticated retrieval of episodic memory and spatial maps, can easily induce crucial disruptions. Indeed, it has been evidenced that WMH correlate with cognitive decline (Brickman et al., 2009) and of particular interest is the observation that those located in the parietal lobe can predict impending severe cognitive decline despite normal hippocampal volumes (Brickman et al., 2012).
Together, the results of our explorative research allow us to speculate that the dWMH induce hippocampal atrophy through direct or indirect damage of the long association fibers of the deep WM, in particular the fibers of the corticolimbic system. The hippocampal structural changes are accompanied by alteration of the activity of hippocampus revealed by rs-fc. These complex alterations would induce a decreased ability to transfer information both at the global level and at the local level of the hippocampus R by impairing the functions of spatial and memory retrieval (Abrahams et al., 1997) since these lesions disrupt the correct structural and biochemical hippocampal operations along the entire sleep/wake cycle (Marrosu et al., 1995).
It is also interesting to note that the dWMH load influences the activity of other several cerebral regions. We observed reduction of global efficiency in pPaHC (involved in many cognitive processes, including episodic memory and visuospatial processing; Aminoff et al., 2013), reduced local efficiency of the putamen L (involved in the articulatory process; Abutalebi et al., 2013), and the increased betweenness centrality of amygdala R (a structure implied in instructed and experienced-based fear; Braem et al., 2017), and Cereb3 L (cerebellar region whose alterations are correlated with ataxia; Schmahmann, 2019).
In this study, we have identified several limitations. The first one is related to the sample count represented by the relatively low number of patients, even if the study was designed as exploratory: we applied strict exclusion criteria to minimize potential biases related to the presence of conditions such as drug consumption and alcohol dependence. Another significant limitation of the analysis, somewhat related to the abovementioned, is the potential bias related to the gender disproportion in the study population (9 females and 29 males), considering the fact that it is noted that WMH are more common in women than in men (Sachdev et al., 2009); this parameter should have to be taken into account in a future confirmative study.
For what concerns the correlation's analyses, another important limitation is related to the fact that no statistically significant results were found in the correlations between tHRV and jcWMH, dWMH, and pvWMH when the Bonferroni corrected p-value was taken into account. In our opinion, the exploratory nature of the study can justify the choice of considering statistically significant the result of the correlation between tHRV and dWMH, avoiding applying a multiple comparison correction. Furthermore, the p-value obtained in this analysis (p = 0.021) slightly exceeds the Bonferroni-corrected p-value adopted as the statistical threshold (p = 0.017); in our opinion, these data are noteworthy because they can be interpreted as a strong clue that this correlation would result statistically significant in future confirmative studies with bigger study populations, although this theory is purely speculative.
Besides the low sample size, the presence of a mild degree of multicollinearity between the independent variables in all the rs-fc analyses represents another limit of the study. Furthermore, the low VIF values observed allow us reasonably affirm that these values were not severe enough to determine significant biases.
Finally, a possible limit is represented by the absence of correlation with clinical data: indeed, even though several cognitive and behavioral data have been collected in the data set, we focused our attention on the “pure” anatomical elements according to the fact that all the subjects included in the population study were considered to be in healthy conditions. Again, a further longitudinal study with a statistically eloquent cohort of subjects will help to better evaluate whether studies leading with the WMH approach may impact our knowledge on the cognitive decline or other related conditions (e.g., several neurodegenerative diseases).
Conclusions
The load and localization of WMH can subtly modify the neurophysiology of brain activity in HS. Thus, despite soundly statistically significant results not found for jcWMH and pvWMH, the dWMH nonetheless seem to influence the brain networking properties of several cerebral regions. A peculiar consideration concerns the volume of the hippocampi, which is inversely correlated to the dWMH load: this finding is already relevant since the paramount pivotal role and vulnerability of this structure in memory and redirected attention, largely acknowledged in cognitive decline. Following this line of evidence, we hypothesized that the dWMH induce Wallerian-like degeneration of the WM tracts involved, with consequent possible reduced stimulation of the hippocampal regions; the final consequences of this process are the reduction of the hippocampal region volume and the alteration of the function of hippocampi, with impairment of the interplay of the networking among several brain regions.
Ethical Approval
Ethical approval was not required because the study was performed exploiting the public data set LEMON [22].
Data Availability Statement
Due to the large size of our project data (>200 gigabytes), the data of the rs-fMRI elaborations are available through direct request to the corresponding author.
Footnotes
Authors' Contributions
Conceptualization: M.P., L.S., and F.M.; methodology: M.P.; validation: M.P.; data curation: M.P., A.O., A.C., F.D., P.G., and E.S.; investigation: M.P.; writing—original draft: M.P.; writing—review and editing: L.S., F.M., J.S.S., and G.D.; supervision: L.S., F.M., and G.D.
Author Disclosure Statement
The authors declare no competing interests.
Funding Information
This research did not receive any specific grant from funding agencies in the public, commercial, or nonprofit sectors.
Supplementary Material
Supplementary Table S1
Supplementary Table S2
Supplementary Table S3
Supplementary Table S4
References
Supplementary Material
Please find the following supplemental material available below.
For Open Access articles published under a Creative Commons License, all supplemental material carries the same license as the article it is associated with.
For non-Open Access articles published, all supplemental material carries a non-exclusive license, and permission requests for re-use of supplemental material or any part of supplemental material shall be sent directly to the copyright owner as specified in the copyright notice associated with the article.