
Abstract
Background:
Interoceptive signals related to changes in heartbeat, respiration, and gastric functioning continuously feedback to the brain. The interpretation of these signals influences several cognitive, affective, and motoric functions. Previous research has highlighted the distinction between the ability to accurately detect interoceptive information (i.e., interoceptive accuracy) and an individual's beliefs about his or her interoceptive abilities (i.e., interoceptive sensibility). Although numerous studies have delineated the neural substrates of interoceptive accuracy, less is known about the brain areas involved with interoceptive sensibility.
Materials and Methods:
In the current study, 28 healthy participants completed the Multidimensional Assessment of Interoceptive Awareness (MAIA), a self-report measure of interoceptive sensibility, before undergoing a 7-min resting-state functional magnetic resonance imaging scan. IRB ethics approval was obtained prior to data collection.
Results:
Overall MAIA scores, as well as scores on its eight subscales, were entered as covariates in subsequent region-of-interest and independent-component analyses. These analyses yielded three key results. First, interoceptive sensibility was negatively correlated with the functional connectivity of visual regions. Second, the cerebellar resting-state network showed positive correlations with two MAIA subscales, suggesting that this structure plays a role in interoceptive functions. Finally, the functional connectivity of the insula, a structure critical for interoceptive accuracy, was not correlated with any of the MAIA scores.
Conclusion:
These results demonstrate that the brain areas associated with individual differences in interoceptive sensibility show relatively little overlap with those involved with the accurate detection of interoceptive information.
Impact statement
The current research demonstrates that individual differences in interoceptive sensibility (i.e., self-reported sensitivity to interoceptive information) are related to differences in resting-state functional connectivity. These data also indicate that the brain areas related to interoceptive sensibility are different than the brain areas involved with interoceptive accuracy (i.e., the objective detection of interoceptive signals). This latter finding suggests that although the insula is critical for many interoceptive processes, our subjective beliefs about our interoceptive abilities involve other neural structures, particularly visual regions and the cerebellum.
Introduction
Interoception refers to the processing of the body's internal sensations by the central nervous system (Craig, 2009; Critchley and Harrison, 2013). Although the brain and spinal cord process numerous types of sensory information, interoception typically refers to cardiovascular, respiratory, and gastric activity (Quadt et al., 2018). This information originates at specialized receptors such as the baroreceptors found in the aortic arch and carotid bodies, which detect mechanical changes in the walls of blood vessels (Gianaros et al., 2012), or vagus nerve afferents that convey information about gastric distension (Hellström et al., 2004; van Dyck et al., 2016). Changes in the activity of these peripheral nervous system receptors input to laminar I of the spinothalamocortical pathway (Craig, 2002; see also Kornelsen et al., 2015). This information is then transmitted to brainstem nuclei, including the nucleus of the solitary tract, a structure with vast connections to brain areas related to motivation and cognition (Herman, 2018). These include subcortical structures such as the parabrachial nucleus, periaqueductal gray, and hypothalamus (Blessing, 1997), as well as projections to the thalamus, in turn, influencing the activity of the amygdala, insula, medial orbitofrontal cortex, and anterior cingulate gyrus (Critchley and Harrison, 2013).
The posterior insula plays a particularly prominent role in interoceptive processing (Craig, 2002). This structure receives information about bodily sensations and transmits it to agranular cortical neurons in the anterior insula and anterior cingulate regions (Critchley et al., 2004, 2005); these regions compare this bodily feedback to the feedback that the brain had predicted would arise in a given situation (Barrett and Simmons, 2015). As a result of this comparison between real and predicted interoceptive input, the individual can alter his or her predictions of the body's interoceptive response, alter the attention paid to this response, or move the body to alter the incoming sensory information (Barrett and Simmons, 2015). This continuous process allows humans and other primates to adapt both their overt behaviors and their mental models of their body's responses to their environment in a way that optimizes survival.
Initial studies of interoception typically utilized either a heartbeat tracking or a heartbeat discrimination paradigm. In a heartbeat tracking task, participants are asked to monitor the frequency of their heartbeats over a given time period, such as 60 sec (Ainley et al., 2015; Herbert et al., 2007; Schandry, 1981). In a heartbeat discrimination task, participants must determine whether an auditory presentation of a heartbeat is their own heartbeat or not (Brener and Kluvitse, 1988; Whitehead et al., 1977). Although the latter task involves attending to both interoceptive and exteroceptive information, both paradigms typically highlight the important role of the insula and anterior cingulate in interoceptive processing (Simmons et al., 2013; Stern et al., 2017; Wiebking et al., 2014).
These task-based neuroimaging studies are complemented by resting-state functional magnetic resonance imaging (fMRI) research. Chong and colleagues (2017) had participants complete a heartbeat-tracking task outside of the scanner before undergoing a resting-state fMRI scan. They found that interoceptive accuracy correlated with increased functional connectivity of the anterior and posterior insula, orbitofrontal cortex, and midbrain in the salience network (SN). However, although the neural structures identified in these neuroimaging studies are widely accepted as the neural substrates of interoceptive accuracy, heartbeat-tracking and heartbeat-discrimination tasks only assess one component of human interoceptive processing (Garfinkel et al., 2015).
Recent investigations of interoception have concluded that it is most accurately conceptualized as consisting of three different dimensions, interoceptive accuracy, sensibility, and awareness (Garfinkel et al., 2015). Interoceptive accuracy refers to an individual's ability to accurately detect interoceptive information. This component is typically measured using objective tests such as the heartbeat-detection and heartbeat-discrimination tasks described above. Interoceptive sensibility, on the contrary, refers to an individual's belief in his or her sensitivity to interoceptive stimulation. This component is generally quantified via structured interviews or self-report questionnaires. The final dimension, interoceptive awareness, is more meta-cognitive in nature (Garfinkel et al., 2015). It assesses the degree of correspondence between objective and subjective interoceptive abilities (i.e., between interoceptive accuracy and interoceptive sensibility).
Several studies have demonstrated that these three dimensions of interoception are statistically distinct (Calì et al., 2015; Garfinkel et al., 2015). It is therefore reasonable to assume that each ability is associated with at least partially distinct patterns of neural activity. However, although substantial research has examined the neural correlates of objective interoceptive accuracy, less is known about the brain regions involved with interoceptive sensibility (and, by extension, interoceptive awareness).
Isolating the neural structures associated with interoceptive sensibility poses some challenges for researchers. Rather than being testable via accuracy-based tasks such as a heartbeat-tracking experiment, interoceptive sensibility is conceptually similar to a self-belief or a trait. Therefore, it is difficult to isolate this construct using task-based fMRI. Instead, the use of resting-state fMRI may be a more useful tool for investigating individual differences in interoceptive sensibility. This neuroimaging method examines the strength of correlated activity between geographically disparate neural regions when the individual being scanned is not performing a cognitive or motoric task (i.e., is “at rest”; Biswal et al., 1995; Gusnard and Raichle, 2001; Raichle et al., 2001; Raichle, 2015).
This functional connectivity can be measured in several ways; two of the most common include region-of-interest (ROI) analyses and independent-component analyses (ICA). ROI-based studies investigate connectivity patterns among a predefined set of regions, where the connectivity metrics characterize the connectivity between all pairs of ROI's blood oxygenation-level-dependent (BOLD) time series. ICA studies, on the contrary, summarize properties of the entire voxel-to-voxel connectome (i.e., all functional connections between every pair of voxels in the brain) into a series of reduced and interpretable measures at each individual voxel (Nieto-Castanon, 2020). The correlated fluctuations of activity, which may occur in geographically disparate neural regions, suggest that these brain areas function together as networks (Beckmann et al., 2005; Esposito et al., 2005; Hyvärinen and Oja, 2000).
Commonly identified networks include the default mode network (DMN) that is active during mind-wandering and self-focused processing (Andrews-Hanna, 2012; Baird et al., 2013; Buckner et al., 2008; Raichle et al., 2001); a frontoparietal network (FP) that is active during attentional control, emotional regulation, and response inhibition (Chen et al., 2016; Gagnepain et al., 2017; Sridharan et al., 2008; Vincent et al., 2008); an SN that determines the importance of sensory stimuli in the environment (Menon, 2015; Seeley et al., 2007); a dorsal attention network (DAN) that is involved in voluntarily orienting and sustaining attention (Corbetta et al., 2008; Fox et al., 2006); a language network (LAN) involved with the ability to comprehend and produce language (Branco et al., 2019; Shirer et al., 2011); a cerebellar network (CER) involved with sensorimotor and attentional processes (Buckner et al., 2011); as well as sensorimotor network (SMN) and visual network (VIS). Importantly, the scores from self-report measures, such as those used to assess interoceptive sensibility, can be entered as covariates in either ROI- or ICA-based functional connectivity analyses to determine how functional connectivity changes as a function of that quantifiable characteristic (Bilevicius et al., 2018; Parkinson et al., 2019).
In the current research, participants completed the Multidimensional Assessment of Interoceptive Awareness (MAIA; Mehling et al., 2012) before undergoing a resting-state fMRI scan. To be consistent with previous descriptions of interoceptive abilities (Garfinkel et al., 2015), we will refer to the MAIA as a measure of interoceptive sensibility; this is because it is a self-report measure of interoception rather than a physiological assessment. Indeed, recent neuroimaging studies have found that MAIA scores had relatively little relationship with interoceptive accuracy (Baranauskas et al., 2017; Stern et al., 2017).
This questionnaire consists of 32 items and provides an overall score as well as eight subscales that quantify different aspects of interoceptive sensibility, including the tendency to notice and trust bodily sensations, the ability to sustain attention to these sensations, and the ability to regulate responses to interoceptive information. This questionnaire correlates with questionnaires related to mindfulness, attention to bodily sensations, and anxiety (Hanley et al., 2017); the reliability of the MAIA subscales is strong, with Cronbach's alpha scores for the subscales ranging from 0.66 to 0.87 (see Mehling et al., 2012; Table 5). (A complete list of subscales is included in the Materials and Methods section).
The MAIA improves upon the earlier measures of interoception, such as the Body Awareness Questionnaire (Shields et al., 1989), the Porges Body Perception Questionnaire (Porges, 1993), and the Private Body Consciousness Scale (Miller et al., 1981), by thoroughly differentiating different aspects of interoceptive experiences into distinct subscales (Mehling et al., 2012). Therefore, by entering scores from these subscales as covariates in ROI- and ICA-based functional connectivity analyses, it should be possible to identify how patterns of brain connectivity are related to individual differences in self-reported interoceptive abilities.
Although it is difficult to predict the exact relationship between functional connectivity and MAIA subscale scores, the current research did include two critical hypotheses. First, we expected that the functional connectivity of visual regions would be negatively correlated with scores on the MAIA; this is because individuals who tend to have an increased focus on interoceptive information would likely allocate less attention to exteroceptive stimuli, which are usually perceived by the visual system. This negative relationship between MAIA scores and visual regions should be most prominent for the overall MAIA scores and the Attention Regulation subscale.
The second hypothesis relates to the functional connectivity of the insula and anterior cingulate gyrus. As noted above, these regions are critical for interoceptive accuracy. If interoceptive sensibility involves the same neural architecture, then the functional connectivity of these regions should be positively correlated with overall MAIA scores as well as its subscales. If this relationship is not found, then it would suggest that an individual's belief in his or her sensitivity to interoceptive feedback is not necessarily related to the accurate encoding of this information.
Materials and Methods
Participants
Twenty-eight undergraduate students (14 females, age range = 18–24) were recruited to participate in the fMRI study. There were no specific demographic requirements for participation. Exclusion criteria included a history of psychiatric or neurological disorders, claustrophobia, pregnancy, or the presence of metal in the body. Participants received $50 remuneration for their time.
This study was carried out in a manner consistent with the Canadian Tri-Council Policy Statement: Ethical Conduct for Research Involving Humans (2014) and the Declaration of Helsinki. All participants provided informed, written consent and underwent MR safety screening before entering the MRI environment. This study received ethics (IRB) approval from both the Bannatyne Human Research Ethics Board and the University of Winnipeg Human Research Ethics Board.
Questionnaire
The MAIA is a 32-item questionnaire that assesses different aspects of bodily awareness. For each question, participants are asked to determine how often each statement applies to them on a Likert scale from 0 (never) to 5 (always). The MAIA produces an overall score as well as a score for eight different subscales. Items on the Noticing subscale relate to an individual's awareness of sensations from the body, regardless of whether they are positive, negative, or neutral (e.g., “When I am tense I notice where the tension is located in my body”). Not Distracting items refer to an individual's tendency to ignore or to distract oneself from uncomfortable sensations (e.g., “When I feel pain or discomfort, I try to power through it”). Questions related to the Not Worrying subscale are reverse scored; these questions relate to the degree to which an individual worries about uncomfortable bodily sensations (e.g., “I start to worry that something is wrong if I feel any discomfort”).
Attention Regulation items quantify an individual's ability to control and, if necessary, sustain attention to sensations from the body (e.g., “I can return awareness to my body if I am distracted”). Emotional Awareness items note the link between bodily sensations and emotional responses (e.g., “When something is wrong in my life I can feel it in my body”). Self-Regulation, on the contrary is related to an individual's ability to control emotional reactions to the bodily states (e.g., “I can use my breath to reduce tension”). The next subscale, Body Listening, quantifies a person's tendency to use sensations from the body to help him or her classify his or her own emotional states or to make decisions (e.g., “I listen to my body to inform me about what to do”). Finally, the Trusting subscale measures the degree to which a person believes the accuracy of his or her bodily sensations (e.g., “I trust my body sensations”).
It is worth noting that Mehling and colleagues (2018) have recently published an expanded version of the MAIA that includes five additional items. However, this revised version of the questionnaire (published after data collection for the current study) still contains the 32 items used in the original MAIA as well as the eight subfactors as described above. Therefore, the use of the original MAIA should not limit our ability to examine the relationship between functional connectivity and interoceptive sensibility.
Data acquisition
Data were collected using a 3T Siemens TRIO MRI scanner (Siemens, Erlangen, Germany). The participants first completed an 8-min structural MRI. High-resolution T1-weighted gradient-echo images were obtained with a magnetization-prepared rapid gradient-echo sequence. The parameters for this scan were as follows: slice thickness = 1 mm, interslice gap = 0 mm, TR = 1900 msec, TE = 2.2 msec, in-plane resolution = 0.94 × 0.94 mm, matrix = 256 × 256 matrix, and field of view = 24 cm.
Functional MRI data were acquired via a 7-min (140-volume) scan using a whole-brain echo planar imaging sequence. The parameters of this functional scan were as follows: slice thickness = 3 mm, interslice gap = 0 mm, TR = 3000 msec, TE = 30 msec, flip angle = 90°, matrix = 64 × 64, field of view = 24 cm, and voxel size 3.8 × 3.8 × 3.0 mm. (See Golestani et al., 2017, and Huotari et al., 2019, for a discussion of the effects of TR duration on functional connectivity analyses.)
Data analysis
Both the structural and functional neuroimaging files were converted into NifTI files using the NifTI creator function of SPM version 12. These files were then analyzed using the CONN toolbox version 18b (Whitfield-Gabrieli and Nieto-Castanon, 2012), a MATLAB-based neuroimaging package. The structural data were centered to the coordinates (0,0,0). They were then segmented into white matter (WM), gray matter (GM), and cerebrospinal fluid (CSF). These images were then normalized to the template of the Montreal Neurological Institute (MNI).
The functional MRI data were realigned and unwarped. Like the structural data, they were also centered to the coordinates (0,0,0). These data then underwent slice time correction before being segmented into WM, GM, and CSF. Potential outliers were detected using the Artifact Detection Tool (ART toolbox available online) and included the CONN default settings of global BOLD signal above five standard deviations and subject motion as framewise displacement greater than 0.9 mm. The data were then normalized to the MNI template and underwent spatial smoothing using an 8 mm Gaussian kernel.
Functional data then underwent a denoising procedure. During denoising, WM, CSF, and outliers detected by the ART toolbox were input as confounding effects in a linear regression. The estimated subject motion parameters were also regressed from the data during denoising and included the three translation and three rotation parameters and their first-order derivatives (for a total of 12 realignment parameters). Quality assurance was run following denoising, and the average framewise displacement was calculated at 0.15 mm. The default bandpass filter (0.008–0.09 Hz) was applied as part of the linear detrending process. Global signal regression was not applied.
The ROI-based functional connectivity analysis in the CONN toolbox used the general linear model (GLM; correlation-analysis settings, with no weighting applied). The Fisher-transformed bivariate correlation coefficients between each pair of ROIs were calculated. This ROI-to-ROI analysis used the “CONN atlas” ROIs. The atlas ROIs are defined from the FSL Harvard/Oxford Atlas maximum likelihood cortical atlas divided bilaterally into left and right hemispheres (91 ROIs; Desikan et al., 2006), the FSL Harvard/Oxford Atlas maximum likelihood subcortical atlas excluding the cerebral WM, cerebral cortex, and lateral ventrical areas (15 ROIs), and the cerebellar parcellation from AAL Atlas (26 ROIs; Tzourio-Mazoyer et al., 2002).
All 132 of the nodes in the atlas were used as both sources and targets. Once the ROI-to-ROI functional connectivity measures were obtained for each pair of regions, individual's MAIA scores were entered as second-level covariates and the subject-effects were assessed, indicating the relationship of the scores with the functional connectivity of each ROI pair. The total scores on the MAIA, as well as the scores for each of the eight subscales of this questionnaire, were entered as covariates of interest. The resulting group-level statistical parametric maps were set to a threshold by intensity of p < 0.01, two-sided, false discovery rate (FDR) corrected. These maps represent the relationship between the functional connectivity measures for each pair of ROIs and the MAIA scores.
To examine network measures across the whole-brain connectome, an ICA-based functional connectivity analysis was run in the CONN toolbox. This process used group-ICA methodology (Calhoun et al., 2001), used a FastICA for estimation of independent spatial components, and GICA1 back-projection for individual subject-level spatial map estimation. The number of components used in the ICA was 20 and the dimensionality reduction was set to 64. This number of components was selected to allow us to compare the results of the current examination of interoceptive sensibility with previous functional connectivity research from our laboratory that investigated the sensory-emotional phenomenon known as autonomous sensory meridian response (ASMR; see Smith et al., 2017, 2019); these previous studies used 20 ICA components. Ongoing research is examining the relationship between ASMR and interoception.
To identify the brain resting-state network within each component, CONN's correlational spatial match-to-template approach was utilized. These components (listed alphabetically) were the following networks: CER, DAN, DMN, FP, LAN, SN, SMN, and VIS. As with the ROI-to-ROI analysis, once the ICA functional connectivity measures were obtained, individual's MAIA scores were entered as second-level covariates and the subject-effects were assessed, indicating the relationship of the scores with the functional connectivity within each component.
The total score and the scores for each of the eight subscales of the MAIA were entered as covariates of interest. The resulting group-level statistical parametric maps were displayed at p < 0.001 uncorrected, and at a cluster-wise threshold of p < 0.01, FDR-corrected. Whereas analysis and results are restricted to the activity of the voxels within a predefined region in an ROI analysis, all voxels are included in an ICA. Therefore, the results of an ICA can include voxels that are part of resting-state networks as well as additional voxels that are outside these networks (e.g., a component containing the VIS could also include significant voxels in the frontal lobes). The maps represent the relationship between the functional connectivity between voxels within a component and the MAIA scores.
It is important to note that although this study involved a number of covariates, the data for both the ROI analyses and ICA underwent corrections for multiple comparisons. For the ROI analyses, the FDR-corrected cluster-level p-value reflects the expected proportion of false discoveries among all pairs of network with similar or larger effects across the entire set of pairs (Nieto-Castanon, 2020). For the ICA, a combination of an uncorrected height threshold to define clusters of interest from the statistical parametric maps and an FDR correction for a cluster-level thresholding among the resulting clusters was used (Nieto-Castanon, 2020).
Results
The functional connectivity data were measured using both an ROI- and an ICA-based approach. Each set of results are discussed separately. Participants' gender did not significantly influence the results of any analysis and is not discussed further.
Before describing the results, it is important to clarify what a positive or negative correlation means in the current study. For each result that follows, we plotted the MAIA scores and functional connectivity correlations to examine the patterns in the data. For all of the results reported below, negative correlations indicate that as MAIA scores increased, functional connectivity for a given brain area decreased. Positive correlations indicate that as MAIA scores increased, so too did the functional connectivity of the regions identified below.
ROI-based analyses
Individual differences in overall scores on the MAIA were negatively correlated with the reciprocal connectivity of the right thalamus and left intracalcarine cortex (Fig. 1 and Table 1). No other significant effects were detected for these overall values.

ROI-to-ROI analysis of MAIA Total scores. Individual differences in overall scores on the MAIA were negatively correlated with the reciprocal connectivity of the right thalamus and left intracalcarine cortex in the ROI-to-ROI analysis (p < 0.01, two-sided, FDR-corrected). FDR, false discovery rate; MAIA, Multidimensional Assessment of Interoceptive Awareness; ROI, region-of-interest.
Region-of-Interest-to-Region-of-Interest Results Showing Functional Connectivity Differences Covaried with the Overall Scores on the Multidimensional Assessment of Interoceptive Awareness Questionnaire
Threshold ROI-to-ROI connections by intensity, FDR p < 0.01, two-sided.
FDR, false discovery rate; ROI, region-of-interest; R, right; L, left.
Scores on the Attention Regulation subscale of the MAIA were related to three different reciprocal relationships (Fig. 2 and Table 2). The functional connectivity between the left amygdala and both the left lingual gyrus and left intracalcarine cortex was negatively correlated with Attention Regulation scores. A similar negative correlation was observed with the connectivity between the left nucleus accumbens and left cuneus.
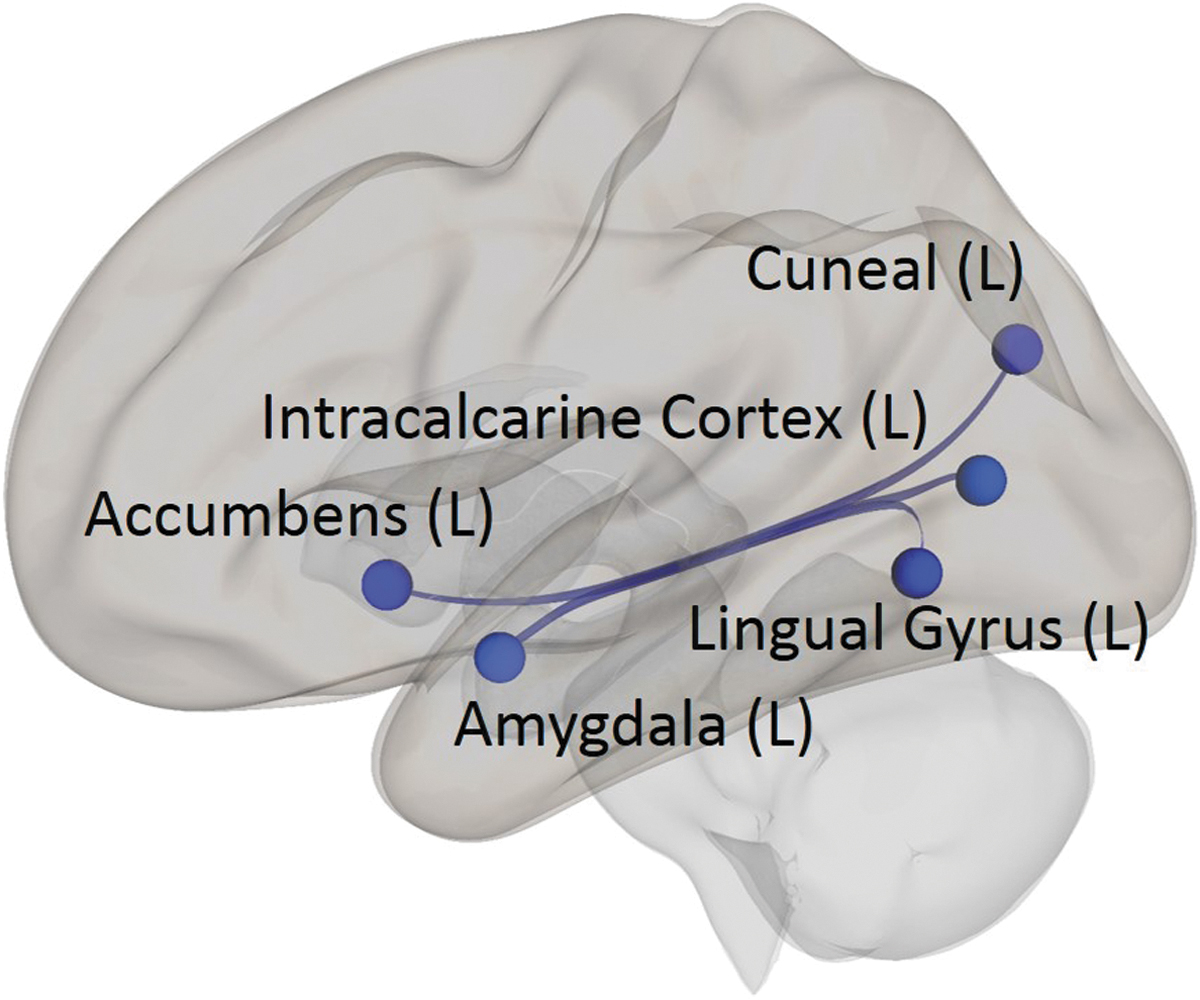
ROI-to-ROI analysis of MAIA Attention Regulation subscale scores. The ROI-to-ROI analysis shows that scores on the Attention Regulation subscale of the MAIA were negatively correlated with reciprocal functional connectivity between the left amygdala and left lingual gyrus and left intracalcarine cortex, and between the left nucleus accumbens and left cuneus (p < 0.01, two-sided, FDR-corrected).
Region-of-Interest-to-Region-of-Interest Results Showing Functional Connectivity Differences Covaried with Average Scores on the Attention Regulation Subscale of the Multidimensional Assessment of Interoceptive Awareness
Threshold ROI-to-ROI connections by intensity, FDR p < 0.01, two-sided.
R, right; L, left.
The final significant effect detected in the ROI-based analyses related to scores on the Not Distracting subscale of the MAIA (Fig. 3 and Table 3). These scores were negatively correlated with the functional connectivity between the right frontal operculum and right frontal pole.

ROI-to-ROI analysis of MAIA Not Distracting subscale scores. The MAIA Not Distracting subscale scores negatively correlated with the functional connectivity between the right frontal operculum and right frontal pole in the ROI-to-ROI analysis (p < 0.01, two-sided, FDR-corrected).
Region-of-Interest-to-Region-of-Interest Results Showing Functional Connectivity Differences Covaried with Average Scores on the Not Distracting Subscale of the Multidimensional Assessment of Interoceptive Awareness
R, right; L, left.
Threshold ROI-to-ROI connections by intensity, FDR p < 0.01, two-sided.
Independent-component analyses
The ICA identified significant differences associated with the overall MAIA scores as well as with the values of four subscales. When interpreting these results, it is important to note that all voxels in the brain are included in an ICA. Therefore, the results for some networks may include voxels that are within the brain areas that comprise specific networks as well as voxels that are outside of the traditional boundaries of these resting-state networks (e.g., significant voxels in the cerebellum in a component that includes the DMN).
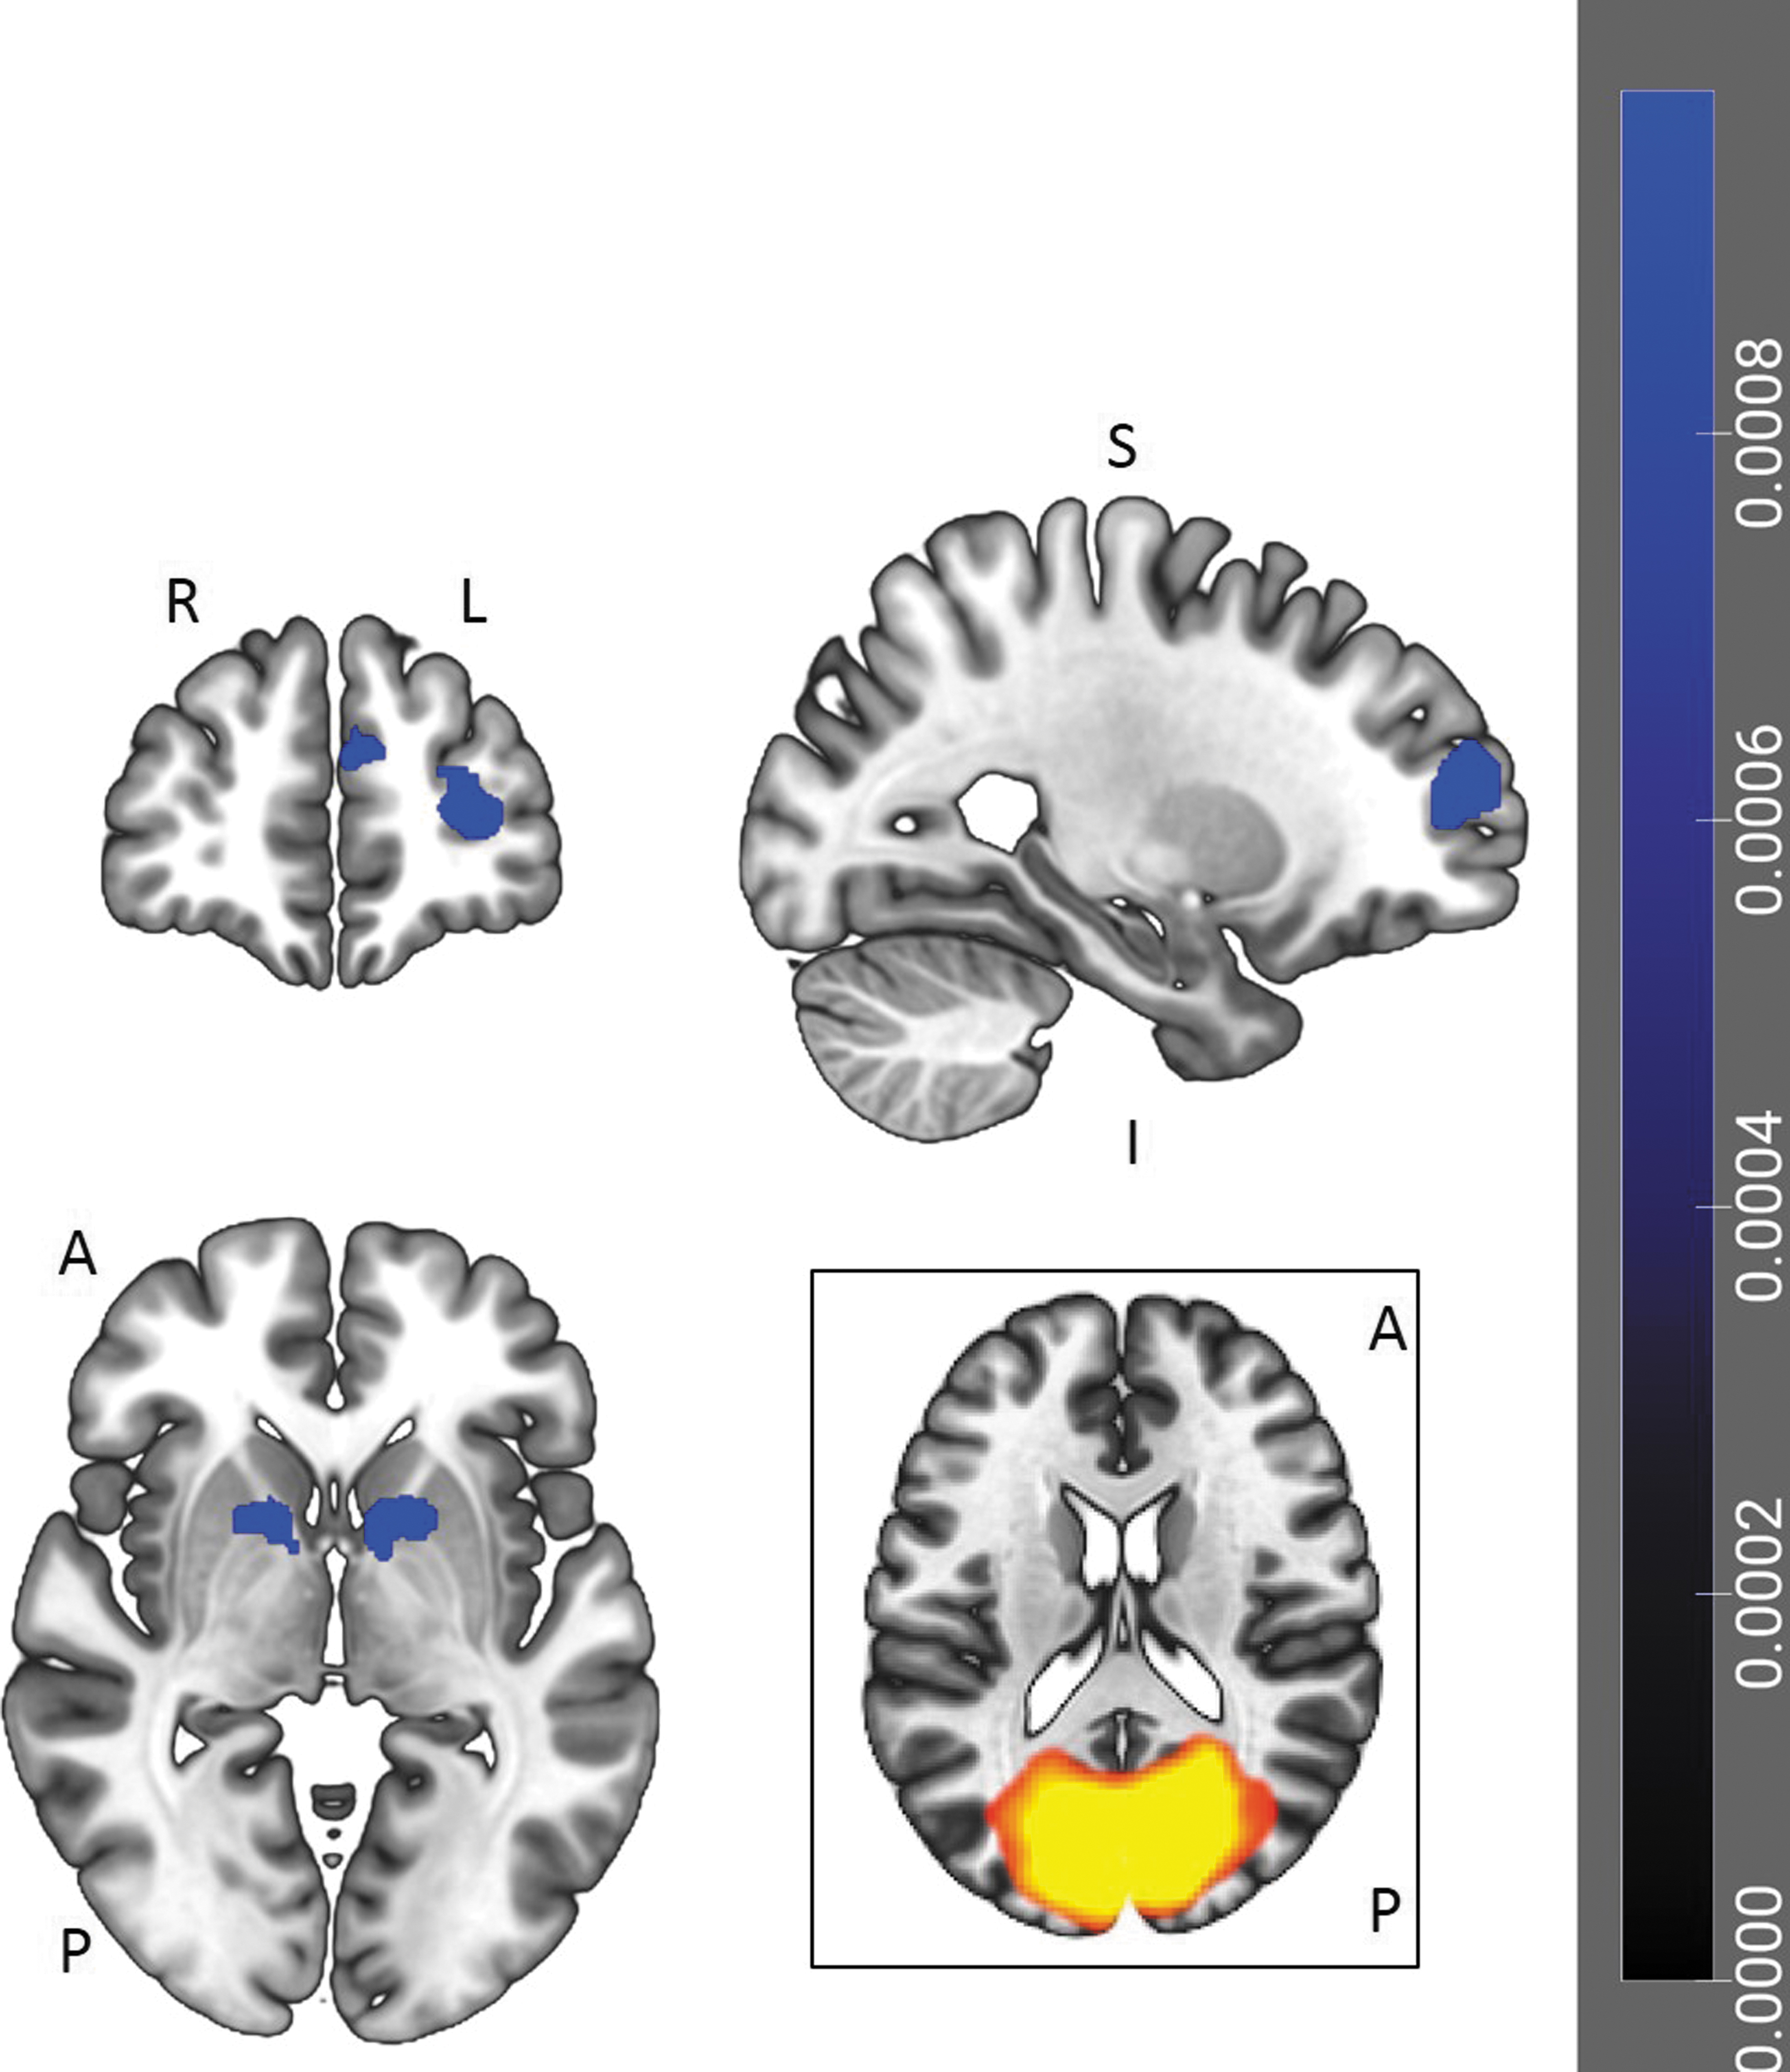
Individual differences in total scores on the MAIA were negatively correlated with one cluster of voxels in the VIS (Fig. 4 and Table 4). This cluster included voxels in the left paracingulate gyrus, the right frontal pole, and both the left and right superior frontal gyri.

ICA correlates of MAIA Total scores. One cluster of voxels, which included the left paracingulate gyrus, right frontal pole, and bilateral superior frontal gyri, was negatively correlated with MAIA Total scores in the component matching the VIS. The cluster is displayed on a coronal, sagittal, and axial slice (p < 0.001 uncorrected, cluster-wise threshold of p < 0.01, FDR-corrected). L = left; R = right; A = anterior; P = posterior; S = superior; I = inferior. ICA, independent-component analyses; VIS, visual network.
Clusters of Activity Associated with Overall Scores on the Multidimensional Assessment of Interoceptive Awareness Questionnaire
BA, FDR-corrected p-value (p).
BA, Brodmann area; MNI, Montreal Neurological Institute.
Individual differences on the Attention Regulation subscale of the MAIA were negatively correlated with the functional connectivity of four clusters of voxels, again all within the VIS component (Fig. 5 and Table 5). One cluster consisted of voxels in the left and right cingulate and paracingulate gyri, and the left superior frontal gyrus. A second cluster was located in the left frontal pole. The third cluster was also in the left hemisphere, but was more caudal in location. This cluster included voxels in the left putamen, nucleus accumbens, pallidum, caudate nucleus, and amygdala. The fourth cluster was of a similar size and location to the third, but in the right hemisphere. Here, significant voxels were detected in the right putamen, caudate nucleus, and thalamus.
ICA correlates of MAIA Attention Regulation subscale scores. Individual differences on the Attention Regulation subscale of the MAIA negatively correlated with the functional connectivity of four clusters of voxels within the component matching the VIS. The four clusters were located (i) in bilateral cingulate and paracingulate gyri, and left superior frontal gyrus; (ii) left frontal pole; (iii) left putamen, nucleus accumbens, pallidum, caudate nucleus, and amygdala; and (iv) in the right putamen, caudate nucleus, and thalamus. The clusters are displayed on coronal, sagittal, and axial slices (p < 0.001 uncorrected, cluster-wise threshold of p < 0.01, FDR-corrected). L = left; R = right; A = anterior; P = posterior; S = superior; I = inferior.
Clusters of Activity of Associated Differences Covaried with Average Scores on the Attention Regulation Subscale of the Multidimensional Assessment of Interoceptive Awareness
BA, FDR-corrected p-value (p).
Scores on the Not Distracting subscale were negatively correlated with one cluster of voxels in the DMN component of the analysis (Fig. 6 and Table 6). This cluster included voxels in the left fusiform gyrus (in both temporal and occipital regions), left anterior cerebellum 6, and left anterior cerebellum 4 and 5.

ICA correlates of MAIA Not Distracting subscale scores. The Not Distracting subscale scores negatively correlated with one cluster of voxels in the component matching the default mode network. This cluster, displayed on coronal, sagittal, and axial slices (p < 0.001 uncorrected, cluster-wise threshold of p < 0.01, FDR-corrected), included voxels in the left fusiform gyrus and anterior region of the left cerebellum. L = left; R = right; A = anterior; P = posterior; S = superior; I = inferior.
Clusters of Activity of Associated Differences Covaried with Average Scores on the Not Distracting Subscale of the Multidimensional Assessment of Interoceptive Awareness
BA, FDR-corrected p-value (p).
Individual differences on the Not Worrying subscale were correlated with the functional connectivity of two movement-related areas, both as part of the CER (Fig. 7 and Table 7). These scores were negatively correlated with the functional connectivity of a cluster consisting of the right precentral and postcentral gyri, an area typically associated with the SMN. Not Worrying scores were positively correlated with the functional connectivity of a left-hemisphere cluster, including the nucleus accumbens, caudate nucleus, and subcallosal cortex.

ICA correlates of MAIA Not Worrying subscale scores. Individual differences on the Not Worrying subscale were correlated with the functional connectivity of two clusters in the component matched with the CER. Scores of the Not Worrying subscale negatively correlated with the functional connectivity of one cluster in the right precentral and postcentral gyri, and positively correlated with a second cluster in the left nucleus accumbens, caudate nucleus, and subcallosal cortex. Results are displayed on coronal, sagittal, and axial slices (p < 0.001 uncorrected, cluster-wise threshold of p < 0.01, FDR-corrected). L = left; R = right; A = anterior; P = posterior; S = superior; I = inferior. CER, cerebellar network.
Clusters of Activity of Associated Differences Covaried with Average Scores on the Not Worrying Subscale of the Multidimensional Assessment of Interoceptive Awareness
BA, FDR-corrected p-value (p).
The CER component also contained a cluster of voxels whose functional connectivity was positively correlated with Noticing subscale scores (Fig. 8 and Table 8). This cluster included the right angular gyrus and right lateral occipital cortex.
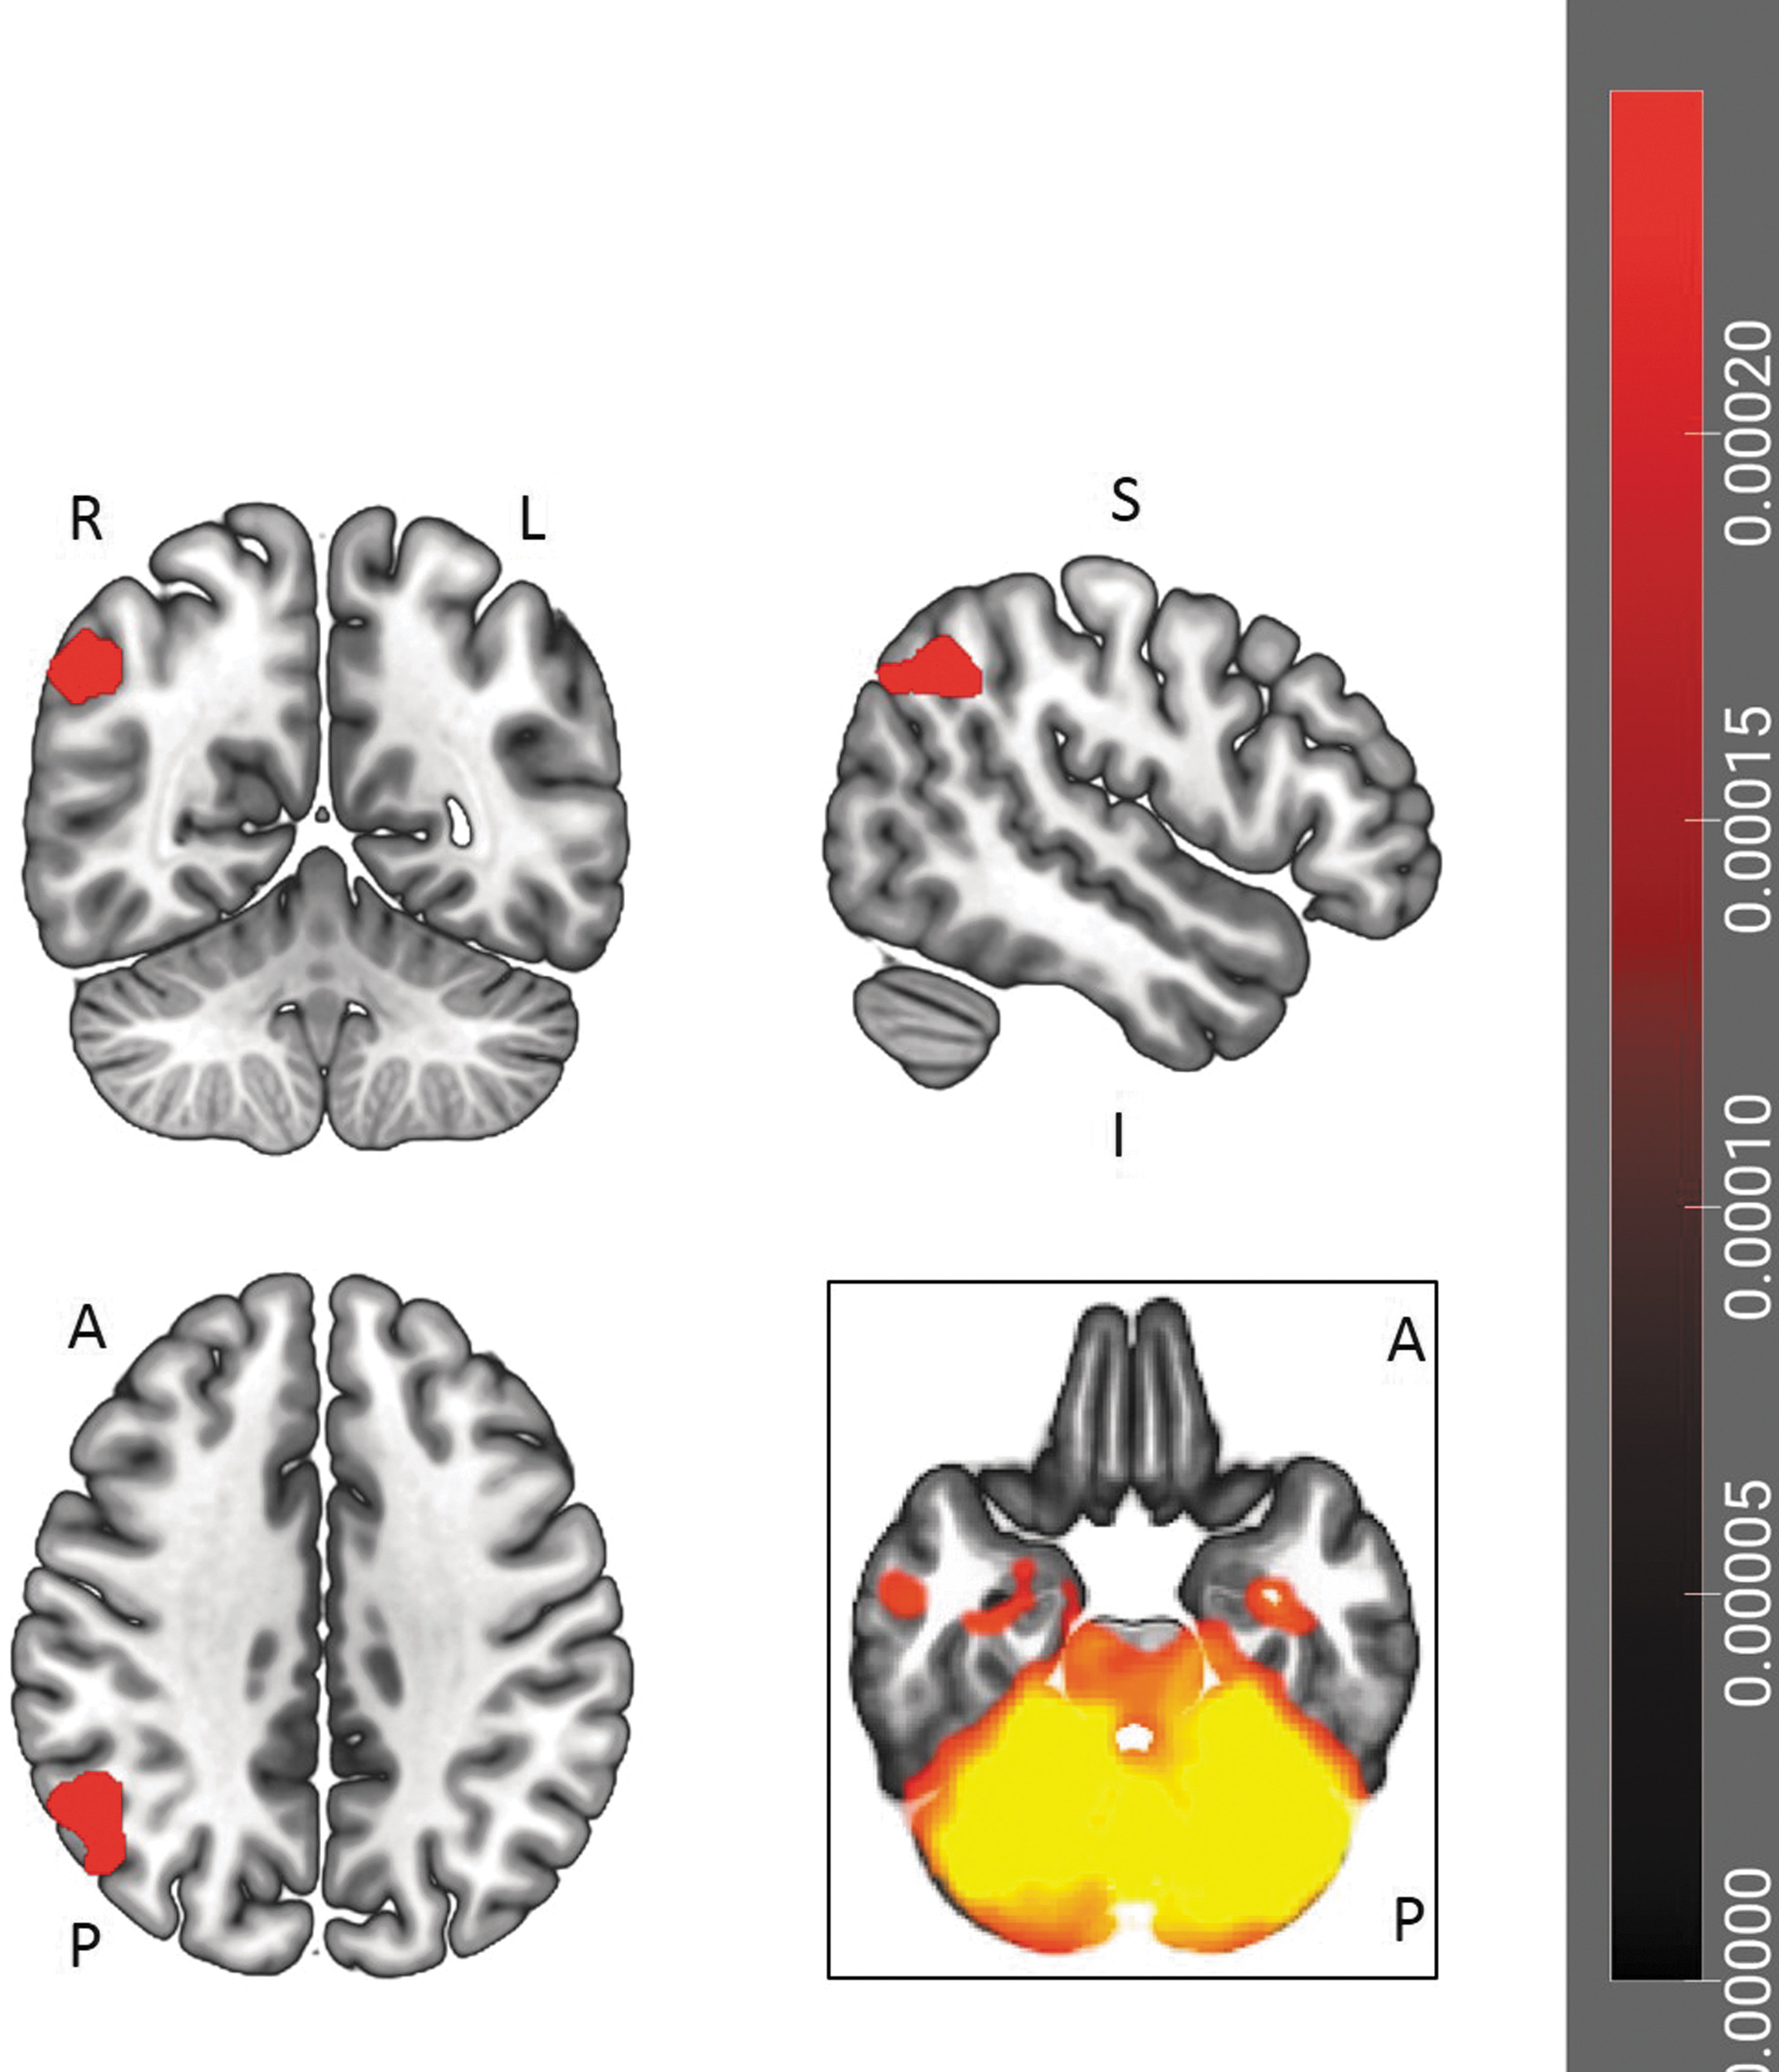
ICA correlates of MAIA Noticing subscale scores. The functional connectivity of a cluster of voxels, including right angular gyrus and right lateral occipital cortex, positively correlated with Noticing subscale scores in the ICA matching the CER. The cluster is displayed on coronal, sagittal, and axial slices (p < 0.001 uncorrected, cluster-wise threshold of p < 0.01, FDR-corrected). L = left; R = right; A = anterior; P = posterior; S = superior; I = inferior.
Clusters of Activity of Associated Differences Covaried with Average Scores on the Noticing Subscale of the Multidimensional Assessment of Interoceptive Awareness
BA, FDR-corrected p-value (p).
Discussion
The data from the current study suggest that individual differences in interoceptive sensibility (i.e., self-reported sensitivity to interoceptive signals) are related to differences in functional connectivity. Differences were observed for both ROI-based analyses and ICA. The ROI-based analyses show the relationship between the functional connectivity of pairs of predefined brain regions and the MAIA scores. The ICA show the relationship between network-level measures of functional connectivity and the MAIA scores.
However, before discussing trends in the current data, it is important to note two important caveats. First, this research measured functional, not structural, connectivity. Functional connectivity reflects a statistical relationship between brain areas; it does not necessarily mean that there are direct WM pathways linking these regions (Damoiseaux and Greicius, 2009; Huang and Ding 2016). Second, because this study involved resting-state fMRI, we must be cautious about inferring that a given result (e.g., increased functional connectivity in the motor cortex) is due to variability in a specific behavior (e.g., motor planning). A task-based fMRI study would be necessary to make such a claim (Poldrack, 2006). These two caveats aside, the current data do provide insights into the neural substrates underlying individual differences in interoceptive sensibility.
A particularly striking characteristic of the current data was the prevalence of negative correlations between interoceptive sensibility scores and the functional connectivity of visual regions. In the ROI analyses, overall MAIA scores were negatively correlated with connectivity between the right thalamus and intracalcarine cortex in the occipital lobe. Attention Regulation scores were negatively associated with the functional connectivity between multiple visual regions and both the left amygdala and left nucleus accumbens. Consistent with the implication of visual brain regions' negative relationship with interoceptive sensibility, the ICA related to both total MAIA values and to the Attention Regulation subscale scores detected significant effects in relation to the functional connectivity of the VIS. In both of these ICA, this altered connectivity occurred in frontal-lobe structures, particularly in regions related to working memory and the monitoring of action outcomes (du Boisgueheneuc et al., 2006; Tsujimoto et al., 2011).
In the ICA results related to the Not Distracting subscale, the activity of the fusiform gyrus correlated with the DMN component. Importantly, the functional connectivity of the fusiform gyrus in this ICA component again showed a negative correlation between the functional connectivity of a vision-related structure and an element of interoceptive sensibility. An intriguing possibility related to all of these data is that individuals with superior interoceptive sensibility may allocate less attention to visual stimuli. However, a behavioral study would be necessary to test this hypothesis.
The ROI-analysis results related to the Not Distracting subscale scores suggest that this interoceptive characteristic may serve an emotionally protective function. The three items related to this subscale are as follows: (1) I do not notice physical tension or discomfort until it becomes more severe; (2) I distract myself from sensations of discomfort; and (3) When I feel pain or discomfort, I try to power through it. Therefore, a high score on this subscale actually indicates that an individual has a tendency to distract himself or herself from unpleasant physical sensations (Mehling et al., 2012). In the ROI analysis, Not Distracting scores were negatively correlated with the functional connectivity between two frontal-lobe structures involved with planning and action monitoring, the frontal operculum and frontal pole. This negative relationship suggests that individuals scoring high on this subscale perform fewer frontal-lobe-based executive functions to remain in the present (unpleasant) moment.
The final trend in the data related to the role of the cerebellum. Neuroimaging and neuropsychological studies have noted that the cerebellum is involved in numerous sensorimotor, cognitive, and affective processes (see Schmahmann, 2019, for a review). Researchers have also demonstrated that the cerebellum influences multiple resting-state networks related to attention, salience detection, and multiple sensorimotor functions (Habas et al., 2009; Ruehl et al., 2017). Interoceptive functions have been linked with the SN and are associated with lobules VI–VIIb and Crus I and II (Habas, 2021).
In the current results, the relationship between the DMN and Not Distracting subscale scores included voxels in lobule VI in the left cerebellum. Other research has placed the functional connectivity of cerebellar structures within the context of corticocerebellar pathways. O'Reilly and colleagues (2010) used different anatomic regions of the cortex as seed regions in a functional connectivity analysis that examined the cerebellum's diverse connections. These researchers found that cerebellar functional connectivity could be divided into (at least) two functional zones, a sensorimotor zone involving lobules V, VI, and VIII and a supramodal zone consisting of lobule VIIa and Crus I and II; the supramodal zone was linked to the prefrontal and posterior parietal cortices.
In the current study, the functional connectivity of the cerebellar resting-state network was correlated with scores on two MAIA subscales, Not Worrying and Noticing. It is worth noting that (1) these results were the only positive correlations detected in this study and (2) they involve both sensorimotor and supramodal brain areas. Not Worrying scores, which refer to the tendency to not experience emotional distress in response to physical sensations, were positively correlated with the left caudate nucleus, a structure involved with both movement and reward responses (Provost et al., 2016).
Noticing scores were positively correlated with the functional connectivity of the right angular gyrus—part of the supramodal zones identified by O'Reilly and colleagues (2010)—and the CER. The angular gyrus performs a number of functions, including spatial cognition and theory of mind (Lai et al., 2017; van Kemenade et al., 2017). Interestingly, interoceptive accuracy may be linked with theory-of-mind abilities, as both involve attending to bodily states—interoception involves attention to the self, while theory of mind involves attention to another individual (Ondobaka et al., 2017). The fact that it was the Noticing subscale that correlated with the functional connectivity of the angular gyrus is consistent with this view.
Future studies using masks of the two cerebellar zones identified by O'Reilly and colleagues (2010) could include both measures of interoceptive accuracy and interoceptive sensibility to determine if the former showed a stronger association with sensorimotor cortical regions, while the latter was more strongly linked with supramodal regions. Future investigations could also assess the spatial specificity of interoceptive sensibility by setting as seeds the brain regions associated with interoceptive sensibility and correlating the voxel-wise functional connectivity across the cerebellum.
One interesting result of the current study was the absence of significant effects involving the insula. Several task-based and resting-state fMRI studies have highlighted the critical role played by this structure in accurately detecting interoceptive information (Critchley et al., 2004; Grossi et al., 2014). For example, Chong and colleagues (2017) found a relationship between SN connectivity in the insula and participants' accuracy on a heartbeat-detection task. Stern and colleagues (2017) found similar effects, although this network also included sensorimotor, occipital, and limbic regions. Given these results, it was somewhat surprising that the functional connectivity of the insula was not related to participants' scores on the MAIA.
There are at least two potential explanations for this result. One possibility is that while the insula plays a critical role in interoceptive accuracy (Hassanpour et al., 2018; Tan et al., 2018), it is not related to interoceptive sensibility, a measure of our beliefs about our interoceptive abilities. A second interpretation of the results is that the insula may have been so important for interoceptive abilities that there were no individual differences to be detected by functional connectivity analyses. These different explanations could be tested in a task-based fMRI study in which researchers obtained participants' objective and subjective responses during the performance of different interoceptive tasks. Importantly, such a study would also allow researchers to examine interoceptive awareness, the correspondence between interoceptive accuracy and sensibility. To date, no functional connectivity research has examined this construct.
Limitations
Although both the ICA and ROI analyses detected multiple brain areas related to interoceptive sensibility, there are numerous ways in which the current study could be improved. First, the number of participants (28) possibly limited the statistical power of our analyses. A larger sample size may have allowed detection of smaller effects. Second, the current research used a relatively conservative significance threshold of p < 0.01, FDR-corrected. This decision was made because of the number of covariates being used. Although this threshold is not necessarily a weakness, a more liberal threshold may have detected a broader range of brain areas whose functional connectivity covaried with MAIA scores.
Third, only one questionnaire was used to assess interoceptive sensibility. The MAIA was used because its multidimensional nature provided the opportunity to understand how multiple components of interoceptive sensibility were related to functional connectivity. However, it is possible that other measures of bodily awareness might have produced different results. Future studies could compare the changes in functional connectivity associated with different measures of interoception and bodily awareness such as the Body Awareness Questionnaire (Shields et al., 1989), the Porges Body Perception Questionnaire (Porges, 1993), and the Private Body Consciousness Scale (Miller et al., 1981).
Finally, future neuroimaging research should combine measures of interoceptive sensibility, resting-state fMRI, and task-based fMRI studies of interoceptive accuracy. Examining how interoceptive signals are represented in different regions of the central nervous system—including the spinal cord (Kornelsen et al., 2015)—will provide valuable information about how interoceptive information influences behavior.
Conclusions
The current research examined whether scores on a commonly used measure of interoceptive sensibility, the MAIA, were related to individual differences in resting-state functional connectivity. The results of both ROI-based analyses and ICA indicated that several elements of interoception were negatively correlated with the functional connectivity of visual structures. In addition, the CER was positively correlated with two MAIA subscales, suggesting that this complex brain structure plays a role in interoceptive functioning. Importantly, the current study did not detect differences involving the insula, a brain area widely viewed as playing a pivotal role in interoception. This result highlights the fact that interoception involves multiple components (Garfinkel et al., 2015), and indicates that the brain areas related to our beliefs about our interoceptive abilities are not identical to the brain regions involved with accurate detection of interoceptive information.
Footnotes
Acknowledgments
The authors thank the radiology technical staff for their assistance with data collection.
Authors' Contributions
S.D.S. and C.N. designed the study. Data collection was performed by S.D.S., C.N., and M.S.J. Different elements of the data analysis were performed by S.D.S., C.N., M.S.J., and J.K. All authors contributed to the final version of this article.
Author Disclosure Statement
No competing financial interests exist.
Funding Information
This research was funded by the Natural Sciences and Engineering Research Council (NSERC) of Canada (grant number RGPIN-2014-03928).