




Abstract
Objective:
To explore changes in resting-state networks in patients with jerky and tremulous functional movement disorders (JT-FMD).
Methods:
Resting-state functional magnetic resonance imaging data from seventeen patients with JT-FMD and seventeen age-, sex-, and education-matched healthy controls (HC) were investigated. Independent component analysis was used to examine the central executive network (CEN), salience network, and default mode network (DMN). Frequency distribution of network signal fluctuations and intra- and internetwork functional connectivity were investigated. Symptom severity was measured using the Clinical Global Impression-Severity scale. Beck Depression Inventory and Beck Anxiety Inventory scores were collected to measure depression and anxiety in FMD, respectively.
Results:
Compared with HC, patients with JT-FMD had significantly decreased power of lower range (0.01–0.10 Hz) frequency fluctuations in a precuneus and posterior cingulate cortex component of the DMN and in the dorsal attention network (DAN) component of the CEN (false discovery rate-corrected p < 0.05). No significant group differences were found for intra- and internetwork functional connectivity. In patients with JT-FMD, symptom severity was not significantly correlated with network measures. Depression scores were weakly correlated with intranetwork functional connectivity in the medial prefrontal cortex, while anxiety was not found to be related to network connectivity.
Conclusions:
Given the changes in the posterodorsal components of the DMN and DAN, we postulate that the JT-FMD-related functional alterations found in these regions could provide support for the concept that particularly attentional dysregulation is a fundamental disturbance in these patients.
Impact statement
In this study, we explored static brain network functional connectivity in patients with jerky and tremulous functional movement disorders (JT-FMD) and healthy controls. We studied network functioning by analyzing functional connectivity measures, and also time course frequency spectra, which is novel compared with previous studies. We discovered aberrations in the frequency distribution of a posterior component of the default mode network (precuneus/posterior cingulate) and the dorsal attention network in patients with JT-FMD relative to controls. Conclusively, our findings could provide support for impaired attentional control as a fundamental disturbance in JT-FMD and contribute to the growing conceptualization of this disorder.
Introduction
Functional movement disorders (FMD) represent one of the more common disorders seen in neurological clinics (Stone et al., 2010). Despite its tangible impact, the pathophysiological basis of FMD remains poorly understood.
Recently, Edwards et al. (2012) proposed a Bayesian model which posits that functional symptoms are the result of pathological prior experiences that are modulated by alterations of sense of agency and attention dysregulation. These altered mechanisms are pertinent in patients with FMD as they experience a lack of control over their movements and often direct too much attention toward their body (Hallett, 2010; Pennebaker, 1982).
Previous functional neuroimaging studies in FMD support these hypotheses as decreased activation and altered functional connectivity in areas of the right temporoparietal junction (TPJ), decreased activity in the prefrontal cortex, supramarginal gyrus, and precuneus, and increased activity in the ventromedial prefrontal cortex (vmPFC) were detected (Aybek et al., 2014; de Lange et al., 2007; Maurer et al., 2016; Voon et al., 2010).
The TPJ is associated with sense of agency (Decety and Lamm, 2007; Nahab et al., 2011; Ruby and Decety, 2001), while the increased activity found in the vmPFC could reflect heightened self-monitoring in patients with FMD as this region is part of the default mode network (DMN), which is responsible for self-referential processes (Raichle, 2015; Xu et al., 2016). Therefore, examining the functioning of brain networks associated with attention and sense of agency in FMD patients can provide valuable insight into the mechanisms underlying FMD.
Resting-state functional magnetic resonance imaging (rs-fMRI) provides the opportunity to study brain activations in patients while at rest (Biswal et al., 1995). Several rs-fMRI studies have consistently reported the existence of resting-state networks, such as the DMN, a set of brain regions preferentially active when subjects are not engaged in goal-directed behaviors (Damoiseaux et al., 2006; Raichle et al., 2001; Yeo et al., 2011).
While most rs-fMRI studies focus on investigating functional connectivity, one can also explore the frequency distribution of blood-oxygen-level-dependent (BOLD) signal fluctuations, that is, assessing distinct frequency bands of such distributed signal fluctuations. A commonly used analysis method includes exploring the power of the lower range frequency fluctuations (0.01–0.10 Hz), which has been shown to reflect synchronized spontaneous neural activity throughout the brain (Zuo et al., 2010). Investigating this dimension of resting-state functioning is also important, as differences in functioning may not only pertain to patterns of connectivity but also to regional brain activity.
The aim of this study was to explore changes in regional brain activity and functional connectivity within and between networks involved in attention regulation and sense of agency. Therefore, we aimed to study the central executive network(s) (CEN)—consisting of the frontoparietal network (FPN) and dorsal attention network (DAN)—salience network (SN), and DMN in FMD patients. We included jerky and tremulous FMD (JT-FMD), which included functional tremor and functional jerks. While in organic movement disorders, tremor is perceived as oscillating and myoclonus as jerky-like, this distinction is difficult in FMD. Therefore, as we find them to look jerky-like, we classified them as such.
We used independent component analysis (ICA) to identify resting-state brain networks. This data-driven approach does not require an a priori manual selection of regions of interest, but instead finds networks that consist of areas that are functionally independent. We investigated between-group differences in the degree of coherent activity in these networks by analyzing the frequency distribution of network signal fluctuations and in intra- and internetwork functional connectivity. We subsequently assessed whether within-group differences in the frequency distribution of network signal fluctuations and in functional connectivity correlate with symptom severity.
To the best of our knowledge, while previous rs-fMRI studies have been done in patients with FMD, no rs-fMRI study has investigated regional brain activity in patients with FMD using the frequency distribution of network signal fluctuations.
Methods
Participants
Seventeen patients with a clinical diagnosis of JT-FMD (myoclonus or tremor) were recruited from the movement disorder clinics of the University Medical Center Groningen and the Academic Medical Center, Amsterdam, the Netherlands (Dreissen et al., 2019). The diagnosis of functional myoclonus or tremor was confirmed by two movement disorder experts (M.A.J.T. and J.H.T.M.K.) according to the current Diagnostic and Statistical Manual of Mental Disorders, Fifth Edition, criteria and using positive findings in the history and neurological examination. Seventeen age-, sex-, and education-matched healthy controls (HC) were recruited via poster advertisements in the community and the internet.
Exclusion criteria were as follows: age <18 years; comorbid neurological disorder; contraindications for MRI-scanning; patients with disruptive jerky movements of the head; and patients using antipsychotic drugs. Of all JT-FMD patients, only one patient was using benzodiazepines (clonazepam, half-life 30–40 h) at the time and was asked to discontinue the medication 24 h before the scan. Patients were included in a broader study, and also performed multiple fMRI task paradigms following the rs-fMRI scan and received treatment with botulinum toxin. To maintain transparency of the methods and results, the here presented data are restricted to the resting-state analysis.
Patients were scanned between January 2014 and November 2016. All participants in the study provided written informed consent. The study was approved by the Medical Ethics Committee of the Academic Medical Center, Amsterdam, the Netherlands. Study procedures were conducted according to the Declaration of Helsinki.
Clinical evaluation
Patients with JT-FMD self-rated symptom severity using the clinical global impression severity (CGI-S) scale, a 7-point Likert-item ranging from 1 to 7 (1 = normal, I have no complaints, 7 = severe). Patients also completed the Beck Depression Inventory (BDI; Beck et al., 1961) and Beck Anxiety Inventory (BAI; Beck et al., 1988).
MR imaging acquisition
Functional and structural imaging data were acquired with a 3.0 Tesla MRI scanner (Philips Medical Systems, Best, the Netherlands) using a 32-channel SENSE head coil. Participants lay head-first supine in the scanner. An axial T1-weighted 3D turbo field echo (T1TFE) sequence image was acquired for anatomical reference: repetition time (TR) 9 ms; echo time (TE) 3.5 ms; number of echoes 1; flip angle 8°; matrix size = 256 × 256; field of view: 232 × 170 × 256 mm; voxel size 1 × 1 × 1 mm; acquisition time: 4 min 18 sec.
With respect to functional imaging, 225 T2-weighted fast field single echo with echo planar imaging sequence volumes were acquired, each with 39 slices aligned in the anterior commissure/posterior commissure plane and recorded in descending order: TR 2000 ms; TE 30 ms; flip angle 70°; matrix size = 64 × 62; field of view 224 × 137 × 224 mm; voxel size 3.5 × 3.5 × 3.5 mm; acquisition time: 7 min and 30 sec. One run was collected per participant. All imaging data were acquired in one session. During the rs-fMRI scan, patients were instructed to remain as still as possible, to keep their eyes open and look in front of them, and to remain awake and to think of nothing.
Data preprocessing
We performed rs-fMRI data preprocessing and data analysis following the analytical pipeline shown in Figure 1. Statistical Parametric Mapping (SPM12, version 7219) software was used for fMRI image preprocessing in MATLAB version R2013a. After discarding the first five time points of rs-fMRI data for magnetization stabilization, functional images were then realigned to the mean functional image. Following coregistration of the individual T1-weighted image to functional images, images were normalized to the echoplanar imaging Montreal Neurological Institute template provided in SPM12 software (Calhoun et al., 2017). Finally, the resultant images underwent spatial smoothing with an 8-mm full-width-at-half-maximum Gaussian kernel. Images were inspected to ensure proper coregistration and normalization. These images were subsequently used as an input for group ICA.

Analytical pipeline. Schematic of the pipeline used in rs-fMRI data preprocessing and data analysis for the investigation of the frequency distribution of BOLD signal fluctuations and functional connectivity. BOLD, blood-oxygen-level dependent; EPI, echoplanar imaging; FNC, functional network connectivity; FWHM, full-width-at-half-maximum; GIG-ICA, group information-guided ICA; ICA, independent component analysis; MANCOVA, multivariate analysis of covariance; rs-fMRI, resting-state fMRI. Color images are available online.
Data analysis
Preprocessed rs-fMRI data were decomposed into spatially independent components using spatial ICA in the Group ICA of fMRI Toolbox (GIFT, version 3.0b; Calhoun et al., 2001). Spatial ICA entails a data-driven approach that identifies temporally coherent networks by estimating maximally independent spatial sources, referred to as spatial maps, from their linearly mixed fMRI signals, referred to as time courses (TCs), and decomposes these into separate components (Allen et al., 2011). Note that “networks” and “components” refer to the same concept in this report.
The mean number of independent components was estimated as 24 using the Minimum Description Length criteria (Li et al., 2007). Two-step principal component analysis (PCA) was applied to the group data for dimensionality reduction: first step: 38 principal components; second step: 25 principal components. After PCA, group ICA was performed using the FastICA algorithm. The statistical reliability of independent components was assessed using the ICASSO method that validates the independent components via clustering the results of multiple ICA runs (Himberg et al., 2004); using this method, the component estimation was repeated 20 times.
After group ICA, the group information-guided ICA (GIG-ICA) algorithm (Du and Fan, 2013; Du et al., 2016) in GIFT was performed to generate subject-specific images, enabling a comparison of both the TC and the spatial maps to evaluate between-group differences. The GIG-ICA algorithm is a nondata-reduction approach that uses template components (in our case the aggregate component maps extracted using spatial ICA at the group level) as reference to estimate sources of interest for each individual subject. These individual subject-specific independent components are computed via a multiobjective function optimization based on the individual-subject data and each remaining nonartifact group-level independent component using a deflation manner. Finally, values of each subject's component image and TC were converted to z-scores.
The GIG-ICA method has been shown to achieve better performance than back-reconstruction (GICA1 and GICA3) and dual regression in aspects of (1) independence of subject-specific independent components, (2) accuracy of estimated independent components and TCs, and 3) spatial correspondence of independent components across subjects (Du and Fan, 2013; Salman et al., 2019). Furthermore, GIG-ICA can remove artifact-related group-level independent components before estimating individual components (Du et al., 2016), therefore only yielding subject-specific meaningful networks. The spatial ICA and the GIG-ICA are validated standard methods provided in the GIFT developed by Calhoun et al. (2001); we used default settings for the analyses (Du and Fan, 2013).
A validated visual inspection and template matching method were used by authors R.S.M., J.M.G., and J.B.C.M. to independently and manually select components/networks (Kelly et al., 2010). As mentioned earlier, neural and artifact components were selected at the group level. Components showing spatial overlap with known vascular, ventricular, and motion artifacts were excluded. Components corresponding with the DMN, CEN, and the SN were identified and selected for further analyses.
Network measures
Using the Mancovan toolbox in the GIFT software, we investigated three ICA-derived outcome measures with respect to network functioning: (1) frequency distribution of network signal fluctuations, denoting the within-network degree of coherent activity; (2) intranetwork functional connectivity, related to the connectivity and degree of coactivation within a network; and (3) internetwork functional connectivity, denoting between-network connectivity. Subject-specific TCs were detrended and despiked using 3dDespike, ‡ and then filtered using a fifth-order Butterworth low-pass filter with a high-frequency cutoff of 0.15 Hz. Furthermore, the six motion parameters calculated during the realignment step were regressed out of the TCs to reduce motion-induced spin history artifacts from the data.
Frequency distribution of network signal fluctuations was estimated on the detrended subject-specific TCs using the multitaper approach implemented in Chronux. § Group comparison of TCs is done by comparing the frequency distribution between the groups at different frequency bins (0–0.25 Hz). In this study, fluctuations of frequencies <0.10 and >0.10 Hz will be referred to as lower range and upper range frequency fluctuations, respectively. Intranetwork functional connectivity was evaluated using the networks' spatial z-maps. Internetwork functional connectivity was estimated as the Pearson's correlation coefficient between pairs of TCs (Jafri et al., 2008).
Group analyses
A between-group multivariate analysis of covariance (MANCOVA) model was used to test for differences in the frequency distribution of network signal fluctuations and network functional connectivity between patients with JT-FMD and HC. Although ICA in and of itself already separates several sources of artifacts, GIG-ICA is especially robust against motion artifacts (Du and Fan, 2013; Murphy et al., 2013).
In addition to regressing out translational and rotational motion parameters, we included framewise displacement (FD) as a covariate in our statistical models, to correct for any remaining head motion effects (Power et al., 2012). FD is calculated as the sum of the absolute values of the derivatives of the six realignment parameters generated in the preprocessing step (Power et al., 2012). We applied normalizing log-transformations to improve data symmetry and to reduce disproportionate influence of outliers on the data.
Within-group MANCOVA models were used to test for differences in the frequency distribution of BOLD signals and network functional connectivity between sum scores of CGI-S. Again, log-transformed mean FD was included as a covariate to correct for head motion. The CGI-S scores were not transformed as log-transformation did not improve the data symmetry. Statistical threshold was set at p = 0.05 after correction for multiple comparisons using false discovery rate (FDR; Genovese et al., 2002).
Data availability statement
The data that support the findings of this study are available on request from the corresponding author.
Results
Patient characteristics
Data from 17 patients with JT-FMD and 17 age-, sex-, and education-matched HC were included in the analysis. Patient demographic and clinical characteristics are summarized in Table 1. There were no differences in age, sex, and education level between the patient and control groups (p > 0.05). The average score of the BDI in patients was 8.2 (standard deviation [SD] 7.9; range 0–28), which corresponds to no depression (0–9 out of 63), while the average score for the BAI was 17.2 (SD 13.3; range 0–38), which corresponds to mild anxiety (10–18 out of 63). These psychometric scores are reported with the purpose to demonstrate that there was no clinically significant depression or anxiety in the FMD patients and were not used in the analysis. There were no differences in motion parameters (mean FD) between groups (t = 0.2294; p = 0.82; Supplementary Appendix Fig. A1).
Patient Characteristics
Data are presented as the mean ± SD unless specified otherwise.
BAI, Beck Anxiety Inventory; BDI, Beck Depression Inventory; CGI-S, Clinical Global Impression-Severity Scale; HC, healthy controls; NA, not applicable; JT-FMD, jerky and tremulous functional movement disorders; SD, standard deviation.
Resting-state networks
Group ICA was performed using rs-fMRI data from 34 participants and extracted 24 components. Of these 24 components, 8 were selected for further analysis. Spatial maps of the selected resting-state networks are shown in Figure 2. Four components corresponded with parts of the DMN (DMN1: medial prefrontal cortex [mPFC]; DMN2: precuneus, posterior cingulate cortex [PCC]; DMN3: precuneus; DMN4: mPFC, PCC, and inferior parietal cortex); three components corresponded with the executive network (left and right FPN; DAN); and one component corresponded with the SN.
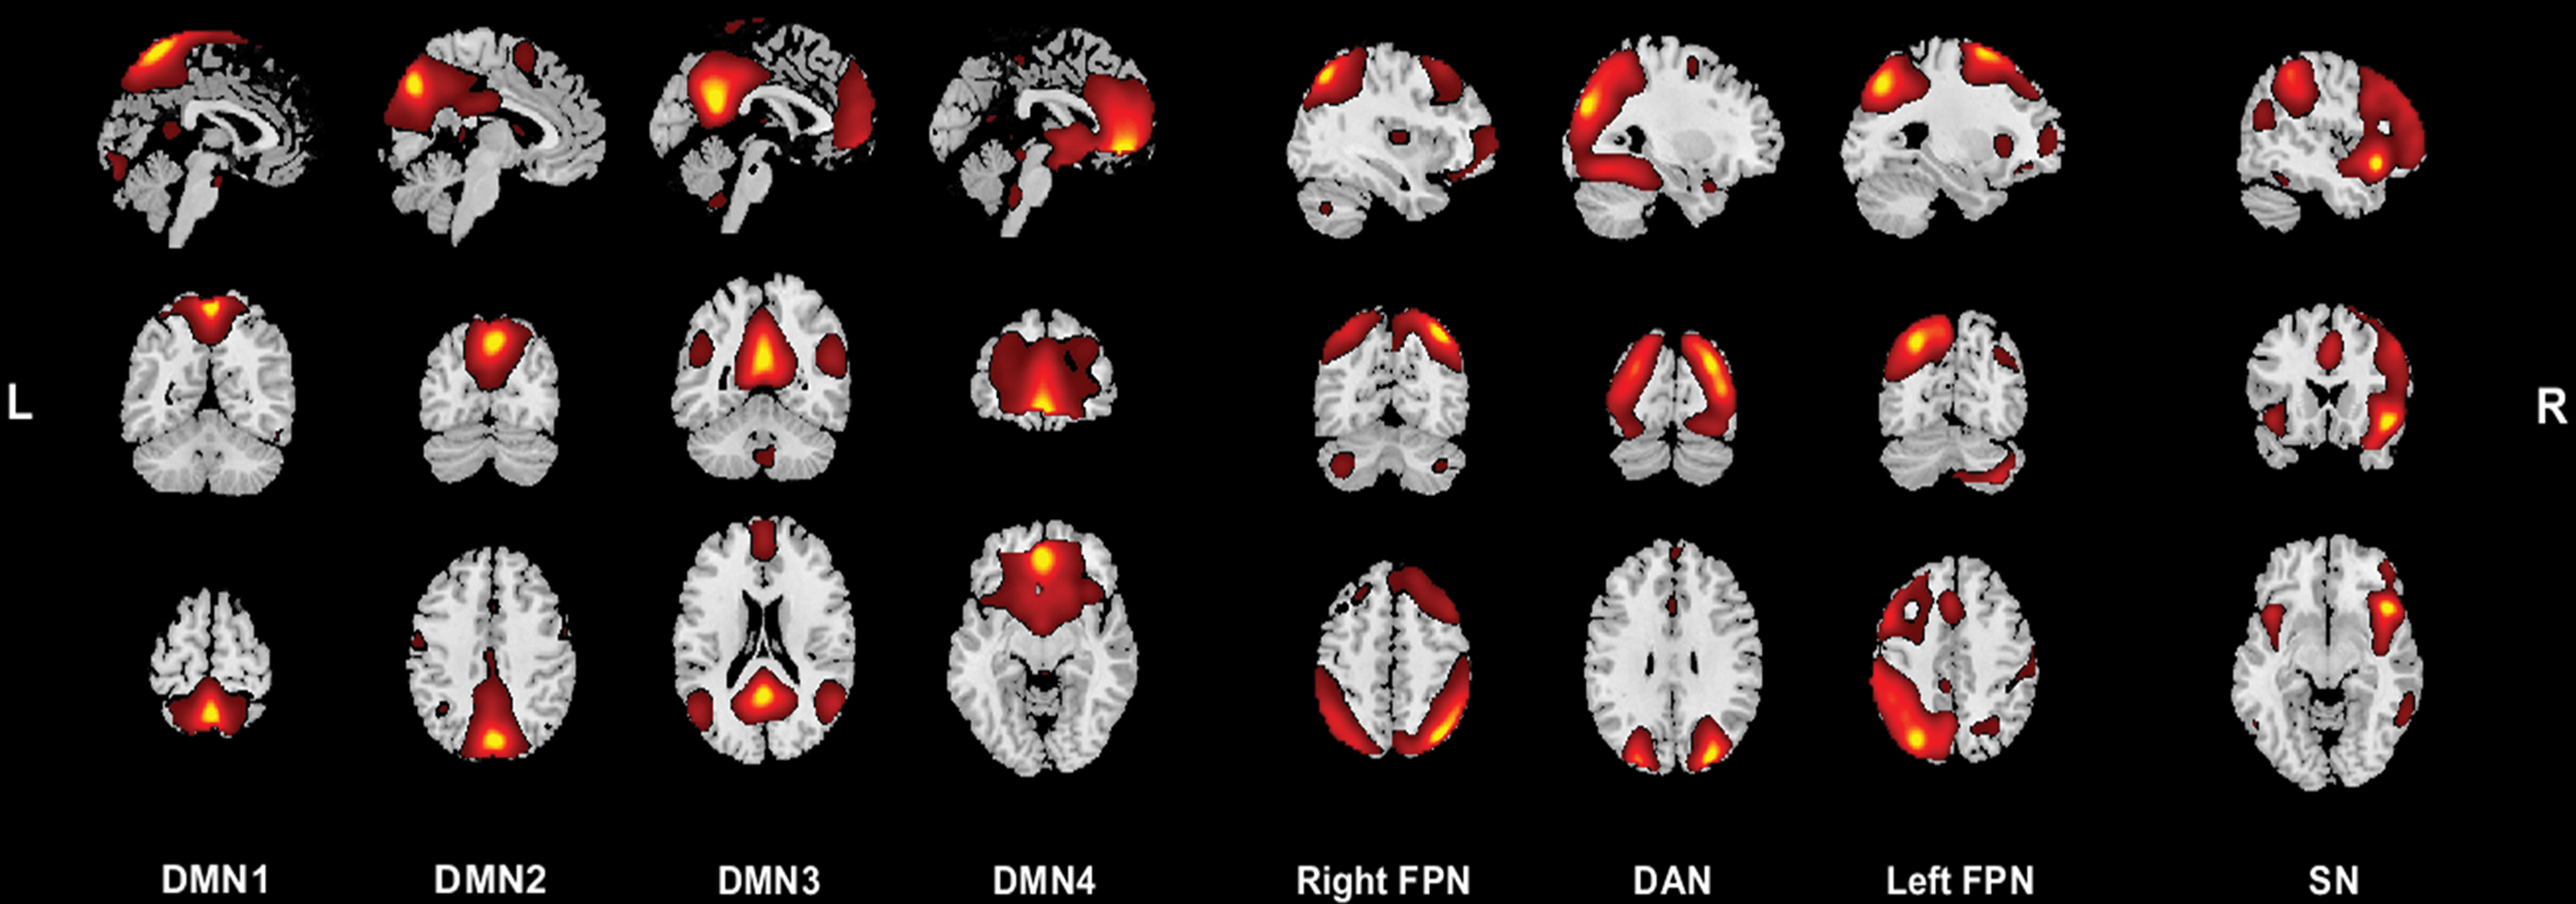
Resting-state networks of interest. Spatial maps of the 8 resting-state networks of interest, where components corresponding to the same network are grouped together. Spatial maps are plotted as t-statistics and are displayed at the three most informative slices in the sagittal, coronal, and transverse plane. Left side of the figure corresponds with the left side of the brain and vice versa. DAN, dorsal attention network; DMN, default mode network; FPN, frontoparietal network; L, left; R, right; SN, salience network. Color images are available online.
Frequency distribution of network signal fluctuation analysis
Compared with HC, patients with JT-FMD exhibited significantly decreased power of lower range frequency fluctuations in the precuneus and PCC network (DMN1) and in more laterally adjoining regions that constitute the DAN, that is, the second component of the CEN (Fig. 3; FDR-corrected p < 0.05). The rest of the components did not show significant differences. The effect sizes for group differences and total frequency distribution of network signal fluctuations in the precuneus and PCC component in patients with JT-FMD and HC were plotted for comparison purposes (Fig. 3B, C). Frequency distribution of network signal fluctuations was not significantly related to CGI-S, BDI, and BAI scores in patients after FDR-correction for multiple comparisons.
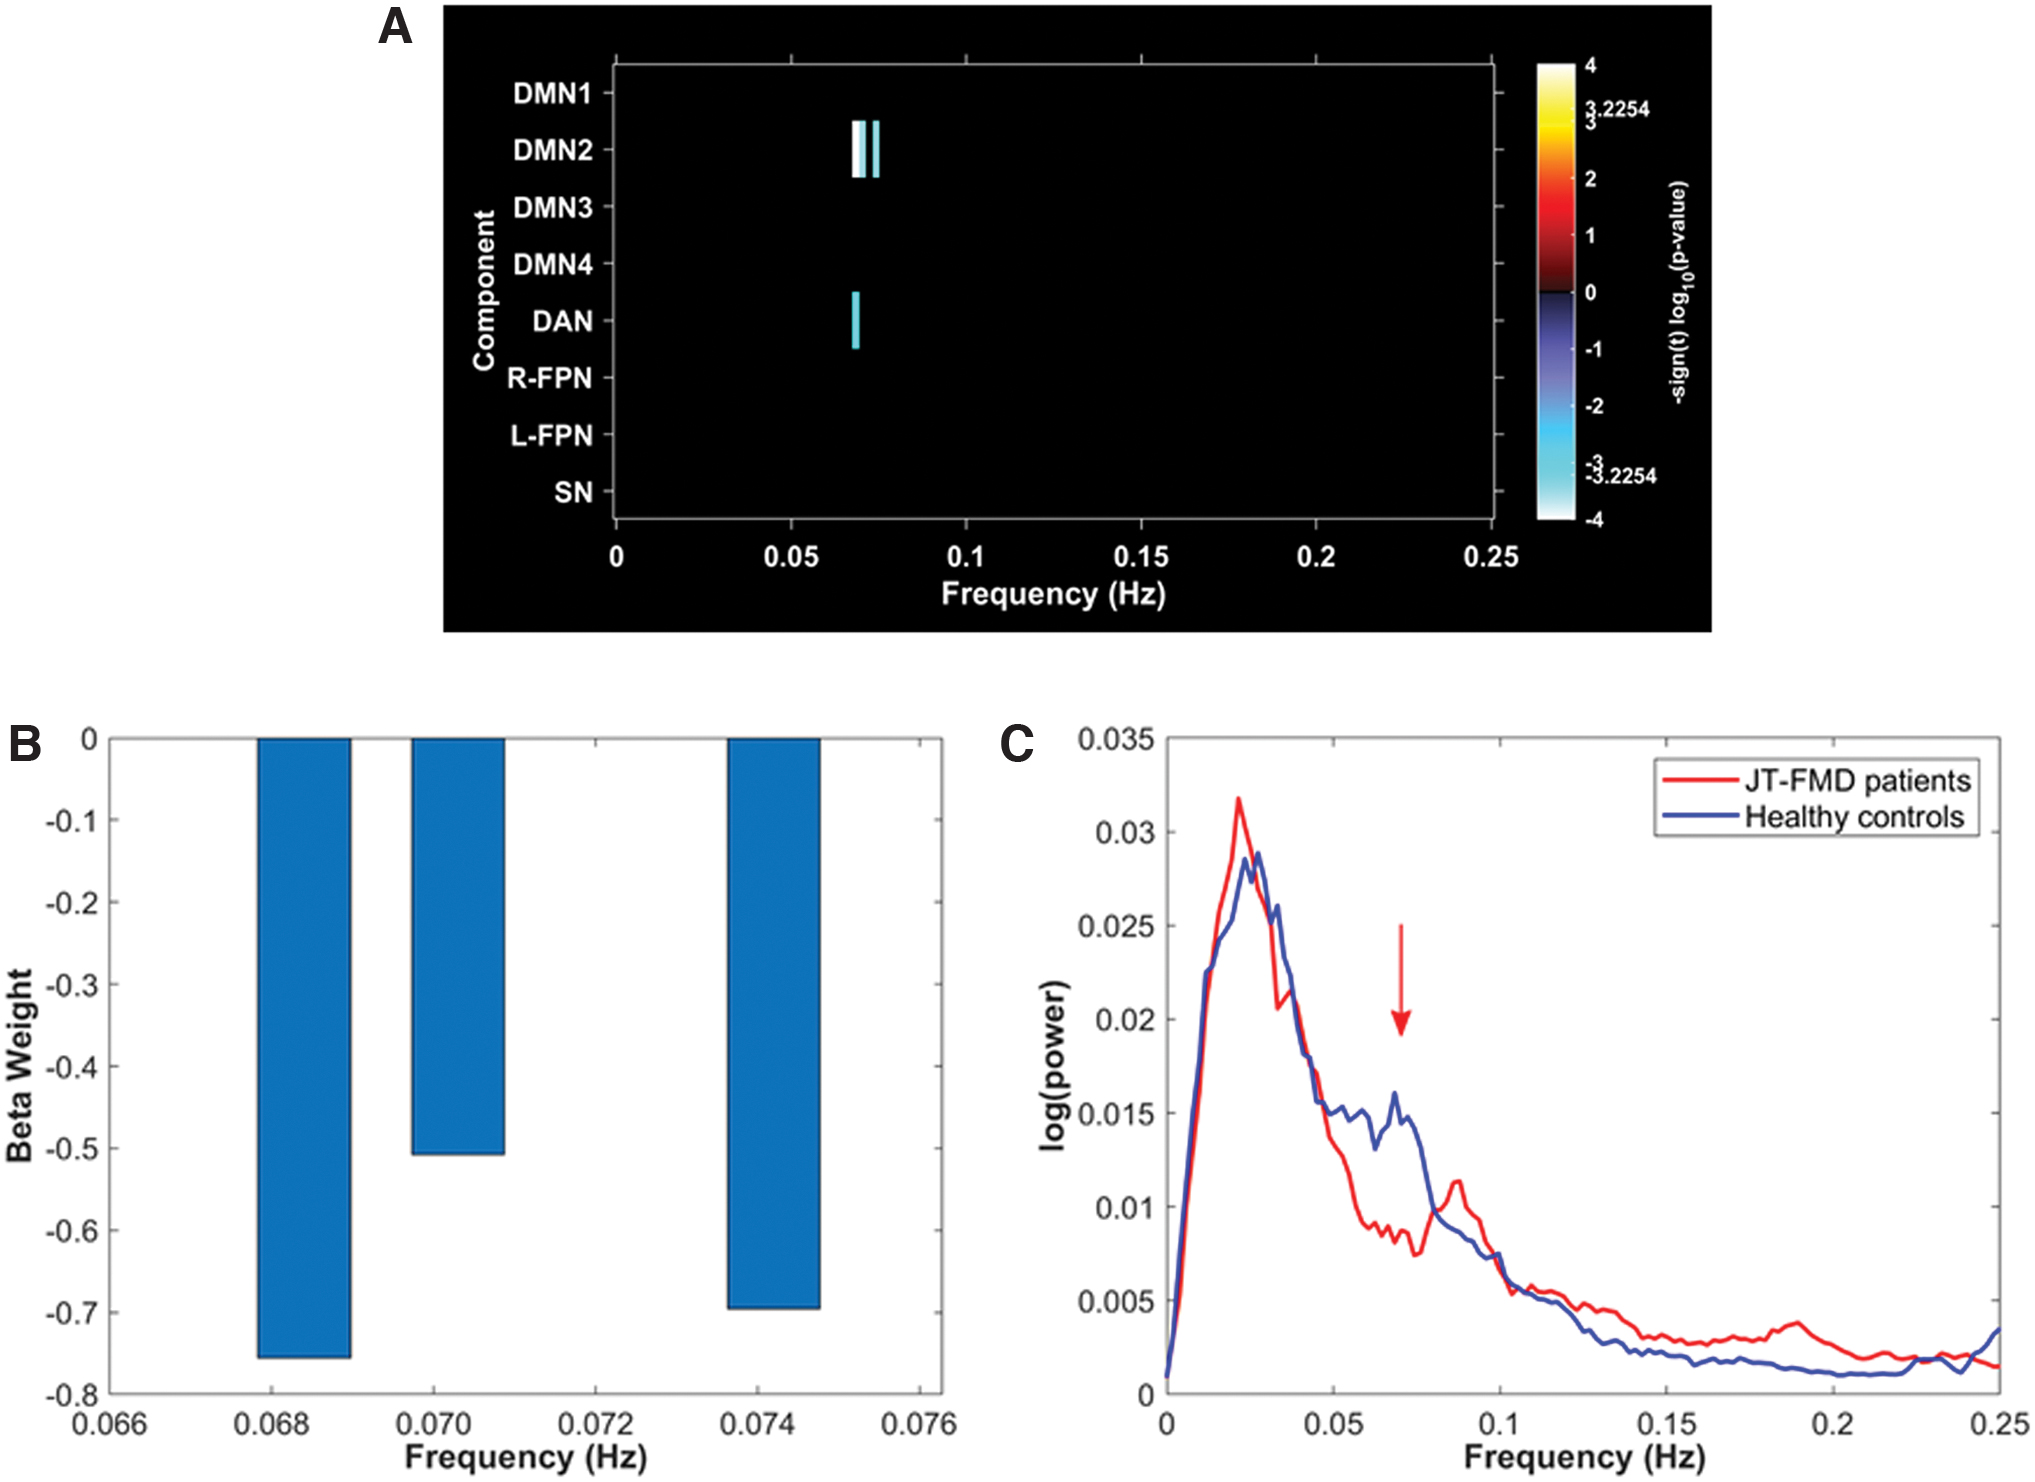
Results of the frequency distribution of network signal fluctuation comparison in patients with JT-FMD and HC. Figures demonstrate the between-group differences in frequency distribution of network signal fluctuations in patients with JT-FMD compared with HC.
Intranetwork functional connectivity analysis
There were no significant differences in intranetwork functional connectivity in resting-state networks between patients with JT-FMD and HC after FDR-correction for multiple comparisons. Depression scores were weakly correlated with intranetwork functional connectivity in the mPFC (Fig. 4; FDR-corrected p < 0.05). Intranetwork functional connectivity was not significantly related to CGI-S and BAI scores in patients after FDR-correction for multiple comparisons.
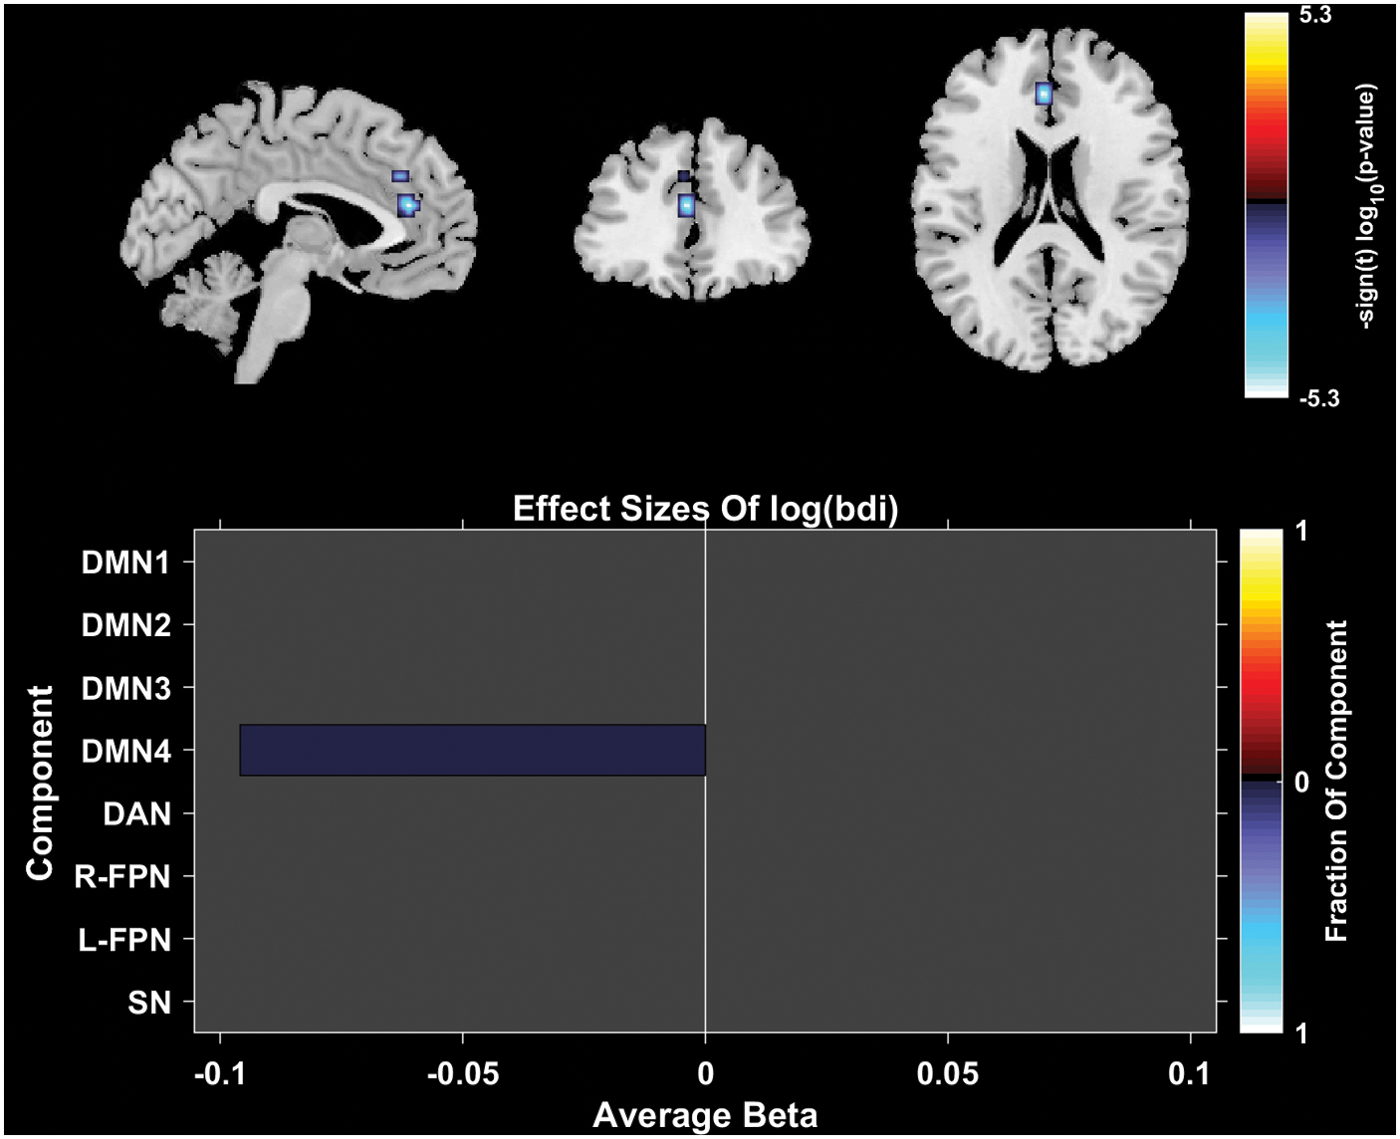
Results of the correlation between BDI scores and intranetwork functional connectivity in patients with JT-FMD. In the top row of the figure, composite maps of significant effects over all components are displayed as −sign(t)log10(p). The significant effect was found in a fraction of voxels in the medial prefrontal cortex component (DMN4). Effects are considered significant if statistics are FDR-corrected p < 0.05 with a cluster size of at least 27 contiguous voxels. Bottom row of the plot shows average β values (effect size), where the color of the bar is proportional to the fraction of component voxels contributing to this effect. BDI, Beck Depression Inventory. Color images are available online.
Internetwork functional connectivity analysis
No significant differences were found in internetwork functional connectivity in resting-state networks between patients with JT-FMD and HC after FDR-correction for multiple comparisons. Internetwork functional connectivity was not significantly related to CGI-S, BDI, and BAI scores in patients after FDR-correction for multiple comparisons.
Discussion
Currently, the pathophysiological underpinnings of FMD remain largely unknown. In this study, we aimed to gain further insight in neuronal mechanism underlying FMD by performing a data-driven rs-fMRI analysis. We found altered regional brain activity in the precuneus and PCC, which constitute the posterior part of the DMN, and DAN in JT-FMD patients. Although attention measures were not performed in this study, thus precluding an assessment of the relationship between our findings and attention regulation in FMD, we do postulate that the FMD-related changes observed in the precuneus, PCC, and adjoining DAN functioning may well reflect aspects of attention dysregulation, consistent with the model proposed by Edwards et al. (2012).
We did not detect additional differences in functional connectivity between groups, implying that we did not gain support for a specific relationship between attentional dysregulation and altered sense of agency in the studied FMD patients. Furthermore, symptom severity was not significantly correlated with network measures in patients with JT-FMD.
The main finding of the present article is decreased power in lower range frequency fluctuations in the posterior part of the DMN (precuneus and PCC) and the DAN in patients with JT-FMD. The precuneus and PCC networks are associated with attention shifting (Le et al., 1998), while particularly the precuneus is strongly interconnected with more lateral regions that constitute the DAN (Margulies et al., 2009), a network that has been implicated in managing external and attention demanding cognitive functions (Corbetta and Shulman, 2002), and top-down biasing of sensory systems (Vossel et al., 2014).
Altered attentional processing is considered to be an important element in the presumed mechanism of JT-FMD. We know from observation and the experimental setup of Pareés et al. (2011) that patients' focused attention may drive the abnormal motor behavior, and that diverted attention reduces symptoms. The finding of altered activity of the precuneus and PCC in JT-FMD is consistent with previously described findings in patients with FMD. For example, Maurer et al. (2016) found altered functional connectivity between the right TPJ and the right precuneus in patients with FMD (n = 35).
Furthermore, in a task-based fMRI study by Espay et al. (2017), functional dystonia subjects (n = 12) showed bilateral decreases of activation in the precuneus. In addition, in a go/no-go task fMRI study in a patient with conversion paralysis, the vmPFC (part of the DMN), the PCC, and the precuneus cortex have been found to be hyperactive (Cojan et al., 2009). These task-based analyses thus provide support for the involvement of frontal and posterior midline regions in altered attention shifting and motor initiation in FMD.
In our study, we also found a weak negative correlation between BDI scores and intranetwork functional connectivity in the vmPFC component (DMN2). The vmPFC is strongly connected to the limbic system, and has an important role in regulating amygdala activity (Motzkin et al., 2015). Of note, aberrant vmPFC functional activity has been described in patients with depression (Sheline et al., 2009; Yu et al., 2013). Interestingly, Diez et al. (2019) recently found changes in functional connectivity propagation within limbic and motor-limbic circuits that might be related to altered emotions and self-awareness.
We are confident about the robustness of our findings for the following reasons. First, we implemented a data-driven approach in our study, which eliminates a priori bias in interpreting our findings. In addition, our results remained significant after correcting for multiple comparisons. Furthermore, we addressed motion artifacts by implementing the ICA method (Murphy et al., 2013), via motion parameter regression, and by including framewise displacement as a covariate in all our regression models (Power et al., 2012). Importantly, we also implemented GIG-ICA, which has been shown to yield better performance than existing techniques with respect to independence, spatial correspondence, spatial and temporal accuracy, and motion artifact removal (Du and Fan, 2013; Du et al., 2016).
However, while we emphasized that our findings could reflect attention dysregulation (Edwards et al., 2012), the brain regions found to be different in JT-FMD are also associated with other functions, such as episodic memory retrieval (Cavanna and Trimble, 2006). For example, in a study performed in patients with conversion disorder, Voon et al. (2011) found greater activity in the bilateral posterior cingulate, an observation they associated with enhanced emotional processing (Voon et al., 2011). Particularly the fact that we did not obtain data from our patient group concerning possible changes in attention regulation, the association we infer is based on the literature, as indicated above.
Of note, while the DMN is considered to be one network, in this study we did not find one but instead found four components that we considered to be part of the DMN, while other studies using the ICA method have reported a different composition of components. For that reason, we argue that attributing too much significance toward the function of predefined networks as a whole, as opposed to individual brain regions, should be dissuaded when interpreting the results.
A significant part of the analyses in our study did not show differences between groups. In this respect, it is important to note that our methodology differs significantly from, for example, the study by Maurer et al. (2016) as they used a seed-based approach, while we opted for a data-driven approach using ICA. In addition, the studies in conversion paralysis and functional dystonia were both task-based fMRI (Cojan et al., 2009; Espay et al., 2017), while we conducted an rs-fMRI study. These differences in methodological approaches could explain the lack of changes found in our study with regard to internetwork functional connectivity.
Another explanation for the lack of differences between groups in our task-free paradigm could be ascribed to the fact that alterations in brain activity in patients with JT-FMD might be subtle and subject-specific. Finally, the failure to detect group differences in functional connectivity may be a sample size-related issue. In this regard, future studies with larger sample sizes may reveal which group differences remained undetected in the present study.
Nonetheless, it should be considered that this is the first rs-fMRI study that analyzed regional brain activity in patients with JT-FMD, showing alterations in regional brain activity in the absence of impaired functional connectivity. While it should be noted that the functional role of lower range frequency fluctuations may be novel and relatively unexplored, multiple studies have nevertheless corroborated their importance (Zuo et al., 2010), being vitally involved in the coordination and neuronal organization of brain activity between regions that frequently work in concert (Fox and Raichle, 2007). Similar to our results, McHugo et al. (2015) found altered regional brain activity in the form of increased power of lower range frequency fluctuations in the hippocampus in patients with schizophrenia, while the functional connectivity was found to be normal.
These findings could reflect aberrant activity in isolated brain regions and not internetwork functional connectivity per se. One may also hypothesize that conventional rs-fMRI analyses focused on static functional connectivity may fail to identify changes in such interconnections as these functional connections need not be stable over time. This is illustrated, for example, by dynamic rs-fMRI analysis, which highlights the dynamic character of state fluctuations (Calhoun et al., 2014; van der Horn et al., 2019).
We recognize that our study has a few limitations. First, there was a small patient sample size (17 patients in total). On the contrary, many FMD studies consist of a sample size smaller than 30 patients. The present sample size was chosen for feasibility reasons. We anticipated the negative effects of a small sample size by limiting our analysis to components that were part of prespecified networks (DMN, CEN, and SN), the networks we hypothesized to be aberrant in FMD, to reduce the chance of getting false-positive results. However, as a result of that decision we could miss some key findings in networks we did not investigate.
In addition, the FMD cohort analyzed in this study does not appear to be a representative FMD cohort. In a prospective study done in FMD, 95% had a mood disorder (Feinstein et al., 2001). In our study, roughly 65% of the FMD cohort fulfilled the criteria of (mild) depression and anxiety, when using the recommended cutoff scores. A potential cause for this divergent group of FMD is that there was a high dropout rate during the inclusion, meaning that this sample is not fully representative of FMD. Another potential reason could be the fact that people with higher levels of anxiety and depression in general are less willing to participate, which might have led to a selection bias in our study.
On the contrary, it has not always been possible to show that depression and anxiety are more frequent than in HC (van der Hoeven et al., 2015). Furthermore, as we did not collect BDI and BAI scores for HC, these covariates were not included in the group analyses. Therefore, it is possible that the differences observed in this article could be driven by patients who have higher scores of depression, as decreasing resting-state activity in the precuneus has been described in patients with depression (Liu et al., 2017).
However, we conducted a within-group analysis with the depression and anxiety scores as covariates, and there was no association between these psychometric measures and the precuneus and PCC brain connectivity (Fig. 4). Furthermore, this FMD cohort had rather low depression scores (mean BDI: 8.2), making a potential effect of depression less likely. Taken together, we therefore think the effect found in the precuneus and PCC is associated with FMD and less likely to be due to depression. Also, although participants were instructed to think of nothing during the scan and to point their gaze to the screen in front of them, a fixation mark was not shown to them during the scanning session, and there is still a possibility therefore that one group was more alert than the other.
Moreover, our study only included JT-FMD, however, this means that the results are not generalizable to the general spectrum of FMD and are therefore only applicable for this population. In addition, the lack of a well-validated clinical rating scale for FMD means that we should be cautious when interpreting the association between symptom severity and changes found in this study. Finally, while measures such as duration of symptoms and age of onset were not included as this was beyond the scope of our study, these remain relevant factors to consider when investigating brain functioning in patients with FMD.
Conclusions
While FMD were previously thought to be psychogenic in nature, such a dualistic take on the disorder is now considered unconstructive. In the current study, we demonstrated alterations in the posterior part of the DMN (precuneus and PCC) and DAN, key areas associated with attentional processes that could drive abnormal motor behavior in patients with JT-FMD. These findings may lend support to the concept that particularly attentional dysregulation concerning intended movement and overattention to its actual execution is a fundamental disturbance in these patients. These findings might contribute to new perspectives and avenues for future studies and to the growing conceptualization of FMD.
Footnotes
Author Disclosure Statement
No competing financial interests exist.
Funding Information
This work was supported by the following organizations: Dr. J.M. Gelauff received an unrestricted grant from the graduate school GSMS of the University of Groningen, providing (among others) for the costs of this study. Dr. Marina A.J. Tijssen reports grants from the European Fund for Regional Development from the European Union (01492947) and the province of Friesland, ZONMW-TOP (91218013), Dystonia Medical Research Foundation, from Stichting Wetenschapsfonds Dystonie Vereniging, from Fonds Psychische Gezondheid, from Phelps Stichting, and an unrestricted grant from Actelion.
Supplementary Material
Supplementary Appendix Figure A1
References
Supplementary Material
Please find the following supplemental material available below.
For Open Access articles published under a Creative Commons License, all supplemental material carries the same license as the article it is associated with.
For non-Open Access articles published, all supplemental material carries a non-exclusive license, and permission requests for re-use of supplemental material or any part of supplemental material shall be sent directly to the copyright owner as specified in the copyright notice associated with the article.
