
Abstract
Aim:
Identify a global resting-state functional connectivity (gFC) signature in mutation carriers (MC) from the Dominantly Inherited Alzheimer Network (DIAN). Assess the gFC with regard to amyloid (A), tau (T), and neurodegeneration (N) biomarkers, and estimated years to symptom onset (EYO).
Introduction:
Cross-sectional measures were assessed in MC (n = 171) and mutation noncarrier (NC) (n = 70) participants. A functional connectivity (FC) matrix that encompassed multiple resting-state networks was computed for each participant.
Methods:
A global FC was compiled as a single index indicating FC strength. The gFC signature was modeled as a nonlinear function of EYO. The gFC was linearly associated with other biomarkers used for assessing the AT(N) framework, including cerebrospinal fluid (CSF), positron emission tomography (PET) molecular biomarkers, and structural magnetic resonance imaging.
Results:
The gFC was reduced in MC compared with NC participants. When MC participants were differentiated by clinical dementia rating (CDR), the gFC was significantly decreased in MC CDR >0 (demented) compared with either MC CDR 0 (cognitively normal) or NC participants. The gFC varied nonlinearly with EYO and initially decreased at EYO = −24 years, followed by a stable period followed by a further decline near EYO = 0 years. Irrespective of EYO, a lower gFC associated with values of amyloid PET, CSF Aβ1–42, CSF p-tau, CSF t-tau, 18F-fluorodeoxyglucose, and hippocampal volume.
Conclusions:
The gFC correlated with biomarkers used for defining the AT(N) framework. A biphasic change in the gFC suggested early changes associated with CSF amyloid and later changes associated with hippocampal volume.
Impact statement
This project focused on creating and evaluating a global functional connectivity (FC) signature that may serve as an outcome measure in clinical trials. This global FC signature encompassed multiple resting-state networks that included both inter- and intranetworks. Prior studies that focus on a single network may overlook important changes seen within and between networks. Our analysis is a logical progression from previous work that demonstrated that intra- and internetwork brain connections across multiple networks were affected with progression to cognitive impairment in autosomal dominant Alzheimer disease. This work revealed that FC disruption exhibits a nonlinear time course that was consistent with proposed biomarker models.
Introduction
Alzheimer disease (AD) is the leading cause of dementia in the United States. The occurrence of AD has been linked with β-amyloid (Aβ) peptide aggregating into plaques in the brain (Burdick et al., 1992). Aβ levels vary naturally following a circadian rhythm (Kang et al., 2009) and are associated with neuronal excitability (Palop et al., 2007). Excess production from neuronal hyperexcitability may underlie plaque formation (Mattsson et al., 2016; Palop et al., 2007). The amyloid cascade hypothesis (Mosconi., 2005) proposes that accumulation of Aβ plaques results in neurotoxic effects that are associated with tau accumulation and neurodegeneration culminating in cognitive dysfunction (as assessed by the clinical dementia rating [CDR]) (Bateman et al., 2012).
Autosomal dominant Alzheimer disease (ADAD) is caused by ∼100% penetrant mutations in genes that encode for the amyloid precursor protein (APP) (Bateman et al., 2011; Ryman et al., 2014; Schindler and Fagan, 2015) or gamma-secretase components, presenilin (PSEN) 1 and PSEN2. The ability to estimate when mutation-positive (mutation carriers [MC]) carriers will develop cognitive changes allows for modeling of disease based on estimated years to symptom onset (EYO). ADAD typically occurs at an earlier age compared with late-onset AD (LOAD) (Dubois et al., 2016; Frisoni, 2012; Smailagic et al., 2014) and is not associated with age-related comorbidities.
Pathologic changes start decades before clinical symptoms manifest in ADAD (Bateman et al., 2012). Recently, a set of biomarker criteria has been proposed to stage LOAD disease progression (Jack et al., 2012). This model describes that the earliest changes involve amyloid accumulation (A), followed by tau (T) deposition, and eventually neurodegeneration (N) that lead to cognitive dysfunction (Berti et al., 2010; Ewers et al., 2011; Fennema-Notestine et al., 2009; Frisoni et al., 2010; Klunk et al., 2004; Mosconi et al., 2010; Smailagic et al., 2015; Vlassenko et al., 2012).
Changes in amyloid biomarkers, such as cerebrospinal fluid (CSF) Aβ1–42 and Pittsburgh compound B (PiB) amyloid positron emission tomography (PET), have been observed ∼15–20 years before symptom onset in ADAD (Bateman et al., 2012; Berti et al., 2010; Brier et al., 2016; Forsberg et al., 2008; Gordon et al., 2018; McDade et al., 2018). Tau (T) biomarkers, such as CSF phosphorylated tau181 (p-tau181) (Schindler and Fagan, 2015), change ∼10–15 years before symptom onset in ADAD.
Neurodegeneration (N) biomarkers, such as CSF total tau (t-tau) (McDade et al., 2018; Schindler and Fagan, 2015) 18F-fluorodeoxyglucose (FDG) PET, a measure of glucose metabolism (Mosconi., 2005), and magnetic resonance imaging (MRI) measurements of hippocampal volume (Bateman et al., 2012; Bobinski et al., 2000; Gordon et al., 2018; McDade et al., 2018; Zarow et al., 2005), change at ∼5–10 years before EYO. CSF-based measures are sensitive to global levels of amyloid accumulation and tau deposition, but lack information pertaining to what brain regions are affected.
Imaging, on the contrary, provides spatially detailed information regarding impacted brain regions. In fact, PET imaging has revealed that amyloid may accumulate in a pattern of brain regions distributed across multiple functional brain networks (Thomas et al., 2014). This has led some to hypothesize that the pathological spread of disease through the brain occurs via brain networks (Forsberg et al., 2008; Thomas et al., 2014). However, a gap persists regarding when changes in brain networks occur with respect to AT(N) biomarkers in ADAD.
Resting-state functional connectivity (FC) noninvasively measures the association of signaling among brain regions and can be used to identify resting-state networks (RSNs) (Franzmeier et al., 2020). The inter-relationships among RSNs is sensitive to neuronal dysfunction and is associated with the degree of cognitive impairment (Frisoni et al., 2010; Frisoni., 2012; Frost and Diamond, 2010). A reduction in both intra- and internetwork FC occurs in ADAD (Gholipour et al., 2008). Global metrics of amyloid and tau accumulation aggregate spatially selective patterns for increased sensitivity. Similarly, a global FC signature can be derived from a combination of changes in intra- and internetworks that spans multiple RSNs (Power et al., 2012; Su et al., 2015). It remains important to know where changes in this global FC signature occur in the temporal progression of ADAD.
The purpose of this study is to evaluate the role of FC within the AT(N) framework in ADAD. Prior work has focused on select FC network differences, however, we use a data reduction strategy to compile information across multiple intra- and internetwork connections into a single global FC signature of ADAD. We assess FC strength based on a global FC signature between noncarriers (NC), MC asymptomatic (CDR 0), and MC symptomatic (CDR >0). We also evaluate the relationship between the global FC signature and established biomarkers that comprise the AT(N) framework and model the global FC signature as a function of EYO.
Methods
Participant characteristics
The cohort consisted of 171 individuals with ADAD mutations (MC) and 104 individuals from ADAD families who were genetically at-risk for inheriting the mutation but were not carriers (NC). All participants were enrolled in the international Dominantly Inherited Alzheimer Network (DIAN) and extracted from Data Freeze 11. Inclusion into this current analysis required that participants complete a general physical (including neurologic) examination, health and medication history, clinical assessment for dementia (Gordon et al., 2018), biochemical analysis, neuroimaging acquisition on only 3T Siemens Tim Trio scanners (Erlangen, Germany), and successful pass all quality control criteria (e.g., reduced motion during neuroimaging acquisition). All participants or their representatives provided written informed consent that was in accordance with the Washington University Institutional Review Boards or their respective institutions provided approval.
Clinical dementia rating
Experienced clinicians conducted semistructured interviews of each participant and a knowledgeable collateral source. The CDR was used to evaluate the degree of impairment (Morris, 1993). A score of CDR 0 indicates cognitively normal, CDR 0.5 corresponds to very mild dementia, and CDR ≥1 specifies mild to moderate dementia. Participants with a score of CDR >0 had a clinical diagnosis of AD dementia using previously described criteria (Greicius et al., 2003).
EYO estimation
Parent age at symptomatic onset was determined from semistructured interviews with the participant, a knowledgeable collateral source, and/or other informants familiar with the parental history of disease. The age at onset of the affected parent was determined by estimating the time of onset of consistent symptoms (e.g., memory/cognition, motor, or behavior) (Ryman et al., 2014). The EYO for each individual from DIAN was defined as age at testing minus the age at symptom onset for that individual's affected parent (Bateman et al., 2011).
Biochemical analyses
A lumbar puncture was performed in the morning under fasting conditions to obtain CSF using previously described methods (Bateman et al., 2012). Samples were shipped on dry ice to the DIAN biomarker core laboratory. CSF concentrations of Aβ1–42, t-tau, and phosphorylated tau181 (p-tau181) were measured by immunoassay (INNOTEST Aβ1–42 and INNO-BIA AlzBio3, Innogenetics). All values met quality-control standards, including a coefficient of variation of 25% or less and kit “controls” that were within the expected range as defined by the manufacturer. Measurement consistency between plates of a common sample was included in each run.
Imaging
MRI data from only 3T Siemens Tim Trio scanners (Erlangen, Germany) were analyzed. Scanners were calibrated and used similar protocols. Structural images were acquired using the Alzheimer's Disease Neuroimaging Initiative (ADNI) protocol. T1-weighted scans were automatically segmented into regions of interest according to the Desikan atlas through FreeSurfer (Martinos Center for Biomedical Imaging, Charlestown, MA). Blood oxygen level-dependent (BOLD) FC was also acquired using previously described methods (Thomas et al., 2014). During the BOLD FC scans, participants were instructed to remain still with their eyes open and not fall asleep.
PET imaging was performed using FDG to measure glucose metabolism and PiB to measure amyloid load. PET imaging analyses were performed using a previously described PET Unified Pipeline (Su et al., 2013). Data from the 40- to 70-min postinjection window for PiB and 40- to 60-min window for FDG were converted to standardized uptake value ratios (SUVR) in the defined regions of interest using the cerebellar cortex as a reference region (Mintun et al., 2006). Partial volume correction was performed with a regional spread function (Su et al., 2015) that uses a geometric transfer matrix technique (Rousset et al., 2008). Global Aβ was summarized as the average SUVR for the precuneus, lateral temporal, gyrus rectus, and prefrontal regions that have previously been shown to delineate AD from cognitively normal controls (Su et al., 2013). FDG from the precuneus was utilized as changes in this region are reliable and occur early in DIAN participants (Benzinger et al., 2013; Gordon et al., 2018; McDade et al., 2018).
FC preprocessing
BOLD FC preprocessing followed previously described methods (Brier et al., 2012, 2016; Thomas et al., 2014), including correction of odd versus even slice intensity differences attributable to interleaved acquisition and compensation for head movement within and across runs. Intensity inhomogeneity was corrected using FSL FAST (Zhang et al., 2001) followed by intensity normalization to obtain a whole-brain mode value of 1000. Echoplanar imaging (EPI) distortion due to magnetization inhomogeneity was corrected using a mean field map (Gholipour et al., 2008). Atlas transformation was computed by registering the EPI mean image to an atlas-representative template via the MP-RAGE (EPI
Frames corrupted by excessive head motion were identified on the basis of both DVARS and frame displacement (FD) measures (Brier et al., 2014). In greater detail, the DVARS criterion was 0.9% root mean square of the frame-to-frame signal change from the entire brain (Afyouni Nichols, 2018; Power et al., 2012). The FD criterion was 0.3 mm. Frames were censored if either criterion was exceeded. The time series were band-pass filtered to retain frequencies between 0.005 and 0.1 Hz. For purposes of filtering, only a linear interpolation was applied over censored frames. Censored frames were excluded from all subsequent steps.
Denoising was accomplished using a CompCor-like strategy (Behzadi et al., 2007). In brief, nuisance regressors were derived from three compartments (white matter, ventricles, and the extra-axial space) and then dimensionality reduced to create a matrix for singular value decomposition (SVD). White matter and ventricle masks were segmented in each individual using FreeSurfer 5.3 (Fischl, 2012) and spatially resampled to register with the FC data. Time series also were extracted from high-variance voxels (temporal standard deviation >2.5% relative to the whole-brain mode) in the extra-axial space (excluding the eyes). Nuisance regressors were derived from white matter, ventricles, and the extra-axial space. The final set of nuisance regressors included six parameters derived from rigid body head-motion correction, the global signal (GS) averaged over the (FreeSurfer-segmented) brain, and the GS temporal derivative. The preprocessed time series was nonlinearly warped to Montreal Neurological Institute (MNI) 152 space (3 mm3 voxels) space using FNIRT (Andersson et al., 2010; Jenkinson et al., 2002; Smith et al., 2004; Woolrich et al., 2009).
FC postprocessing
A putative set of 246 functional regions-of-interest (ROIs) were organized into 12 RSNs that included the sensorimotor (SM), sensorimotor-lateral (SMlat), cingulo-opercular (CO), auditory (AUD), ventral attention (VAN), visual (VIS), salience (SAL), default mode network (DMN), memory (MEM), dorsal attention (DAN), subcortical (SUB), and frontoparietal (FP) (Rousset et al., 2008). ROIs were defined as 10-mm-diameter spheres whose center coordinates were in MNI atlas space (Power et al., 2011). All ROIs were distinct and occupied unique voxels. A

PCA reveals a distributed pattern of FC changes across cortical and subcortical RSNs. Left: The mean FC matrix across all participants. An FC matrix from 248 regions of interest was computed for each participant. Positive correlations are shown in the upper triangle, and negatives are shown in the bottom triangle. Notched black lines on the top and to the right indicate RSNs. The black box outline is a visual aid highlighting the intranetwork FC values of the DMN. Middle: The mean FC-composite matrix across all participants. For each participant, an FC-composite matrix was generated by computing the mean intra- and internetwork FC matrix values (total of 78) for all 12 RSNs. Here the black box highlights the mean intranetwork FC value of the DMN. Right: The global FC signature is derived from the primary PCA pattern and reflects positively and negatively weighted mean FC-composite values. The strongest positive weights include the SM, SMlat, CO, AUD, VIS, and MEM. The strongest negative weights included the FP, MEM, DAN, and DMN. The black box outline highlights the weight of the mean intranetwork FC value of the DMN. AUD, auditory; CO, cingulo-opercular; DAN, dorsal attention; DMN, default mode network; FC, functional connectivity; FP, frontoparietal; MEM, memory; PCA, principal component analysis; RSNs, resting-state networks; SAL, salience; SM, sensorimotor; SMlat, sensorimotor-lateral; SUB, subcortical; VAN, ventral attention; VIS, visual. Color images are available online.
FC principal component analysis
Data reduction was performed to isolate a global FC signature metric of global FC changes (Smith et al., 2018; Su et al., 2015). The intra- and internetwork pattern of FC values from each participant was compiled, and a single global FC signature was selected. Specifically, the 12 intranetwork and
EYO modeling
Global FC signature versus RSN
We compared the abilities of the global FC signature and intranetwork values of the 12 RSNs included in this study to, separately, predict EYO using a leave-one-out cross-validation. Specifically, for each FC metric: FC and EYO data were split into two sets: train and test. The training set comprised data from N − 1 mutation-positive participants, and a test set comprised data from a single mutation-positive participant. A linear predictive model was computed using the training set:
The linear model (i.e., coefficients
The error in EYO was computed:
Steps 1–4 were repeated such that the FC data for each mutation-positive participant were used in the test set.
The sum of squares (SS) was computed for both EYOerr and EYO:
The coefficient of determination (R2), the proportion of the variance in actual EYO that is predictable from the FC, was computed:
Nonlinear modeling
AD biomarkers exhibit nonlinear time courses across disease progression (Bateman et al., 2012; Jack et al., 2010; Kinnunen et al., 2018). Proposed biomarker models suggest nonlinear time courses with sigmoidal shape (Jack et al., 2010). The sigmoid transition time (i.e., when peak rate-of-change occurs) varies based on the biomarker. We investigated a sigmoidal shape of the global FC signature for MC participants to estimate transition times. An unweighted moving average of the global FC signature for MC participants was computed as a function of EYO using bin sizes of ±5 years to capture long-term trends. A model of staggered logistic decline evaluated the relationship between the global FC signature and EYO (t) for MC participants:
where A is carrying capacity, r is growth rate, and
Association between global FC signature and AD biomarkers
Associations were computed between a participant's global FC signature and A/T/(N) biomarkers, including CSF biomarkers (log-transformed Aβ1–42 [A1], p-tau181 [T1], and total-tau [N1]), PET molecular biomarkers (PiB mean cortical SUVR [A2] and FDG uptake in the precuneus [N2]), and a structural MRI biomarker (hippocampal volume [N3]). To investigate the relationship between global FC signature and AD biomarkers while adjusting for mediating associations, the partial correlation matrix (P) was computed by matrix inversion of the correlation matrix (R) such that the partial correlation between the i-th and j-th biomarkers was defined as follows:
where
Results
Demographics
Cross-sectional FC data were obtained for NC (n = 104) and MC (n = 171) participants. NC individuals were older than MC CDR 0 (p < 0.05) participants, but younger than MC CDR >0 (p < 0.05) participants. Similarly, MC CDR 0 participants were younger than MC CDR >0 participants (p < 0.05) (Table 1).
Demographic and Clinical Comparison of Non- and Mutation Carrier Groups
CDR, clinical dementia rating; MC, mutation carrier; NC, noncarrier.
Spatial topology of the global FC signature of ADAD
We observed a global FC signature of ADAD, with strong contributions from both intra- and internetwork connections that spanned multiple RSNs (Fig. 1). This global FC signature was influenced by both positive and negative correlations and, for visual clarity, was separated along the diagonal based on the direction of influence on the global FC signature. Networks whose positive correlations had a strong influence included the SM, SMlat, CO, AUD, VIS, and MEM (intranetwork). Networks whose negative correlations had a strong negative influence included the FP, MEM (internetwork), DAN, and DMN.
The global FC signature associates with markers of disease progression
The global FC signature decreased with pathology. We observed that the global FC signature was significantly decreased in MC (yellow) compared with NC (gray) participants (Fig. 2A). When MC participants were further differentiated by CDR status, the global FC signature significantly decreased in MC CDR >0 (Fig. 2A, red; p < 0.05) compared with either MC CDR 0 (green) or NC (gray) participants. NC and MC CDR 0 participants were not significantly different (p > 0.05). For MC participants, a negative association was observed between mutation EYO and the global FC signature (Spearman's ρ = −0.33, p = 1.2e-05; Fig. 2B). The association between the global FC signature and EYO remained significant after controlling for CDR status. We also observed that the global FC signature predicted, on average, 5 to 18 percent more variance for the actual EYO than internetwork RSN values (Fig. 2C).

Nonlinear EYO modeling of the global FC signature
With regard to EYO, the global FC signature varied nonlinearly across the time course of the disease (Fig. 2D). This was consistent with a dual-logistic behavior model characterized by two transition times that were offset by ∼17 years (Shapiro–Wilk's W = 0.97, p = 0.28). This nonlinear model (AIC = −161, BIC = −153) performed significantly better than the first-order (AIC = −128, BIC = −123), second-order (AIC = −128, BIC = −121), and third-order (AIC = −126, BIC = −118) polynomial models (Levene's F = 4.04, p = 0.002), and suggested a two-stage process. The global FC signature was elevated early in the disease time course (EYO < −16.7 years) in MC followed by a period that resembled control levels until further decreasing near the estimated time of symptom onset (EYO = 0.5 years).
Association between global FC signature and biomarkers
Strong associations were observed between CSF total tau and CSF p-tau181 (r = 0.86, p < 10E-16), mean cortical PiB SUVR and CSF total tau (r = 0.53, p = 1.7E-9), mean cortical PiB SUVR and CSF p-tau181 (r = 0.65, p = 2.2E-16), and precuneus PET FDG and hippocampal volume (r = 0.53, p = 1.6E-09).
Strong associations were observed between the global FC signature and several AD biomarkers (Fig. 3B, left). The global FC signature was compared with each AD biomarker classified according to the amyloid (A), tau (T), and neurodegeneration (N) framework (Fig. 3A). With regard to A criteria, the global FC signature was negatively associated with amyloid deposition as measured by mean cortical PiB SUVR (p = 0.03), and was positively correlated with CSF Aβ1–42 (p = 0.007). With regard to T criteria, the global FC signature was negatively associated with CSF p-tau181 (p = 0.009). With regard to (N) criteria, the global FC signature was negatively associated with CSF total tau (p = 0.02), and positively associated with both precuneus PET FDG (p = 0.002) and hippocampal volume (p = 0.001). For each of these biomarkers, a worse global FC signature score was associated with greater pathology.
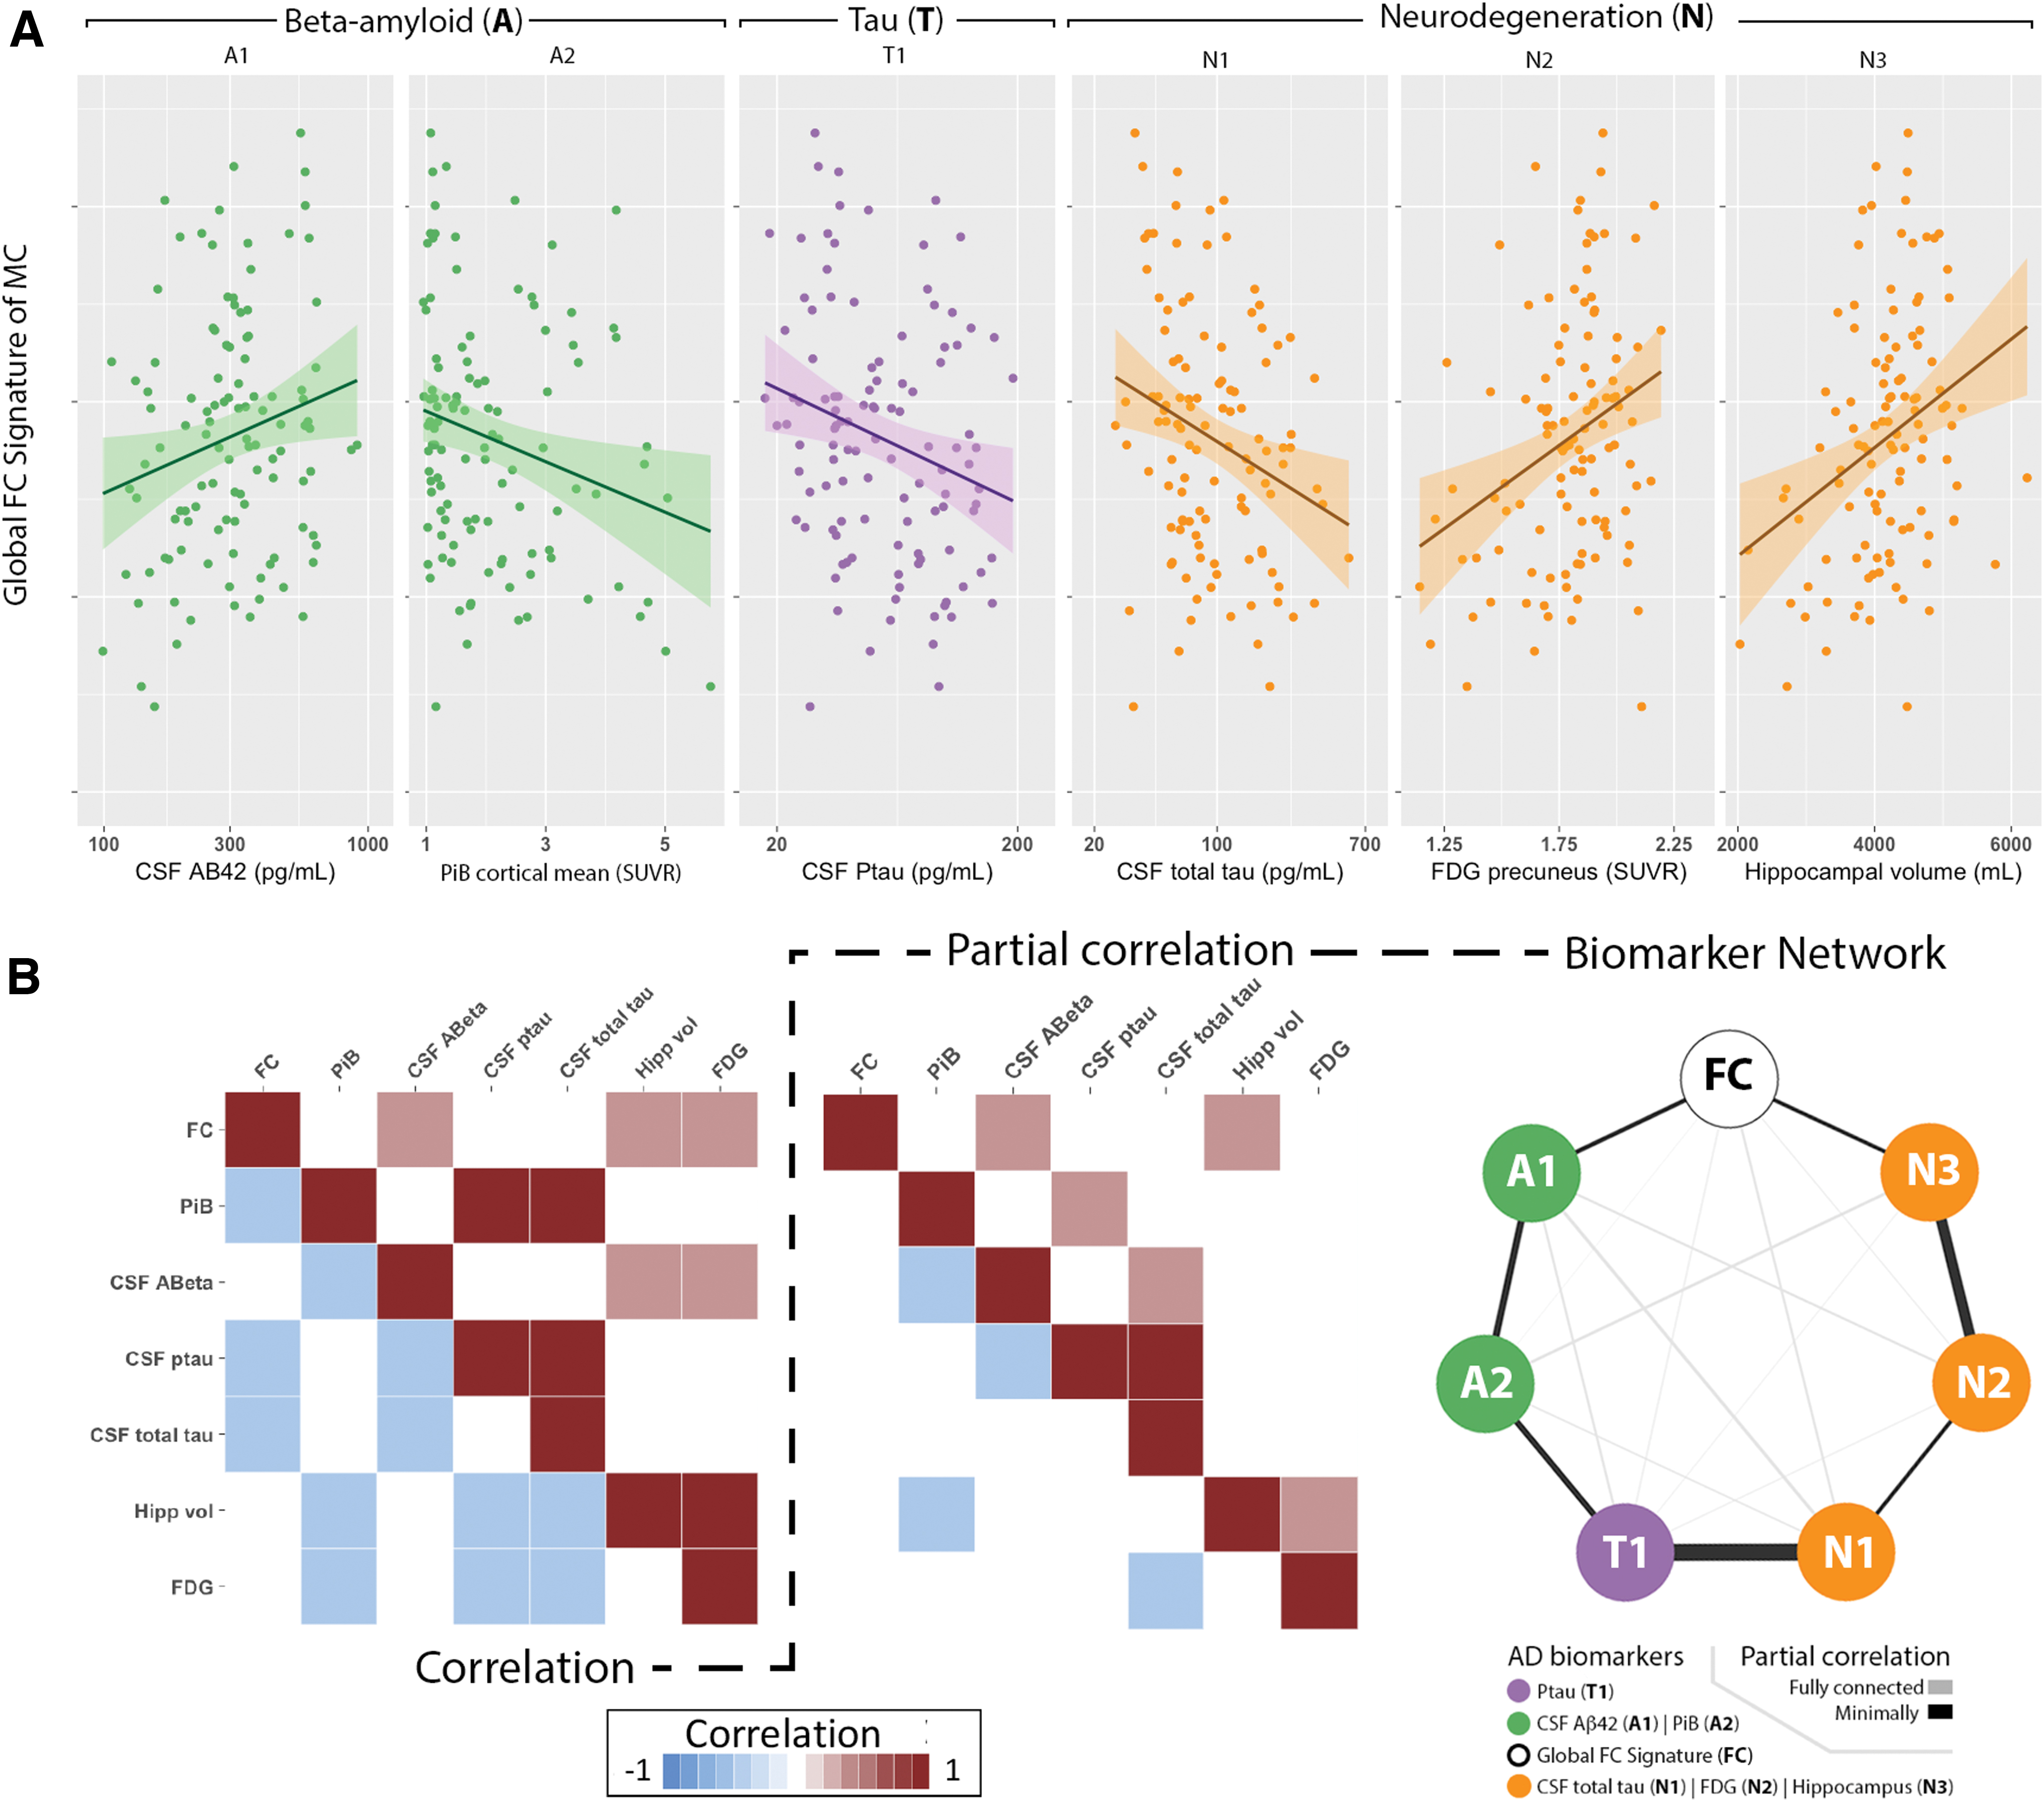
The global FC signature as a function of Alzheimer disease (AD) biomarkers in mutation-positive (MC) individuals. Analyses investigated amyloid (A; green), Tau (T; purple), and neurodegenerative (N; orange) biomarkers. Scatter plots show that the global FC signature was
To investigate the strength of the direct pathological relationship between any two biomarkers (including the global FC signature), we controlled for potential mediating effects of general pathological decline. Specifically, an unbiased model was computed using a partial correlation matrix that controlled for other biomarkers (Fig. 3B, middle). In this unbiased model, no assumption of a specific temporal sequence of biomarkers was included. This network model strongly differentiated AT(N) biomarkers and agreed with previously hypothesized trajectories with amyloid measures strongly associating with each (A1 and A2), measure of tau (T1) strongly tied to neurodegeneration (N1), as well as measures of neurodegeneration group together (N1, N2, and N3) (Fig. 3B, right). In this model, the global FC signature most strongly associated with CSF Aβ 1–42 (A1) and hippocampal volume (N3). These results provide further evidence of a two-stage process concerning the global FC signature with changes associating with early and late biomarkers. Moreover, these results suggest that each stage may be associated with changes in either amyloid accumulation or volumetrics.
Discussion
These results provide evidence that disruption of multiple functionally connected brain networks occurs in ADAD MC that is both stage dependent (asymptomatic versus symptomatic) and state dependent (biomarker status). Disruption of the global FC signature was greatest in symptomatic MC carriers. This indicates that changes in the global FC signature are tightly coupled with clinical presentation. However, even after adjusting for symptom severity using CDR, disruption of the global FC signature was significantly associated with disease progression, as measured by EYO. Furthermore, the global FC signature was, on average, a better predictor of EYO compared with intranetwork values of individual RSNs. Changes in the global FC signature were also associated with pathological biomarkers classified using the AT(N) framework for designating temporal progression of AD. Two independent methods showed that disruption of the global FC signature (1) occurred primarily during early (EYO ∼ −17) and late (EYO ∼0) stages, and (2) was associated with early-stage (CSF Aβ1–42) and late-stage (hippocampal atrophy) biomarker changes. Taken together, these results suggest that the global FC signature may be sensitive to distinct processes affecting synaptic activity: Aβ accumulation early on in disease progression and neurodegeneration during later stages.
Our results are consistent with previous FC studies that investigated the disruption of specific RSNs in ADAD, but also shed new light on patterned changes across the entire spatial topography. Previous studies have primarily focused on FC changes within a single network. Changes have typically focused on the DMN, as this network has been associated with amyloid deposition (Buckner et al., 2009; Greicius et al., 2004) and is one of the largest networks with regard to the overall size in the brain (Greicius et al., 2003). In our current analysis, a global FC pattern of disruption was observed that included both intra and internetwork brain connections. These results suggest that prior studies primarily focusing on changes within a single network may overlook important changes seen within not only a network but also changes between networks. Our analysis is a logical progression from previous work that demonstrated that intra- and internetwork brain connections across multiple networks were affected with progression to cognitive impairment in ADAD (Thomas et al., 2014). In our current analysis, RSNs that associated with cognitive impairment included cognitive processing networks, including MEM, FP, DAN, and DMN, as well as sensory cortical regions such as the SM, SM-lat, VIS, and AUD. Cognitive processing regions that have been associated with the changes in pathological biomarkers, such as amyloid and tau accumulation and volume loss, and disruption of FC in these regions, may be associated with positivity of one or more biomarkers. Interestingly, neither FC nor pathological changes are typically observed in primary sensory regions. These results suggest that the FC disruption observed may be a precursor to subsequent pathology.
Disruption was greatest for symptomatic mutation carriers (MC CDR >0) compared with mutation NC. Our data showed that the greatest changes in the FC signature occurred for the symptomatic disease stage based on clinical staging and genetic profile. Specifically, our data showed that 50% of the MC symptomatic cohort overlapped with the worst 25% of the asymptomatic MC cohort. This degree of overlap can be attributed to the classification scheme that is based on subjective responses during the clinical interview. This sensitivity to symptom manifestation bolsters the capability of this imaging marker as a tool for disease conversion. Future studies may assess the capability of an FC signature to redefine group classification to better identify individuals on the cusp of conversion.
Our results are consistent with previous FC studies that investigated disease progression using linear modeling, but also provide new insight regarding the time line of FC disruption. Linear modeling of disease progression suggests that FC disruption begins before the onset of symptoms. Consistent with previous results, we used a linear model and observed that FC disruption in certain RSNs occurred ∼5 years before expected symptom inset (EYO −5) (Chhatwal et al., 2013). However, previous reports show that AD biomarkers exhibit nonlinear time courses across disease stages (Dubois et al., 2016; Jack et al., 2010). In an updated model of disease progression, we observed that the global FC signature also exhibited a nonlinear time course that was consistent with proposed biomarker models (Jack et al., 2010). Specifically, disruption of the global FC signature was marked by two dramatic changes that occurred during very early (∼17 EYO) and late (∼0 EYO) disease stages in AD progression. The time period leading up to the initial decrease of the global FC signature could suggest a very early period of hyperconnectivity (Schultz et al., 2017). The production of Aβ has been linked to increased synaptic activity that can manifest as nonconvulsive seizures that are present before cognitive symptoms (Amatniek et al., 2006; Cirrito et al., 2005; Jack et al., 2010). FC hyperactivity has also been observed in LOAD particularly in areas with advanced Aβ accumulation (Ovsepian and O'Leary, 2016). It remains unclear whether this hyperactivity is detrimental due to synaptic excitotoxicity or compensatory due to increased pathological burden (Palop and Mucke, 2010). Our data suggest that this hyperactivity in FC may be a compensatory mechanism to preserve cognitive stability provided this observed state was years before symptom onset (Su et al., 2015). However, prolonged hyperactivity can lead to cognitive deficits and overall loss in connectivity strength (Thomas et al., 2014). This coincides with the second sharp decrease in the global FC signature that occurred at EYO = 0. This is consistent with evidence from MRI studies that show volume loss accelerates near EYO = 0 (Ewers et al., 2011). Together our data show an overall pattern that initiates with a decline from a hyperactive state that briefly returns to baseline levels before declining near symptom onset. These results suggest a dual-pathology process that reflects biological changes in the absence of behavioral changes. Understanding these distinct processes is clinically important for treatment intervention as individuals may respond differently based on their point on these curves.
The ability to characterize changes in a global FC signature during pre-clinical stages of AD was further supported by a separate linear model that focused on AT(N) biomarkers. A number of studies focusing on pathological biomarkers have proposed an AT(N) sequence in LOAD (Schnabel et al., 1985). Our model for ADAD was given no a priori assumptions concerning the sequence of biomarker events, except that the sequence should be consistent for participants. Despite our assumption of no specific temporal sequence of biomarker progression, our work further supports that ADAD and LOAD have similar temporal patterns for AD biomarkers regardless of the age of onset or genetic association (Schultz et al., 2017). Furthermore, we found that disruption of the global FC signature was preferentially associated with both CSF Aβ1–42 and hippocampal atrophy, biomarkers that characterize pathological changes occurring during the early and late stages of AD, respectively. This suggests that genetic mutations set in motion a time line of AT(N) biomarker changes with brain amyloidosis (possibly with certain soluble amyloid peptides proposed to be more closely associated with neuronal excitotoxicity) (A) followed by tauopathy (T) and eventually reduced glucose metabolism and brain volumetrics (N) (Bateman et al., 2011; Behzadi et al., 2007; Shapiro and Wilk, 1965).
Our results contribute to the understanding of how, in AD etiology, changes in global network functionality precipitate eventual short-term episodic memory deficits, the hallmark of AD. Based on these results it may be possible to use the global FC signature as a marker of underlying neuronal response to trials that introduce anti-Aβ therapies very early in the disease. Advantages for FC as an outcome measure in clinical trials include lack of radiation unlike PET biomarkers, and being less invasive than a lumbar puncture for CSF. Further studies should also look at changes in comparison with LOAD. Longitudinal studies of changes in FC in this cohort are needed to more robustly evaluate the nature of neuronal dysfunction with disease progression.
Footnotes
Acknowledgments
This article has been reviewed by the Dominantly Inherited Alzheimer's Network (DIAN) Study investigators for scientific content and consistency of data interpretation with previous DIAN Study publications. The authors acknowledge the altruism of the participants and their families and contributions of the DIAN research and support staff at each of the participating sites for this study. They thank Drs. Abraham Snyder and Mathew Brier for their helpful suggestions. They also thank all the participants for their involvement in the study and the DIAN sites for their recruitment and coordination of all studies.
Author Contribution
R.X.S.: Primary author of the article, developed the methodology, conducted the analyses, and contributed to the interpretation of the data. J.F.S.: Assisted in the conception and design of the study, consulted on the statistics, and reviewed the article. A.T. and A.M.F.: Assisted in the data analyses, statistics, and reviewed the article. J.H. and S.E.S.: Assisted in the data analyses and reviewed the article. E.M. and B.A.G.: Assisted in the original concept of the project, compiled the data, and reviewed the article. C.X.: Assisted in statistical analyses and reviewed the article. J.C., C.J. Jr., C.K., S.B., J.R.B., J.J.L., A.B., D.M.C., N.C.F., N.R.G.-R., J.L., J.N., D.M.H., C.L.M., M.R.F., C.L., P.R.S., D.S.M., J.C.M., T.L.S.B., R.J.B., and B.M.A.: Compiled the data and reviewed the article.
Author Disclosure Statement
R.X.S., J.F.S., A.T., A.M.F., J.H., S.E.S., C.X., J.C., C.K., S.B., J.J.L., A.B., D.M.C., J.L., J.N., C.L.M., C.L., and P.R.S.: Report no disclosures. E.M.: Research support: NIA, Eli Lilly, Roche, Janssen, GHR Foundation; Advisory Board: Eli Lilly; DSMB: Eli Lilly. B.A.G.: Involved in a clinical trial sponsored by Avid. C.J. Jr.: Consults for Eli Lilly, and serves on an independent data monitoring board for Roche but receives no personal compensation from and commercial entity. He receives research support from NIH/NIA and the Alexander Family Professor of Alzheimer's Disease Research, Mayo Clinic. J.R.B.: Research support includes AbbVie, Avanir, Biogen, Eisai, Eli Lilly, Genetech, Novartis, Roche, Suven Life Sciences Ltd. N.C.F.: Is on the scientific advisory board for Roche and Biogen. N.R.G.-R.: Research support includes AbbVie, Novartis, Biogen and Lilly. D.M.H.: Cofounded and is on the scientific advisory board of C2N diagnostics, LLC. Is on the scientific advisory board of Denali and consults for Genetech and AbbVie. M.R.F.: Research support includes AbbVie, Accera, ADCS, Posiphen, Biogen, Eisai, Eli Lilly, Genentech, Novartis, Suven Life Sciences, Ltd. He is on the advisory boards for Accera, Allergan, Avanir, AZTherapies, Cognition Therapeutics, Cortexyme, Eli Lilly & Company, Longeveron, Green Valley, MedAvante, Merck and Co. Inc., Otsuka Pharmaceutical, Proclara, Neurotrope Bioscience, Regenera, Samumed, Takeda, vTv Therapeutics, Zhejiang Hisun Pharmaceuticals. D.S.M.: Funding support from Radiologics, Inc., and
Funding Information
Data collection and sharing for this project were supported by the Dominantly Inherited Alzheimer's Network (DIAN, UF1AG032438) funded by the National Institute on Aging (NIA), the German Center for Neurodegenerative Diseases (DZNE), Raul Carrea Institute for Neurological Research (FLENI), partial support by the Research and Development, AMED, and the Korea Health Technology R&D Project through the Korea Health Industry Development Institute (KHIDI). Further support for this study was funded by NIH grants R01NR012907, R01NR012657, R01NR014449, P50AG05681, P01AG003991, P01AG026276, P30NS048056, UL1TR000448, R01AG04343404, R01AG052550, R01AG057680, K01AG053474, BrightFocus Foundation A2018817F, and NSF grant DMS1300280. Funding was also provided by the Charles F. and Joanne Knight Alzheimer's Research Initiative, the Hope Center for Neurological Disorders, and generous support from the Fred Simmons and Olga Mohan Fund, the Paula and Rodger O. Riney Fund, and the Daniel J Brennan MD Fund.