
Abstract
Introduction:
It is unknown the alterations in the dynamic networks of the brain and the underlying molecular pathological mechanism of Alzheimer's disease (AD) spectrum. Here, we aim to explore the association between alterations in the dynamic brain networks' trajectory and cognitive decline in the AD spectrum.
Methods:
One hundred sixty subjects were recruited from the ADNI database, including 49 early mild cognitive impairment, 28 late mild cognitive impairment, 24 AD patients, and 59 cognitively normal. All participants completed the resting-state functional magnetic resonance imaging scan and neuropsychological tests. We integrated a new method combining large-scale network analysis and canonical correlation analysis to explore the dynamic spatiotemporal patterns within- and between resting-state networks (RSNs) and their significance in the AD spectrum.
Results:
All RSNs represented an increase in connectivity within networks by enhancing inner cohesive ability, while 7 out of 10 RSNs were characterized by a decrease in connectivity between networks, which indicated a weakened connector among networks from the early stage to dementia. This dichotomous mode presenting large-scale dynamic network abnormality was significantly correlated with the levels of molecular biomarkers of AD, and cognitive performance, as well as with the accumulating effects of 10 identified AD-related genetic risk factors.
Discussion:
These findings deepen our understanding of the associated mechanism underlying large-scale network disruption, linking known molecular biomarkers and phenotypic variations in the AD spectrum.
Impact statement
Collectively, we highlight the association of 10 networks' dynamics with molecular biomarkers, clinical phenotypes, and accumulating effects of genetic variants. These findings shed light on the mechanism of functional network alteration and pathological process and cognitive decline in the Alzheimer's disease spectrum.
Introduction
In the past two decades, substantial progress has been achieved on network perspective integrating modern graph theory to capture the underlying mechanisms of complex brain systems in healthy control subjects, when compared with neurological disorders, such as Alzheimer's disease (AD). Resting-state networks (RSNs), which were constructed with functional connectivity strength depending on the intrinsic blood-oxygen-level-dependent signal from the functional magnetic resonance imaging (fMRI) data, can provide new information into how structurally segregated and functionally specialized brain regions are interconnected. In addition, RSNs have been found to be tightly associated with neural correlates linked to cognitive impairment in pre-clinical and clinical AD patients (Greicius et al., 2003; Jones et al., 2016; Palop and Mucke, 2016; Xie et al., 2012). Importantly, accumulating evidences have demonstrated that the abnormal activity of RSNs could be used as markers to predict the potential mechanisms of cognitive dysfunction in AD and related disorders (Palop and Mucke, 2016). In reality, these RSNs reflect the intrinsic functional coupling of large-scale brain systems and represent distinctive network-level features characterized by different neurodegenerative disorders (Pievani et al., 2011; Teipel et al., 2015). Specifically, the default mode network (DMN), as a key network of RSNs, was thought to be the primary large-scale system targeted, and gradually disrupted, by the cognitive decline following the disease progression of AD (Andrews-Hanna et al., 2010; Greicius et al., 2003; Sorg et al., 2007; Xue et al., 2019). Furthermore, it was conceptualized that different components of the DMN were preferably affected and distinctively depended on the pathological process stage of the AD spectrum (Andrews-Hanna et al., 2010; Damoiseaux et al., 2012; Jones et al., 2011, 2016). As such, a new theory of a cascading network failure was proposed, in which the DMN subsystem connectivity changed across the entire AD spectrum, representing cascading patterns, where the posterior DMN was initially targeted and then spread to frontal–parietal lobes. Notably, high connectivity in the posterior DMN has been found to be closely associated with amyloid deposition (Jones et al., 2016, 2017). This model was the first to reveal the temporal relationship between altered DMN network connectivity and AD molecular biomarkers, including amyloid-beta (Aβ) and Tau protein, in the AD spectrum (Jones et al., 2016, 2017). However, disruption of other RSNs, including attention networks, executive control networks, salience networks (SANs), and visual networks (VISs), was also found to be associated with diverse cognitive decline and implicated in the neural mechanisms underlying the pathophysiology of AD (Chhatwal et al., 2018; Chong et al., 2017; Dhanjal and Wise, 2014; Lehmann et al., 2015). Although these studies focused on the temporal dynamics within specific networks and represented different temporal progress along the AD spectrum, the trajectory of large-scale network connectivity changes over the long-standing disease course of AD is largely unclear, and the neural links between these networks have been largely ignored, which might play a critical role in the progress of disease duration. Therefore, covering the entire AD spectrum from normal to pre-clinical and clinical stages and integrating network connectivity approaches might provide a better way to reveal the dynamic alterations of network connectivity and trace the trajectory of cognitive decline associated with the pathophysiology of AD. More importantly, advances in the development and application of neuroimaging approaches and network analysis have made it possible to investigate the neurobiological mechanisms underlying the complex spatiotemporal relationship between large-scale network connectivity and molecular biomarkers. These approaches have allowed us to study how these two variables synergistically or competitively affect the cognitive decline characteristics of the AD spectrum.
In addition, genetic risk factors can significantly enhance the susceptibility of late-onset AD (LOAD) occurrence and progression via multiple important causal biological processes (Hollingworth et al., 2011; Jiang et al., 2014; Karch and Goate, 2015; Naj et al., 2011; Sleegers et al., 2010; Tan et al., 2013; Zhang et al., 2013) or collectively deteriorating structure and functional networks associated with LOAD (Lancaster et al., 2015; Su et al., 2017). Our group also reported that the summative effect of 10 risk genetic variants was associated with DMN disruption in amnestic mild cognitive impairment, a pre-clinical stage of AD (Su et al., 2017). Thus, to further address the accumulative effects of these genetic variants on the large-scale network level, it is beneficial to explain the relationship of how LOAD-associated genetic variants target the functional coupling within- and between RSNs, and subsequently contribute to disease progression in the AD spectrum.
In the current study, we present our assessment on the association between Aβ, phosphorylated tau (p-Tau), and total tau (T-Tau) protein levels, with cognitive performance, specific RSNs, and the top 10 risk factors of genetic variants in the AD spectrum. For this, we first explored the spatiotemporal evolution of dynamic network connectivity changes within- and between 10 specific RSNs following the disease progression of the AD clinical spectrum. Second, a new approach, known as canonical correlation analysis (CCA), was used to assess the relationship between network connectivity and pathological biomarkers, cognitive performance, as well as the accumulative effects of 10 genetic variants in the AD spectrum. Taken together, we identified determinants associated with the spread of disrupted network incoherence, molecular correlates, and summative effects of genetic variants on the RSNs, and generated new insights on novel mechanisms underlying the phenotypic variability across the AD spectrum at the system level.
Materials and Methods
Participants
All participants were selected according to the following criteria: Caucasian, fMRI scan availability, three-dimensional T1-weighted magnetic resonance imaging (MRI) scan availability (for spatial normalization), AD assessment scale-cognitive subscale (ADAS-cog) score, mini-mental state examination (MMSE) score, cerebrospinal fluid (CSF) biomarker data, and genotype data for rs3764650 of ABCA7, rs7561528 of BIAUD, rs11136000 of CLU, rs610932 of MS4A6A, rs3865444 of CD33, rs9296559 of CD2AP, rs744373 of BIAUD, rs12034383 of CR1, rs11767557 of EPHA1, rs11771145 of EPHA1, rs17125944 of FERMT2, rs10498633 of SLC24A4, and rs3764650 of ABCA7. According to our criteria, 160 subjects, comprising 59 cognitively normal (CN), 49 with early mild cognitive impairment (EMCI), 28 with late mild cognitive impairment (LMCI), and 24 with AD, were evaluated. Ethical approval was obtained by the ADNI investigators (
MRI data acquisition and preprocessing
See the Supplementary Methods section for acquisition and preprocessing procedures.
Functional network analysis
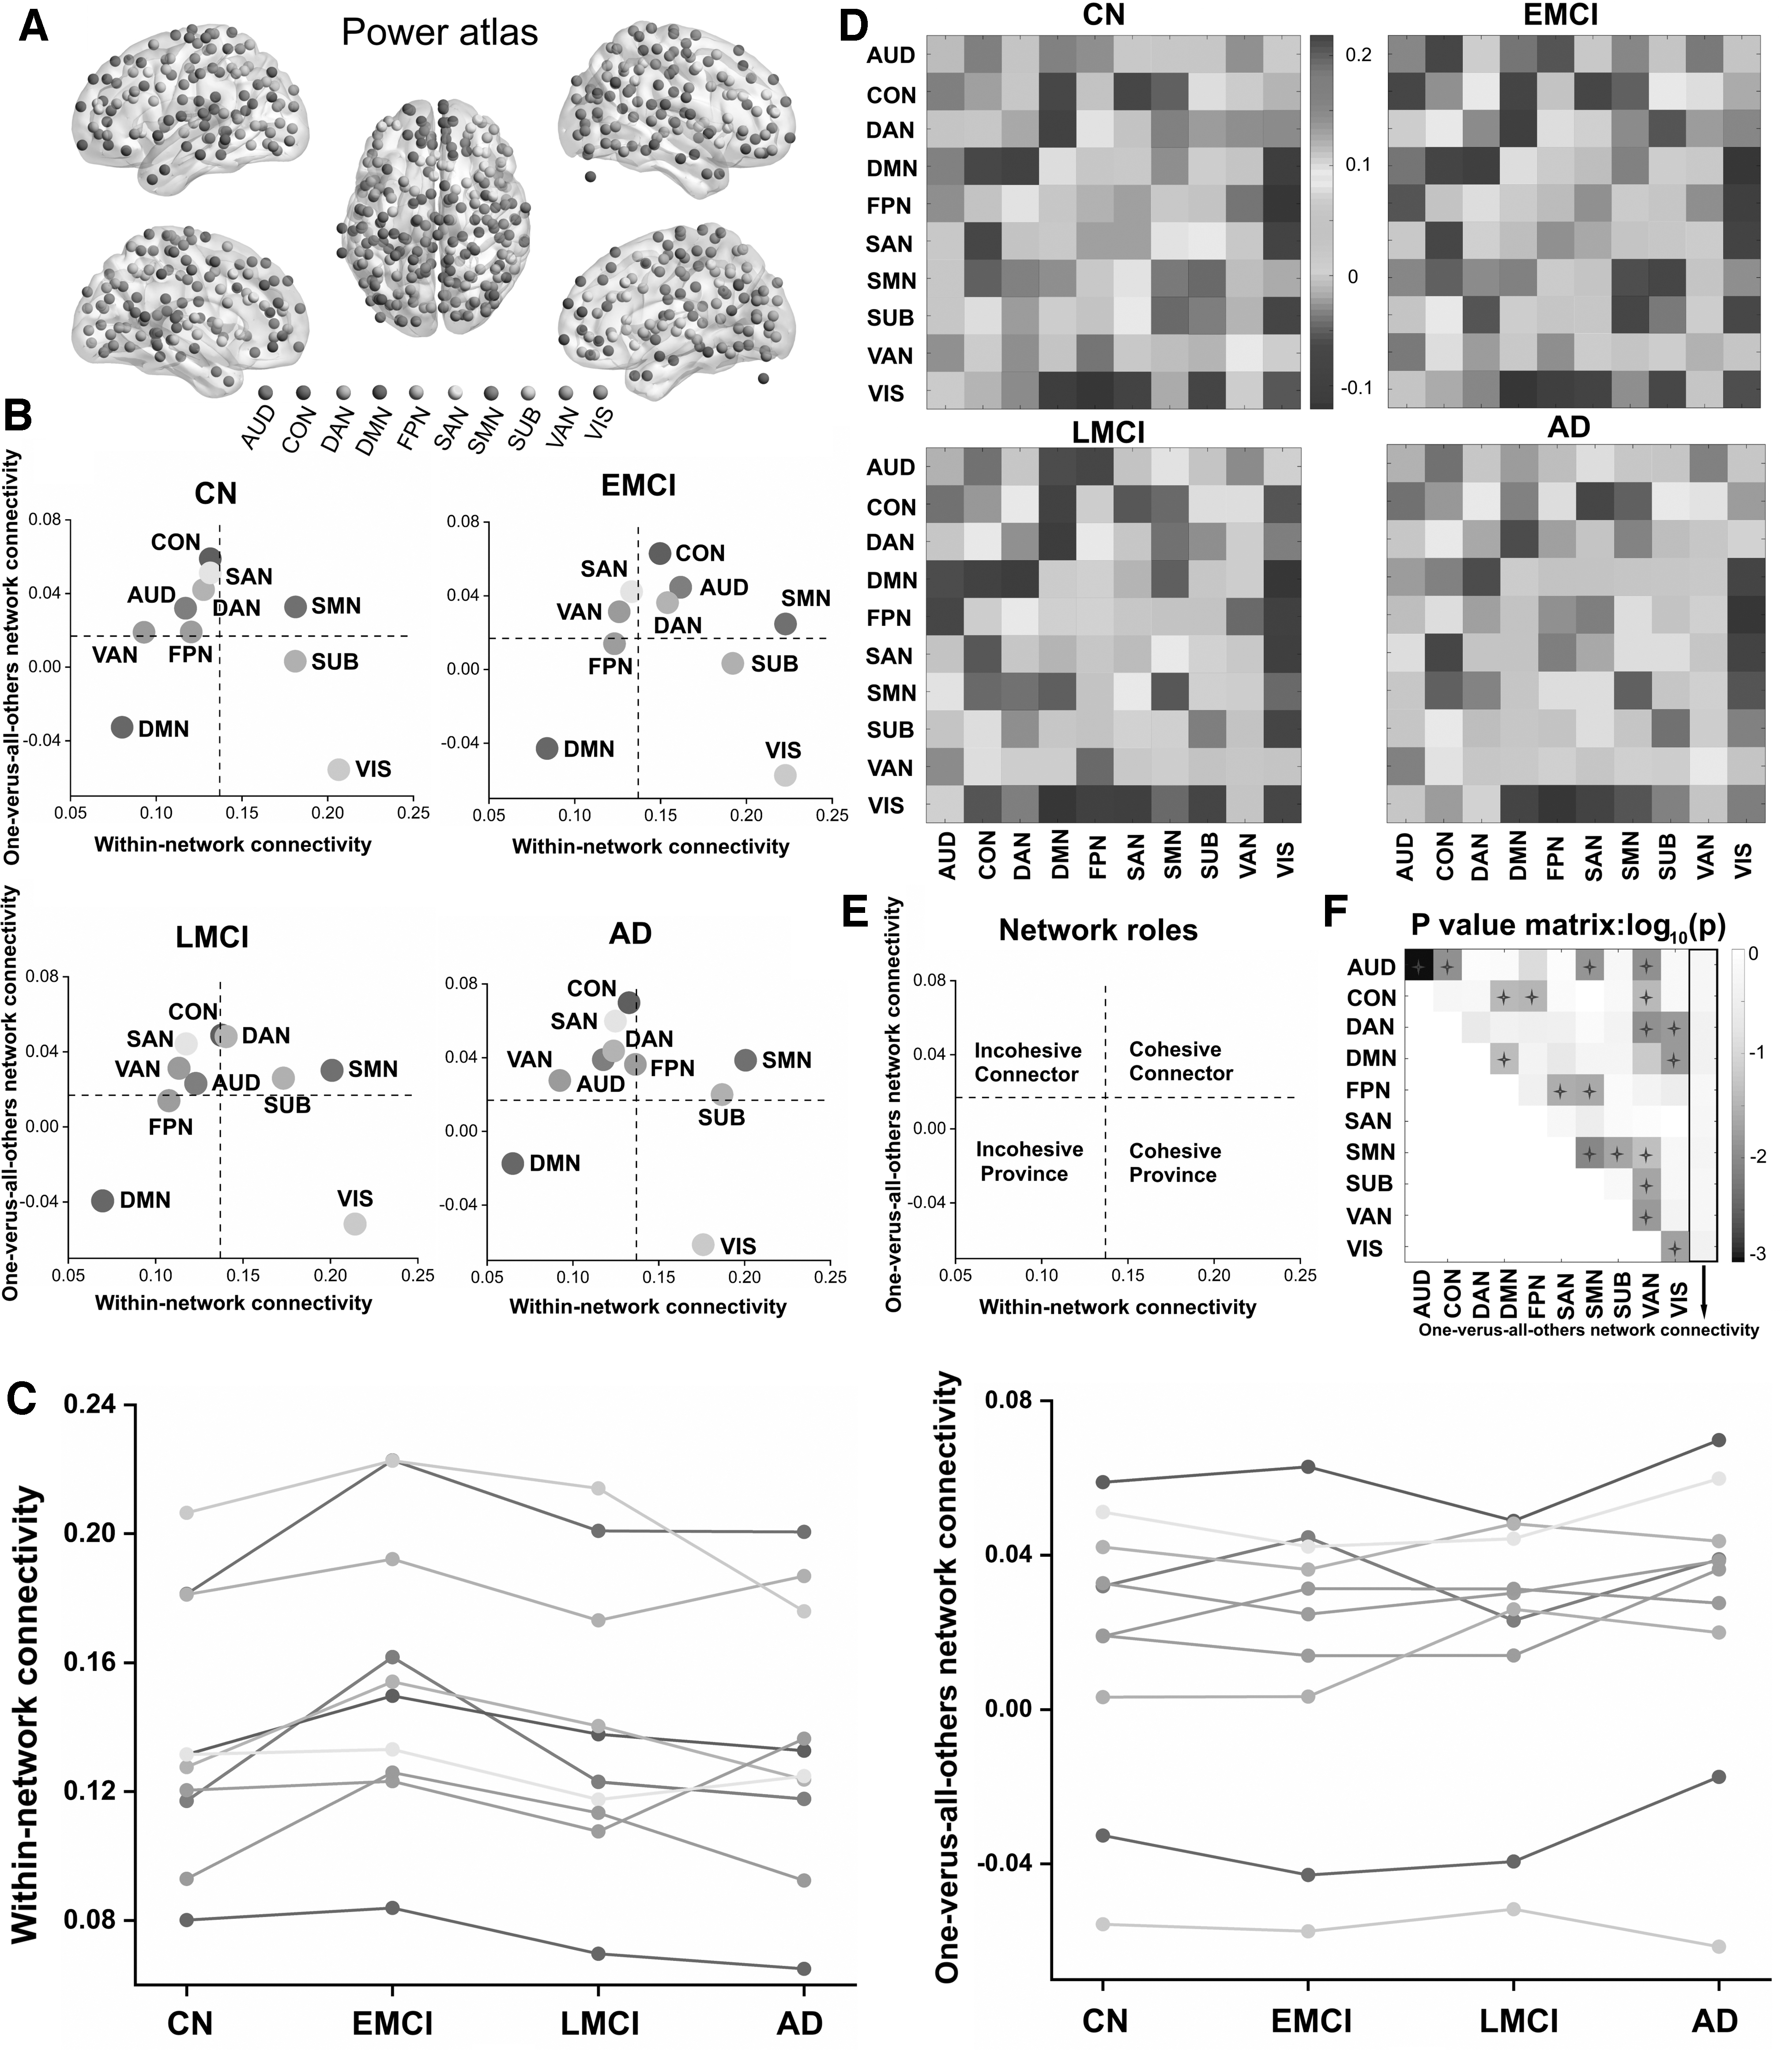
We used the atlas of Power et al. (2011) to partition the brain of each participant into 226 cortical and subcortical areas. Wavelet coherence was used to estimate the functional connectivity between all pairs of regions of interest across the AD disease spectrum, as previously shown (Gu et al., 2015; Zhang et al., 2016). Subsequently, network connectivity was calculated within 10 RSNs as defined by previous fMRI studies (Cole et al., 2013; Power et al., 2011). We also calculated network connectivity between all pairs of the 10 RSNs, as well as between each RSN and all other RSNs (i.e., one-vs.-all-others).
Construction of various gene scores
Genes can be classified into protective and risk genes according to whether their odds ratio (OR) value is greater than one (Ayers et al., 2016; Siezen et al., 2006). There are many ways to score genetic risk (Agerbo et al., 2015; Kuchenbaecker et al., 2017). Based on the available data, first, we multiplied the number of minor alleles of each risk gene by the corresponding OR value to obtain the risk score of a single gene. Then we added the corresponding risk scores of all genes of the individual to obtain the polygenic risk score (PRS). In a similar manner, the polygenic protection score (PPS) was calculated. The methods of calculation used in our article had been reported in other researches (Agerbo et al., 2015). Finally, we subtracted PRS and PPS to get a score, which we define as relative risk score (RRS). This is our original indicator, which can reflect the resilience of the individual's impact on genes.
Statistical analysis
Group comparisons of demographic characteristics and network metrics statistical comparisons across the disease spectrum were performed using a significance level of p < 0.05 for all tests. In addition, a one-way analysis of variance test was used to determine continuous variables. Post hoc analysis was used with the Bonferroni correction method. Chi-squared tests were also used for categorical variables. Notably, each network metric (e.g., within-, one-vs.-all-others-, and pairwise between-network connectivity) was compared across groups using a generalized linear model analysis adjusted for age, sex, education, and apolipoprotein E-epsilon 4 (APOE-ɛ4) allele number as covariates. All p-values were adjusted for multiple comparisons (i.e., 10 within-network metrics +10 one-vs.-all-others-network metrics +45 pairwise between-network metrics = 65 comparisons) by the false discovery rate correction. And we generated a 226 × 226 connectivity matrix for each subject. We tested for increases and decreases of network connections in patients compared with healthy controls using a two-sample t-test. Age, sex, education, and APOE-ɛ4 allele number were adjusted as covariates. The connections of network were considered significant if p-value was below a threshold of p = 0.05 (uncorrected). The network-based statistic analysis (NBS) method was used for multiple comparison correction. Each connection identified by the NBS satisfied p < 0.05. In addition, we investigated nonlinearity between CSF biomarker concentrations, as well as cognitive performance and gene data using curve fitting.
Moreover, CCA was used to link clinical, CSF, and gene data to the type of RSN connectivity in patients with AD. For this, there were four set of variables, including a set that included within- and pairwise between-network connectivity, a set that consisted of each patient's clinical cognitive performance, a set of variables that included Aβ-42, T-tau, and P-tau181 levels, and a set that consisted of each patient's PPS, PRS, and RRS scores. This CCA provided us with a set of modes that maximally correlated the network, clinical, CSF, and gene variables. Notably, for each CCA mode, we used a permutation testing procedure to evaluate the significance of the corresponding canonical correlation (Nichols, 2002; Smith et al., 2015). The p-values for the correlation of each CCA mode pair were explicitly corrected for multiple testing across all CCA mode pairs estimated (i.e., against the maximum correlation value) (Smith et al., 2015). More strictly, Bartlett's χ2 statistic (Dunlap et al., 2000) was performed to assess the significance of the full multivariate distribution. A CCA mode pair was considered to be significantly correlated only if both tests rejected the null hypothesis of no association at the level of p < 0.05. Given a significant CCA mode, we next assessed the Pearson's correlation between the CCA mode and the corresponding set of original variables of which it consisted. More specifically, we correlated the multivariate projection of the network variables with the original, univariate network variables. In a similar manner, we correlated the multivariate projection of the clinical cluster summaries with the individual clinical cluster summary. These tests helped quantify the contribution of the individual network's strength and clinical cluster summaries to the corresponding CCA mode(s). A detailed illustration of the CCA used in this study is provided in the Supplementary Data.
We also computed a Pearson's correlation between the value of the data in clinical, CSF, and gene variables and the first brain network CCA mode. Finally, the correlation coefficients were visualized using the radar plots in Figure 4.
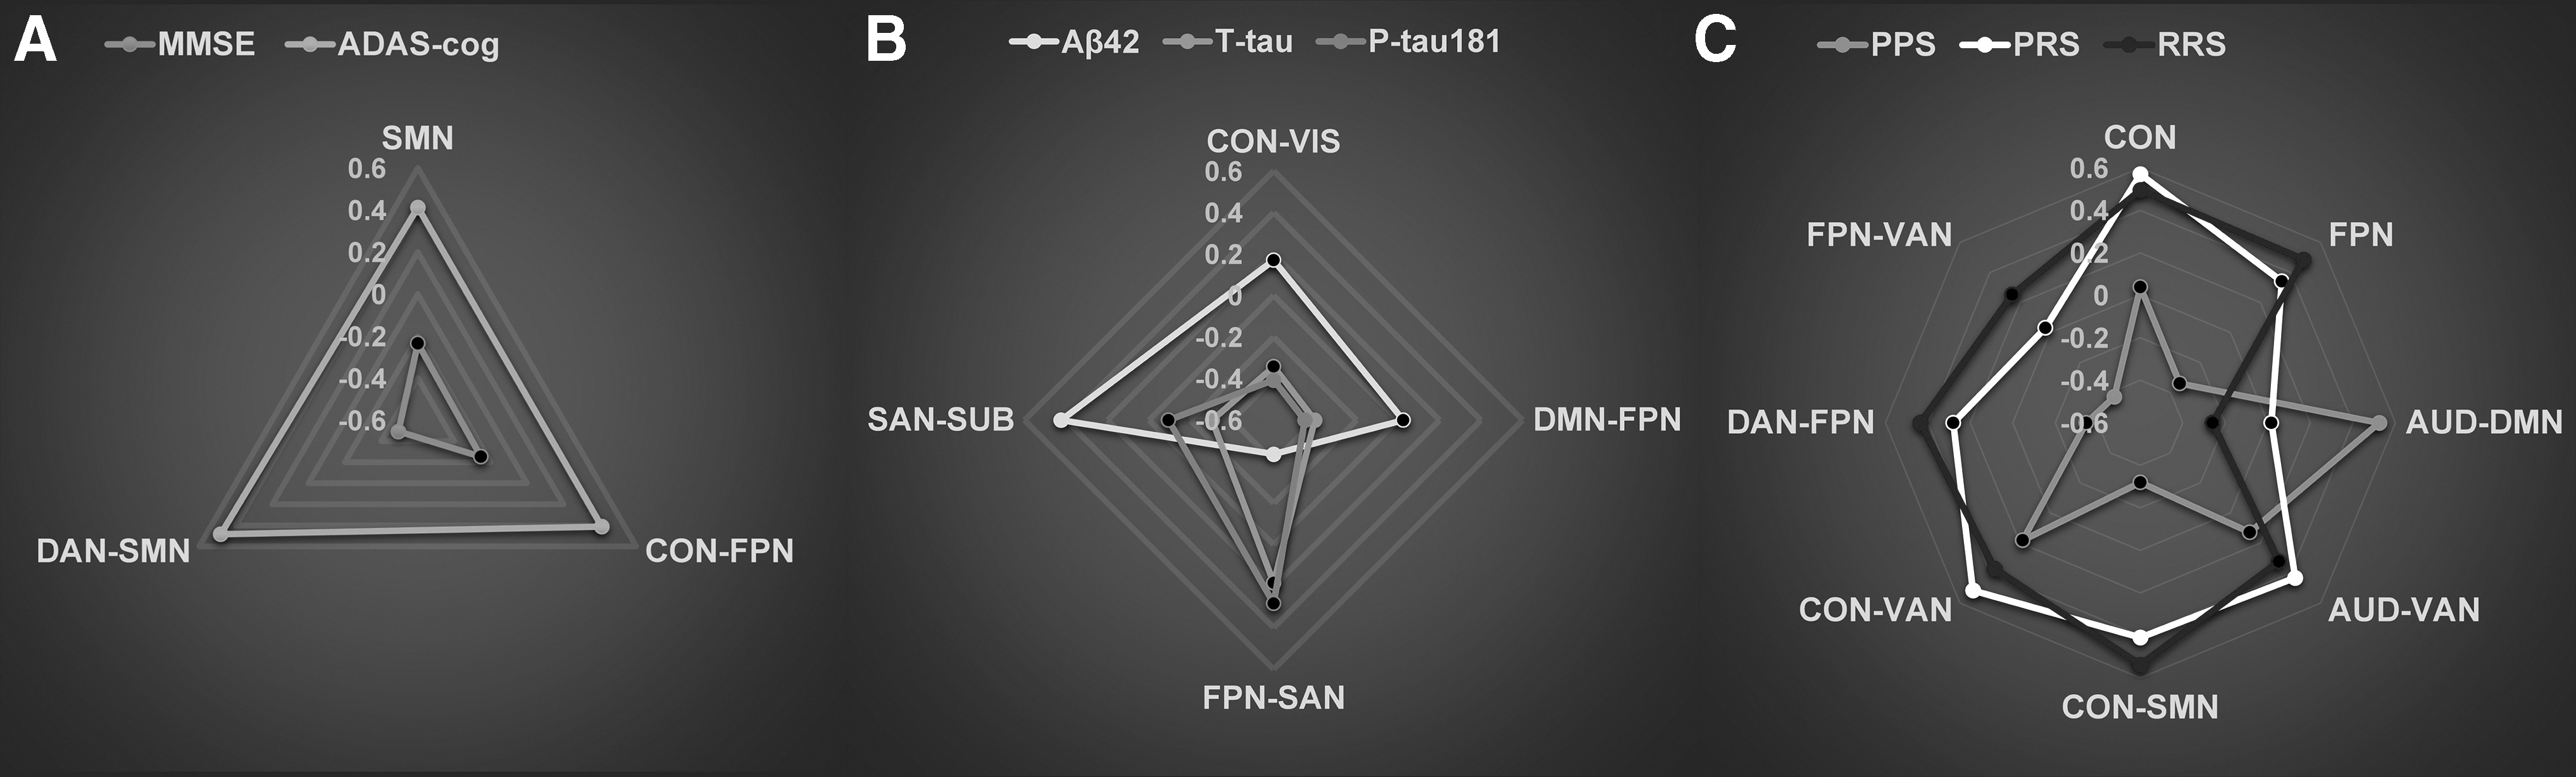
Relationships of brain networks, CSF biomarkers, genetic variants, and cognitive function in the AD spectrum. Radar plots showing patterns of association of specific network variables with clinical assessments
Data availability
The authors have carefully documented all data, methods, and materials used to conduct the research in this article and agreed to share anonymized data by request from any qualified investigator.
Results
Demographics and clinical characteristics of study subjects
The demographics and clinical characteristics of participants in our study are presented in Supplementary Table S1. Distributions of age, sex, and educational level did not differ significantly across the entire spectrum of the disease. In the whole cohort, significant differences were found in APOE-ɛ4 carriers', MMSE and ADAS-Cog scores, and in CSF biomarker levels across the AD spectrum. In addition, we observed nonlinear relationships between CSF biomarker concentrations and cognitive scores across the disease spectrum (Supplementary Fig. S1). In this study, we focused on the 10 well-established AD risk genes identified in our analyses (Supplementary Table S2). Here, 2 genes were represented by more than 1 single-nucleotide polymorphism, and our final number of variants was 12. The distribution of genotypes retained in the study is presented in Supplementary Table S3. Importantly, there were no statistically significant differences observed in the genotype distribution except for EPHA1 rs11767557 across the AD spectrum.
Network modeling
For our study, we identified 10 well-established, large-scale RSNs, which were derived from the Power atlas (Power et al., 2011) (Fig. 1A; Supplementary Table S4): the auditory network (AUD), the cingulo-opercular network (CON), the dorsal attention network (DAN), DMN, the frontoparietal network (FPN), the SAN, the sensory network (SMN), the subcortical network (SUB), the ventral attention network (VAN), and the VIS. To better understand how the functional roles of specific networks change during the course of a disease, we qualitatively characterized the average functional role of the 10 identified RSNs into a two-dimensional plane mapped out by their within- and between-network connectivity (Fig. 1B). According to our within- and between-network connectivity mean values, which are depicted by horizontal and vertical dotted lines in Figure 1E, all the RSNs from the four groups were concordantly classified into four network roles (Fig. 1B), as follows: the cohesive connector (SMN), the cohesive provincial (AUD), the incohesive connector (SAN and VAN), and the incohesive provincial (DMN), whereas the AUD, CON, DAN, FPN, and SUB connections showed divergent roles across the entire spectrum of the disease. Specifically, the AUD, CON, and DAN connections were found to be incohesive connectors, respectively, in the CN and AD groups, and the opposite was found in the EMCI and LMCI groups. Notably, the SUB connections were found to be associated with cohesive and provincial networks in the CN and EMCI groups, respectively, although in the LMCI and AD groups, it was found to act as a cohesive connector. Thus, to better observe dynamic changes in the roles of each network, we drew the mean values of within- and between-network connectivity into discounted forms (Fig. 1C), which revealed dynamic spatiotemporal patterns across the AD spectrum. Also, we presented the matrices of 10 RSNs (Fig. 1D) and tested the differences according to the means of within- and between-network connectivity across the AD spectrum (Fig. 1F). Particularly, the AUD connection showed significantly within-network connectivity differences. In addition, significant differences in all the network connectivity links were found in any two groups; see Supplementary Data for detailed information (Supplementary Figs. S2 and S3).
Node colors
Topologic properties of whole-brain networks belonging to the AD spectrum
We further explored the topologic properties of whole-brain networks across the AD spectrum. The four groups identified exhibited a typical feature of small-world topology over the entire range of sparsity (σ > 1). When the sparsity was 0.48, significant differences were represented in the global and local efficiency of the four groups. Notably, no significant group differences were observed when the clustering coefficient (Cp) and characteristic path length (Lp) over the entire range of sparsity were analyzed (Supplementary Fig. S4). Moreover, regarding nodal characteristics, the differences among the disease spectrum of nodal efficiency, nodal betweenness centrality, and the degree of centrality were tested at the sparsity of 0.48. As illustrated in Supplementary Figure S5, there were significant group differences of nodal efficiency (p = 0.003), nodal betweenness (p = 0.019) centrality, and degree centrality (p = 0.003) in the AD spectrum. Interestingly, the observed differences of those characteristics were mainly located in the DMN, FPN, and SMN connections, while the nodal characteristics of ROI161, which belongs to FPN, were used to draw the violin chart. The statistically significant correlations were found between cognitive performances, CSF biomarkers, gene scores and network parameters (Supplementary Fig. S6).
Correlation patterns of network connectivity across the AD spectrum
Next, we performed a two-step CCA to link brain network connectivity measures with two clinical surveys and correlate CSF biomarkers in patients with AD. First, in an effort to understand the composition of the first clinical CCA mode, we tested each of the two clinical variables for univariate correlations. Here, we found that the first clinical CCA mode was highly correlated with the subject's MMSE (r = 0.77, p < 0.0001) and ADAS-cog (r = 0.77, p < 0.0001) scores (Fig. 2A). Similarly, we detected that the first CSF CCA mode was highly correlated with the levels of T-tau (r = 0.74, p < 0.0001) and P-tau181 (r = 0.72, p < 0.0001) and moderately correlated with Aβ42 (r = 0.51, p = 0.0002) (Fig. 2B). As shown in Figure 2C, the first network CCA mode was significantly correlated with 54 of the 55 original network variables, except the between-network connectivity of the SUB-VAN network pair. Notably, the first pair of network and clinical variate CCA modes were significantly correlated (Fig. 2D; canonical correlation: r = 0.97, p < 0.0001), and the correlation of the first pair of network and CSF variate CCA modes was found to be statistically significant (Fig. 2E, canonical correlation: r = 0.99, p < 0.0001). Detailed information for these correlation coefficients (r) and p-values are described in Supplementary Table S5.

Correlations and their significance between the following:
Risk genetic variation accumulating effects on network connectivity, biomarkers, and cognitive performances across the AD spectrum
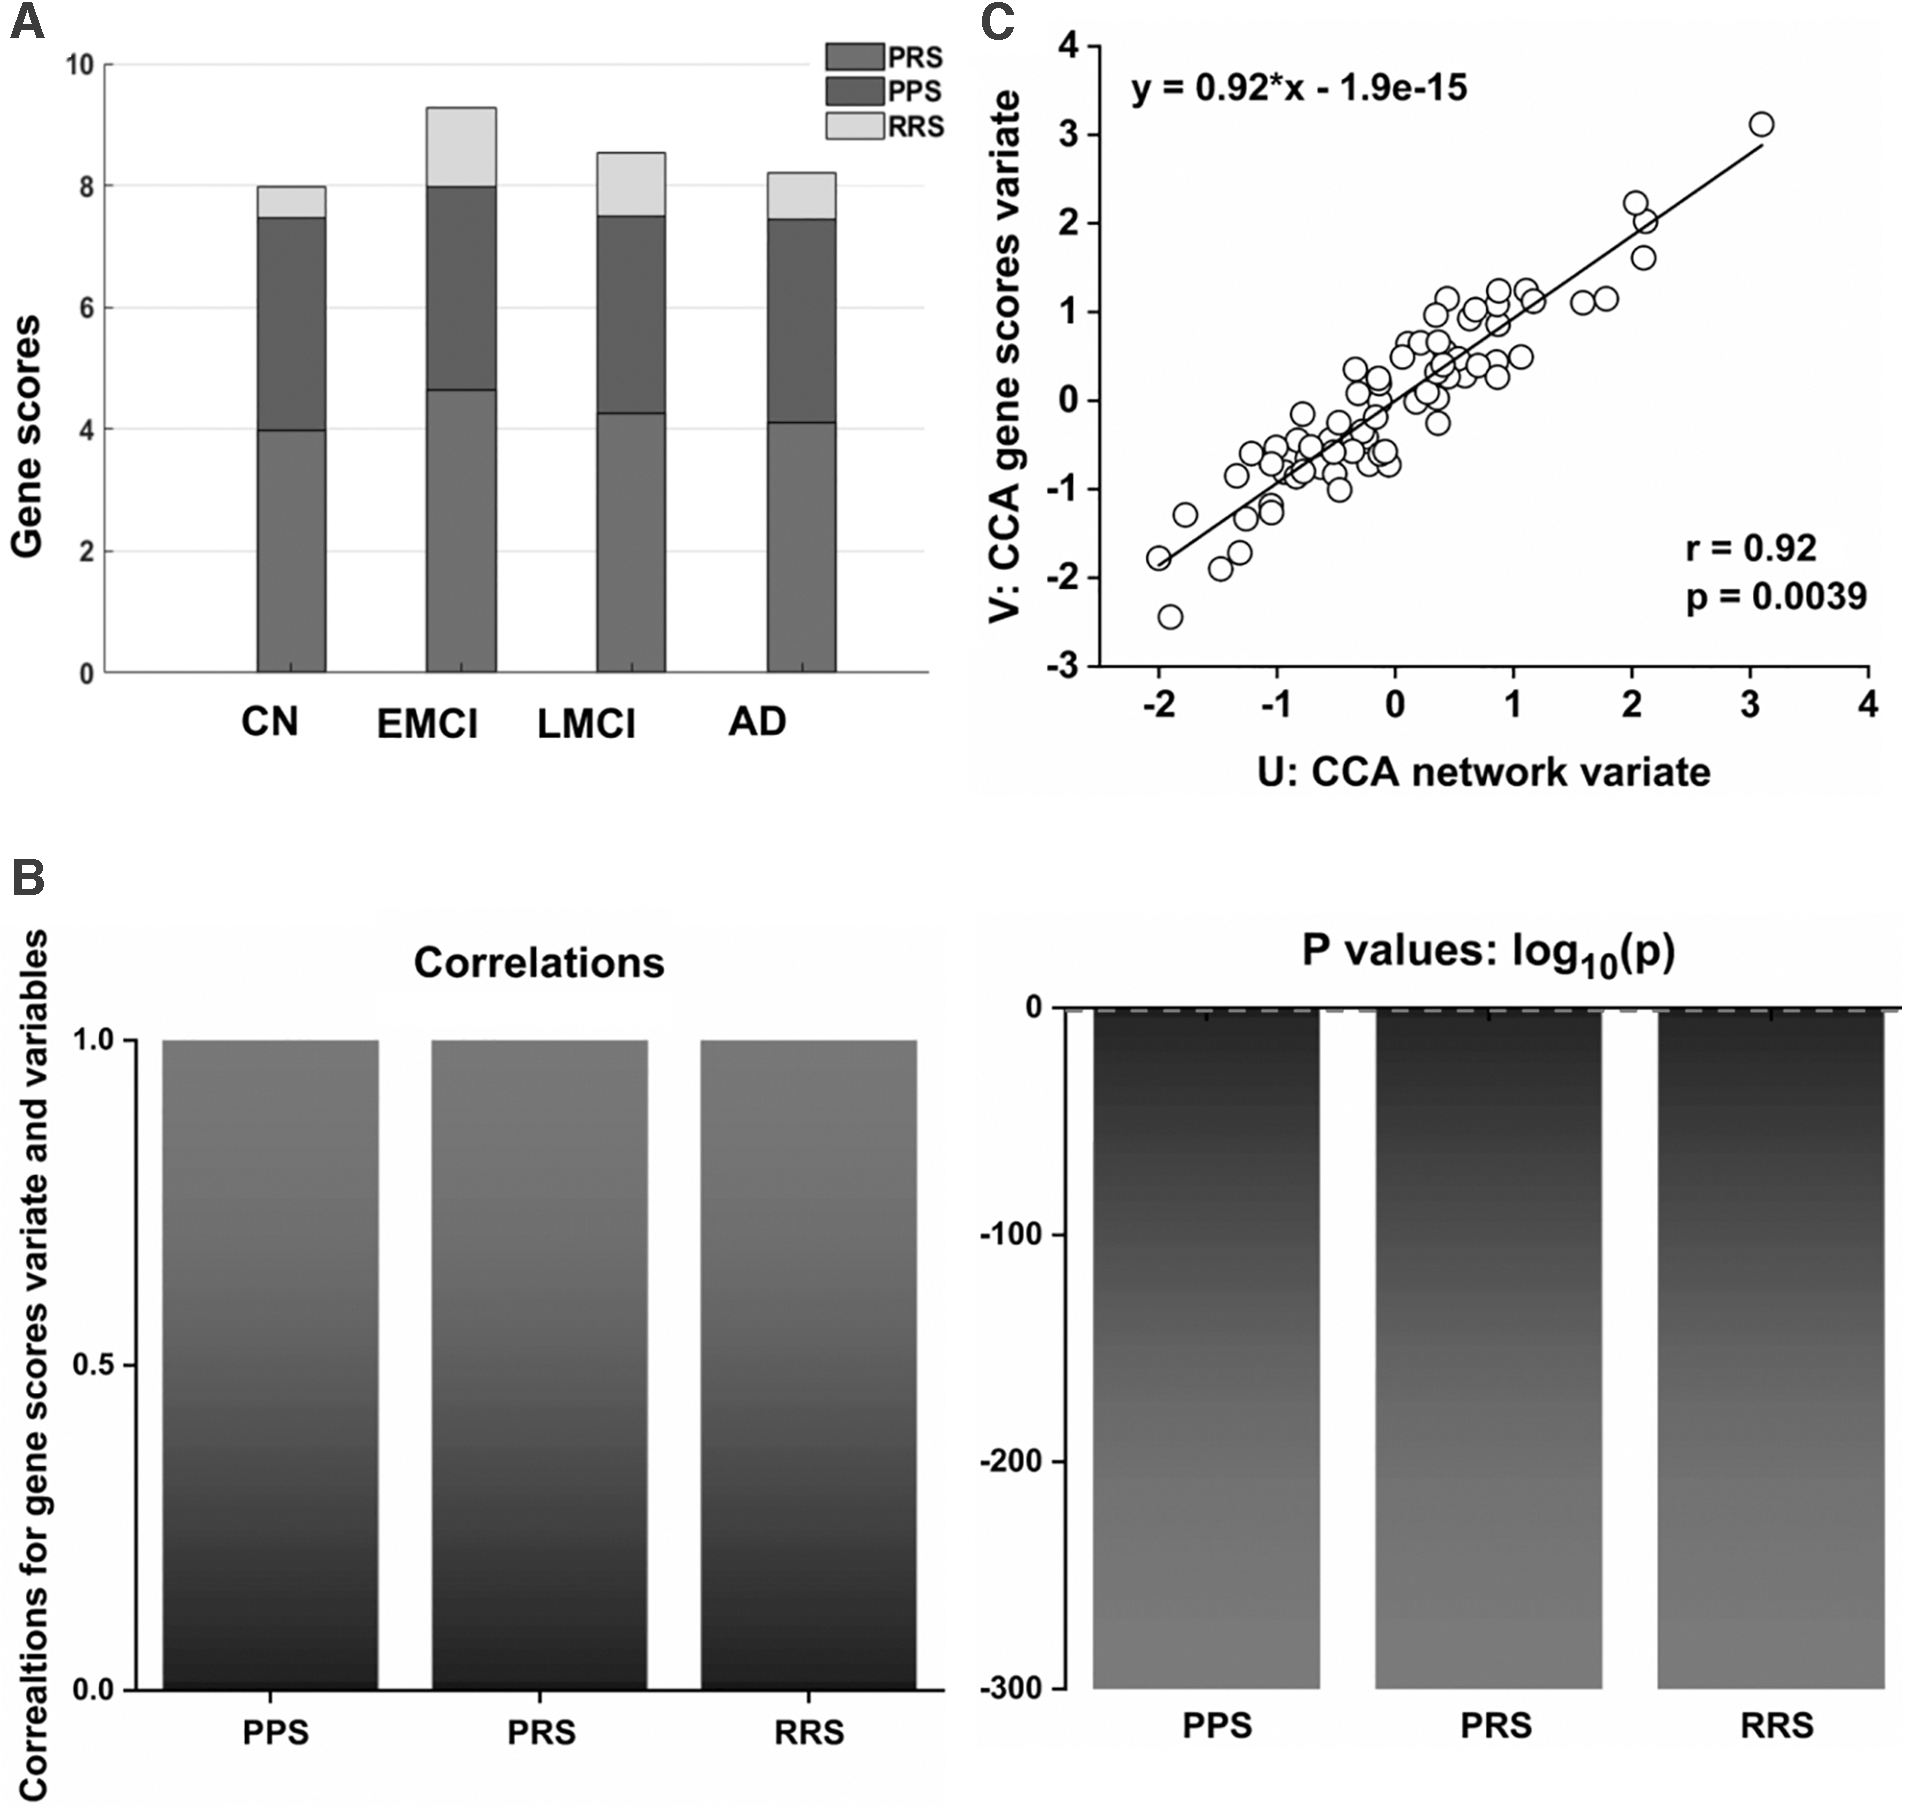
To investigate whether genetic variations were associated with the mechanisms underlying the dynamic changes observed in the network, we analyzed the accumulating effects of 10 well-established AD risk genes on network connectivity using the CCA approach. For this, we divided these 10 genes into two groups according to their OR values, where genes with OR values of less than 1 were classified as protective genes, and genes with OR values greater than 1 were classified as risk genes (Supplementary Table S2). Then, to obtain the PRS, we multiplied the minor allele number of all the risk genes of each subject by the corresponding OR values and added them together. In a similar manner, the PPS was estimated. Here, the PRS minus the PPS was defined as RRS. Notably, there were no significant group differences in PPS, PRS, and RRS in the AD spectrum (Fig. 3A), and no statistically significant correlations were found between CSF biomarkers and the three gene scores (Supplementary Fig. S7). Interestingly, we tested univariate correlations for each of the three gene variables to better understand the composition of the first gene CCA mode, and identified that the first clinical CCA mode was highly correlated with the PPS (r = 1, p < 0.0001), PRS (r = 1, p < 0.0001), and RRS (r = 1, p < 0.0001) values (Fig. 3B). Particularly, the first pair of network and gene variate CCA modes were statistically significant (Fig. 3C; canonical correlation: r = 0.92, p = 0.0039). Detailed information for these correlation coefficients (r) and p-values are described in Supplementary Table S6.
Accumulating effects of ten genetic variations on the network connectivity across the AD spectrum.
Associations with network connectivity, CSF biomarkers, gene scores, and cognition performances across the AD spectrum
Our analysis identified a single significant CCA mode that presented patterns of brain network connectivity that were correlated with patterns of cognitive function, CSF biomarkers, and genetic variants. Nevertheless, the networks that are specifically related to cognition scores, CSF biomarkers, and gene scores are still unknown. Therefore, we performed a post hoc Pearson's correlation analysis to determine the direction and magnitude of the associations between the first network CCA mode with cognition and gene scores, as well as CSF biomarkers. In our analysis, we found that MMSE scores were mostly associated with a decrease in connectivity between the DAN and SMN connections. Particularly, the ADAS-cog scores were mostly associated with an increase in connectivity between the DAN and the SMN, the CON and the FPN, as well as within the SMN connectivity (Fig. 4A). In addition, Aβ42 levels were found to be associated with an increase in connectivity between the SAN and SUB connections, and negatively associated with the network connectivity between the FPN and SAN connections. T-tau levels were also associated with an increase in connectivity between the FPN and SAN connections. Notably, T-tau and P-tau181 were both negatively associated with network connectivity between the SAN and SUB, as well as between the DMN and FPN connections (Fig. 4B). Furthermore, PPS was found to be associated with an increase in connectivity between the AUD and DMN connection, and negatively associated with network connectivity between the DAN and FPN connections, while PRS and RRS were found to be mostly, positively correlated with network connectivity between the CON and VAN and the CON and SMN connections, as well as within-CON connectivity, respectively (Fig. 4C). Detailed information for these correlation coefficients (r) and p-values are described in Supplementary Table S7.
Discussion
To the best of our knowledge, this is the first study to integrate large-scale network analysis with CCA approaches to identify differential changes of brain networks in the AD spectrum. These changes range from normal cognition to dementia, and this study aimed to investigate the trajectory of spatiotemporal evolution dynamics and potential relationships among brain networks, pathological biomarkers, genetic variants, and cognitive performances in the AD spectrum.
Dynamic spatiotemporal patterns of large-scale brain networks in the AD spectrum
Consistent with our hypothesis, we identified distinctive patterns of RSNs, along with DMN, which represent dynamic changes of within- and between networks along with disease progression, suggesting that the differential spatiotemporal patterns of AD-related networks are associated with different pathological stages of the AD spectrum. Previously, neuroimaging studies constantly reported that the widespread DMN disruption in the frontal-posterior areas and hippocampus of the brain (emerged as a result of prominent atrophy and abnormal metabolism in core regions of AD-related networks) indicated the differential DMN trajectories in the prodromal (i.e., pre-clinical) AD stage, as well as in asymptomatic individuals at risk for AD (Chiesa et al., 2019). Given the relative dependence of large-scale brain networks, multiple brain networks associated with AD-related changes beyond the DMN subsystems have been investigated (Agosta et al., 2012; Brier et al., 2012; Lehmann et al., 2015). According to these studies, although distinctive network changes were found, the interchanges of brain networks in pre-clinical and asymptomatic AD patients were not further investigated. Nonetheless, it is intriguing that until recently, few studies began to explore the spatial and temporal patterns of brain networks following disease progression in the human brain. These new observations initially revealed that specific networks, consisting of those preferably selected in vulnerable brain regions, especially in the posterior, frontal, and prefrontal cortices, as well as in the medial temporal lobe, represented discrepancy in spatial and temporal network patterns at the large-scale network level (Brier et al., 2014; Chen et al., 2011; Zhu et al., 2016). Currently, we have identified dynamic changes within specific brain networks in normal and AD patients. Importantly, based on dynamic trends between networks, we found that a network disruption was not sustained, but instead represented a bouncing mode or resilience from a normal to an AD brain. Specifically, in the early stage of EMCI, all RSNs represented an increased trend within network connectivity by enhancing inner cohesive ability. Notably, only 3 out of 10 RSNs were characterized by an increased connectivity between networks, which indicated a heightened connector ability among networks. For example, the inner cohesive ability of the CON connection named the cingulo-opercula network, which is primarily responsible for the process of cognitive function (Dosenbach et al., 2008; Fair et al., 2007), maintains the relative slightly increased state from CN to EMCI, then moves toward a lower level in the LMCI stage, and ultimately significantly increases in the AD stage. Actually, these interchanges between brain networks reveal the dynamic changes of inner cohesive ability and the reflected flexible reorganization of RSNs (Mohr et al., 2016). Correspondingly, these spatiotemporal sequential alterations at the large-scale network level might support the view that inner cohesive abilities within networks and connectors synergistically contribute to the dynamic reorganization of brain RSNs, which may be induced by age-related mechanisms and/or AD-related pathological progression (Palop and Mucke, 2016).
Network connectivity, molecular biomarkers, genetic variants, and cognitive performance in the AD spectrum
Importantly, characterizing and quantifying the relationship between network connectivity and molecular biomarkers are beneficial to elucidate the differential spatiotemporal pattern of AD pathophysiology at the systems level. In addition, in the current study, researchers have focused on the investigation of neural correlates of network connectivity associated with the molecular pathology and risk factors affecting brain network features. It was also recently conceptualized that network connectivity, as a candidate intermediate biomarker, can bridge the neural links of upstream effects with molecular determinants of neurodegeneration and susceptibility genes, and downstream effects with clinical phenotypes (Pievani et al., 2014). Recently, a cascading network failure model of AD was also proposed (Jones et al., 2017), which argued that a DMN subsystem disruption was ascribed to tau-related elevated distribution and then triggered widespread compensatory rearrangements of those selected vulnerable brain regions that were previously associated with amyloidosis (Jones et al., 2016). Recent studies have shown that CCA, a powerful multivariate approach that seeks to identify clusters of maximal correlation between two groups of variables, can detect associations between structural or functional connectivity and behavioral measures (Power et al., 2011; Smith et al., 2015). By using this method, we demonstrated that the large-scale brain network abnormality observed was significantly correlated with molecular biomarkers and phenotypic variations belonging to the AD spectrum beyond DMN subsystems. This original network alteration may have, initially, reproduced the observed spatiotemporal pattern discrepancies, which account for a proposed molecular pathophysiological mechanism at the distributed network level. More importantly, brain hubs presenting high connectivity were also found to have more Aβ deposition, while converging evidence from molecular, AD-related animal models, in vivo microdialysis, and other electrophysiological studies has also shown that disrupted synaptic activity and plasticity relating to network activity can be associated with Aβ deposition (Ingelsson et al., 2004; Jagust and Mormino, 2011). As such, widespread changes of large-scale brain networks may be ascribed to the process of Aβ or tau pathophysiology (Buckner et al., 2009; Jones et al., 2017). In addition, previous AD-related network studies have shown that network activities supporting cognition are altered decades before the expected onset of clinical signs and symptoms of AD, highlighting the fact that affected networks could predict future pathology and brain atrophy (Palop and Mucke, 2016). Thus, large-scale brain networks might primarily bridge the natural links between molecular biomarkers and clinical phenotypic variants across the AD spectrum.
Moreover, it has been also demonstrated that different neural dynamics are detectable and associated with carriers of several gene mutations, which are primarily involved in the pathophysiology of LOAD (Zhang et al., 2013). These susceptible genetic variants may modulate regional spontaneous brain activity, structural and functional integrity of brain network, and may be related to the progression of the AD spectrum (Chen et al., 2015; Wang et al., 2013). Our group has also reported that dynamic changes in the DMN system are driven by the APOE-ɛ4 genotype, as well as by the intrinsic DMN connectivity, which moderates the effect of the APOE genotype on cognition and provides a pathological stage-dependent neuroimaging biomarker for early differentiation of the AD spectrum (Zhu et al., 2019). Currently, by using the CCA approach, we further identified the accumulating effects of 10 top risk genetic variants on large-scale brain network disruption, although not on the molecular biomarkers or clinical phenotypes across the AD spectrum. That is, the emergent risk of genomic contributions accumulated that would subsequently lead to network integrity disruption, without mounting up to impair molecular biomarkers or cognitive function of the AD spectrum. Importantly, these findings may shed light on the molecular neurobiology of network disruption and ultimately clarify the pathophysiology of neurodegenerative diseases, such as AD. Three limitations about this study should be noted. First, the relatively small sample size, cross-sectional studies may limit the generality of our findings. Second, recently, several studies have reported that the CSF p-Tau/Tau ratio is robust and probably early biomarkers for neurodegenerative disease, including sporadic Creutzfeldt–Jakob disease and AD (Foucault-Fruchard et al., 2020). We also made correlation analysis of the T-tau/P-tau181 ratio of each group and network topology properties, respectively. The results show that only the network properties of two nodes and T-tau/P-tau181 ratio are correlated in the LMCI group, indicating that the T-tau/P-tau181 ratio may have a greater potential value for diagnosing AD, but it may be less relevant to those topological properties of the brain functional network. These results may be influenced at least, in part, by the small size of our cohort, or insufficient calculation of network topology property indicators. In the future, we will conduct a more comprehensive study on the relationship between CSF biomarkers and topological properties. Third, multimodal neuroimaging approaches integrated with bioinformatics should be implemented, mainly to provide direct evidence on the molecular basis of neural network dynamic patterns of reorganization and associations with clinical phenotypes, as well as to potentially classify whether dynamic network alteration is ascribed to compensatory or adaptive strategies from the trajectories of molecular pathways.
Conclusion
We demonstrated that the dynamic patterns of multiple network alterations were associated with molecular biomarkers, clinical phenotypes, and accumulating effects of 10 top risk genetic variants across the AD spectrum. Moreover, our findings strongly implicate large-scale brain network alterations with the pathophysiology of Aβ and tau, which result in the typical clinical phenotypic variants of AD. Future studies that combine task fMRI and diffusion MRI data are valuable to investigate initial relationships among brain network changes, molecular biomarkers, and clinical phenotypes across the AD spectrum. That would extend our insight into the pathologies of neuropsychiatric disorders, and in turn enable a better understanding of the biological meaning of the diverse functional connections of different brain networks.
Footnotes
Authors' Contributions
All authors have made substantial intellectual contributions to this article in one or more of the following areas: design or conceptualization of the study, analysis or interpretation of the data, or drafting or revision of the article. Dr. Xie and Prof. Zhang designed this study, and Ms. Wang and Dr. He conducted the data preparation and statistical analysis. Dr. Xie and Dr. Wang guided the data analysis. All authors have given the final approval for this article.
Acknowledgments
The authors would like to thank Alzheimer's Disease Neuroimaging Initiative (ADNI) for data collection and sharing for this project.
Author Disclosure Statement
No competing financial interests exist.
Funding Information
This research was supported by the National Key Projects for Research and Development Program of China [2016YFC1305800, 2016YFC1305802, CMX]; the National Natural Science Foundation of China [81671256, 81871069, 82071204, CMX]; the Key Project for Research and Development Program of Jiangsu Province [BE2018741]; the Nanjing International Joint Research and Development Project [201715013]; and the Key Projects of Jiangsu Commission of Health [ZDB2020008].
Supplementary Material
Supplementary Data
Supplementary Figure S1
Supplementary Figure S2
Supplementary Figure S3
Supplementary Figure S4
Supplementary Figure S5
Supplementary Figure S6
Supplementary Figure S7
Supplementary Table S1
Supplementary Table S2
Supplementary Table S3
Supplementary Table S4
Supplementary Table S5
Supplementary Table S6
Supplementary Table S7
References
Supplementary Material
Please find the following supplemental material available below.
For Open Access articles published under a Creative Commons License, all supplemental material carries the same license as the article it is associated with.
For non-Open Access articles published, all supplemental material carries a non-exclusive license, and permission requests for re-use of supplemental material or any part of supplemental material shall be sent directly to the copyright owner as specified in the copyright notice associated with the article.