
Abstract
Background:
Traumatic brain injury (TBI) is often associated with cardiac dysfunction, which is a consequence of the brain–heart cross talk. The subendocardial viability ratio (SEVR) is an estimate of myocardial perfusion. The aim of this study was to analyze changes in the SEVR in patients with severe TBI without previous cardiac diseases.
Methods:
Adult patients treated for severe TBI with a Glasgow coma score <8 were studied. Pressure waveforms were obtained by a high-fidelity tonometer in the radial artery for SEVR calculation at five time points: immediately after admission to the intensive care unit and 24, 48, 72, and 96 h after admission. SEVRs and other clinically important parameters were analyzed in patients who survived and did not survive after 28 days of treatment, as well as in patients who underwent decompressive craniectomy (DC).
Results:
A total of 64 patients (16 females and 48 males) aged 18–64 years were included. Fifty patients survived and 14 died. DC was performed in 23 patients. SEVRs decreased 24 h after admission in nonsurvivors (p < 0.05) and after 48 h in survivors (p < 0.01) and its values were significantly lower in nonsurvivors than in survivors at 24, 72, and 96 h from admission (p < 0.05). The SEVR increased following DC (p < 0.05).
Conclusions:
A decreased SEVR is observed in TBI patients. Surgical decompression increases the SEVR, indicating improvement in coronary microvascular perfusion. The results of our study seem to confirm that brain injury affects myocardium function.
Impact statement
Traumatic brain injury (TBI) is commonly associated with cardiac disorders, a consequence of the well-known brain–heart interaction. The pathophysiological mechanisms of cardiac dysfunction following TBI are still not completely elucidated. The present article documents the occurrence of disorders in the subendocardial viability ratio (SEVR), reflecting myocardial perfusion in patients treated for TBI. Importantly, changes in SEVRs have never been studied in patients with severe TBI. Impaired myocardial perfusion may be an essential risk factor for TBI-related cardiac dysfunction. However, further studies are warranted to confirm the relationship between brain trauma and heart dysfunction.
Introduction
Traumatic brain injury (TBI) is the most frequent cause of morbidity and mortality in all populations of trauma patients (Hasanin et al., 2016; Hyder et al., 2007; Murray and Lopez, 1997). TBI can be a cause of death per se; however, it is often associated with other systemic complications, including cardiac dysfunction (Dabrowski et al., 2018; El-Menyar et al., 2017; Hyder et al., 2007; Venkata and Kasal, 2018). TBI-related cardiological pathologies are commonly known as the consequences of the brain–heart cross talk and include electrocardiographic (ECG) and hemodynamic dysfunctions, as well as pathologic changes of the myocardium (Dabrowski et al., 2018; El-Menyar et al., 2017; Kenigsberg et al., 2019; Nguyen and Zaroff, 2009). The underlying pathophysiology of the brain–heart interaction is complex, multifactorial, and not fully understood.
The subendocardial viability ratio (SEVR) is defined as the diastolic to systolic pressure–time integral ratio, which has been recognized as an index of myocardial oxygen supply and demand (Aslanger et al., 2017; Hoffman and Buckberg, 1975; Tsiachris et al., 2012). Physiologically, it ranges between 130% and 200% (Supplementary Material S1). The SEVR has been considered a noninvasive method for estimation of myocardial perfusion and prognostic values for cardiovascular disorders (Anyfanti et al., 2019); a value <130% is an independent and reliable predictor of fatal cardiovascular events (Ekart et al., 2019; Poleszczuk et al., 2018).
The aim of this study was to analyze changes in the SEVR in patients with severe TBI without previous cardiac diseases. We also analyzed the relationships between changes in the SEVR and 28-day mortality.
Methods
This prospective observational study was conducted in accordance with the Declaration of Helsinki and applicable regulatory requirements after approval by the Institutional Review Board and the Bioethics Committee of Medical University at Lublin, Poland (KE-0254/26/2019 received May 30, 2019). Informed consent was obtained from patients' legal representatives as all enrolled patients were unconscious or/and sedated at the moment of inclusion in the study.
Patient selection
The enrollment of patients was conducted using a similar protocol as previously described (Dabrowski et al., 2018). In brief, adult patients treated for severe isolated TBI (classified according to the Glasgow coma score [GCS] <8, assessed just after admission to the hospital) were included in the study. Pregnant women, patients aged below 18 years, and patients with a preinjury history of any cardiovascular disease, chronic kidney, endocrine, metabolic, pulmonary, or hepatorenal diseases, as well as drug-intoxicated patients and prior transplant recipients, were excluded.
For the entire duration of the intensive care unit (ICU) stay, relevant demographic, clinical, and laboratory data along with daily assessment of fluid balance, the sepsis-related organ failure assessment score, and advanced hemodynamic monitoring variables (obtained with EV1000; Edwards Lifesciences, Irvine, CA) were registered in an electronic database, as well as data on mortality at day 28. Severity of illness on ICU admission was described by the acute physiology and chronic health evaluation (APACHE) II score and injury severity score. All patients underwent ECG after administration.
Patient monitoring and management
Arterial blood pressure and heart rate were continuously measured. Additionally, hemodynamic variables such as cardiac output/index (CO/CI), stroke volume variation (SVV), systemic vascular resistance index (SVRI), and central venous pressure (CVP) were monitored using the EV1000 platform. The Masimo Root monitor (USA) with SEDLine was used for continuous measurement of regional cerebral oxygen saturation (SrO2), fronto-temporal electroencephalography, peripheral saturation with hemoglobin level, and pleth variability index. The hyperosmotic therapy included intravenous administration of 15% mannitol at a dose of 1.5 g/kg body weight. This treatment was discontinued in patients with osmolality higher than 320 mOsm/kg H2O. Blood potassium concentration was measured five times per day and corrected using continuous infusion. Fluid administration and vasopressors (norepinephrine) were titrated to obtain SrO2 higher than 50% and mean arterial pressure higher than 80 mmHg.
SEVR measurement and studied time points
The pressure waveforms were obtained from the radial artery by a high-fidelity tonometer (SphygmoCor, PWA System, AtCor Medical, West Ryde, Australia) at five time points: (1) immediately after admission to the ICU (baseline); (2) 24 h after admission; (3) 48 h after admission; (4) 72 h after admission; and (5) 96 h after admission. The tonometer was repositioned until the strongest pulse signal was identified. Systolic and diastolic time integrals were assessed as the area under the systolic and diastolic parts of the pressure curve, respectively (Fig. 1). Each measurement was performed twice and the recording of higher quality, defined and calculated by SphygmoCor software as the operator index, was taken for analysis. Measurements with an operator index below 80 were not analyzed. The SEVR was calculated by SphygmoCor software as the division of diastolic per systolic time integrals. The results were compared with the baseline value and analyzed in accordance with 28-day mortality (Appendix A1).
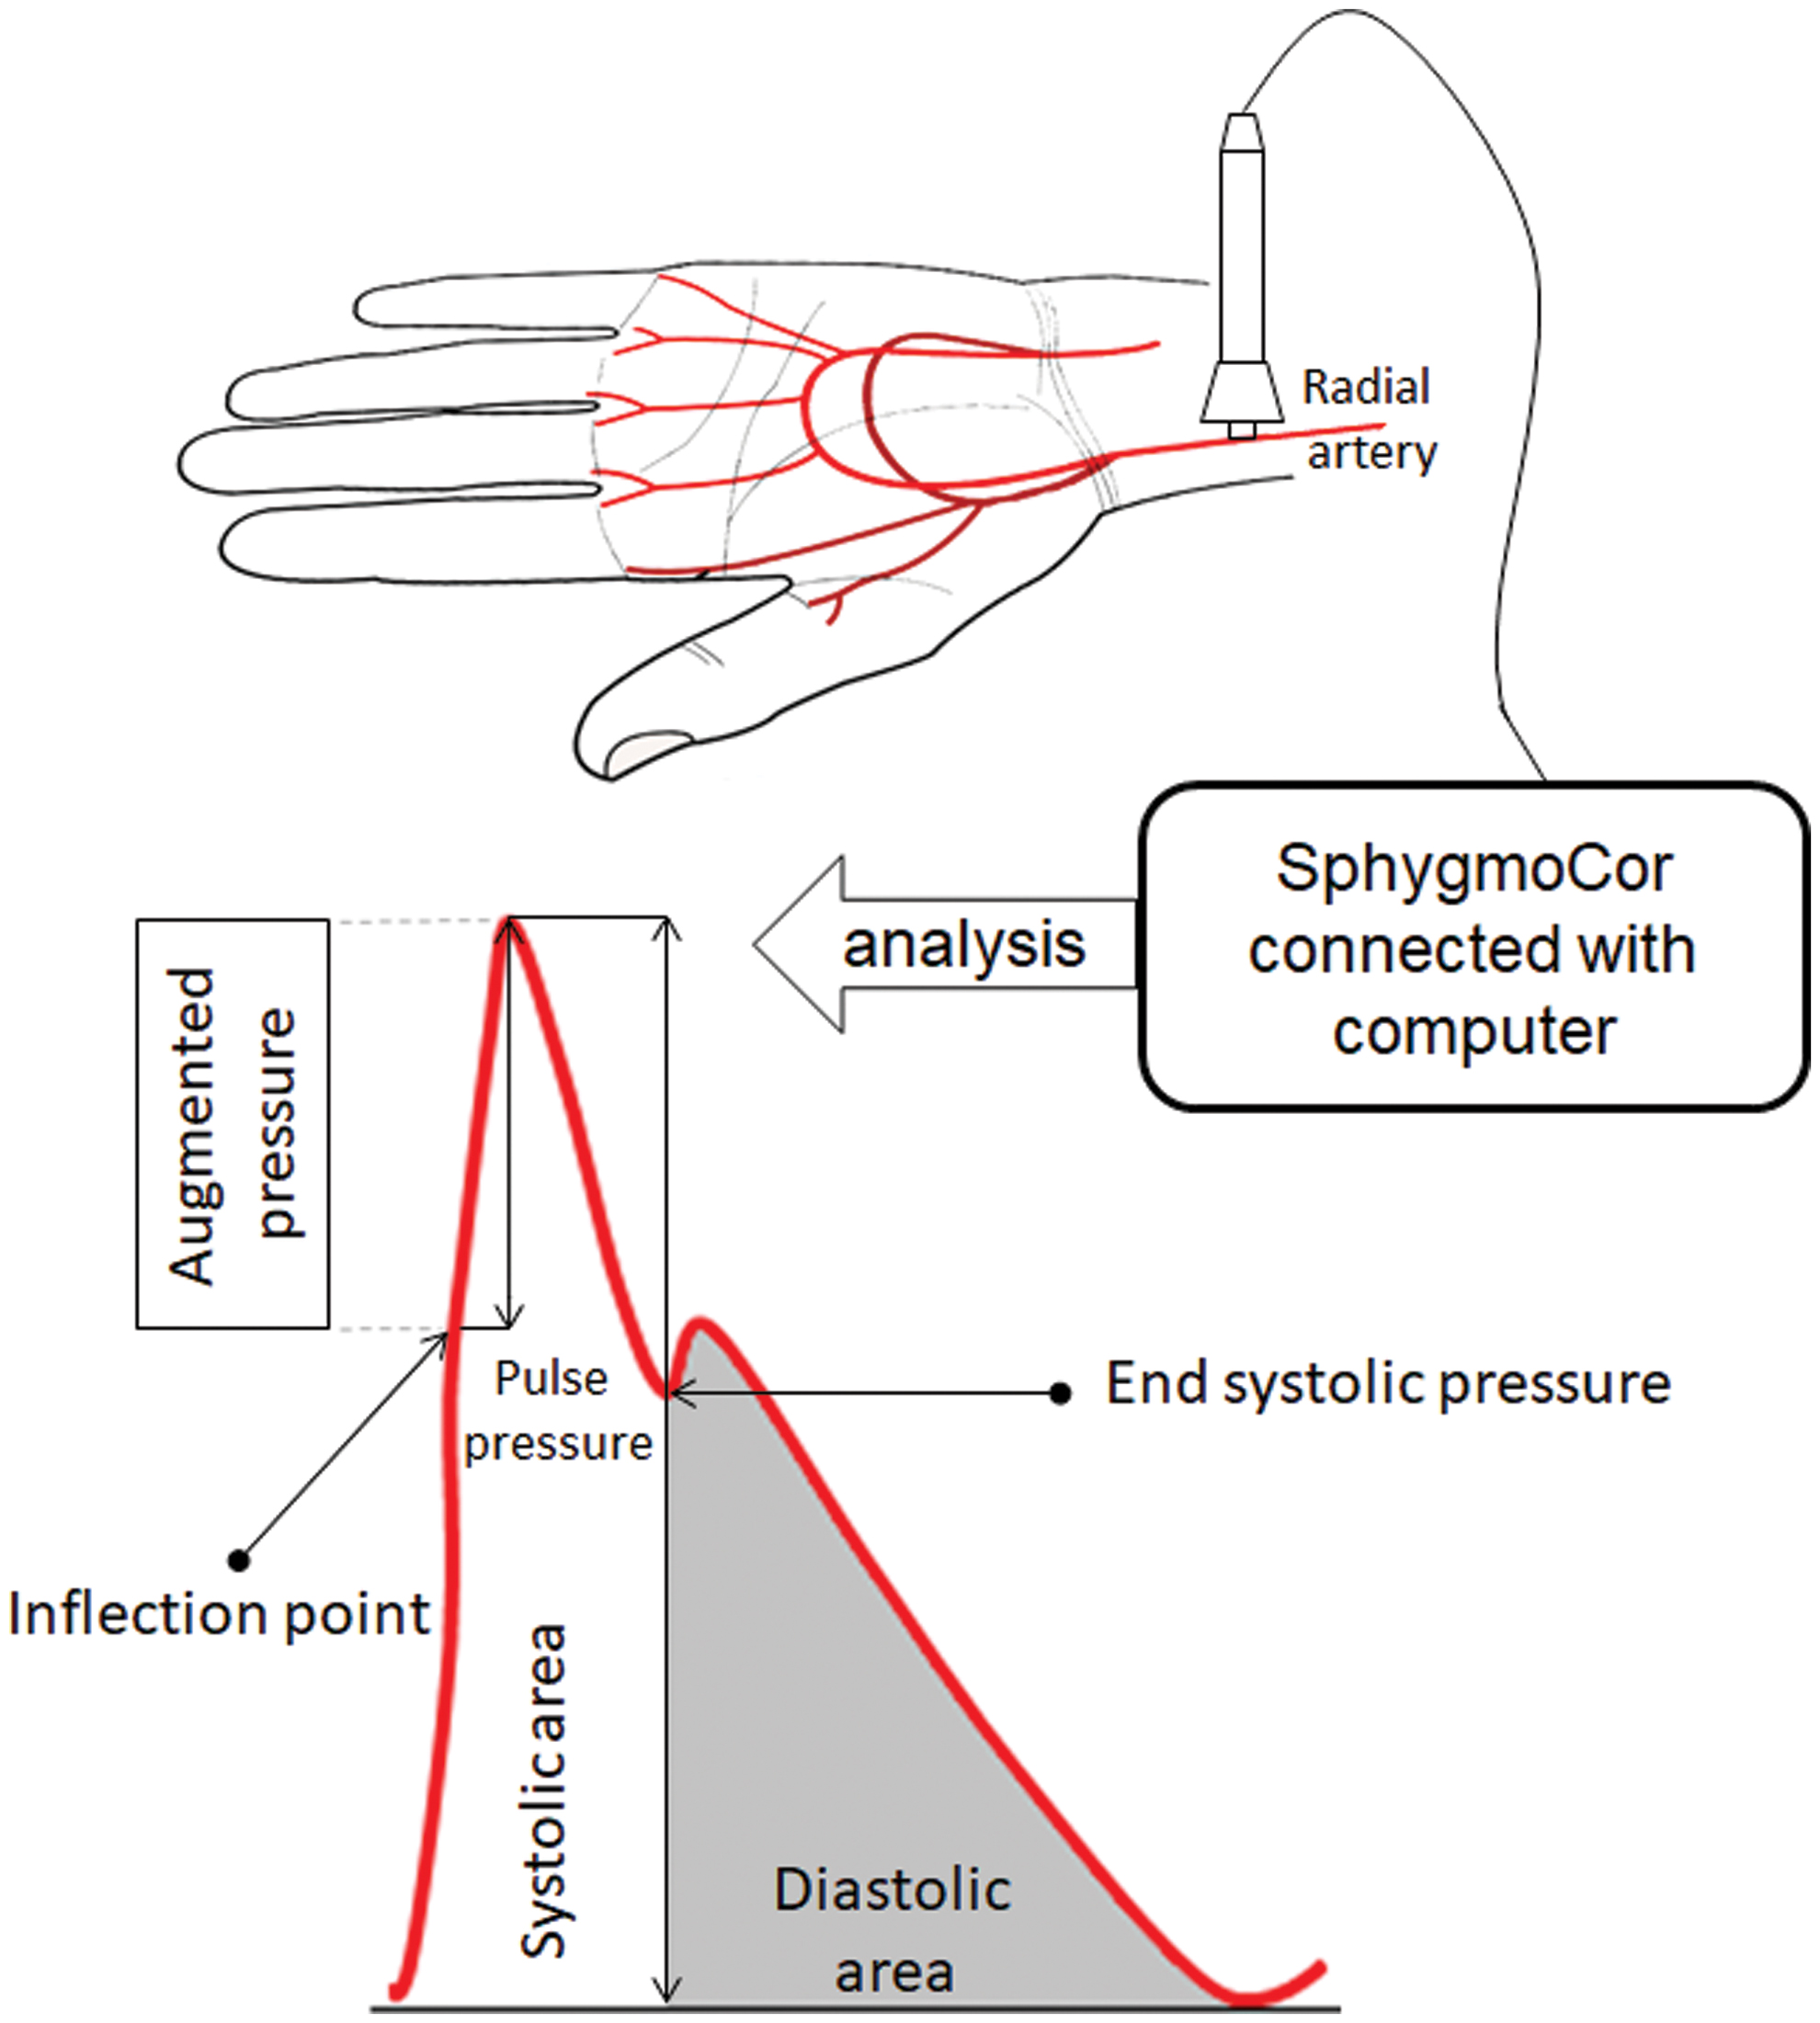
Technique of pulse wave analysis. Pulse wave measured in the radial artery was recorded and analyzed with SphygmoCor. SEVR = (diastolic area/systolic area) × 100%. SEVR, subendocardial viability ratio. Color images are available online.
Statistical analysis
The Shapiro–Wilk test was used to test the normality of distribution of the results. Means and standard deviations (SDs) are reported unless otherwise indicated. Categorical variables were compared using the χ2 and Fisher exact tests or χ2 with Yates correction when applicable. Student's t-test was used for variables with a normal distribution. For variables with non-normal distribution, Mann–Whitney U, Kruskal–Wallis analysis of variance, and post hoc Dunnett's multiple comparison tests were used. Linear regression analysis was performed by using the Pearson test for variables with normal distribution and the Spearman test for variables with non-normal distribution.
Linear mixed-effects modeling to describe the SEVR was performed for each studied variable separately (plasma osmolality, dose of norepinephrine, CI, CVP, stroke volume index [iSVI], SVV, SVRI, pulmonary vascular permeability index [iPVPI], global ejection fraction [GEF], global end-diastolic volume index [GEDI], and intrathoracic blood index [iTBI]) under the assumption that the random-effect parts of the model are related to specific patients and the measurement moment. Before fitting, each variable was standardized to zero mean and SD of one; p value <0.05 was considered significant.
Results
One hundred twenty-two isolated TBI patients admitted to the ICU were considered for inclusion in this study (Fig. 2). After exclusion, 64 patients (16 females and 48 males) aged 18–64 years with completed data of 5 time points were included in this study (Table 1). The mean GCS was 4.42 ± 1.6 and was comparable in survivors and nonsurvivors; however, the majority of patients (78.1%) had a GCS below 5 (Table 1). Fifty patients survived at 28 days after admission, and 14 died after the 5th day of treatment. Decompressive craniectomy (DC) to reduce raised intracranial pressure (ICP) following cerebral edema was performed in 23 patients. Six of them underwent such a procedure after admission to the hospital and were admitted to the ICU immediately after surgery. In those patients, SEVR measurement was performed only after DC. Finally, 17 patients underwent DC and the SEVR was analyzed on the day of surgery and 1 day after surgery. Five patients underwent such procedure at the 1st day of treatment (24 h) and 12 at the 2nd day of treatment (48 h).
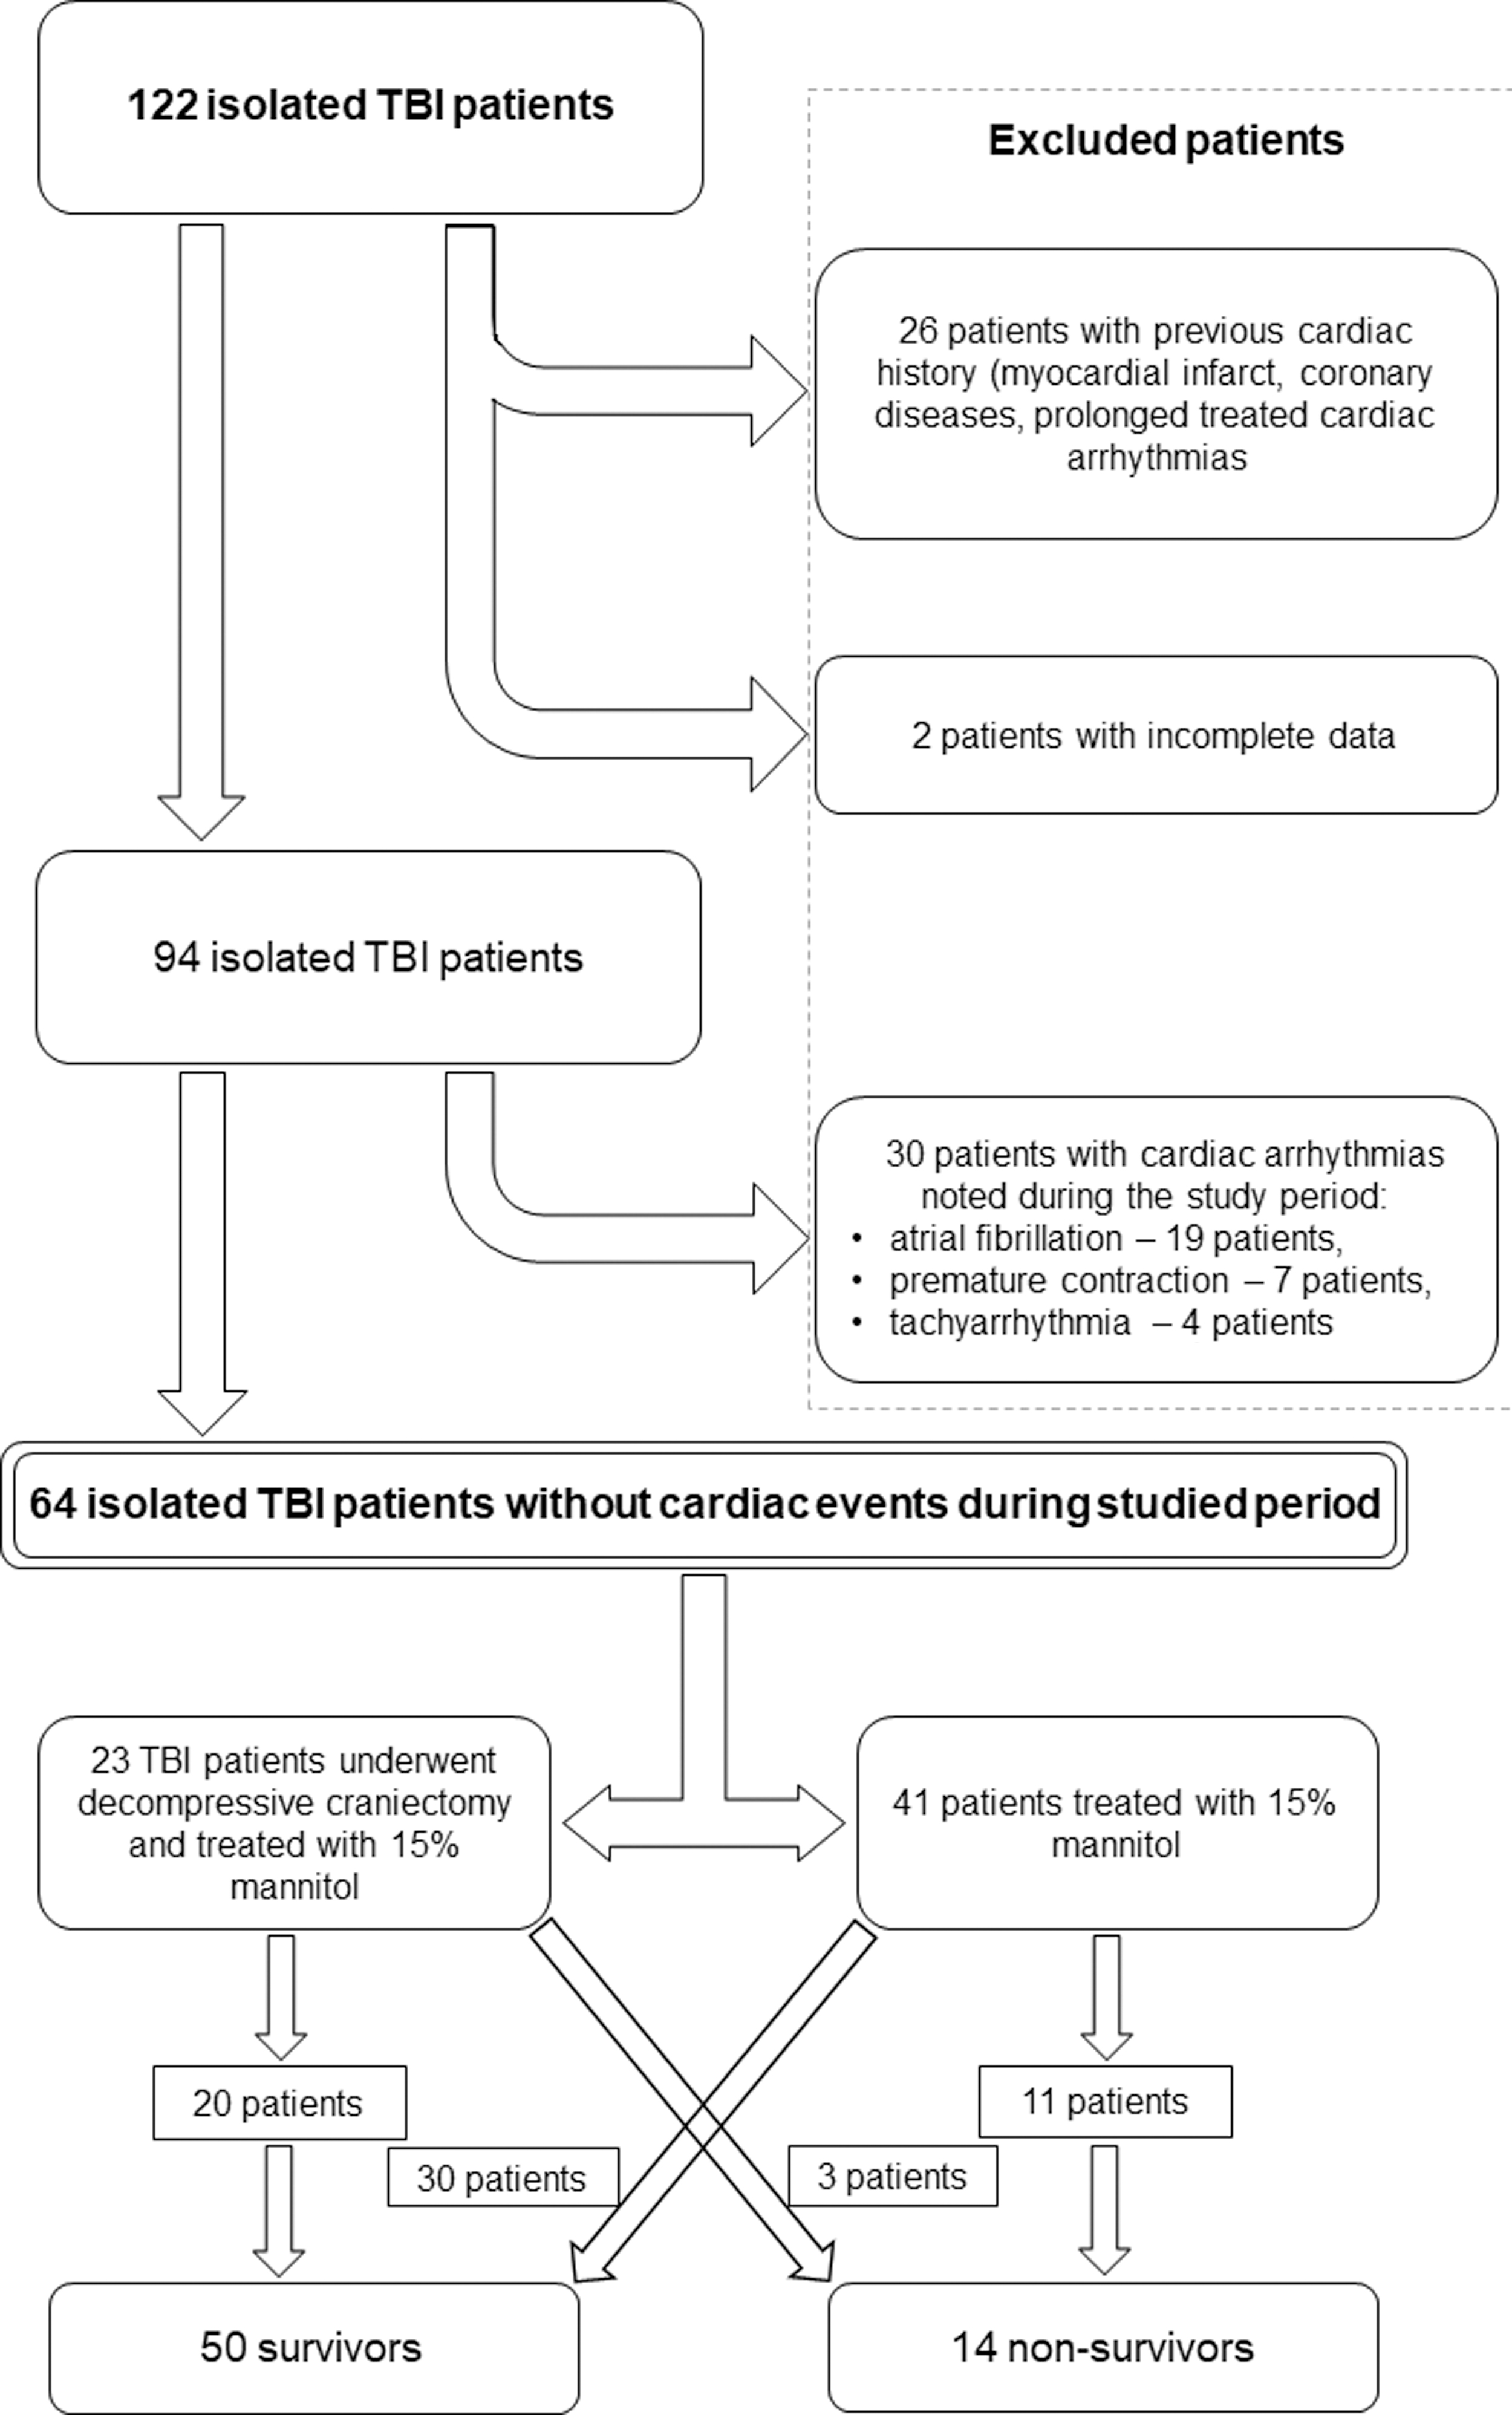
Diagram with patient distribution. Twenty-six patients were excluded due to previous cardiac history (information received from the legal representatives or medical documentation), and two patients were excluded due to the absence of complete data for the analysis. After preliminary exclusion, 94 patients were included in the study. During the studied period, episodes of cardiac arrhythmias were noted in 30 patients, but their data were also incomplete because of the insufficient quality of pulse wave recordings (operator index below 80). TBI, thoracic blood index.
Demographic Data
APACHE II, Acute Physiology and Chronic Health Disease Classification System II; GCS, Glasgow coma score; ISS, injury severity score; LH, left hemisphere; RH, right hemisphere; SAH, subarachnoid hemorrhage; SD, standard deviation.
SEVR analysis and its correlations
The mean quality index of pulse wave analysis measurement was 92.3 ± 4.6 at all time points. The median baseline value of the SEVR was 133% [109 and 158—quartiles 1 and 3, respectively] in all participants. All TBI patients had a significantly reduced SEVR 48 h after admission to the ICU, which then increased systematically throughout the rest of the observation period (Fig. 3). SEVR values at 24, 72, and 96 h after TBI were significantly higher in survivors than nonsurvivors (Fig. 4). Additionally, the SEVR decreased 48 h after admission to the ICU, increased 96 h after admission to the ICU in survivors, and decreased 24 h after admission to the ICU in nonsurvivors (Fig. 4). DC was performed in 20 survivors and 3 nonsurvivors (nonstatistical difference: χ2 = 1.64, p = 0.2, χ2 with Yates correction = 0.93, p = 0.33). DC increased SEVR values (Fig. 5).

Changes in SEVRs in the whole studied population (median and quartiles 1 and 3, respectively); *p < 0.05, **p < 0.01, and ***p < 0.001—differences between measurement points (Wilcoxon test with Bonferroni correction).
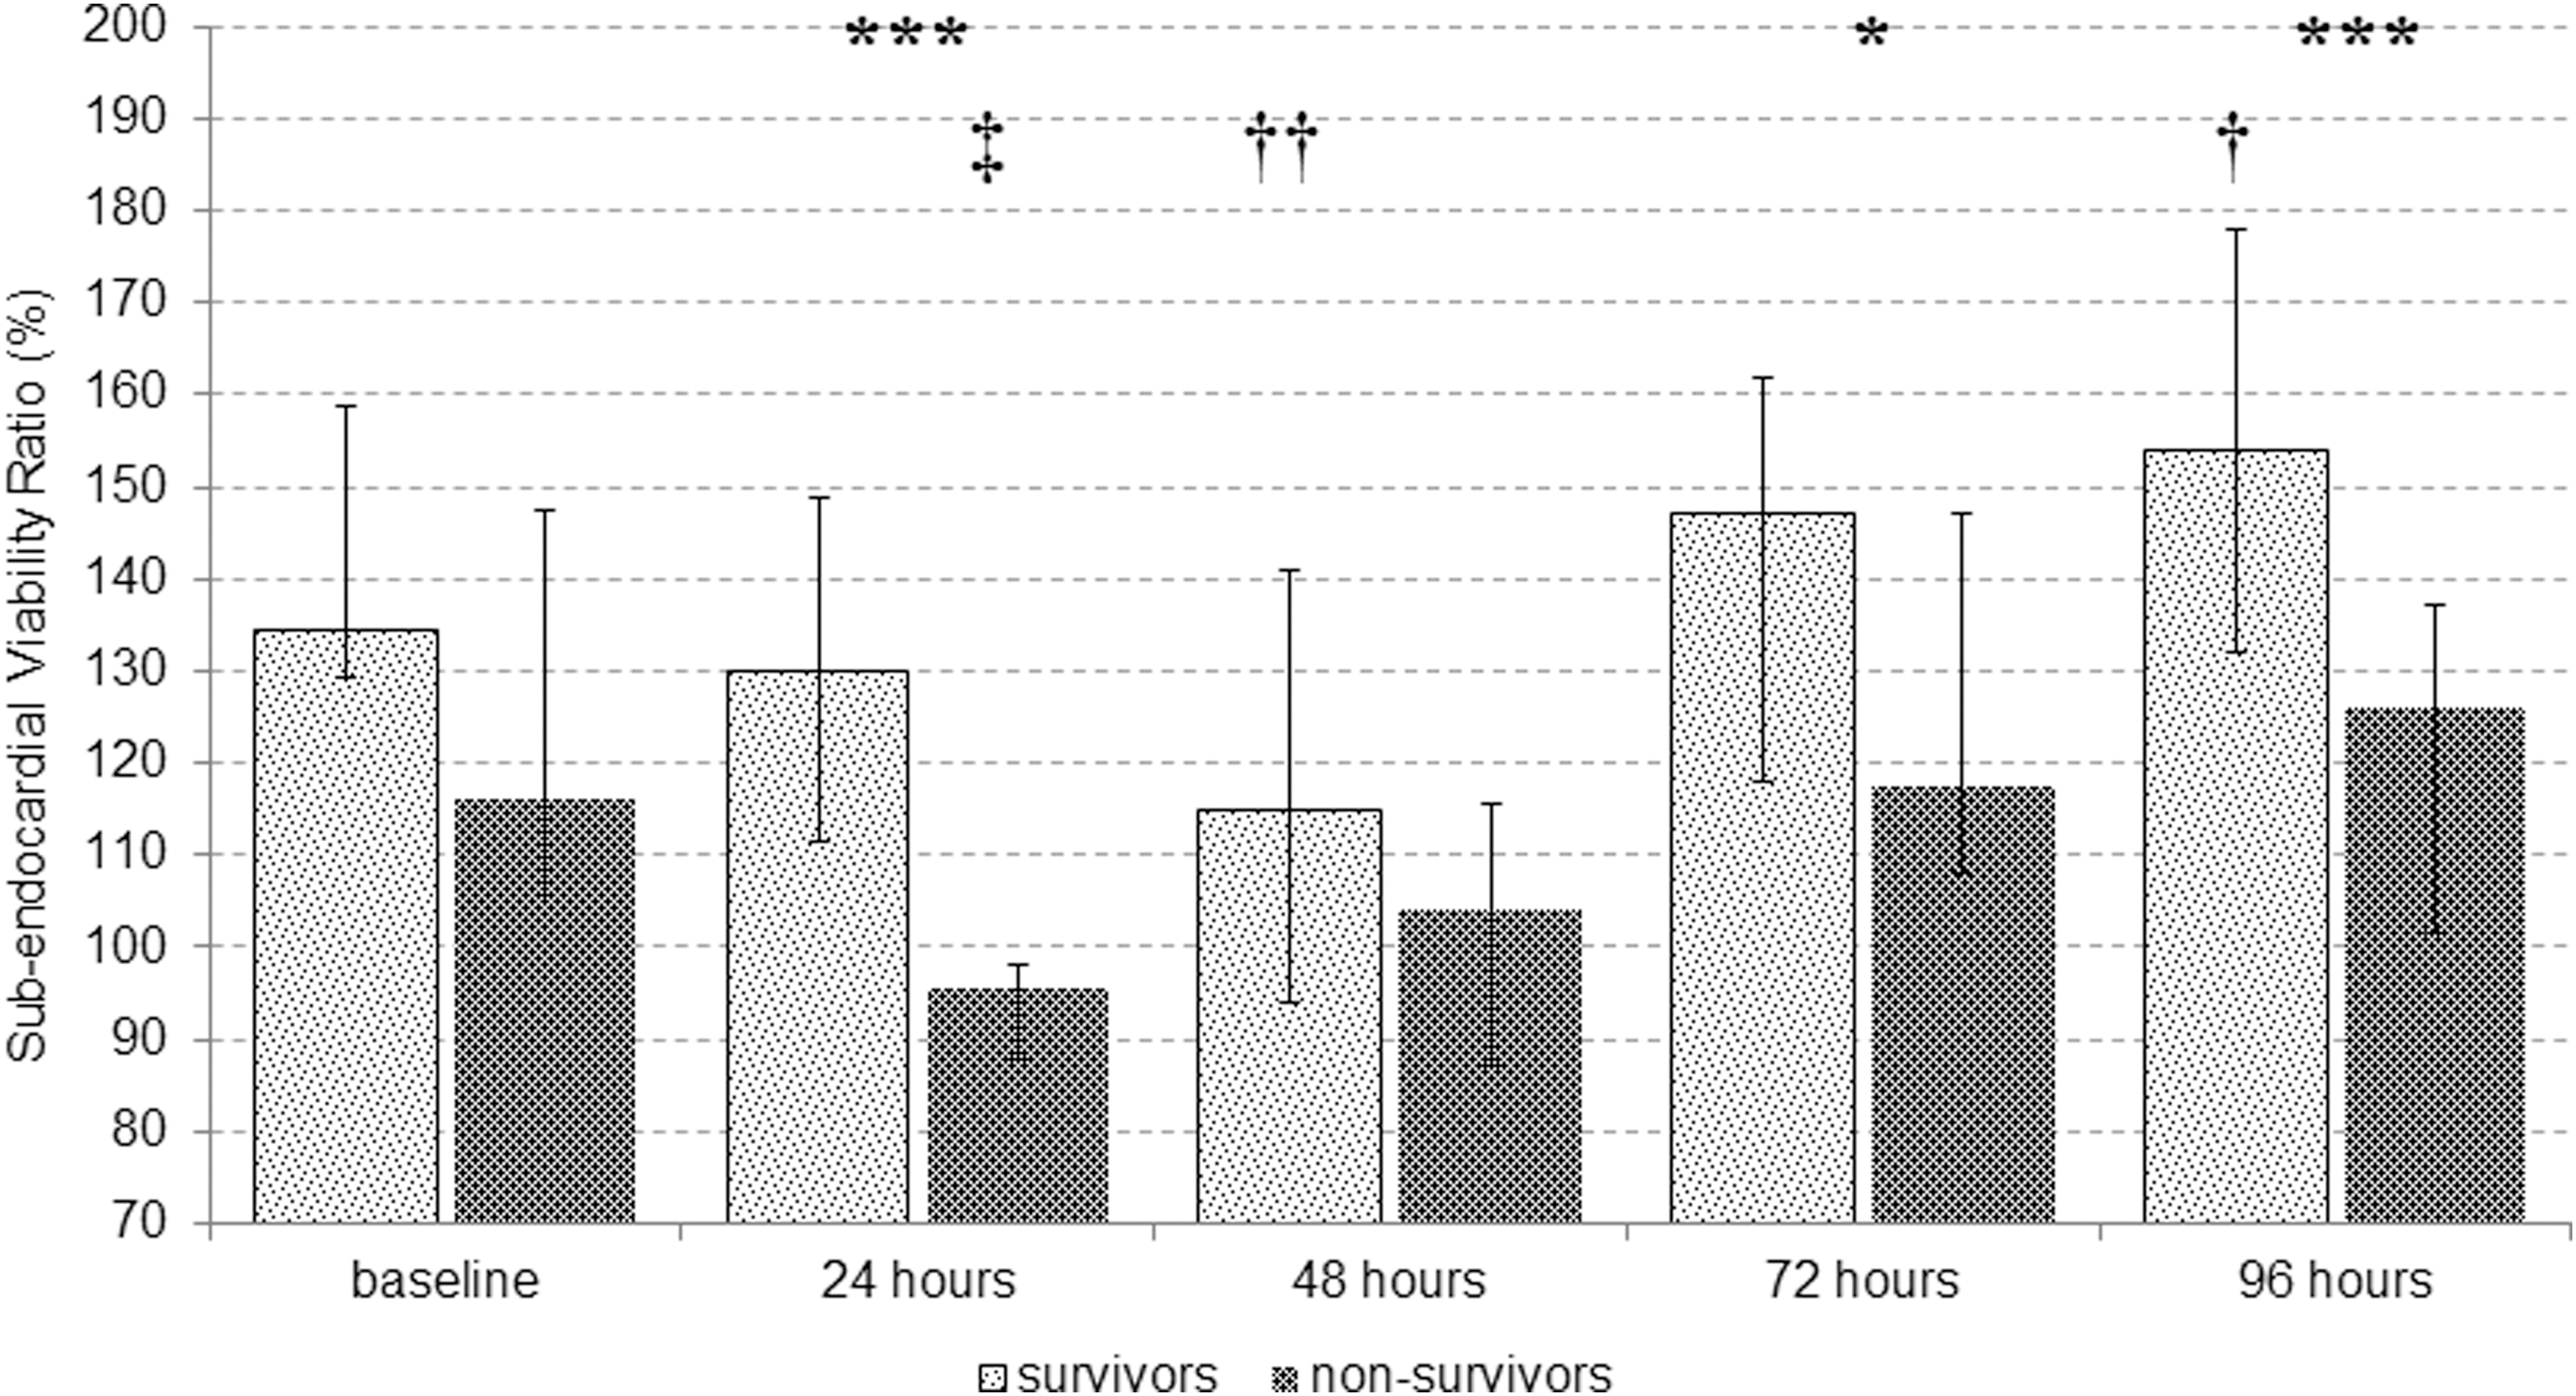
Changes in SEVRs in patients who survived (survivors) and who did not survive (nonsurvivors) the 28 days of treatment (median and quartiles 1 and 3, respectively). Time points: (1) immediately after admission to ICU; (2) 24 h after admission; (3) 48 h after admission; (4) 72 h after admission; and (5) 96 h after admission; *p < 0.05 and ***p < 0.001—significant differences between survivors and nonsurvivors, † p < 0.05 and †† p < 0.01—significant difference in comparison with baseline SEVR in survivors, and ‡ p < 0.05—significant difference in comparison with baseline SEVR in nonsurvivors.
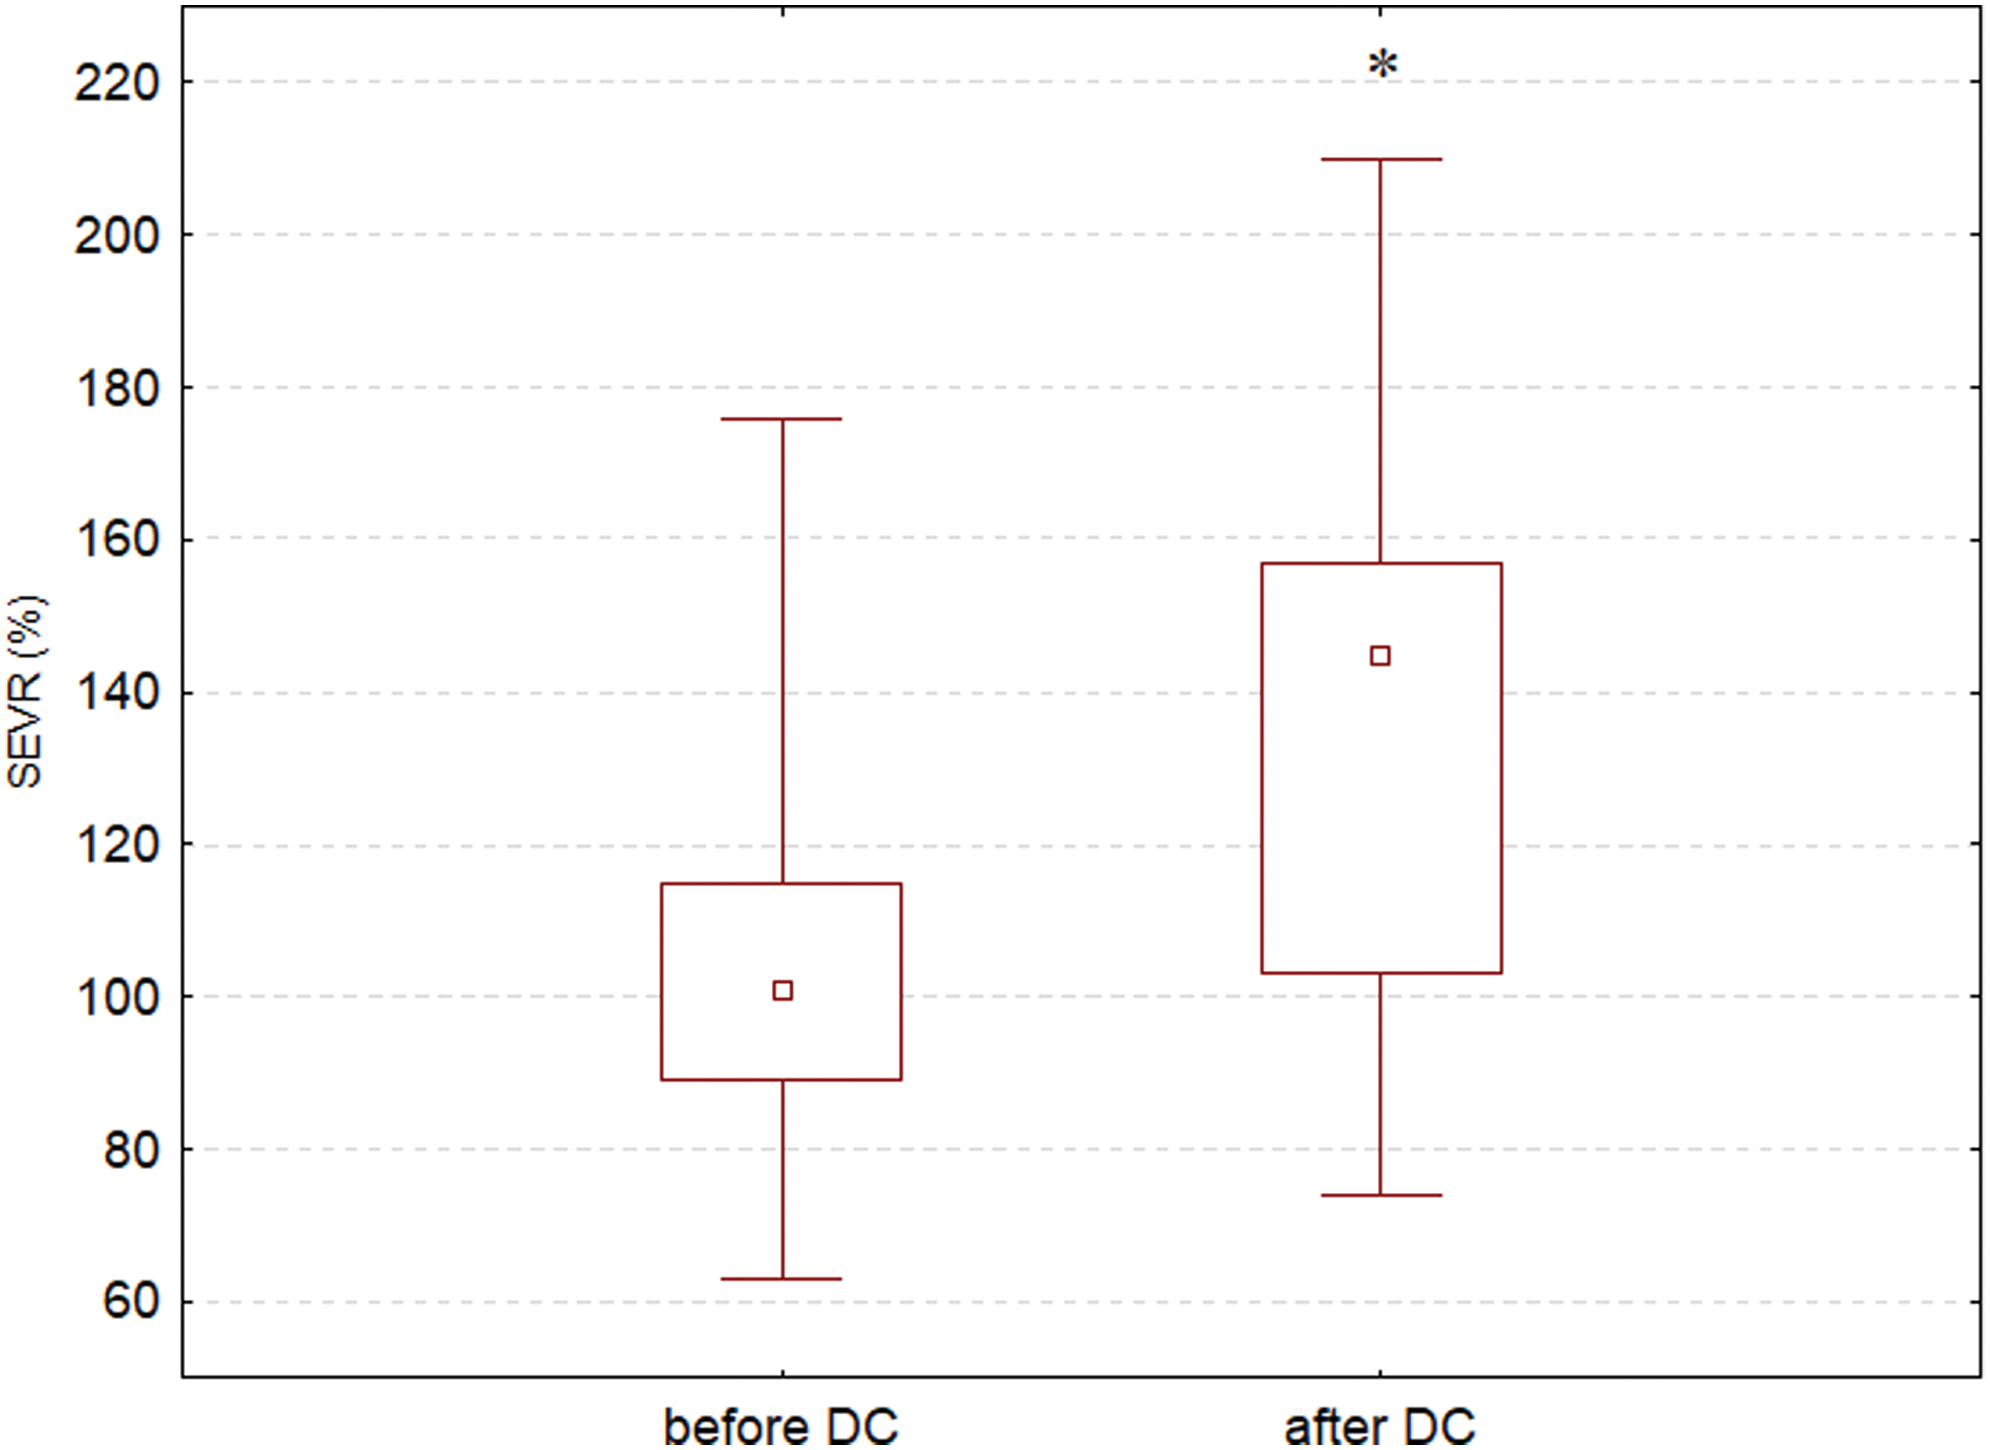
Changes in SEVRs before and after DC—median, quartiles 1 and 3, minimum and maximum, respectively; *p < 0.05—difference between SEVRs before and after DC (Wilcoxon test with Bonferroni correction). DC, decompressive craniectomy. Color images are available online.
Immediately after admission to the ICU, the SEVR correlated with plasma osmolality (p < 0.05, r = 0.64), GEDI (p < 0.05, r = 0.59), and GEF (p < 0.05, r = −0.59) in nonsurvivors. Additionally, the SEVR correlated with SVRI 24 h after admission to the ICU (p < 0.01, r = 0.8) and with GEF 72 h after admission to the ICU (p < 0.05, r = −0.63) in nonsurvivors.
A significant relationship between GEDI and SEVR was also found in linear mixed-effects modeling with its larger values related to a larger SEVR (Table 2), independently of the studied subgroup. A similar positive, but not as strong, relationship with the SEVR was also observed for osmolality, iTBI, iSVI, and CI (Table 2). Negative dependence of SEVR was found for iPVPI and global ejection fraction, with the latter significant only in the group of nonsurvivors (Table 2).
Estimates of Linear Mixed-Effects Model Coefficients Fitted to Explain the Subendocardial Viability Ratio with Random Effects Attributed to a Specific Patient and Measurement Moment
For each variable in the table (fixed-effect part), a separate model has been fitted with an intercept affected by random effects. Before fitting, each variable has been standardized, so it has a mean of zero and standard deviation of one.
p < 0.05, ** p < 0.01, and *** p < 0.001 (marked bold).
CI, cardiac index; CVP, central venous pressure; DAP, diastolic arterial pressure; GEDI, global end-diastolic volume index; GEF, global ejection fraction; iPVPI, pulmonary vascular permeability index; iSVI, stroke volume index; iTBI, intrathoracic blood index; MAP, mean arterial pressure; SAP, systolic arterial pressure; SVRI, systemic vascular resistance index; SVV, stroke volume variation.
Hemodynamic variables
Hemodynamic variables were comparable in survivors and nonsurvivors (Table 3). Patients who did not survive required a higher dose of norepinephrine just after admission to the ICU and after 24 and 48 h of treatment (p < 0.01). The SEVR did not correlate with the dose of norepinephrine, and changes in the dose of norepinephrine did not affect SEVR (Fig. 6).
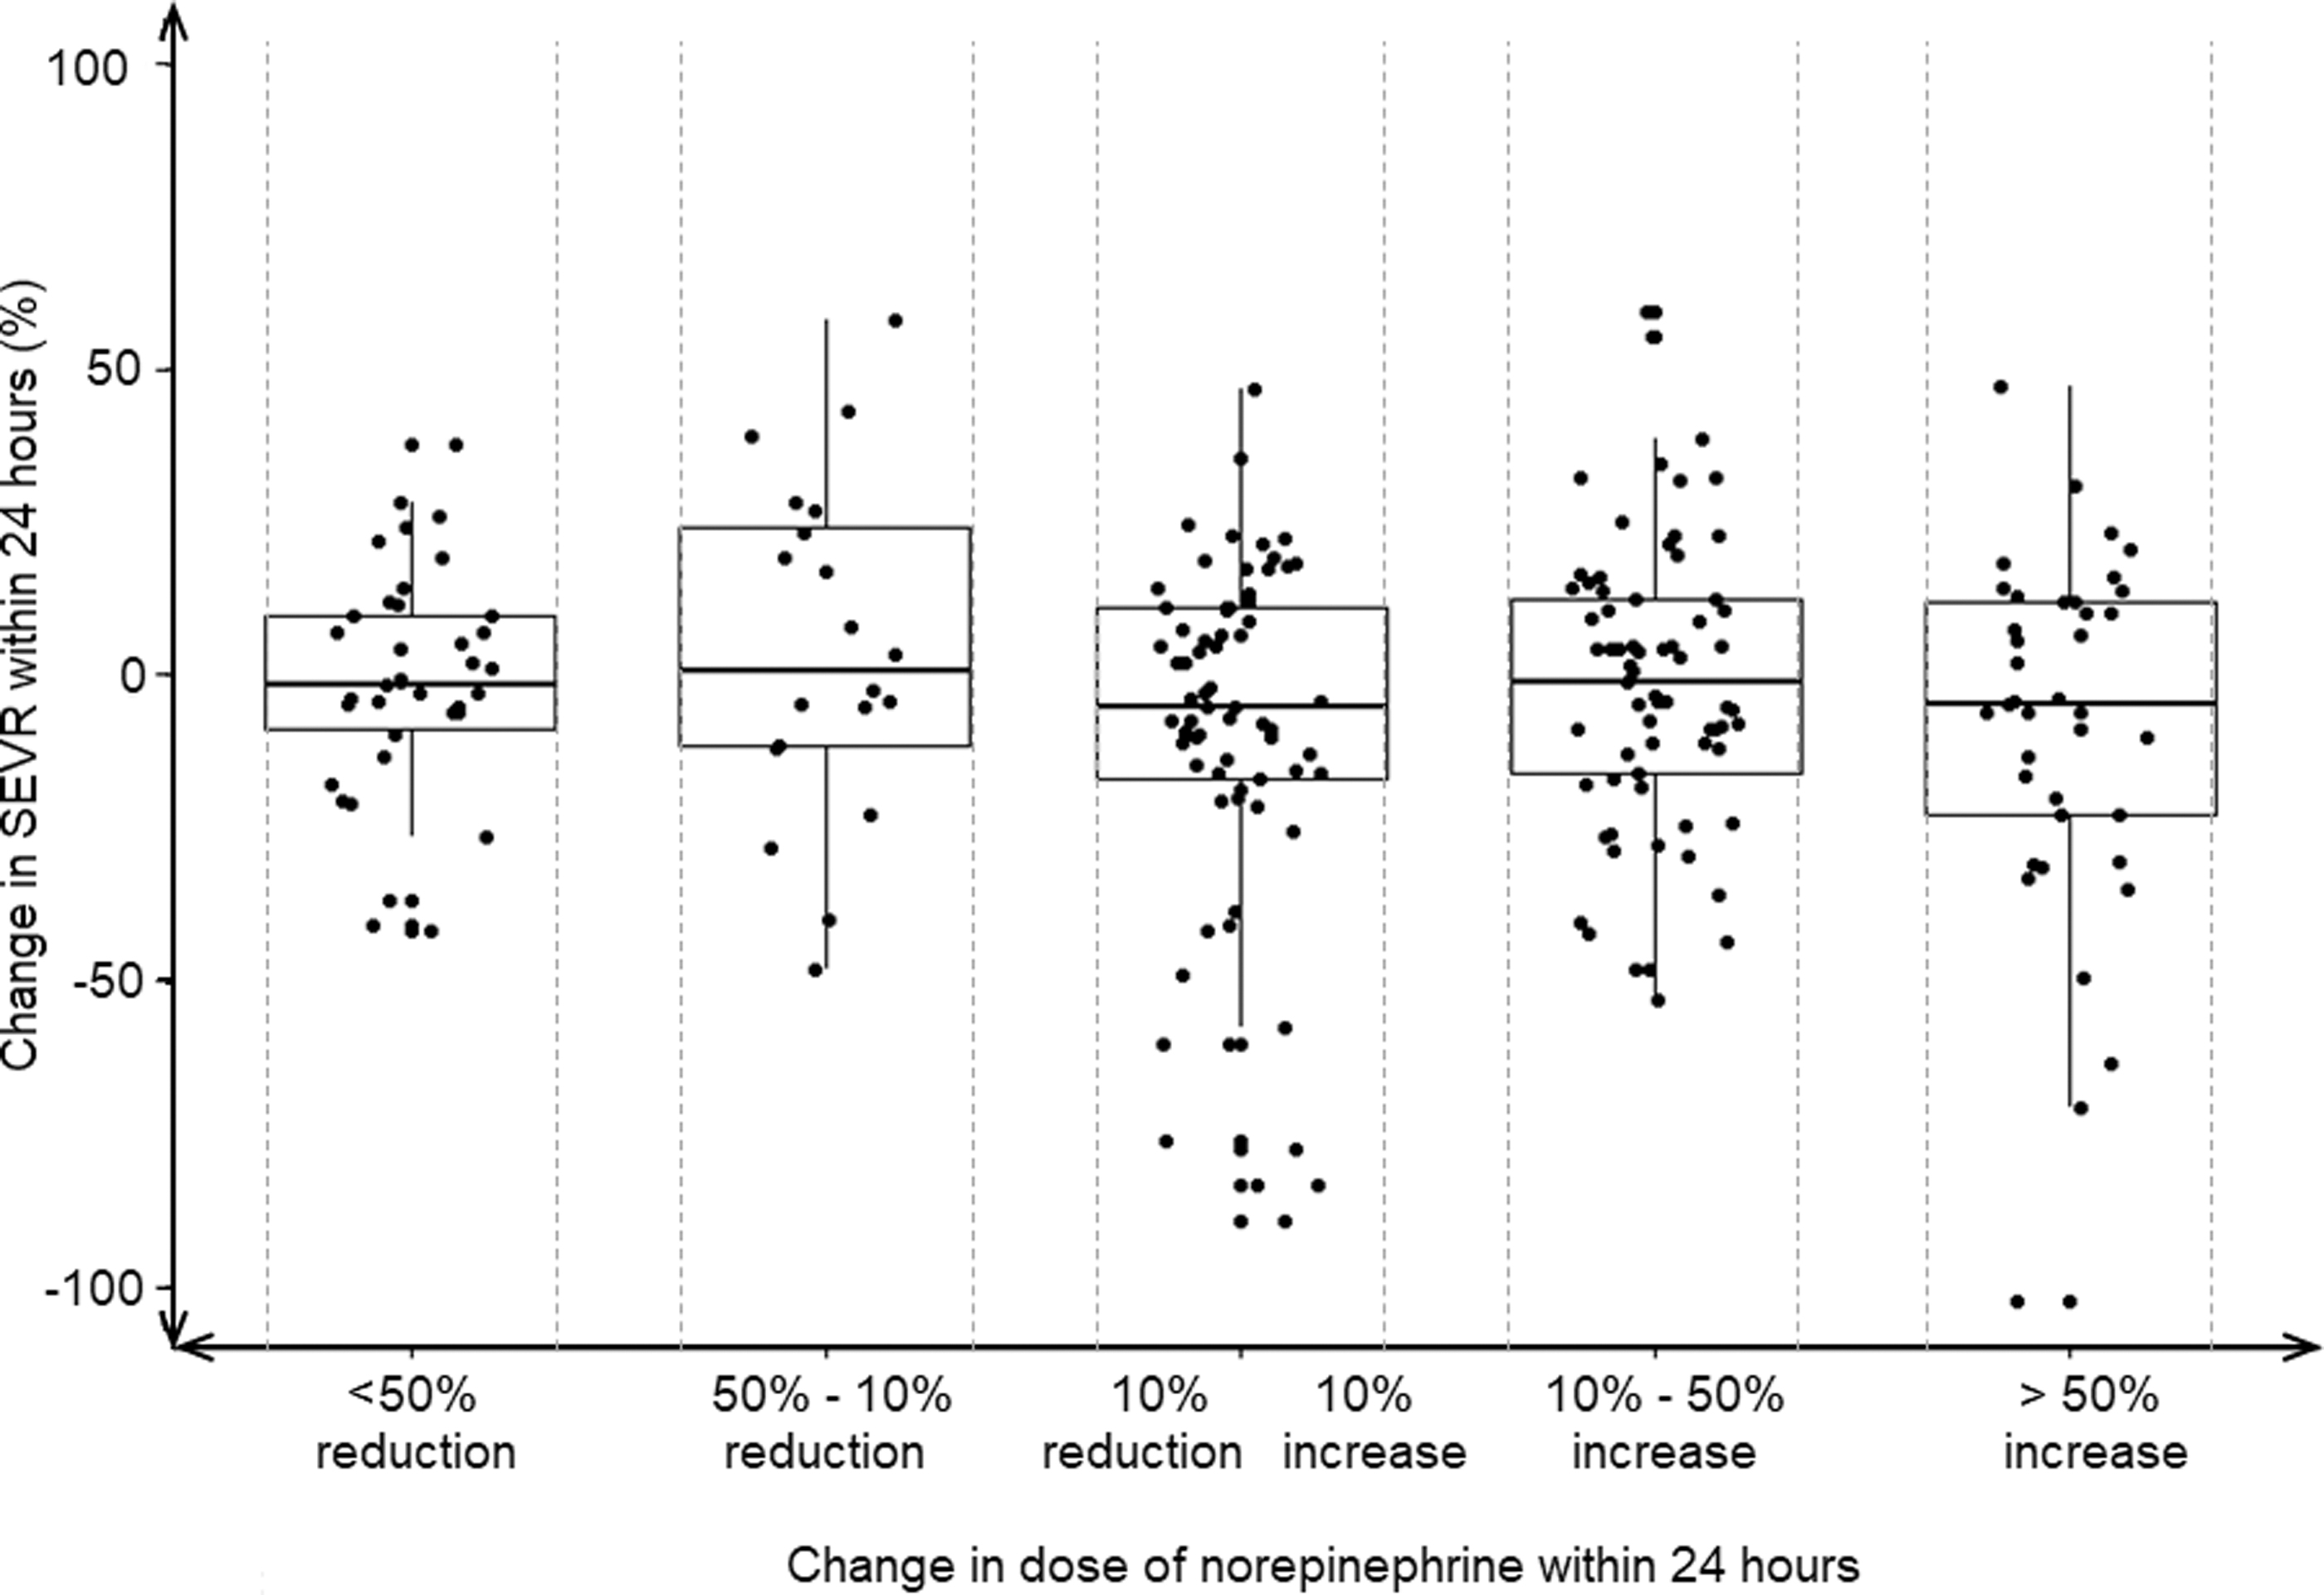
Comparison of relative changes in SEVR values on subsequent days of observation for different relative changes in the norepinephrine dose at corresponding 24-h intervals (Wilcoxon test with Bonferroni correction).
Changes in Hemodynamic Variables in the Whole Studied Population, Survivors, and Nonsurvivors
p < 0.01, ** p < 0.01, and *** p < 0.001—differences between both groups.
Discussion
This study documents changes in the SEVR in critically ill patients without previous cardiac disease treated for isolated TBI. The decrease in SEVR was noted within 24 − 48 h from admission and SEVR value was lower in patients who did not survive than in patients who survived at day 28 from admission to the ICU (Figs. 3 and 4). Surgical decompression of intracranial hemorrhage improved the SEVR (Fig. 5). Additionally, disorders in SEVR did not correlate with the dose of administered norepinephrine and with its daily changes. To the best of our knowledge, the effect of brain injury on SEVR has never been studied.
Cardiac disorders are frequently observed in TBI patients (Battaglini et al., 2020). Commonly encountered TBI-related cardiac manifestations are associated with different types of arrhythmias and EEG abnormalities, repolarization abnormalities, and sudden cardiac death (Osteraas et al., 2017). ECG abnormalities have been observed in 15–90% of patients after brain injury and cardiac arrhythmia in 20–100%, with the highest incidence in patients with subarachnoid hemorrhage (Biso et al., 2017; Krishnamoorthy et al., 2017; Osteraas et al., 2017; Sijercic et al., 2018). TBI-related ECG alterations are the result of the systemic cascade of cytokines consequent to acute brain injury rather than a direct cardiac injury or cardiac disease (Osteraas et al., 2017). Prolonged corrected QT (QTc) interval, nonspecific ST-segment or T-wave changes, and widening of the spatial QRS-T angle have been reported as the most frequent disorders in TBI patients (Dabrowski et al., 2018; Kenigsberg et al., 2019; Krishnamoorthy et al., 2014, 2017; Venkata and Kasal, 2018). Prolonged QTc usually reflects a dysfunction in myocardial repolarization, and the widened spatial QRS-T angle indicates a difference in the spatial direction between ventricular depolarization and repolarization (Kück et al., 2018; Steinberg, 2018). Noteworthy, abnormalities of the left ventricular function correspond with disorders of SEVR (Aslanger et al., 2017; Schultz et al., 2013). Ekart and colleagues (2019) have documented that patients with lower SEVRs have a 16-fold higher risk of cardiovascular death and a 7-fold higher risk of combined cardiovascular events.
Severe systolic dysfunction (fractional shortening <0.25) has been observed in 22% of patients in the early phases after TBI, with an improvement within the following week after injury (Krishnamoorthy et al., 2017). Echocardiographic studies have also documented an increase in the isovolumic relaxation time (an indicator of diastolic dysfunction) and reduced diastolic velocity of early filling, which suggests diastolic myocardial dysfunction in the early phases of TBI (Bahloul et al., 2006; Cuisinier et al., 2016).
TBI-related cardiac disorders may result from dysfunction of the autonomic nervous system (Mashaly and Provencio, 2008). The regulation of cardiovascular function by the central nervous system is very complex and it corresponds to the activity of nuclei located in the diencephalon and brainstem regions. TBI involves insular cortex activation, which leads to sudden catecholamine release (Mashaly and Provencio, 2008). It has been documented that elevated catecholamine concentration, particularly norepinephrine, causes coronary vasospasm, increasing myocardial oxygen demand and leading to cardiac ischemia and myocyte apoptosis (Mashaly and Provencio, 2008; Singh et al., 2001). Additionally, increased vagal activity following TBI may contribute to different cardiac arrhythmias with decreased heart rate variability (HRV) (Sykora et al., 2016). The parasympathetic nervous system also modulates myocardial inflammatory response, and myocardial inflammation has been presented as a main mechanism for neurogenic stunned myocardium (Biso et al., 2017; Kenigsberg et al., 2019; Osteraas and Lee, 2017; Pavlov and Tracey, 2012). Based on our findings, we can speculate that disorders in myocardial perfusion reflected by the SEVR probably result from TBI-related parasympathetic hyperactivity rather than from administration of norepinephrine.
An uncontrolled hyperactivation of the autonomic nervous system led to a decrease in SEVR, whereas administration of norepinephrine was necessary only to maintain appropriate cerebral perfusion pressure. This is in agreement with a study by Sykora and colleagues (2016), who observed increased parasympathetic activation following TBI, which was an independent risk for poor outcome.
Yet, the effect of this surgical intervention on cardiac function has not been well documented. DC is usually performed to reduce the ICP. Raised ICP is associated with ECG abnormalities and circulatory disorders (Milewska et al., 2009; Mowery et al., 2008; Wu et al., 2011). Recently, we documented that DC shortened the QTc interval and reduced the spatial QRS-T angle in TBI patients with intracranial hypertension (Dabrowski et al., 2020). Additionally, we found a correlation between the QTc interval and elevated ICP, and DC affected the STJ segment in leads: II, III, aVF, and V6. The positive correlation between HRV and ICP was documented in patients with severe TBI, and ICP was elevated above 30 mmHg, increasing the incidence of low HRV (Mowery et al., 2008). Interestingly, the increase in ICP above 15 mmHg causes a significantly higher increase in the plasma brain natriuretic peptide compared with patients with ICP <15 mmHg during the 1st day after TBI (Wu et al., 2011). Elevated ICP is commonly connected with a prolonged QTc interval and ischemia-like changes in the ST segment (Milewska et al., 2009). Importantly, ischemia-like changes in the ST segment may suggest impaired myocardial perfusion, and SEVR has been suggested as a noninvasive marker of cardiac ischemia (Aslanger et al., 2017; Schultz et al., 2013; Tsiachris et al., 2012). Our study shows that the low SEVR value could correspond with elevated ICP as after DC, we found a higher SEVR that reflects improved myocardial perfusion.
Noteworthy, a significant decrease in SEVR resulting from diastolic disorders may impair cardiac recovery following ischemia (Aslanger et al., 2017). SEVR has been recognized as a noninvasive alternative tool to the invasive assessment of microvascular coronary perfusion (Anyfanti et al., 2019; Buckberg et al., 1972). Hence, we can speculate that TBI impairs microvascular coronary perfusion and decreases myocardial oxygen delivery in patients without previous coronary diseases.
Limitations
Despite its novel findings, the present study also has several limitations. First, due to a small number of patients who did not survive the 28th day of treatment, we cannot unequivocally conclude that a lower SEVR corresponds with unfavorable outcome and death. Additionally, some patients were excluded from our study due to incomplete data owing to episodes of cardiac arrhythmias. Cardiac arrhythmias are frequently associated with TBI. The most frequent arrhythmias are sinus arrhythmia, atrial fibrillation, and premature ventricular complexes, which occur 24–48 h after injury, and it is well recognized that cardiac dysrhythmias reduce myocardial perfusion (Katsanos et al., 2013; Wijesurendra et al., 2018). However, cardiac dysrhythmias preclude or significantly limit the quality of the pulse wave measurement, making this measurement unreliable.
A small number of patients who underwent DC also limited the analysis of SEVRs in this group. These relationships require further study in a larger population of patients with isolated TBI. Second, we analyzed only the relationships between changes in the dose of norepinephrine and SEVR. To analyze the effect of parasympathetic activation on myocardial perfusion, an analysis of the total circulating norepinephrine in blood—both endogenous and exogenous—is required. The SEVR reflects arterial stiffness, which could affect our results. Concededly, we included only the patients without cardiovascular history, but a lot of patients could have asymptomatic cardiovascular disorders. The complementary measurement of relationships between the augmentation index and heart rate could help to overcome this problem (Scandale et al., 2018). We did not measure plasma troponin and brain natriuretic peptide concentration, whereas several studies have documented an increase in plasma troponin concentration in patients with TBI, which can suggest myocardial ischemia and predict poor outcome (Rimaz et al., 2019).
We also did not perform echocardiography in the studied population, and the echocardiographic examination could document systolic and diastolic dysfunction significantly better than hemodynamic variables. Therefore, our study should be continued with serial echocardiography and plasma troponin measurements.
Finally, we did not perform the analysis between SEVR and ECG variables, blood markers of cardiac ischemia, and coronary perfusion, so we could only conclude that TBI was associated with changes in the SEVR. Therefore, our study should be treated as a starting point for further more detailed observations.
Conclusions
The present study documents a decrease in the SEVR 48 h after TBI and an increase after 96 h only in patients who survive 28 days. Surgical decompression improves the SEVR. The results of our study may implicate abnormalities in cardiac perfusion in patients treated for TBI, which appear to confirm the brain–heart interactions. Nevertheless, the direct effect of circulating norepinephrine on the SEVR requires further study to explain the close association between an injured brain and disorders in coronary perfusion.
Footnotes
Authors' Contributions
All persons designated as authors of this article have fulfilled criteria for authorship and have approved the final version for submission.
Author Disclosure Statement
No competing financial interests exist.
Funding Information
This study was supported by the National Science Centre, Poland (project no 2018/31/D/ST7/03472).
Supplementary Material
Supplementary Material S1Supplementary Material S1
Appendix
References
Supplementary Material
Please find the following supplemental material available below.
For Open Access articles published under a Creative Commons License, all supplemental material carries the same license as the article it is associated with.
For non-Open Access articles published, all supplemental material carries a non-exclusive license, and permission requests for re-use of supplemental material or any part of supplemental material shall be sent directly to the copyright owner as specified in the copyright notice associated with the article.