
Abstract
Introduction:
Mild traumatic brain injury (mild TBI) exhibited abnormal brain network topologies associated with cognitive dysfunction. However, it was still unclear which aspects of network organization were critical underlying the key pathology of mild TBI. Here, a multi-imaging strategy was applied to capture dynamic topological features of both structural and functional connectivity networks (SCNs and FCNs), to provide more sensitive detection of altered FCN from its anatomical backbone and identify novel biomarkers of mild TBI outcomes.
Methods:
A total of 62 mild TBI patients (30 subjects as an original sample with 3–12 months of follow-up, 32 subjects as independent replicated sample) and 37 healthy controls were recruited. Both diffusion tensor imaging and resting-state functional magnetic resonance imaging were used to create global connectivity matrices in the same individuals. Global and regional network analyses were applied to identify group differences and correlations with clinical assessments.
Results:
Most global network properties were conserved in both SCNs and FCNs in subacute mild TBI, whereas SCNs presented decreased global efficiency and characteristic path length at follow-up. Specifically, some hubs in healthy brain networks typically became nonhubs in patients and vice versa, such as the medial prefrontal cortex, superior temporal gyrus, and middle frontal gyrus. The relationship between structural and functional connectivity (SC and FC) in patients also showed salient decoupling as a function of time, primarily located in the hubs.
Conclusions:
These results suggested mild TBI influences the relationship between SCN and FCN, and the SC–FC coupling strength may be used as a potential biomarker to predict long-term outcomes after injury.
Impact statement
The current study was the first study to explore the coupling of structural–functional connectivity (SC–FC) from large-scale whole-brain networks in patients with mild traumatic brain injury. The results showed that the global properties homeostatically conserved in functional connectivity networks while altered in structural connectivity networks. The SC–FC coupling strength showed salient decoupling as a function of time and primarily occurred in hub regions.
Introduction
Mild traumatic brain injury (mild TBI) comprises ∼70–80% of all TBI cases, and some persons will develop persistent cognitive and psychological impairments even over 1 year after injuries (Arciniegas et al., 2005). Among neuropsychiatric disorders, mild TBI can offer a unique opportunity for investigating the transient disruptions in cognitive functioning and neuronal correlates in humans (Mayer et al., 2011). Several studies have stated that functional connectivity (FC) or structural white matter tracts were generally damaged in mild TBI (Fagerholm et al., 2015; Han et al., 2014; Mac Donald et al., 2011). However, despite its prevalence and clinical importance, there is still a lack of clear understanding of its pathophysiological basis and relationship with recovery.
Topological characteristics can capture the relationships between regions of a network regardless of their physical location (Achard et al., 2012). The analysis of functional and structural connectivity networks (FCNs and SCNs) provides new avenues to assess complex network properties following mild TBI. SCNs can be measured through white matter tracts quantified by diffusion tractography (Zalesky et al., 2010), or by correlations of morphological metrics (He et al., 2007). By contrast, FCNs mainly describe the connective properties of temporal coherences between blood oxygen level-dependent functional magnetic resonance imaging (fMRI) signals from both local and distant brain regions (Achard et al., 2006; Salvador et al., 2005), thus allowing the noninvasive investigation of brain networks and their interactions (Palacios et al., 2017).
An MRI tractography study has indicated a widespread loss of structural connections in patients with TBI. This is associated with lower local efficiency and increased path length, indicating the disappeared balance between the demands of specific processing in local modules and integrated processing across whole large-scale brain structural networks (Pandit et al., 2013). While another research investigating group comparisons of graph measures in functional networks shows no differences between mild TBI patients and healthy controls, neither on global nor mean local efficiency (van der Horn et al., 2017). In addition, some studies applied to magnetoencephalography (MEG) have also demonstrated altered network topology in mild TBI. Researchers using Granger causality indicated that mild TBI patients presented a sparsely distributed network of long-range connections compared with controls (Zouridakis et al., 2012). Altered rich-club organization in mild TBI was also detected in an MEG resting-state study (Antonakakis et al., 2017). Somewhat heterogeneous findings across modalities prohibit a converging perspective on system-level pathology, possibly due to limited researches addressing structure and function simultaneously.
Simultaneous measures of structural connectivity (SC) and FC and their interactions allow for a better understanding of TBI-related changes in brain network organizations (Vergara et al., 2017). The FC represents important information on neuronal connectivity between distant regions, which must use white matter fiber paths connecting them. It expects that FC may be dependent on the strength of the relevant anatomical white matter tracts (Skudlarski et al., 2008). Furthermore, FC has previously been found to positively correlate with SC patterns at the aggregate level (Honey et al., 2009). That is, the coupling of FC and SC can be configured under a normal physiological state (Hagmann et al., 2010; Honey et al., 2009).
Injury of white matter tracts may interfere with information flow in the brain. Also, the breakdown in communication between regions may result in compensatory changes including physical disruption of fiber tracts. For example, patients presented significantly lower SC but higher FC in several connections originating in the left inferior frontal gyrus, ventral anterior cingulate, and thalamus in schizophrenia (Skudlarski et al., 2010). The deterioration of white matter may impact the direct SC measures and cause natural reorganization of FC, therefore resulting in a decoupling of SC and FC (Skudlarski et al., 2010). Investigators have tested that patients with certain neurological disorders exhibit a decoupling phenomenon between SCN and FCN, such as epilepsy and schizophrenia (Ding et al., 2013; Skudlarski et al., 2010; Zhang et al., 2011). Spatial coherence between SC and FC then can be used as an available tool for investigating subtle alterations in brain networks after diseases.
Multimodal neuroimaging studies have the potential to identify novel predictors or biomarkers of TBI outcomes (Irimia et al., 2012). Combining both diffusion tensor imaging (DTI) and resting-state fMRI helps one to use SC patterns to provide more sensitive detection of altered FC from its anatomical backbone (Skudlarski et al., 2010). Here, we hypothesized that mild TBI would cause the breakdown in the relationship of SC and FC between regions. We expected further that the SC–FC decoupling may be localized to certain “hub” regions since hub regions are abnormal and disconnected in diseases and may be more vulnerable to the attack of traumatic axonal injury (Fagerholm et al., 2015; Skudlarski et al., 2010; van der Horn et al., 2017). We also aimed to independently replicate our findings in the subacute phase with a new cohort of patients using identical experimental protocols. Replication efforts are critical for clarifying the distinction between sample characteristics discussed earlier.
Materials and Methods
Participants
Screening for mild TBI was based on the American Congress of Rehabilitation Medicine, as revised by the World Health Organization's Collaborating Centre for Neurotrauma Task Force (Holm et al., 2005; Levin and Diaz-Arrastia, 2015). The enrollment protocol for mild TBI followed the inclusion criteria: (1) Glasgow Coma Score of 13–15; and (2) one or more of the following: loss of consciousness (if present) <30 min, post-traumatic amnesia (if present) <24 h, and/or other transient neurological abnormalities such as focal signs, seizure, and intracranial lesion not requiring surgery (Mayer et al., 2011). Additional criteria for inclusion were as follows: (1) no contraindications to MRI; (2) initial injury within 14 days; and (3) agreement to communicate by telephone or e-mail for 3–12 months after enrollment and come back to the hospital for follow-up. The exclusion criteria included participants younger than 18 years, structural abnormality on conventional neuroimaging (such as CT), and any history of neurological disorders, brain injury, and psychoactive medications (Iraji et al., 2016). Patients with existing repetitive mild TBI were also excluded for controlling confounding factors.
All participants provided written informed consent, and all research procedures were approved by the Ethics Committee of The School of Life Science and Technology in Xi'an Jiaotong University and conducted following the Declaration of Helsinki.
A total of 30 original patients (18 males; ages 40.5 ± 11.1 years) were first evaluated with neuroimaging within 2 weeks of postinjury (T1; range 7.2 ± 5.2 days). Clinical assessments were performed within 48 h of MR imaging. As current literature suggests, the recovery process after mild TBI, follow-up scanning and in-person clinical assessments were also conducted for 3 months (T2, 24 patients, range 89.4 ± 30.6 days) and 6–12 months (T3, 20 patients, range 281.0 ± 87.5 days), respectively (Belanger et al., 2007). All original patients completed at least 2 of the 3 visits. Thirty-seven healthy controls (20 males; ages 37.9 ± 8.5 years,) were directly recruited to match patients in terms of gender and age. Additional 32 subacute patients (24 males; ages 36.8 ± 11.3 years; average 7.1 ± 5.1 days postinjury) were also included as a replicated group, although these patients refused or indefinitely postponed follow-up requests. All the subjects were right-handed according to the Edinburgh Handedness Inventory (Christman et al., 2015).
The clinical protocol included a limited set of neuropsychological and symptom assessments to reduce multiple correction issues. All subjects underwent the executive functions of set-shifting, inhibitory control, cognitive flexibility, and word generation fluency adopted by the Trail Making Test alternating-switch cost index (TMT-A and -B) (Reitan, 1955). Information processing speed (IPS) could be performed using the score of the subtraction from TMT-B and -A. Self-reported posttraumatic clinical symptomatology was also assessed with the Postconcussive Symptoms Scale (PSS) (Suhr and Gunstad, 2002).
Image acquisition
Images were obtained using a 1.5T MRI scanner (Siemens, Erlangen, Germany). Functional images were acquired using a single-shot, gradient-recalled echo planar imaging sequence (repetition time [TR] = 2000 ms, echo time [TE] = 40 ms). Fifty-four transverse slices (field of view [FOV] = 240 mm × 240 mm, in-plane matrix = 128 × 128, slice thickness = 2 mm) aligned along the anterior commissure–posterior commissure line were acquired. For each subject, a total of 480 volumes were acquired, resulting in a total scan time of 960 s. Subjects were instructed simply to rest with their eyes closed, not to think of anything, and not to fall asleep. High-resolution, T1-weighted, three-dimensional, magnetization-prepared, rapid acquisition gradient-echo data for all subjects were also acquired (TR = 1900 ms, TE = 2.8 ms, inversion time [TI] = 1000 ms, FOV = 256 mm × 256 mm, flip angle = 8°, slice thickness = 1 mm, matrix size = 256 × 256). A single-shot spin echo-based planar imaging sequence was used to obtain the DTI (TR = 7300 ms, TE = 99 ms, flip angle = 90°, FOV = 256 mm × 256 mm, matrix size = 128 × 128, slice thickness = 3 mm). DTI scan (b = 1000 s/mm2) was acquired with 30 diffusion gradient orientations and the b = 0 s/mm2 repeated two times. Details of quality control are shown in Supplementary Data.
Data preprocessing
According to previous literature on TBI-related structural pathology and connectomics (Irimia et al., 2012), the automated anatomical labeling (AAL) algorithm was used to split the cerebral cortex into 90 anatomical regions of interest (ROIs), resulting in 45 ROIs for each hemisphere (Table 1; Tzourio-Mazoyer et al., 2002).
Cortical and Subcortical Regions Defined in Automated Anatomical Labeling Template Atlas, with 45 Brain Regions Each Hemisphere
The preprocessing of resting-state fMRI images was conducted on the FMTIB Software Library (FSL v5.0). The first 10 volumes were removed to equilibrate the magnetic field, leaving 470 volumes available. Motion correction was then performed through motion correction FMRIB's linear image registration tool, an intramodal motion correction tool based on optimization and registration. The brain extracted tool was used to remove the skull and nonbrain tissue. Next, boundary-based registration was used to align the functional image to Montreal Neurological Institute (MNI) space through the high-resolution T1 data. The normalized data sets were resampled into 3 mm isotropic voxels (Shumskaya et al., 2012). Furthermore, functional images were smoothed with a 6-mm full-width at half-maximum Gaussian kernel. The six head motion parameters, averaged signals from cerebrospinal fluid, and white matter were regressed for the data signal. At final, the blood oxygen level dependent series were band-pass filtered (0.01–0.08 Hz).
For each participant, DTI contain 30 volumes with diffusion gradients along 30 noncollinear directions, b = 1000 s/mm2, and one volume without diffusion weighting, b = 0 s/mm2. Pipeline for Analyzing braiN Diffusion imAges was used to process the data of DTI (Cui et al., 2013). Head motion was first removed by aligning the 30 diffusion-weighted volumes (b = 1000 s/mm2) to the nonweighted scan (b = 0 s/mm2). The eddy correction was also applied on these diffusion-weighted images, resulting in registering to the b = 0 s/mm2 image by affine transformations.
In the DTI native space, whole-brain fiber tracking was applied for each participant using the Fiber Assignment by Continuous Tracking algorithm (Ding et al., 2013; Zhang et al., 2011). The fiber tracking program takes tensor data and generates whole-brain fiber tracks, which are saved to a track data file. The procession of path tracing would proceed unless the fractional anisotropy (FA) was <0.15, or the angle between the current and the previous path segment was greater than 35°, as described in one previous study (Liao et al., 2011). After whole-brain fiber tracking, the T1-weighted images were first coregistered to the unweighted diffusion image in native DTI space by using a linear transformation. These coregistered structural images were then mapped to the MNI T1-template by applying an affine transformation with 12 degrees of freedom together with a series of nonlinear warps characterized by a set of basic functions. The inversed transformation (T−1) was used to warp the ROIs in AAL from the standard MNI space to the subject-specific diffusion space (Zhang et al., 2011).
Construction of SCN and FCN
In the study, the mean FA along connections related to the fiber integrity was used as the estimate of SC (Chu et al., 2018; Fagerholm et al., 2015). By computing the mean FA across regions, we obtained a weighted SCN for each participant. Edges in the SCN consisted of zero, demonstrating unconnected two regions (FA <0.15 along tracks if present), and nonzero, representing mean FA values along connected fibers. As for the construction of FCN, the regional time series based on AAL were first obtained by averaging the functional time series of all voxels in the ROI. Resting-state FC was obtained by calculating Pearson's correlation coefficients between the prepared time series from each pair of ROIs, providing an accurate measure of the interaction between two ROIs. The weighted edges in the FCN were finally considered FC values between pairs of connected ROIs. Importantly, all self-connections and negative connections (anticorrelations) would be removed from the FCNs before the following graph analysis (Rubinov and Sporns, 2010).
In this study, we adopted a sparsity threshold value (0 < sparsity <1) to set the threshold for all the SCNs and FCNs. Here, the sparsity was computed as the ratio of the number of actual connections divided by the maximum possible number of connections in the network (He et al., 2009). Thus, it normalized networks from different groups to have the same number of nodes and edges.
Network metrics
The graph-theory analysis was applied to measure the topological organization of FCN and SCN in all participants by using the graph theoretical analysis (GRETNA) toolbox at global and nodal levels, respectively. As the network measures are known to be sensitive to the network sparsity, we calculated topological properties over a range of network sparsity thresholds to guarantee high correlation coefficients of the remaining connections (range from 5% to 40% with an interval of 1%; Wang et al., 2019; Yuan et al., 2015). The following topological metrics were estimated for each individual graph: global efficiency E global, clustering coefficient (Cp), characteristic path length (Lp), and small-worldness σ; nodal degree centrality (DC), efficiency, and betweenness centrality (BC; see Supplementary Data for details).
In this study, based on these three nodal topological characteristics, network hubs were considered those nodes that had high DC, high efficiency, and high BC. Each of the three nodal parameters from a hub was at least one standard deviation greater than the average of the parameter over the network, representing the regions that were most highly connected and most central (Tian et al., 2011).
Measurement of SC–FC relationships
We then examined the relationship between SC and FC across whole-brain networks. As described in the previous study (Zhang et al., 2011), to calculate the coupling strength, we used the part of nonzeros to compute the correlation coefficient between FC and SC. These nonzeros of the structural connection matrix were extracted to produce a vector. Since the values of matrices between FCN and SCN were one-to-one correspondence, we could get a similar functional vector consisting of the functional values that corresponded with the nonzeros of the structural connection matrix. Pearson's correlation coefficient was computed to quantify the coupling strength between SCN and FCN derived from every subject. Furthermore, for each of the 90 × 89/2 region pairs, to investigate regional changes in the strength of SC–FC between mild TBI and control groups, we also calculated SC–FC correlations separately for each pair across all subjects in one group. Correlations were computed between single elements of SCN and FCN matrices in the diagnostic groups.
Statistical analyses
Statistical analyses were performed in SPSS 20.0. For each continuous variable, the normal distribution was measured by the Shapiro–Wilk test. The independent two-sample t-test and the Mann–Whitney test were used to compare group differences based on data normality, respectively. Chi-square analyses were applied to assess categorical variables. Between-group differences of network measures were determined by independent two-sample t-tests in the GRETNA toolbox, with age and sex as covariates. Group differences of characteristics in hub regions were specially tested at the fixed midnetwork sparsity = 20%. Moreover, repeated-measure analyses were performed for measurements of mild TBI patients using mixed linear models, with time as a fixed factor. Pairwise comparisons with a significant main effect of time were also conducted.
To explore the clinical relevance of altered brain network topologies in patients with mild TBI, we measured the correlated clinical variables with the topological properties using partial correlation analysis, controlling for age and sex as confounding variables. p-Value <0.05 was considered statistically significant, and false discovery rate (FDR)-correction was performed for multiple comparisons in all involved analyses.
Results
Demographic and clinical variables of participants
The data processing flow is shown in Figure 1. There were no significant differences between the original and replicated mild TBI samples in the key demographic variables and clinical assessments. Demographics and behavioral statistics for patients and controls are summarized in Table 2. Concerning neurocognitive assessments, patients with mild TBI presented significantly higher scores on PSS at the initial visit, compared with healthy controls (p < 0.001; Table 2). There were also significant differences in the performance of neurocognitive tests (TMT-A, p < 0.001; TMT-B, p < 0.013).
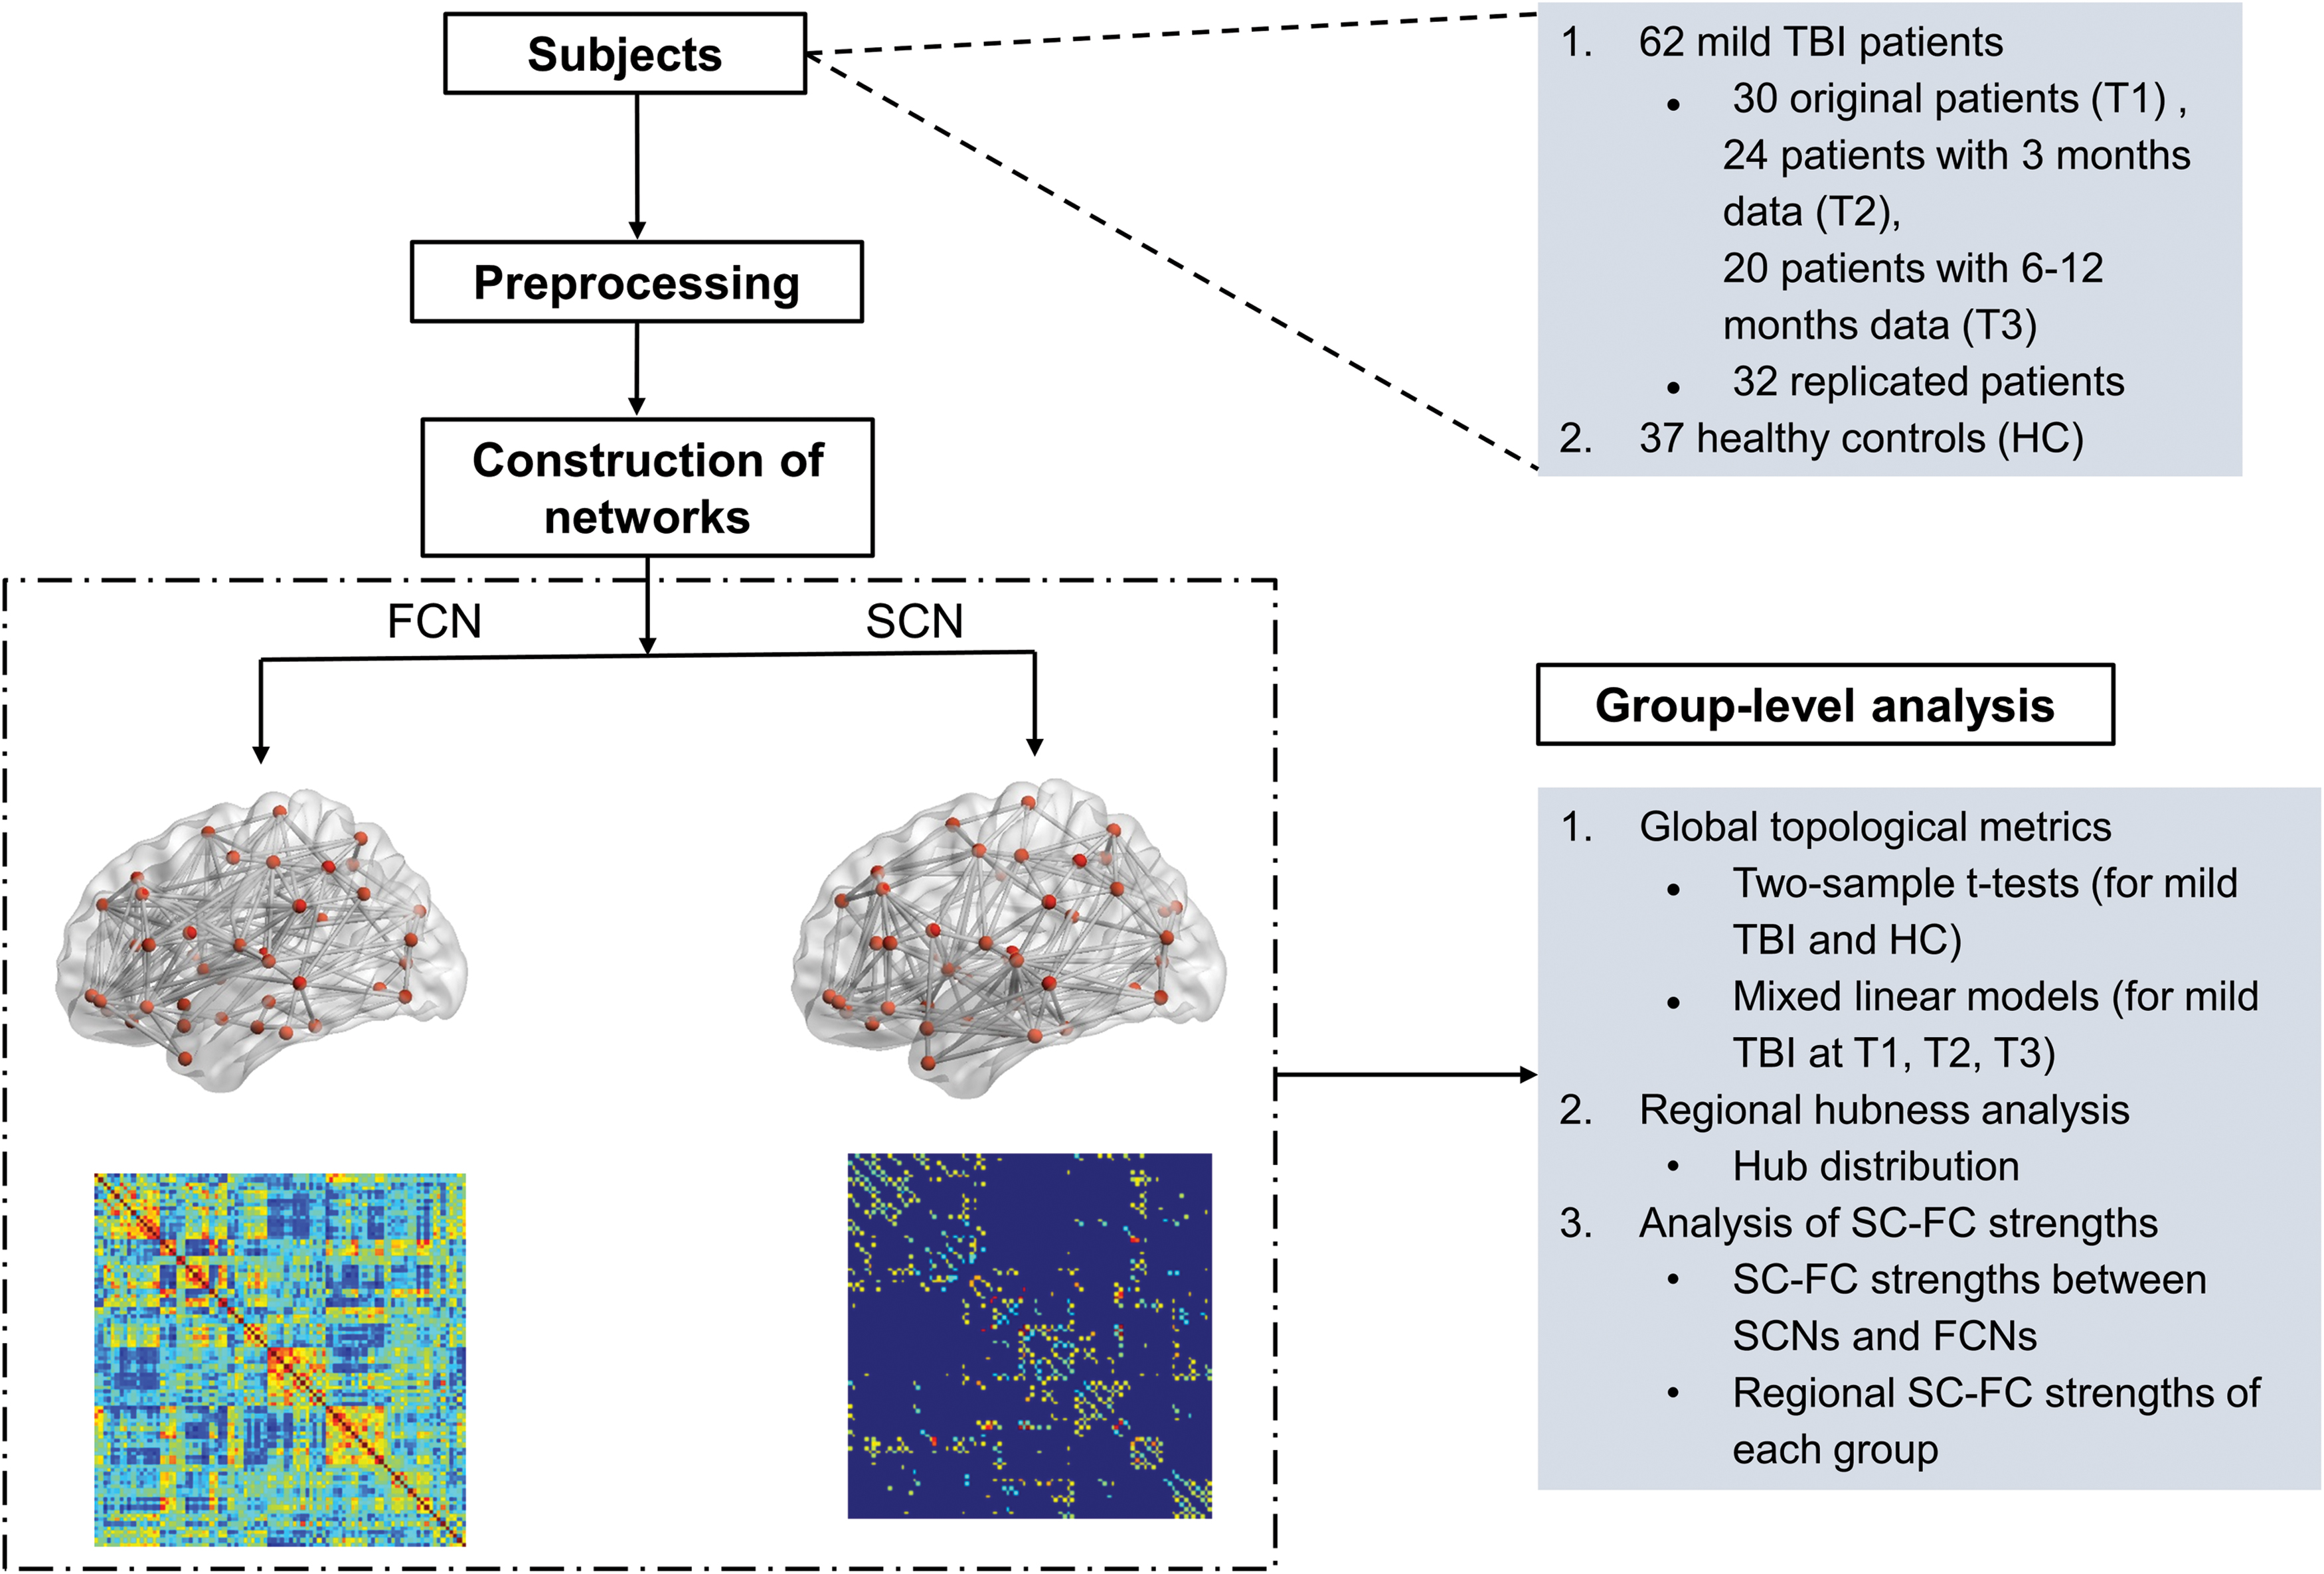
Data processing flow of the study. FC, functional connectivity; FCN, functional connectivity network; HC, healthy control; SC, structural connectivity; SCN, structural connectivity network; TBI, traumatic brain injury. Color images are available online.
Demographic and Neuropsychological Data for Mild Traumatic Brain Injury and Healthy Control Participants
Mann–Whitney U tests were used to compare group differences between mild TBIs and controls.
The p-values from tests between original mild TBIs and controls are <0.05 (PSS: Z = −5.565, p < 0.001; TMT-A: Z = −3.831, p < 0.001; TMT-B: Z = −2.512, p = 0.012).
The p-values from tests between replicated mild TBIs and controls are <0.05 (PSS: Z = −5.729, p < 0.001; TMT-A: Z = −4.701, p < 0.001; TMT-B: Z = −2.754, p = 0.006).
F, female; M, male; PSS, Postconcussive Symptoms Scale; TBI, traumatic brain injury; TMT-A, Trail Making Test, Part A; TMT-B, Trail Making Test, Part B.
Global topology of SCN and FCN
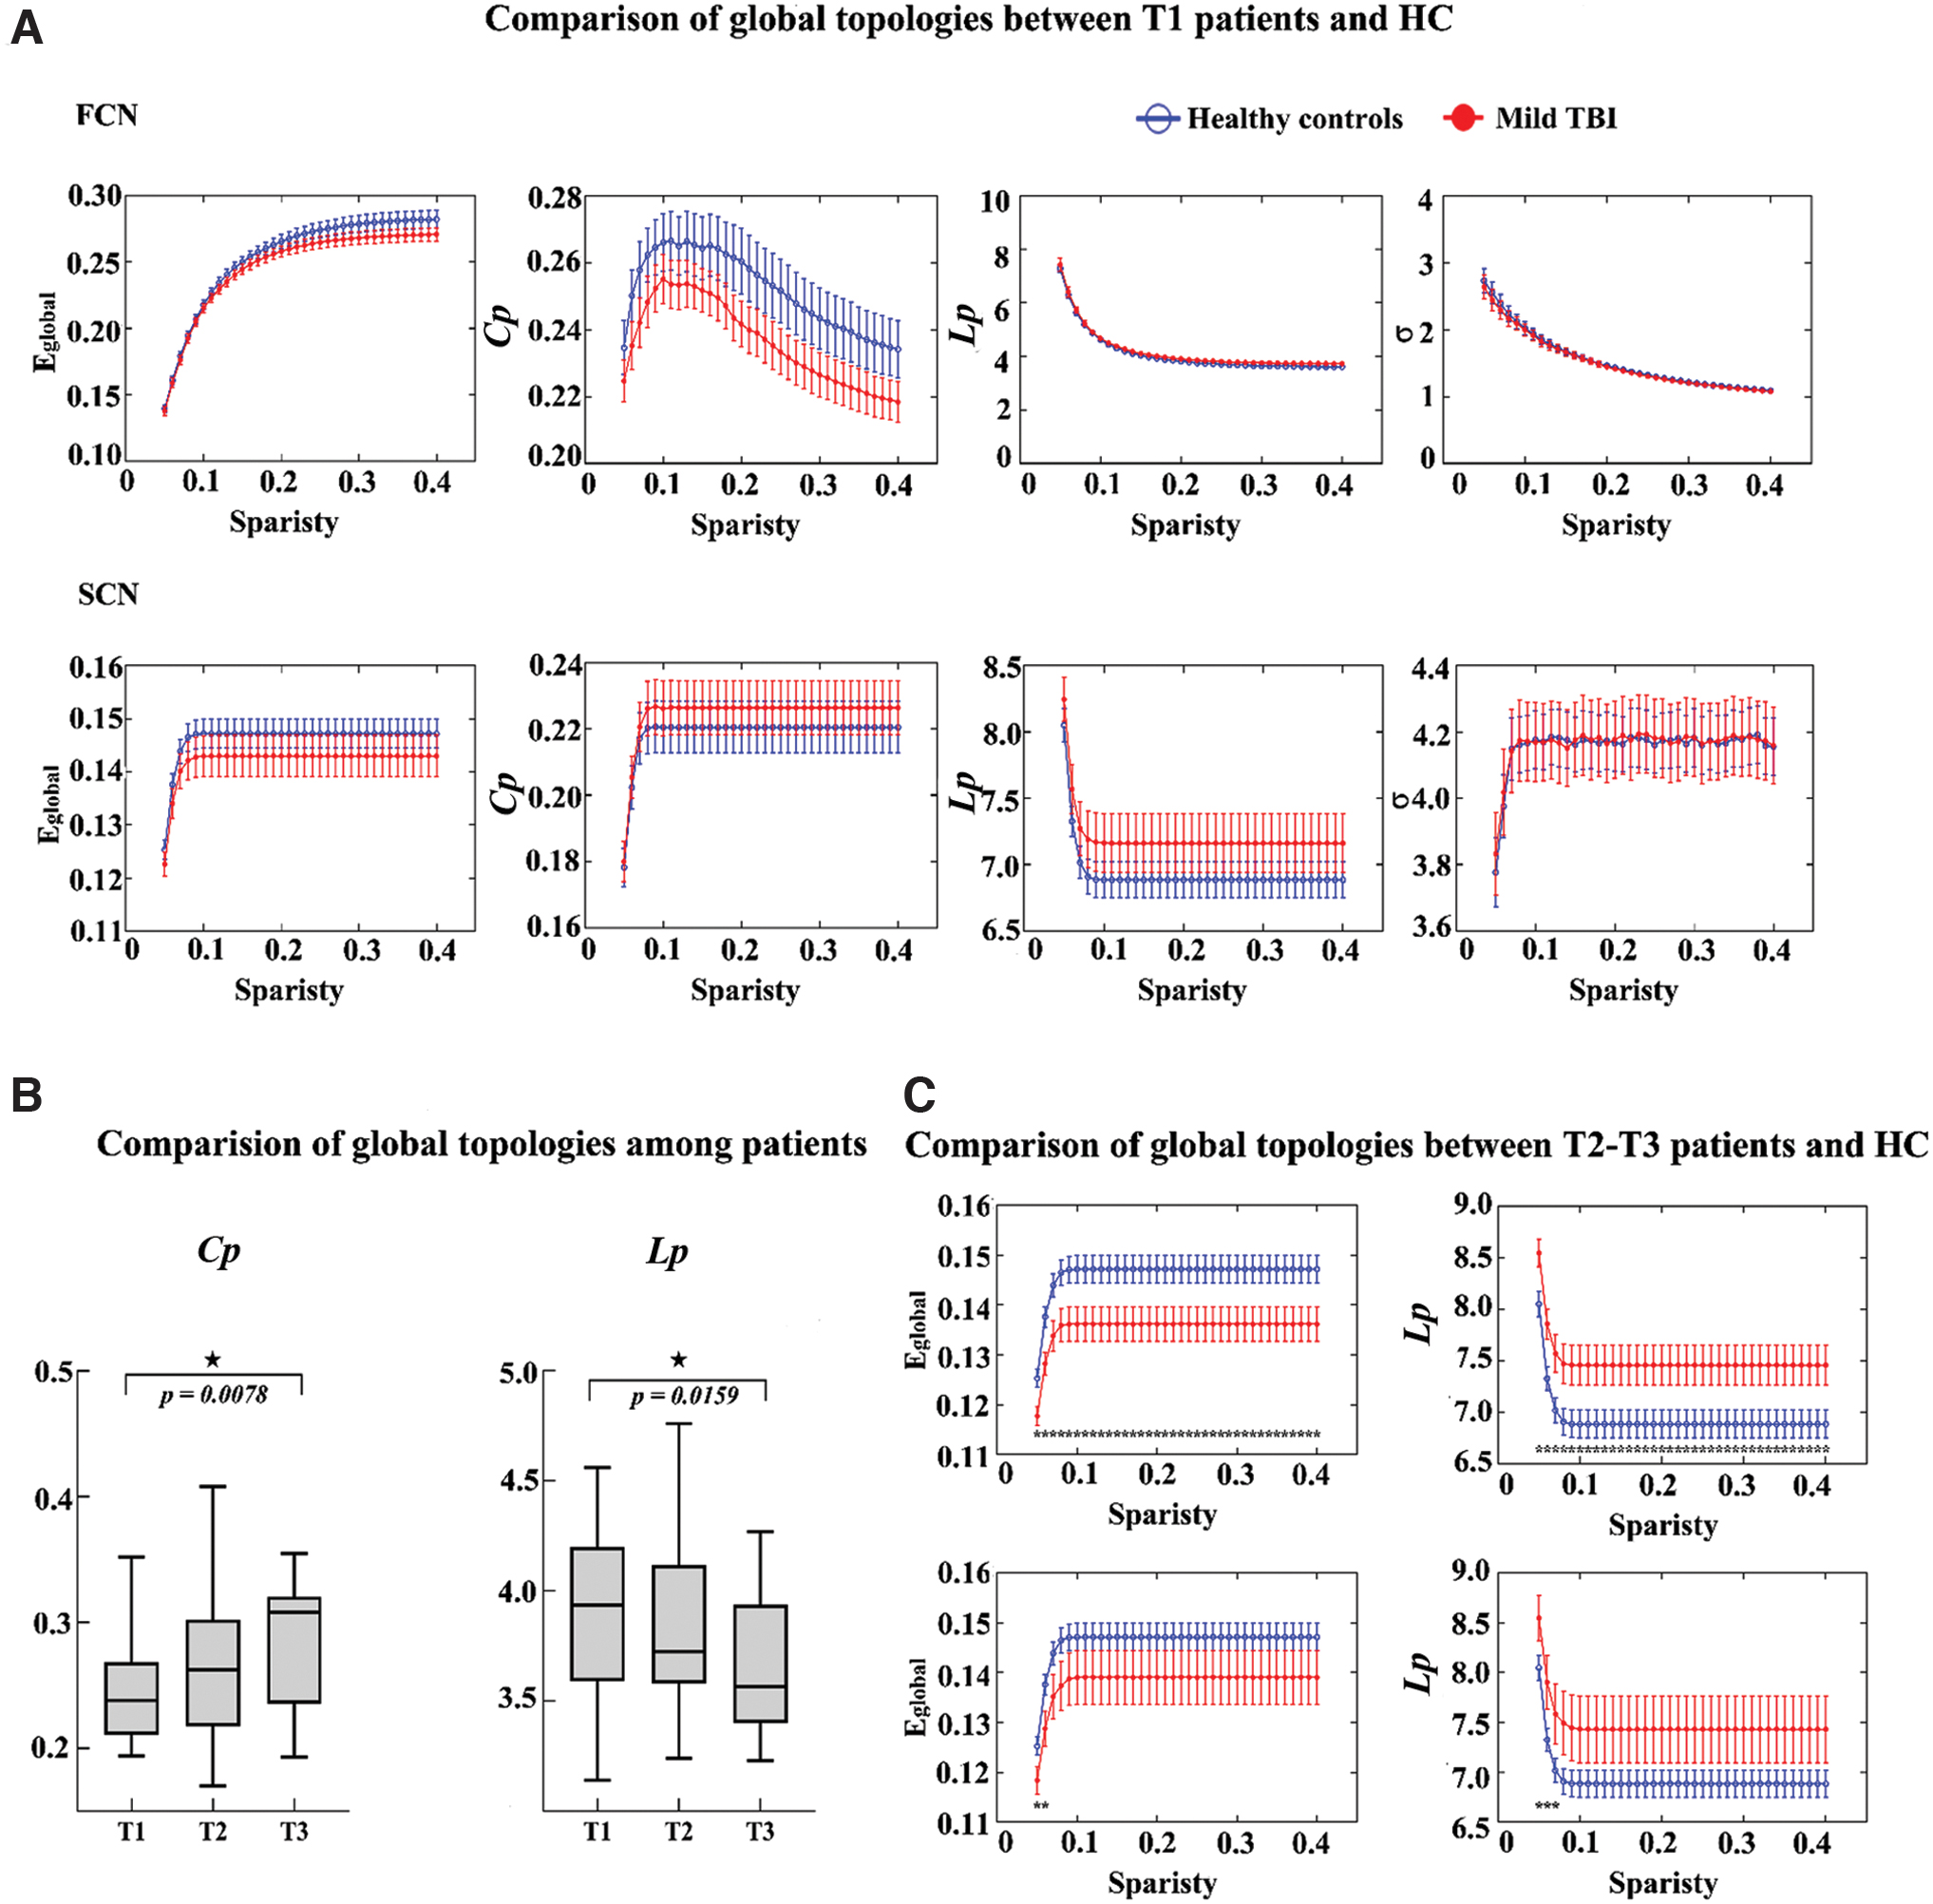
Both mild TBI patients and healthy controls showed the “small-world” architecture (σ > 1) in SCNs and FCNs (Fig. 2A). For the subacute stage, there were no significant alterations in all the global properties (Eglobal , Cp, Lp, σ) between mild TBI and healthy controls, either in the FCN or SCN. Similar results were also found in the replicated sample.
Changes of global network topologies on mild TBI and control groups.
Mixed linear models were conducted to examine changes in global properties as a function of recovery for mild TBIs, with age and sex as covariables. For the FCN, at the fixed wiring network (network density = 20%), there was a significant main effect of time in Cp (F = 4.779, p = 0.011) and Lp (F = 3.999, p = 0.023) among three periods after mild TBI (Fig. 2B). While for FCNs, the results did not indicate significant differences in any property in mild TBIs relative to controls at T2 and T3 (all p > 0.05). By contrast, significant changes of several properties (lower Eglobal and higher Lp) in the SCN existed in the later follow-up stages (T2 and T3) rather than at T1 in patients with mild TBI (Fig. 2C). In short, there were differential dynamic changes in the global properties for the FCN and SCN.
Regional hubness alterations in mild TBI
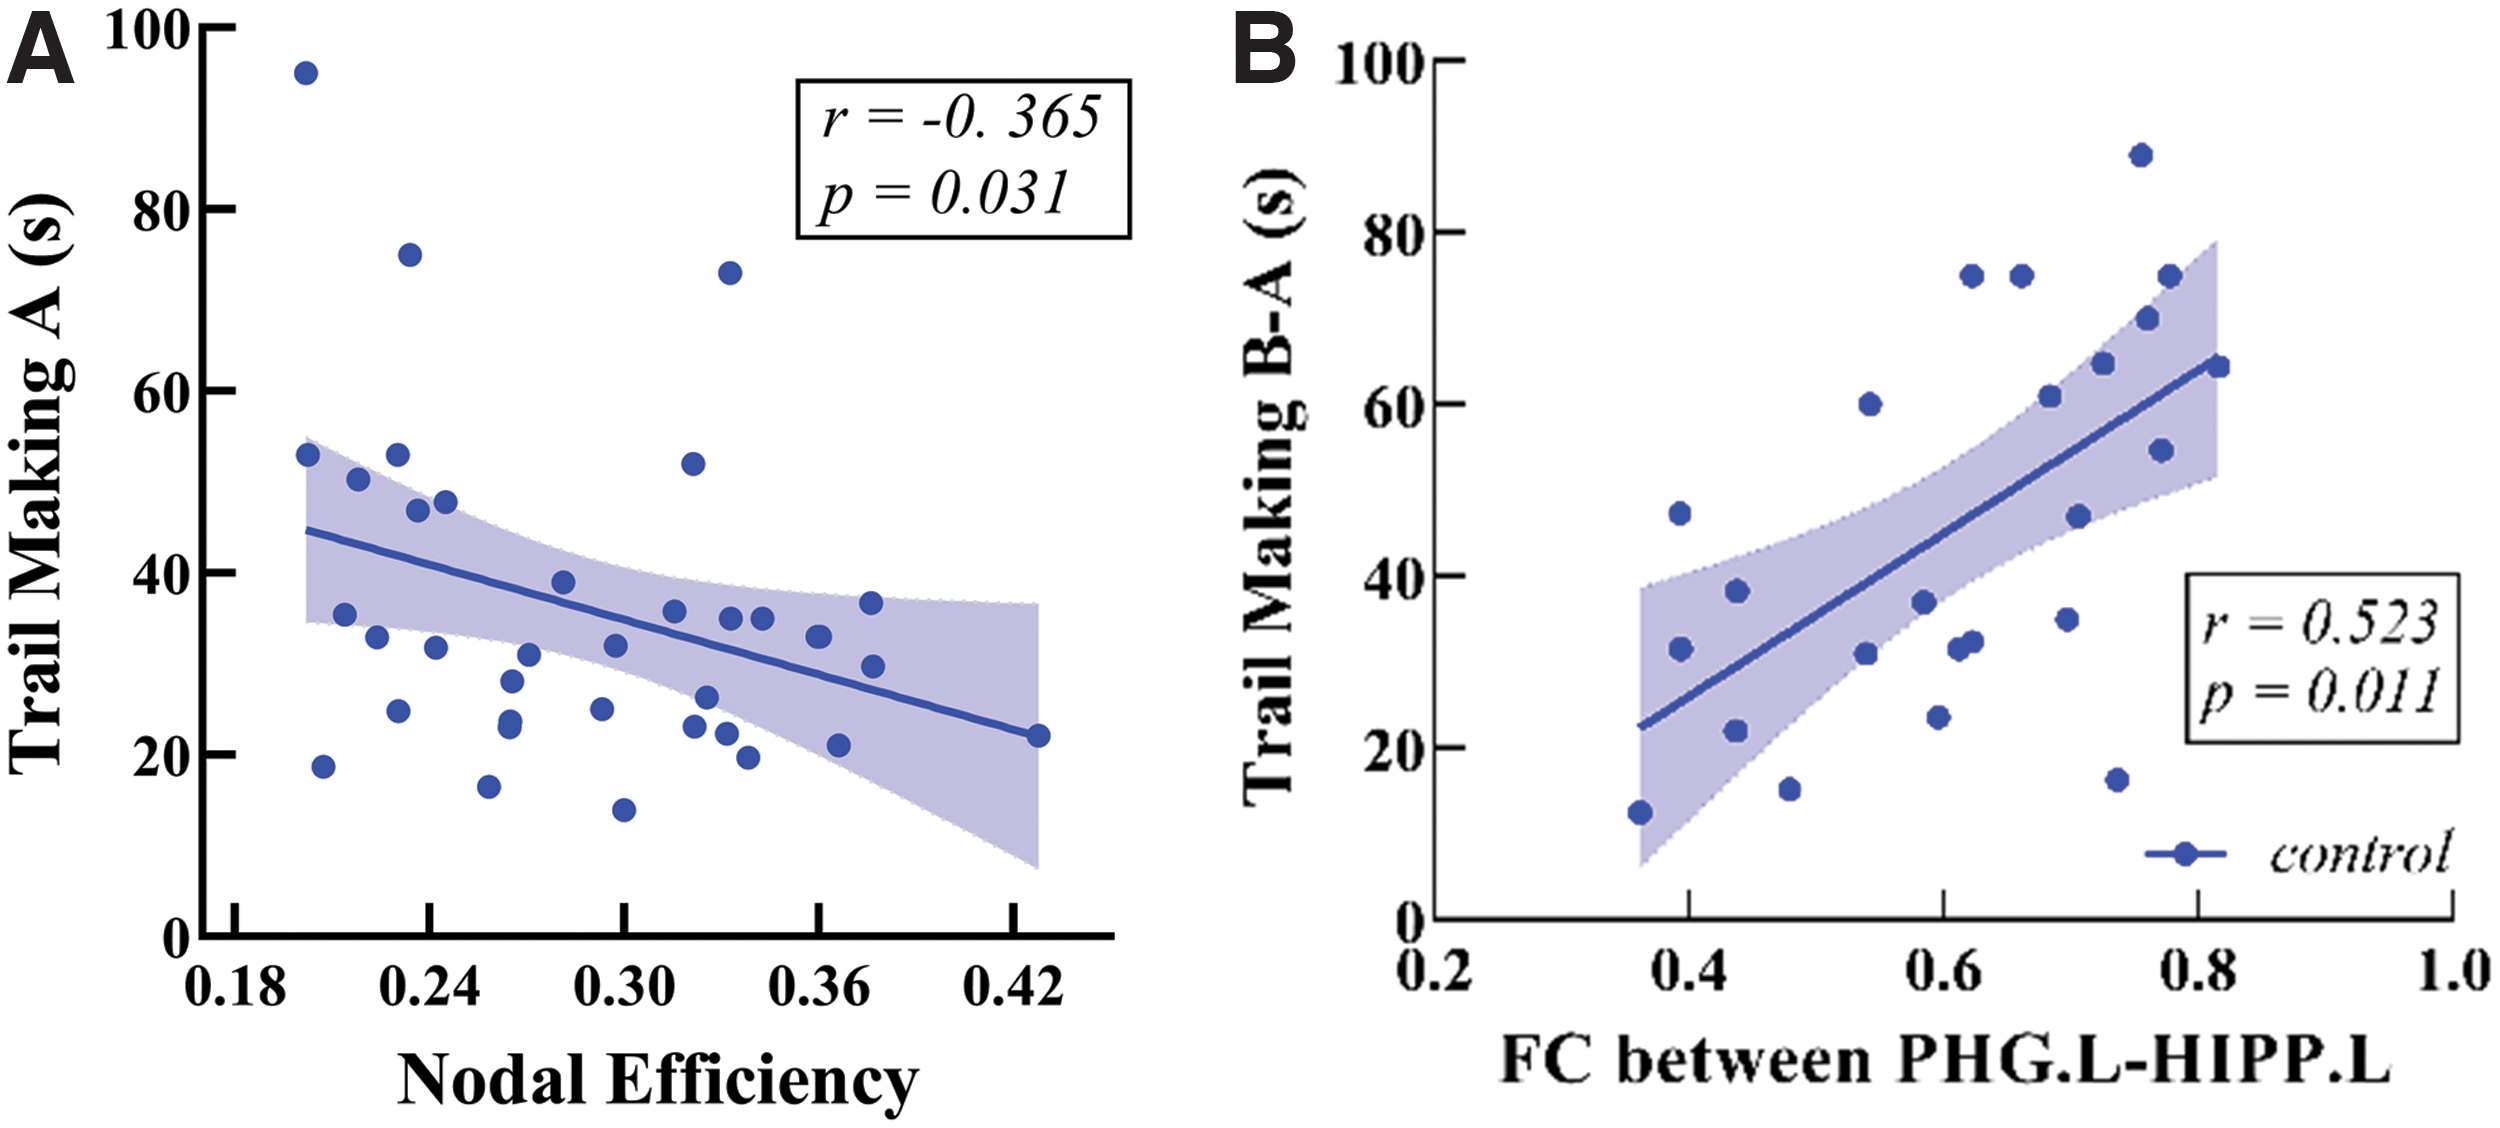
Measures of network topology from each individual node can also provide detailed information after injury. We then computed three centrality measures, characteristics weighted DC, efficiency, and BC, to identify hubs for both FCNs and SCNs at the fixed sparsity (20%). As shown in Figure 3, the distribution of hubs for either averaged FCN or SCN was estimated in both patients (Fig. 3A, B) and controls (Fig. 3C, D). Consistent with previous studies (Gong et al., 2009; Hagmann et al., 2008; Liang et al., 2013; Sporns, 2011), for either FCNs or SCNs, the most connected nodes in healthy controls were predominantly located in the bilateral precuneus (PreCN), left anterior cingulate, and paracingulate gyrus (ACG), bilateral insula, right medial-prefrontal cortex (MPFC), left superior temporal gyrus (STG), and bilateral hippocampus (HIPP) (Table 3). There was a significantly negative relationship between the TMT-A and the nodal efficiency in the right MPFC in healthy controls (r = −0.365, p = 0.031, Fig. 4A). The FC strengths between the parahippocampus gyrus and HIPP can further predict better individual performance on the cognitive IPS (r = 0.523, p = 0.011, FDR-corrected; Fig. 4B).
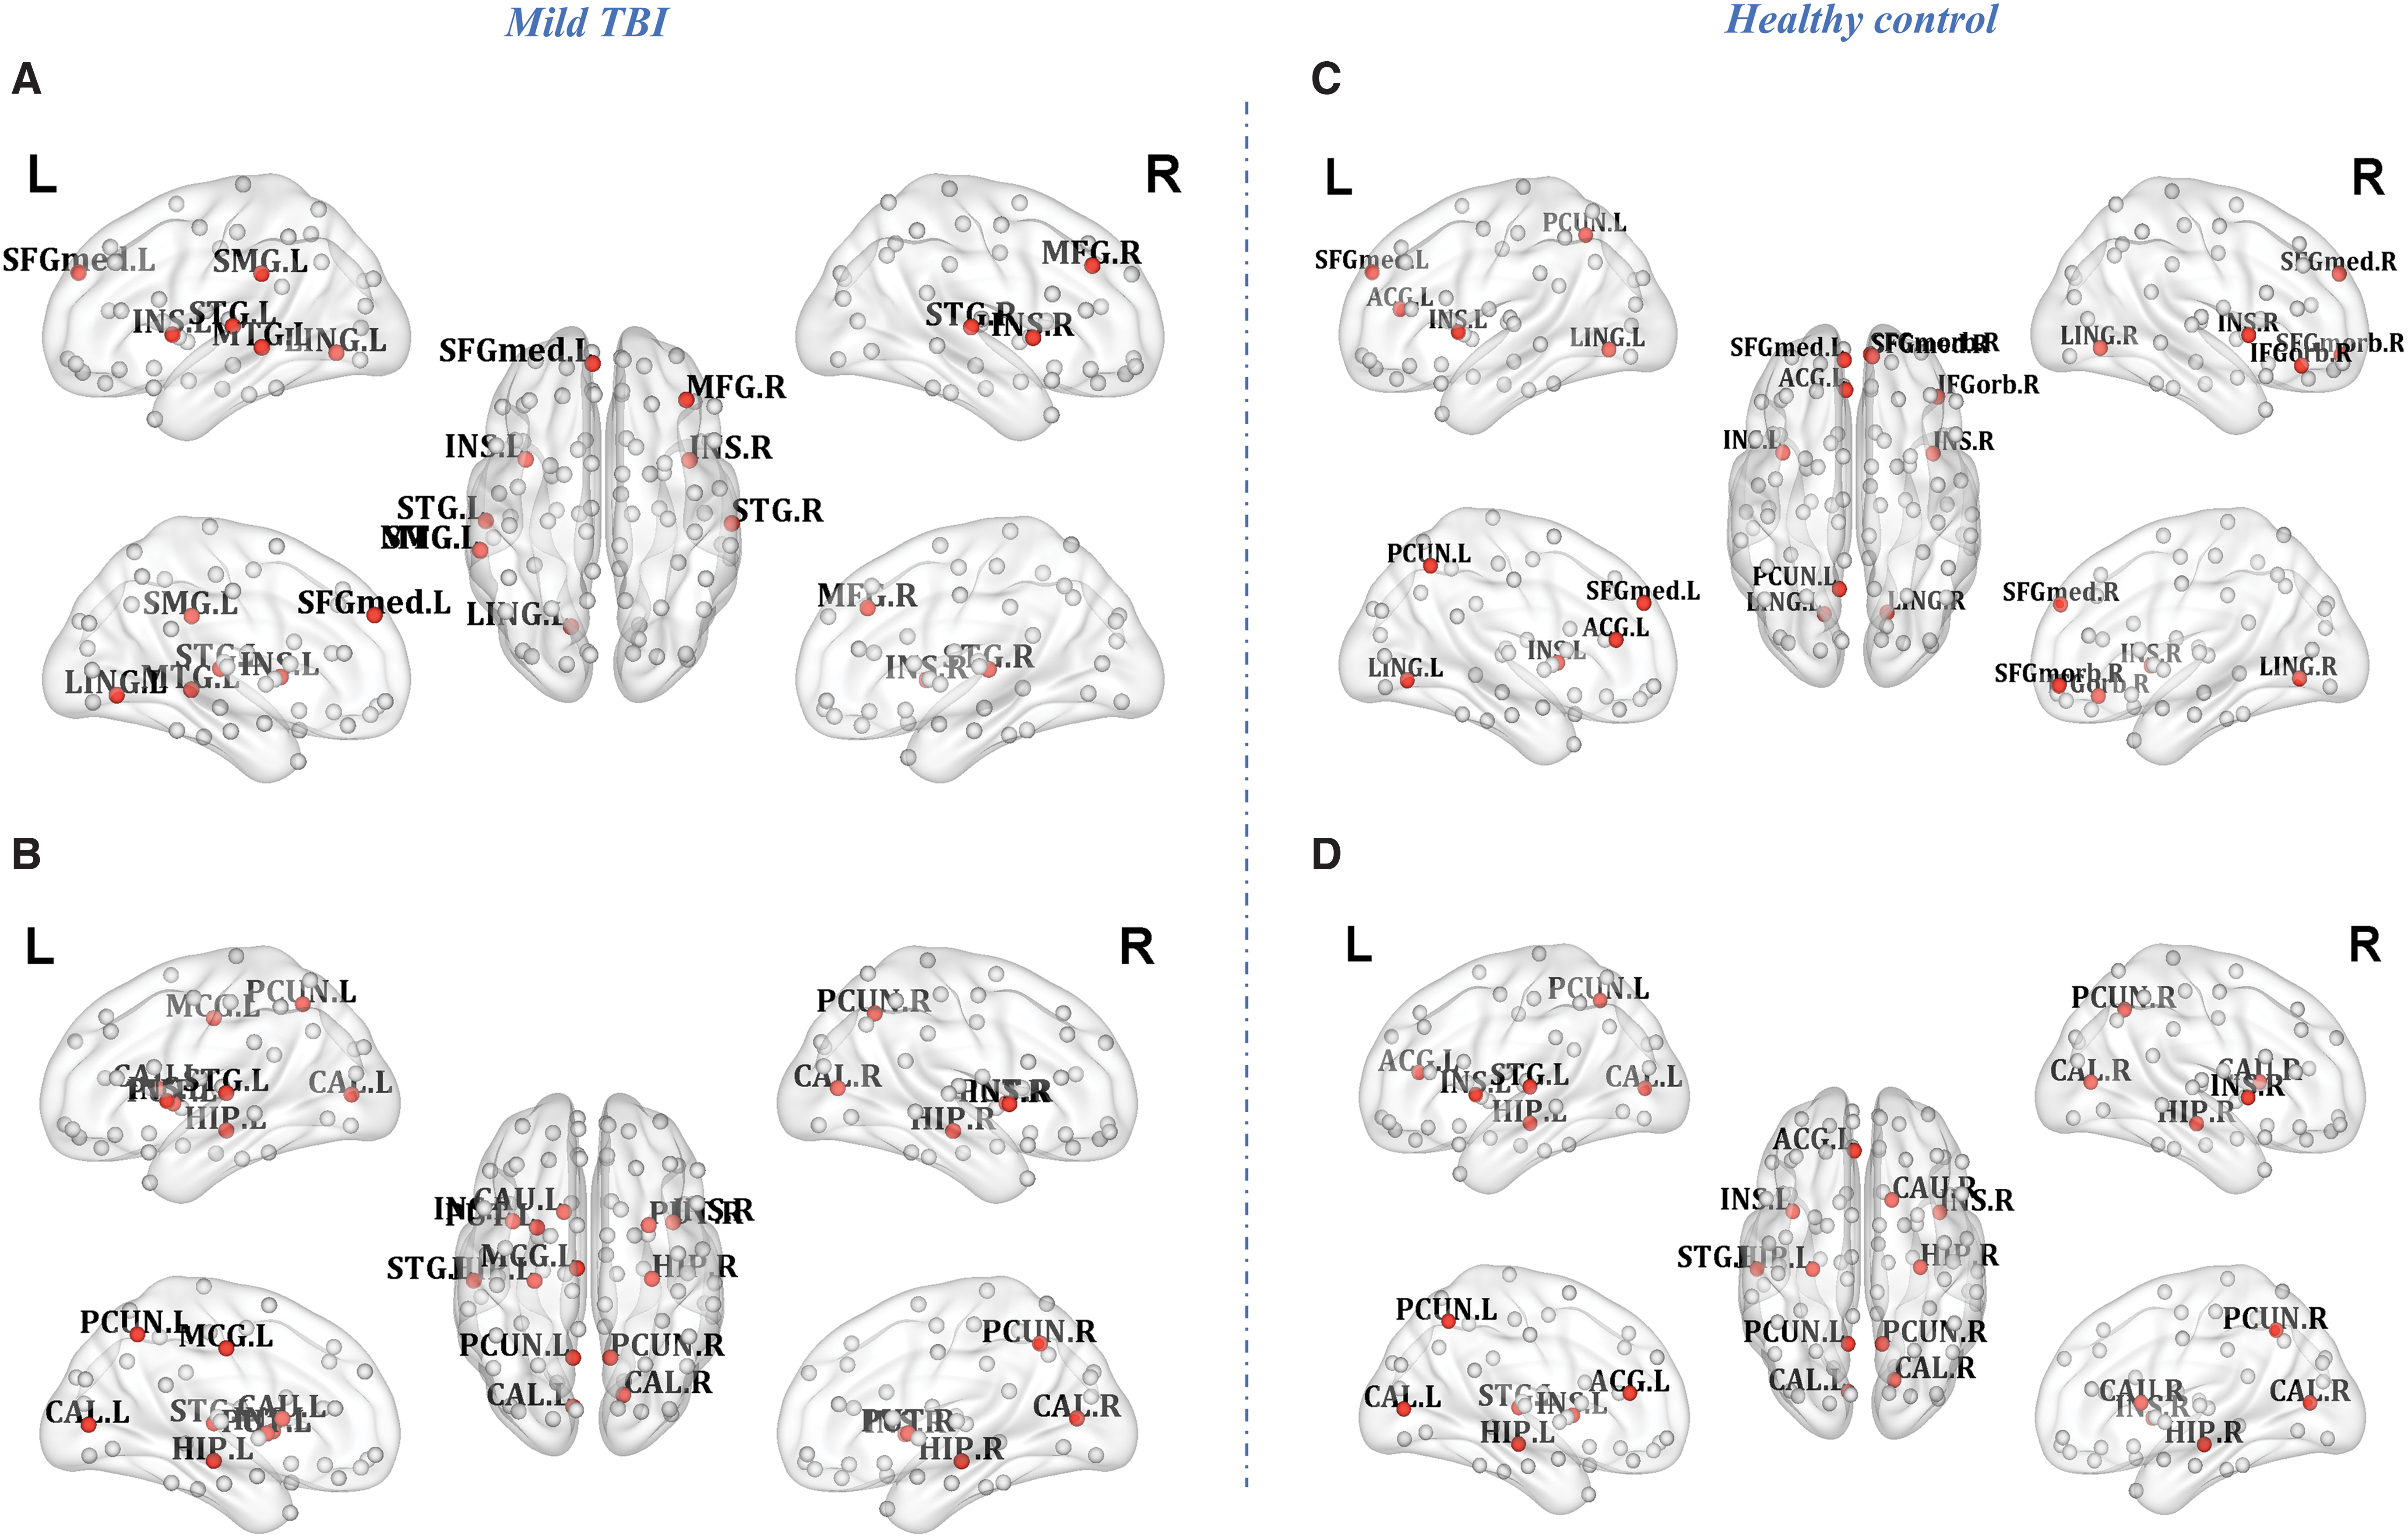
Hub regions identified by characteristics of nodal weighted degree, efficiency, and betweenness centrality of FCN
Relationship between network characteristics and neuropsychological performance.
Hub Regions of High Degree Centrality, Efficiency, Betweenness Centrality in Mild Traumatic Brain Injury and Healthy Control Groups
L, left hemisphere; R, right hemisphere.
Compared with healthy controls, the change of nodal topology in mild TBI was clearly represented by the analysis of hubness. Some of the nodes measured as the hubs in the healthy volunteer network showed the nonhubness in patients with the greatest reduction in both degree and BC (the right MPFC for the FCN), whereas some of the nonhub nodes in the volunteer network showed the greatest increase of centrality in the patients to become the hub (left STG and right MFG for the FCN; left MCG and bilateral putamen for the SCN). Of which, the left STG with a low-centrality nonhub in the normal group became a high-centrality hub in the patient group and kept stable in patients persisting over 1 year postinjury (Table 3).
Altered coupling between SCN and FCN
Consistent with previous studies (Hagmann et al., 2010; Skudlarski et al., 2008), FC values were significantly positively correlated with SC values across each pair of brain regions across the whole brain for each participant. Mixed linear models were conducted to examine the SC–FC coupling strengths as a function of time in the mild TBI group. There was a significant main effect of time for the SC–FC coupling strengths (F = 3.376, p = 0.043). For pairwise comparisons, the SC–FC coupling strengths were significantly higher at T1 than that of the T3 (p = 0.038) following least significant difference (LSD) tests.
The SC–FC coupling strengths from patients were next compared with that of healthy controls. The results indicated no significant difference in the SC–FC coupling strengths in patients relative to controls at T1 (t = 0.286, p = 0.776), while with significant decreases at T2 (t = −2.112, p = 0.039) and T3 (t = −3.717, p = 0.0005). The SC–FC coupling strength measured from replicated subacute patients was also similar with original group at T1 (t = 1.398, p = 0.169), and had no significant changes compared with controls (t = 1.442, p = 0.154; Fig. 5A). Moreover, it was found that the SC–FC coupling strength was negatively correlated with patients' postinjury days (r = −0.328, p = 0.0006; Fig. 5B).
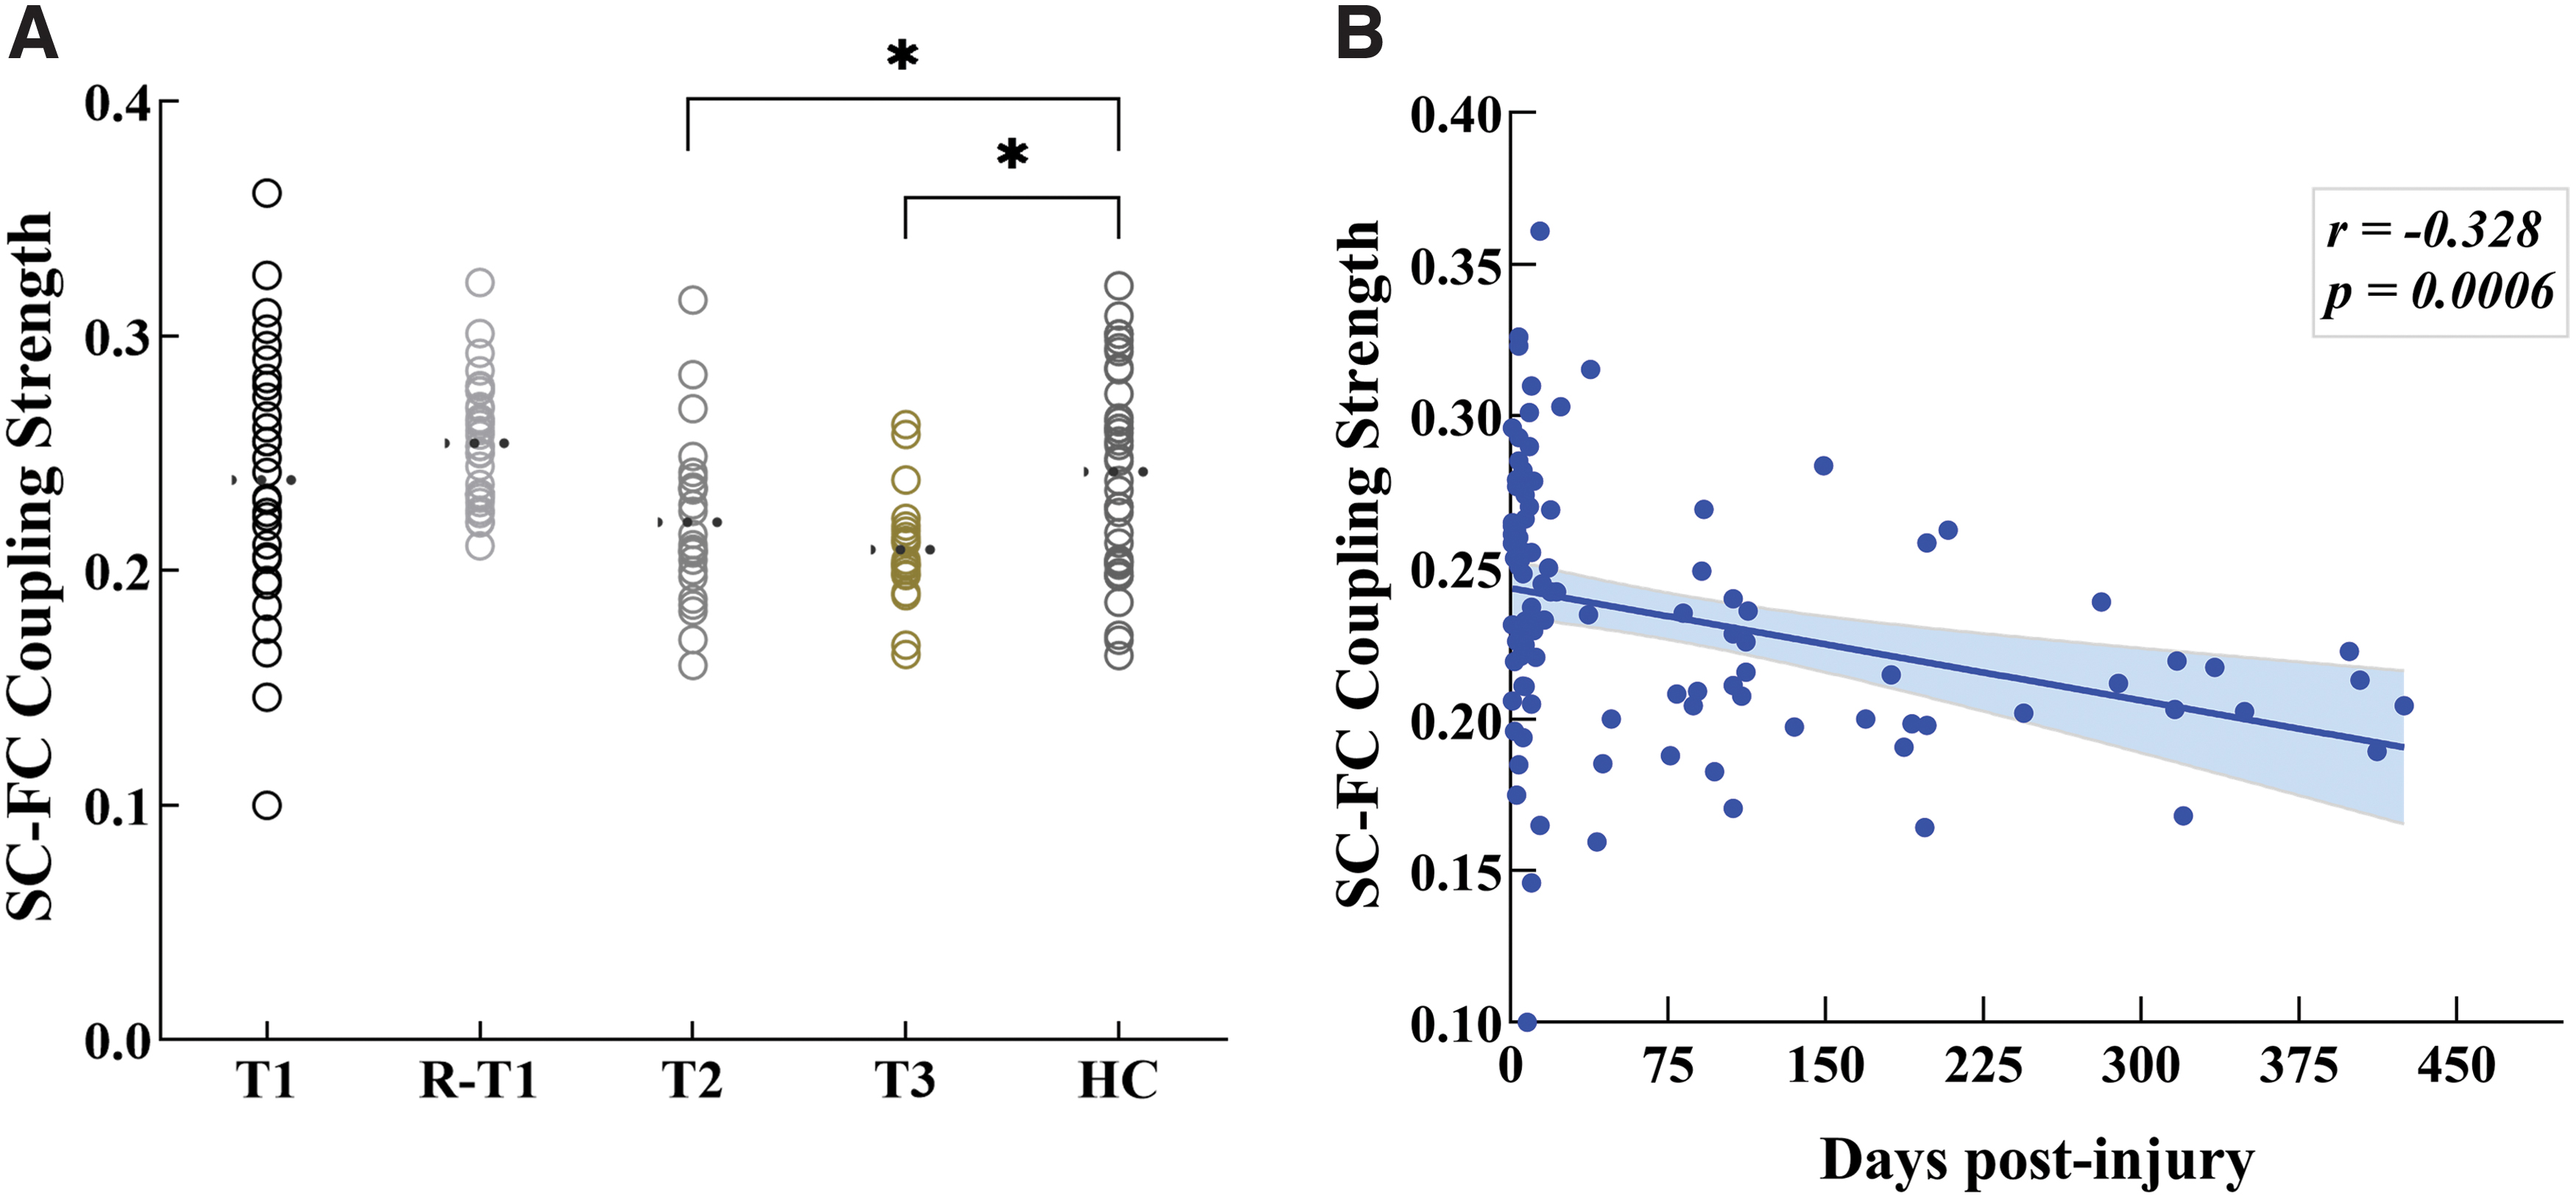
Disruption of SC–FC relationships in mild TBI as a function of recovery.
In addition, the coupling strengths of SC–FC between each pair of regions were all measured for 90 × 89/2 regions over all subjects in each group. There were salient between-group changes in SC–FC coupling strengths at some region pairs. In some regions, such as the precuneus and lingual gyrus, the patients had significantly reduced coupling strengths, whereas these measures were significantly increased in patients in other regions such as insula and SFGmed. This pattern of abnormally increased or decreased coupling strengths could be summarized by plotting the value at each pair in the healthy volunteer group versus the difference between patient and control groups at each pair (Fig. 6).
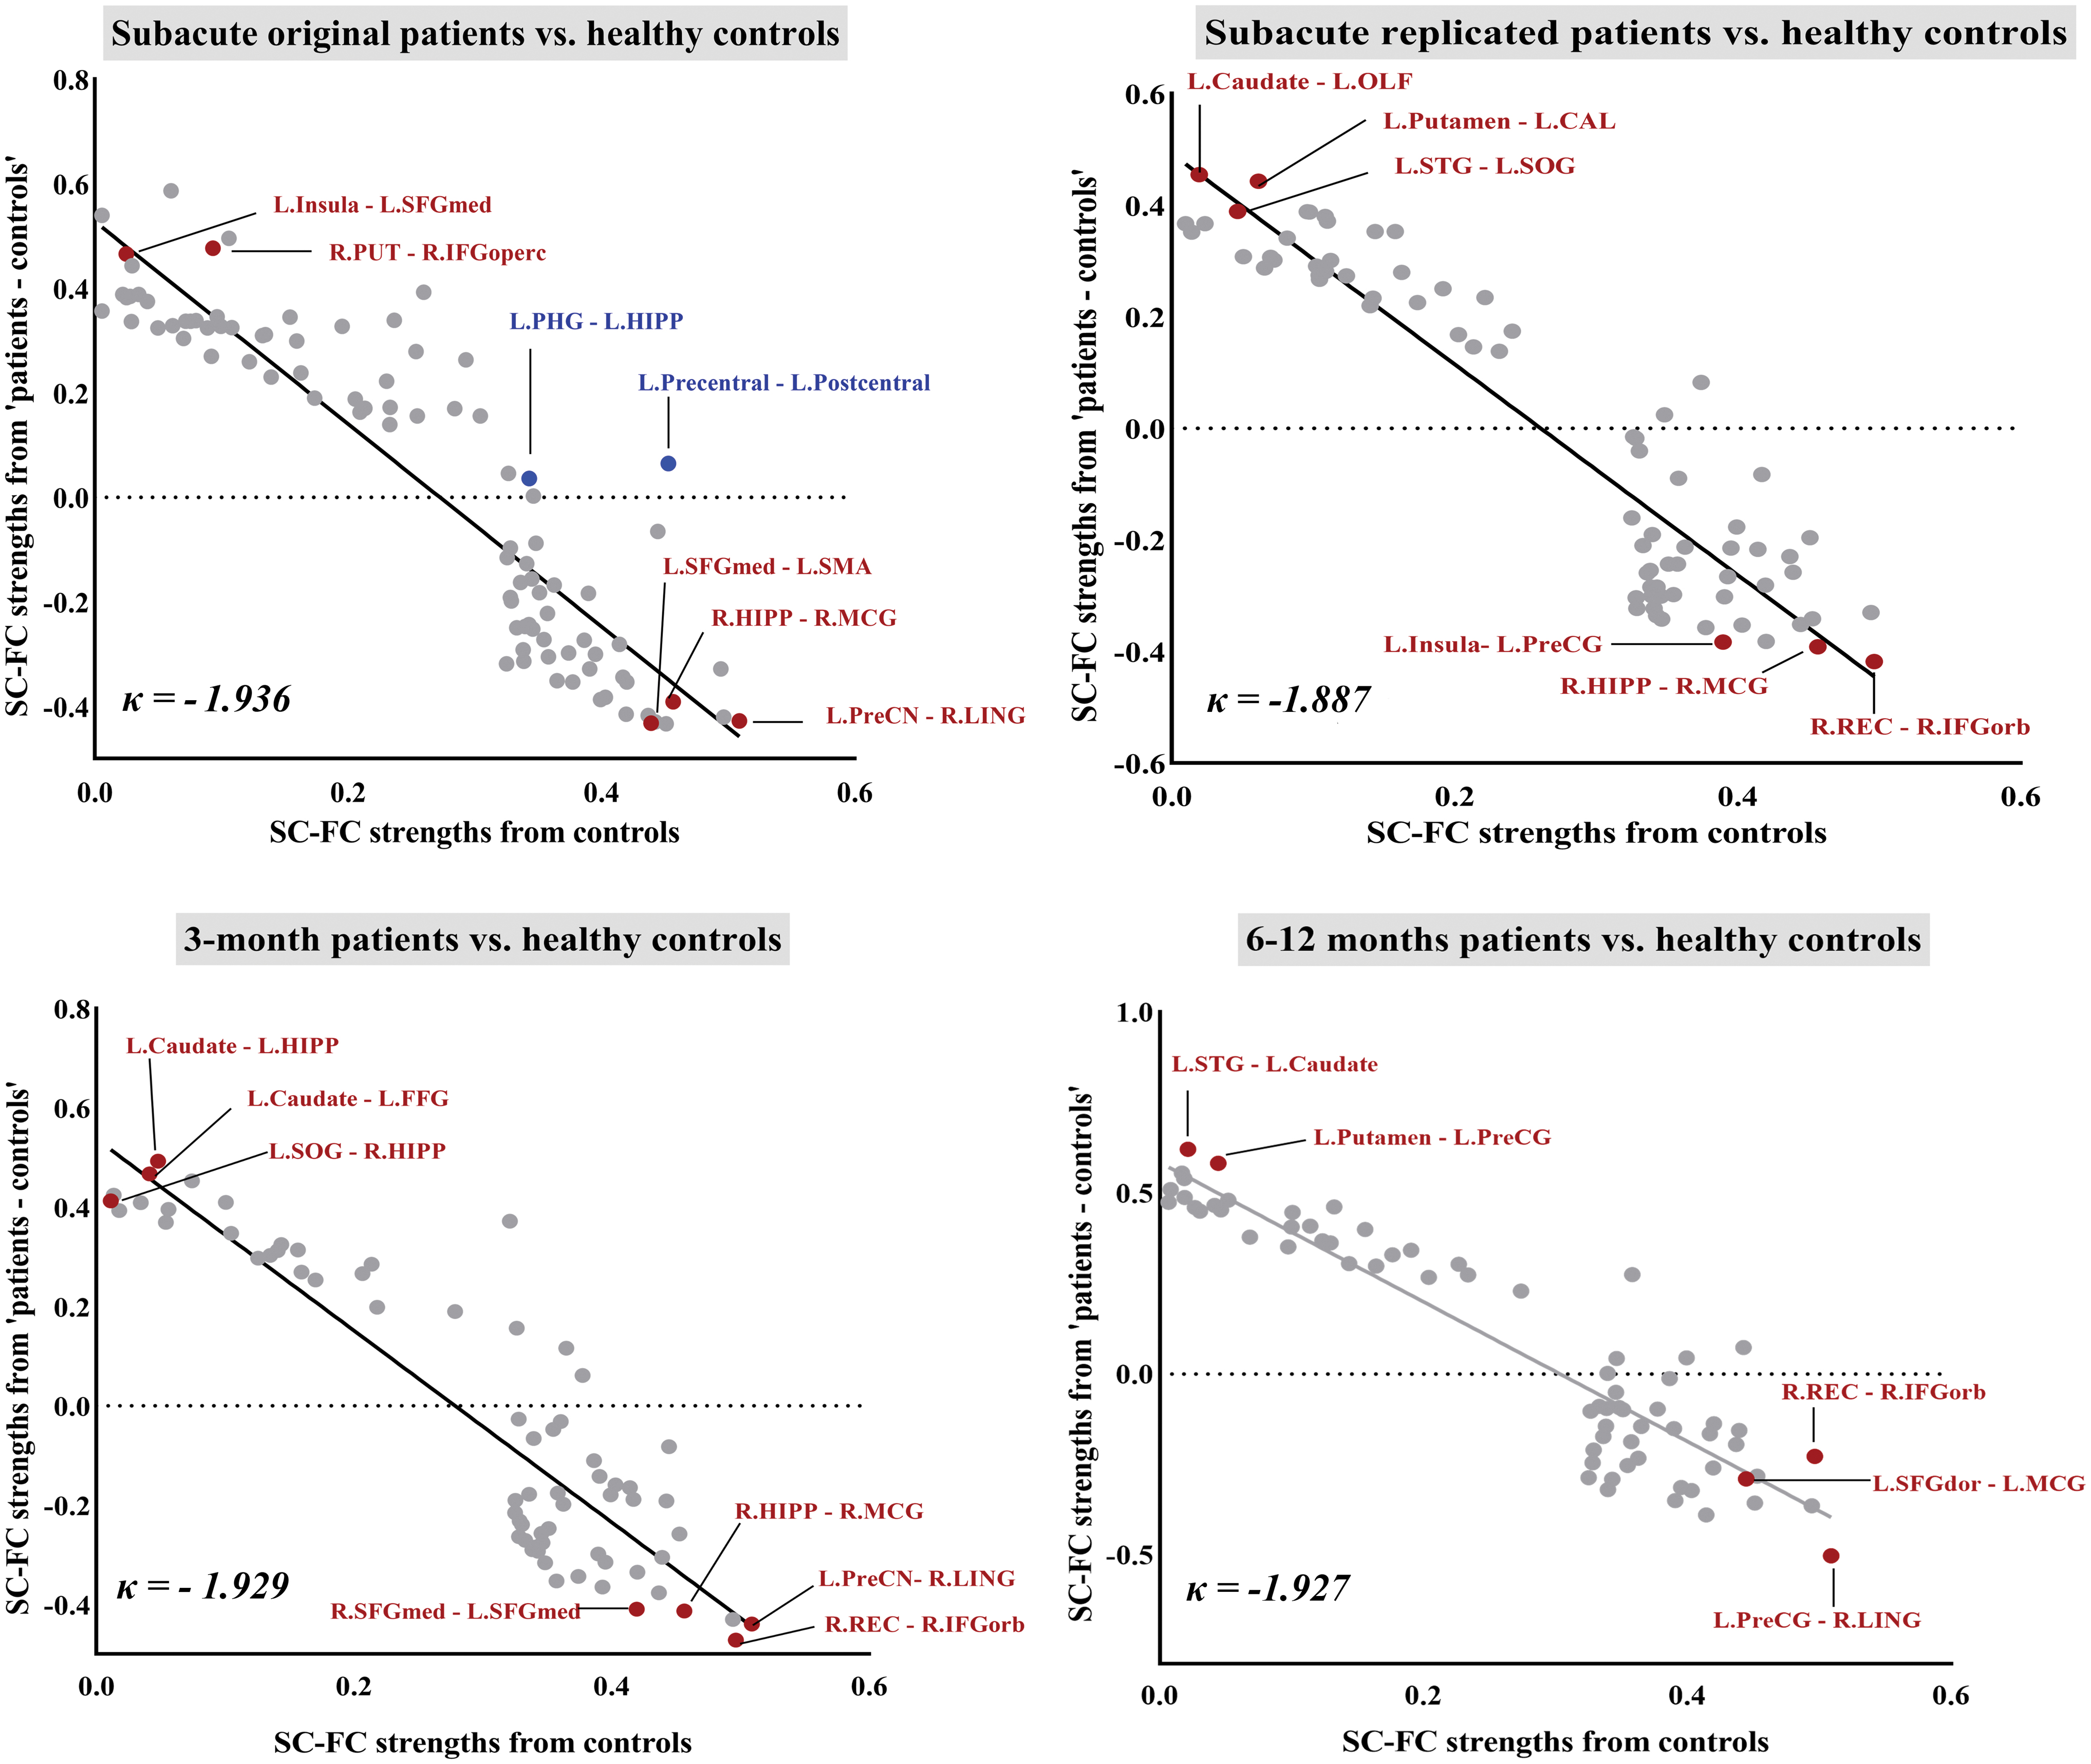
The interregional SC–FC coupling strengths across the whole brain in the healthy controls (x-axis) were plotted versus the difference between groups in each pair of regions of <patients> – <controls> (y-axis). The dots only showed significantly correlated SC–FC coupling strengths from pairs of regions in both groups. Patients with mild TBI at the subacute phase exhibited the disruption of the interregional SC–FC coupling across the whole brain described as a negative index κ = −1.936 (R 2 = 0.83). This result showed the same tendency in the replicated mild TBI group (κ = −1.887, R 2 = 0.86). For the longitudinal examinations, these SC–FC coupling disruption indices derived from the mild TBI kept stable for follow-up at both 3 (κ = −1.929, R 2 = 0.81) and 6–12 months (κ = −1.927, R 2 = 0.86). Red dots indicated these regions were identified as hub regions. Blue dots denoted the significant decoupling region pair. Color images are available online.
We defined a measurement, denoted κ, as the gradient of a straight line fitted to these changes. This coefficient can be defined as a disruption index, as it measures the way the SC–FC coupling strengths are radically reorganized compared with controls, with increased strengths in some regions and decreased in others. In this way, this measure indicated a significant negative disruption index, κ ≃ 2; in other words, the SC–FC pair of certain regions that had the highest coupling strength in controls showed the greatest decrease in mild TBI patients, whereas the SC–FC pair of certain regions that had the lowest coupling strengths in controls showed the greatest increase in patients. We found that SC positively correlated with FC between certain regions in both healthy controls and subacute mild TBI, but without correlation in patients at both T2 and T3. These SC–FC decoupling regions were especially displayed between the left precentral gyrus and postcentral gyrus, as well as the left parahippocampal gyrus and HIPP.
Discussion
The combination of simultaneously measured SC and FC was the first study to indicate that mild TBI patients displayed significantly reduced global efficiency in the SCN, while global properties were conserved for the FCN. Despite the absence of evident difference in any global measurement of FCN, the salient disruption was mainly located in the regional nodal properties. We found evidence for a radical reorganization of high degree or highly efficient “hub” nodes. Cortical regions that were hubs of healthy brain networks had typically become “nonhub” of mild TBI brain networks and vice versa. Combining both measures for coherence analysis allowed for a more detailed examination of this process, we found the coupling strengths of SCN and FCN were significantly decreased in mild TBI, and this decrease was more salient in patients with a longer postinjury day. The work provided preliminary evidence that the index coherence of FC from its anatomical background may be a potential biomarker underpinning the recovery of mild TBI and provided a new avenue to understanding its persistent physiological changes.
The first main finding was the absence of significant differences between the groups of mild TBI patients and healthy controls on global measurements of FCN topology. Similar key findings of conserved global properties were also replicated even using an independent sample with subacute mild TBI by identical experimental protocols. These results demonstrated that global functional network properties were homeostatically conserved following mild TBI even after 6–12 months of injury. Indeed, there are prior studies demonstrating conservation of fundamental network properties. A previous study has stated that properties of global functional networks are conserved in patients following major brain injury, including global efficiency, clustering, and small-worldness (Achard et al., 2012). It may be explained that the overall topological properties were largely invariant because small-worldness was preserved in the FCN (Wen et al., 2011).
At the level of global network description, the brain has several organizational features in common with other substantively diverse but topologically isomorphic complex systems. Human brains are generally organized as complex networks with two main principles, segregation and integration. Therefore, brain networks can renegotiate trade-offs between cost and efficiency dynamically over short and long timescales (Bullmore and Sporns, 2012). Thus, it is not unexpected that brain networks should conserve qualitatively similar topological properties even following brain injury.
The disruption of small-world characteristics may have an important impact on network efficiency. Some researchers have shown that TBIs (mostly moderate-severe TBIs) present a shift away from small-world characteristics, resulting in impaired global properties (Pandit et al., 2013). The differences in results from ours may be the composition of the subjects. In our study, all involved patients had mild TBIs, without moderate-severe TBIs. When compared with other neurology disorders, some prior researches also indicate the relative conservation of global network characteristics—such as “small-world” property in post-traumatic stress disorder and Alzheimer's disease (Martensson et al., 2018; Niu et al., 2018). However, it is notable that in most network studies of clinical disorders, there have been some quantitative differences between patient and control groups in the value of global network parameters. For example, patients with Alzheimer's disease have reduced global efficiency (Supekar et al., 2008), whereas patients with schizophrenia have reduced clustering (Lynall et al., 2010). In contrast, the patients with mild TBI in this study were not quantitatively distinguishable from the normal comparison group on any global measure of functional network organization.
On the contrary, brain injuries in the current study caused a reorganization of characteristics only in the structural network, and the robust small-world characteristics were found in the FCN as a kind of compensatory. We found evidence of global property changes mainly in the structural networks in patients at a later 3-month period, indexed by both reduced global efficiency and increased characteristic path length. Consistent with a previous study (Caeyenberghs et al., 2012), the higher path length and lower global efficiency are associated with the widespread loss of structural connections in mild TBI patients and accompanied by worse performances in cognitive processing speed (Wen et al., 2011). In addition, since such structural changes were found about 3 months postinjury, it suggested that reorganization/remodeling of the human brain network was a process of dynamic changes rather than a static state.
From exploring both the global topological characteristic and regional changes, we suggest that global changes were not sufficient to explain the reorganization brain network required for mild TBI. Importantly, the analysis of network hub regions that mapped to particular anatomical areas of cortex is beneficial to understand the brain alternations following mild TBI more completely. As our finding listed here, there was consistent evidence for highly significant abnormalities in patients with mild TBI. It can be summarized as a disruption of hub rank order. The region such as the MPFC (SFGmed, SFGmorb), as a high-centrality hub in the normal brain functional network, became nonhub in the mild TBI brain network, whereas the left STG, as a nonhub region in the normal group, became a high-centrality hub in the patient group even over 1 year postinjury. Such higher-to-lower pattern of degree reduction in the mild TBI group had been revealed in a previous MEG study (Antonakakis et al., 2020). Our results were in line with this study, presenting reduced nodal degree within the frontoparietal and prefrontal cortex in mild TBI groups than healthy controls.
Both human SC and FC have indicated that brain hubs are predominantly located in the posterior cingulate cortex/precuneus, MPFC, and lateral temporal and parietal cortices (Gong et al., 2009; Hagmann et al., 2008; Tomasi and Volkow, 2010). Most of these brain areas were located within the default-mode network (DMN), which exhibits a high level of metabolism at rest (Ralchle and Snyder, 2007). We found a reduced hubness of the MPFC (SFGmed, SFGmorb), a key region in the DMN, whose activity is linked to plastic rearrangements because of secondary neuropsychiatric changes after TBI (Schwarzbold et al., 2008). An MEG study had also stated that the mean node degree within the DMN was stronger for the healthy controls than the mild TBI group (Antonakakis et al., 2020). The right SFGmed, part of MPFC in our result, was further shown to be positively correlated with the cognitive IPS (negatively correlated with TMT-A) in the centrality measure of efficiency in healthy controls. The IPS is a core cognitive construct that mediates other cognitive functions such as working memory and is highly vulnerable to mild TBI associated with the dysfunction of the MPFC (McAllister et al., 2001).
In normal state, FC and SC are convergent in various levels ranging from single cortical slice (Koch et al., 2002) to local resting-state networks (Greicius et al., 2009; van den Heuvel et al., 2008, 2009) or even to large-scale, whole-brain networks (Hagmann et al., 2008, 2010; Honey et al., 2009). It is suggested that structural connections are highly predictive of, and place constraint on, functional connection. While the breakdown in functional communication among brain areas may result in compensatory or plasticity changes other than the anatomical disruption of neuronal fibers. Previous studies find that FC–SC coupling can be configured under physiological (Hagmann et al., 2010) or pathological states (Zhang et al., 2011).
In our study, there were differential dynamic changes in the topological properties for the FCN and SCN. Global properties of FCN were conserved following mild TBI, while a reorganization of characteristics was found only in the SCN. Thus, the results showed a decoupling phenomenon between SC and FC in patients with mild TBI. Patients generally experienced an acute crisis of traumatic events, and it is noted in previous studies that functional network hubs tend to be metabolically more expensive, for example, having higher rates of cerebral blood flow, aerobic glycolysis, and oxidative glucose metabolism (Liang et al., 2013; Tomasi et al., 2013; Vaishnavi et al., 2010), than nonhubs (Bullmore and Sporns, 2012). Therefore, the abnormal SC–FC coupling strengths of hub nodes may reflect the putatively greater susceptibility of hub nodes to metabolic or oxidative stress. Oxidative stress is one of the key mechanisms involved in neuronal damages after acute TBI, which may restrict neuronal metabolism and thus might be expected to have a disproportionate impact on the most metabolically active hub nodes.
Moreover, our result that the reduced importance of normal hubs was approximately balanced by the increased importance of normal nonhubs is unique in the context of mild TBI studies. We found abnormally increased importance of cortical nodes in two main regions, such as the STG and MFG. There have been no prior reports of abnormally increased connectivity or degree of individual cortical areas in patients with subacute mild TBI, but such hub reorganizations have been previously described in Alzheimer's disease (where connectivity between frontal nodes is increased; Supekar et al., 2008; Yao et al., 2010). After acute TBI, the process is initiated soon after injury and relies on the GABAergic disinhibition of secondary pathways between undamaged brain regions that were not used during the normal functioning of the brain (Chen et al., 2002; Hagmann et al., 2010).
Several limitations of our study are noteworthy. The study used a multi-imaging analysis to capture the dynamic coupling features between SCN and FCN to avoid some ambiguities in a single modality measurement. Axonal injury after mild TBI may occur at the boundaries between white and gray matter, and these areas of damage might not be identified by our tractography analysis. Then it could lead to a kind of overestimation of tract integrity in our study (Fagerholm et al., 2015). It would be important for further work to investigate the possibility and make it more accurate by using advanced methods. Else, the limitations of using empirical thresholds based on the metric of interest may lead to a fully connected graph containing potentially spurious connections. Statistical filtering is required to identify such spurious interactions in future work and the remaining interactions need to undergo topological filtering (Antonakakis et al., 2017; Dimitriadis et al., 2017).
Conclusions
In conclusion, from the above findings, we found that the global properties homeostatically conserved in the FCN, while altered in the SCN in patients with mild TBI. Besides, the specific details of topological features (i.e., network hubs) presented a topological-to-spatial reorganization occurring at particular anatomical areas of the cortex and their locations were distinct for the FCN and SCN. The SC–FC coupling strength was also disrupted in mild TBI, especially in later periods, at follow-up 3 and 6–12 months postinjury.
Footnotes
Acknowledgments
The authors thank the families for their participation. They are also grateful for the assistance of partners in the hospital for helping with recruitment and data collection.
Authors' Contributions
L.B. had full access to all the data in the study and takes responsibility for the integrity of the data and the accuracy of the data analysis. Study design and conception: L.B. Acquisition, statistical analysis, or interpretation of data: all authors. Drafting of the article: S.W. and L.B. Critical revision of the article for important intellectual content: all authors.
Author Disclosure Statement
No competing financial interests exist.
Funding Information
This research was supported by the National Natural Science Foundation of China (Grant Nos. 81771914, 81871993, 82071331, and 81671671), the Fundamental Research Funds for the Central Universities (Grant Nos. xjj2018229 and xzy022019045) the Clinical Research Center For Medical Imaging In Hunan Province (2020SK4001), and the Changsha Science and Technology project (Grant No. kq1801115).
Supplementary Material
Supplementary Data
References
Supplementary Material
Please find the following supplemental material available below.
For Open Access articles published under a Creative Commons License, all supplemental material carries the same license as the article it is associated with.
For non-Open Access articles published, all supplemental material carries a non-exclusive license, and permission requests for re-use of supplemental material or any part of supplemental material shall be sent directly to the copyright owner as specified in the copyright notice associated with the article.