
Abstract
Aim:
The aim of this study was to investigate basic task-functional magnetic resonance imaging (fMRI) or resting-state fMRI (rs-fMRI) results on Sprague Dawley (SD) rats and Wistar rats under three anesthetic regimens.
Introduction:
SD rats and Wistar rats are the two-most commonly used rat strains in medical research and neuroimaging studies. It still lacks a direct comparison of basic task-fMRI and rs-fMRI results between the Wistar rats and SD rats under different anesthetic regimens.
Methods:
Two rat strains and different time points were adopted to investigate task-fMRI activation and rs-fMRI functional connectivity (FC) results under three kinds of anesthetic regimens (2–2.5% isoflurane only, dexmedetomidine bolus combined with a continuous infusion, and dexmedetomidine bolus combined with 0.3–0.5% isoflurane). The electrical forepaw stimulation method and seed-based FC results were used to compare the task-fMRI brain activation and rs-fMRI FC patterns between the two rat strains.
Results:
The results showed that Wistar rats had more robust brain activation in task fMRI experiments while exhibiting a less specific interhemispheric FC than that of SD rats under the two dexmedetomidine anesthetic regimens. Moreover, even low-level isoflurane could significantly affect task-fMRI and rs-fMRI results in both rat strains.
Conclusions:
SD and Wistar rats showed different brain activations and interhemispheric FC patterns under the two dexmedetomidine anesthetic regimens. These results may serve as reference information for small-animal fMRI studies.
Impact statement
Our study demonstrates different stimulation-induced blood oxygen level-dependent responses and functional connectivity patterns between Sprague Dawley rats and Wistar rats under three anesthetics. This study provides some reference results for different anesthetics' effects on different rat strains in different functional magnetic resonance imaging modalities.
Introduction
It is common practice to anesthetize rats in animal functional magnetic resonance imaging (fMRI) experiments to avoid excess head movement during scanning. However, there are always concerns about neural suppression or changing of neurovascular coupling of the brain under anesthesia (Han et al., 2019). Anesthetic regimens such as α-chloralose or medetomidine have been shown to maintain a good neurovascular coupling in rats and yield robust stimulation-related brain activation in rat fMRI experiments (Hyder et al., 1994; Weber et al., 2006). Other studies have reported on the integrity of resting-state functional connectivity (RSFC), which may also be important in the physiological processes of the brain (Grandjean et al., 2014; Nasrallah et al., 2014; Pawela et al., 2009). Medetomidine and its isomer dexmedetomidine are α2 adrenoceptor agonists and are regarded as good choices for longitudinal task-fMRI or resting-state fMRI (rs-fMRI) studies using Sprague Dawley (SD) rats (Zhao et al., 2008). Furthermore, Brynildsen and colleagues (2017) showed the efficacy of these α2 adrenoceptor agonists when combined with low-level isoflurane in a long rs-fMRI protocol (longer than 2 h) using SD rats (Lu et al., 2012). A recent study by Sirmpilatze and colleagues (2019) also investigated the impact of different medetomidine administration protocols on rat fMRI results.
RSFC analysis is the most popular analysis strategy for rs-fMRI studies. RSFC is also the foundation for brain functional network analysis, which has been used to investigate functional organization and pathological changes of the brain (Carter et al., 2012; Chen et al., 2014; Fox and Raichle, 2007; Fox et al., 2005; Geng et al., 2017). The temporal correlation of blood oxygen level-dependent (BOLD) signals in bilateral motor areas of the brain was used as a classic example of functional connectivity (FC) (Biswal et al., 1995). A regional-specific bilateral FC pattern in homologous brain regions is always preserved in awake healthy human brains. In the study of Zhao and colleagues (2008), SD rats showed a well-preserved symmetrical bilateral FC pattern in homologous brain regions. However, further research needs to be completed to determine the extent that this region-specific bilateral pattern can be preserved under different anesthetic regimens.
SD rats and Wistar rats are the two-most commonly used rat strains in medical research and neuroimaging studies. However, the impact of anesthesia on brain physiology is complicated and varied greatly under different genetic backgrounds. There is no direct comparison between basic task-fMRI and rs-fMRI results in these two rat strains under different anesthetic regimens. In our animal fMRI experiment, we modified the anesthetic regimen of Lu and colleagues' (2012) study, which combined dexmedetomidine sedation (initial bolus and continuous infusion) with low-level isoflurane (0.3–0.5%) by excluding the continuous infusion part. We regarded the modified anesthetic regimen as a simplification of Lu and colleagues' (2012) method and also provide adequate dosage to keep the two rat strains immobilized in the MRI scanner for nearly 2 h.
In this study, we demonstrated the feasibility of performing rs-fMRI experiments on SD and Wistar rats under the modified anesthetic regimen of dexmedetomidine, and we compared stimulation-related task-fMRI responses in both SD and Wistar rats under three different anesthetic regimens. Furthermore, we strived to quantify region-specific interhemispheric FC patterns and compare them between SD and Wistar rats under three different anesthetic regimens.
Materials and Methods
Our animal experiments were approved by the Southeast University Institutional Animal Care and Use Committee and were conducted in accordance with the approved guidelines.
Animal preparation
A total of 24 male SD rats (229.4 ± 11.13 g) and 24 male Wistar rats (227.12 ± 13.44 g) were used in this study (T = 0.643, p = 0.523). All the rats were equally and randomly allocated into three groups. The animal anesthetic procedures are summarized in Table 1. All rats were initially induced with anesthesia using 4–5% isoflurane for ∼2 min in a small chamber. Afterward, they were moved to an animal bed in the MRI scanner positioned prone, and immobilized using a bite bar and two ear bars. The rats were kept anesthetized with three different anesthetic regimens, which included 2–2.5% isoflurane (IFR group, n = 16), initial intramuscular dexmedetomidine bolus (0.025 mg/kg; Sigma) combined with continuous infusion [0.05 mg/(kg·h)] of dexmedetomidine (MED group, n = 16), and initial intramuscular dexmedetomidine bolus (0.025 mg/kg; Sigma) combined with 0.3–0.5% isoflurane (MED&IFR group, n = 16). In the MED group, continuous subcutaneous infusion of dexmedetomidine started at ∼10 min after the rats were positioned in the scanner, and isoflurane was discontinued at the same time. Isoflurane was administered via a nose cone with room air. The rats were free breathing without ventilation.
Anesthetic Protocols
All the rats were initially induced to anesthesia with 4–5% isoflurane for about 2 min in a small chamber. After they were moved to the animal bed and immobilized, rats were kept anesthetized with three different anesthetic regimens according to their groups. For rats in MED&IFR group, the concentration of isoflurane for keeping anesthesia was set to 0.3% at the beginning and changed to 0.5% when the respiratory rate of rats reached 80 beats per minute. The adjusting parts of MED group takes about 3–5 min, so we would wait untill 10 min reached in three groups to begin scanning.
IFR, isoflurane; MED, dexmedetomidine; SD, Sprague Dawley.
MRI scanning
Rats in each group underwent a task-fMRI (electrical forepaw stimulation) session and an rs-fMRI session. The interval between these two sessions for each rat was at least 3 days. Except for the IFR group's task-fMRI session, all sessions consisted of three runs for 30, 60, and 90 min after the beginning of the MRI session. The IFR group received one task-fMRI session at the 30-min time point after the MRI scan started. For the task-fMRI sessions, two needle electrodes were inserted under the skin of the right forepaws between the second and third digits and the fourth and fifth digits and were connected to a constant current stimulator (2.0 mA, 9 Hz, 1 ms). The rats' temperatures were maintained at 37–37.5°C using a water-circulated bed and heating pad. The temperatures and respiratory rates of the rats were monitored throughout the MRI sessions.
All the rats' images were acquired using a 7.0 T MRI scanner (PharmaScan, Bruker Biospin GmbH, Germany). A quadrature volume resonator (inner diameter of 72 mm) was used for radiofrequency transmission, and a four-element surface coil array was used for signal reception. Following the initial localization scan, two rapid acquisitions with relaxation enhancement (RARE) T2-weighted sequences were acquired in the sagittal and coronal planes with the following parameters: RARE factor = 8, TR/TE = 3000/36 ms, matrix size = 256 × 256, thickness = 1 mm, field of view (FOV) = 320 × 320 mm, slice = 22, and average = 1. Then a fieldmap-based MAPSHIM method was adopted to optimize the B0 field homogeneity. BOLD images were acquired using a multislice single-shot gradient echo echo-planar imaging (EPI) sequence with TR = 2 sec, TE = 18 ms, slice = 21, thickness = 1 mm, matrix size = 64 × 64, repetition = 180, FOV = 320 × 320 mm, and voxel size = 0.5 × 0.5 × 1 mm. The FOV position and slice location of the EPI sequence were carefully adjusted according to the sagittal and coronal T2 images to confirm that all the rats had the same scanning geometry parameters regarding their anatomical landmarks. The phase labeling for additional coordinate encoding (PLACE) method was adopted to correct the geometric distortions in the BOLD images (Xiang and Ye, 2007). Then, new coplanar axial T2-RARE anatomical images were acquired. Each task-fMRI run consisted of 5 blocks with a 20-sec activation period (10 volumes) and 40-sec resting period (20 volumes), starting with a 40-sec resting period.
Data preprocessing
All images were preprocessed using Statistical Parametric Mapping software (SPM8) and Analysis of Functional NeuroImages (AFNI,
Task-fMRI and FC analysis
The first-level analysis was performed using data from each task-fMRI run of rats in SPM8. A classical GLM model was used to estimate the effect of the electrical stimuli. Multiple comparison correction (p = 0.001, uncorrected, cluster size >20 voxels) was used to define the activation cluster. The time course of the BOLD signal in the left region of the primary somatosensory forelimb cortex (S1FL) was extracted for each rat based on the atlas of the template set mentioned above. Then the percent BOLD signal change was calculated using the average of the BOLD signals from the rest period as the baseline. Mean BOLD signal responses were the average percent BOLD signal changes in the activation period with the first two repetitions of each period being discarded (one activation period consisted of 10 brain volumes or 10 repetitions).
For rs-fMRI data, the FC analysis was processed using the Resting-State fMRI Data Analysis Toolkit V1.8 software (REST). The right S1FL region in the rat atlas was defined as the seed region-of-interest (ROI). Whole-brain FC maps were calculated using the Pearson correlation between the mean time course of the seed and the time course of each voxel across the entire brain. The ROI-wise FC values between bilateral S1FL were also calculated. To quantify the region-specific interhemispheric FC pattern between bilateral S1FL, we introduced a variable named relative interhemispheric connectivity strength (rICS). The rICS was defined as follows:
A default mode network (DMN) connectivity analysis was also performed in a seed-based manner. The following atlas regions, prelimbic cortex, orbitofrontal cortex, the dorsal (Cg1) and ventral (Cg2) parts of the cingulate cortex, and retrosplenial cortex, were selected for ROI-wise analysis (anatomical illustration in Fig. 5a). The retrosplenial cortex was selected for voxel-wise analysis.
Statistical analysis
One-sample t-tests of contrast images in the first-level task-fMRI analysis and zFC (Fisher's z transform) images in the FC analysis were performed to show brain areas significantly activated under the electrical stimuli and brain areas significantly connected to seed ROI, respectively. A family-wise error rate correction with a cluster defining threshold p = 0.001 (two-tailed), corresponding to a cluster level of p = 0.05, was used for the multicomparison correction (Eklund et al., 2016). Repeated-measures ANOVA was used to determine the effects of the anesthetic regimen, rat strain, and the scanning time points (30, 60, 90 min) on the mean BOLD signal response, rICS, and FC value between bilateral S1FL using SPSS (version 18.0; IBM Corp.). Least significant difference tests were used for post hoc analysis. The Kruskal–Wallis test with Steel–Dwass test (post hoc) was also used to compare continuous variables that are not normally distributed.
Results
Although all the rats were carefully anesthetized and immobilized, two SD rats in the MED group showed excessive head movement at the 60- and 90-min time points, respectively, during task-fMRI sessions and underwent additional task-fMRI sessions after a 3-day interval. Otherwise, the rest of the rats only demonstrated minor head movement due to respiration and circulation (less than 0.1 mm translation and 0.5° rotation). The typical respiratory rate of the SD rats and Wistar rats in the MED&IFR group ranges from 60 to 85 and 50–75 breaths per minute (bpm), respectively, during 30–100 min after the MRI scan began. All rats of the MED&IFR group in rs-fMRI sessions exhibited a sudden increase in respiratory rate (from below 90 bpm to above 100 bpm) or significant head/body movement between 120 and 150 min after the beginning of the MRI session and they were released from the animal bed immediately.
Electrical forepaw stimulation-induced fMRI response under three anesthetic regimens
Two to 2.5% isoflurane only (IFR group)
There was no significant activation across the entire brains of both SD and Wistar rats anesthetized with isoflurane at the group level.
Dexmedetomidine bolus combined with a continuous infusion (MED group)
Consistent significant activations of contralateral S1FL areas were observed at all the three time points in Wistar rats under dexmedetomidine sedation (MED group, Fig. 1). While in SD rats of the MED group, activations were also found on contralateral S1FL areas, but more localized than that of the Wistar rats. Activations were also found in the vascular running areas between the brainstem and cerebrum in both rat strains. Activation of the ventral thalamus (30 and 90 min, MED group, Fig. 1) and negative response of the dorsal caudate putamen were also observed in the Wistar rats. Post hoc analysis revealed a significantly higher mean BOLD signal response in contralateral S1FL of Wistar rats in the MED group than that in the other two groups (All p < 0.001, Supplementary Fig. S1). Meanwhile, the mean BOLD signal response of contralateral S1FL at 90 min was significantly higher than that of the other two time points in Wistar rats in the MED group (p = 0.014 and p = 0.001, compared with 30 and 60 min, respectively, Supplementary Fig. S1). Mean BOLD signal response of SD rats in the MED group was also higher than that of the other two groups (IFR group, p = 0.008 and MED&IFR group, p = 0.003). Curves of the mean percent BOLD signal change in contralateral S1FL areas for all SD and Wistar rats are illustrated in Supplementary Figure S2.
Group-level, one-sample t-test results of electrical forepaw stimulation-induced BOLD response of rats. All images are in the neurology convention (left is left). SD rats under dexmedetomidine sedation only (MED group) demonstrated significant activations in the contralateral S1FL and vascular running areas between the brainstem and cerebrum. Consistent significant activations of contralateral S1FL areas in both the three time points were observed in Wistar rats of the MED group. The activation of ventral thalamus (30 and 90 min) and negative activation of dorsal caudate putamen were also observed in Wistar rats of the MED group. BOLD, blood oxygen level dependent; S1FL, primary somatosensory forelimb cortex; SD, Sprague Dawley. Color images are available online.
Dexmedetomidine bolus combined with 0.3–0.5% isoflurane (MED&IFR group)
Small activated clusters were located in the contralateral S1FL at the 30-min time point in both SD and Wistar rats in the MED&IFR group (MED&IFR group, Fig. 1). Meanwhile, parts of the contralateral S1FL (Wistar rats only) were also activated at the 60-min time point (Fig. 1). No significant difference in mean BOLD signal response in contralateral S1FL was found between the MED&IFR and IFR groups in either SD or Wistar rats (Supplementary Fig. S1).
SD versus Wistar
There was a significant effect of rat strains on the mean BOLD signal response of contralateral S1FL (F = 42.367, p < 0.001). Wistar rats had a higher mean BOLD signal response to electrical forepaw stimulation in contralateral S1FL than SD rats.
Interhemispheric FC analysis
Two to 2.5% isoflurane only
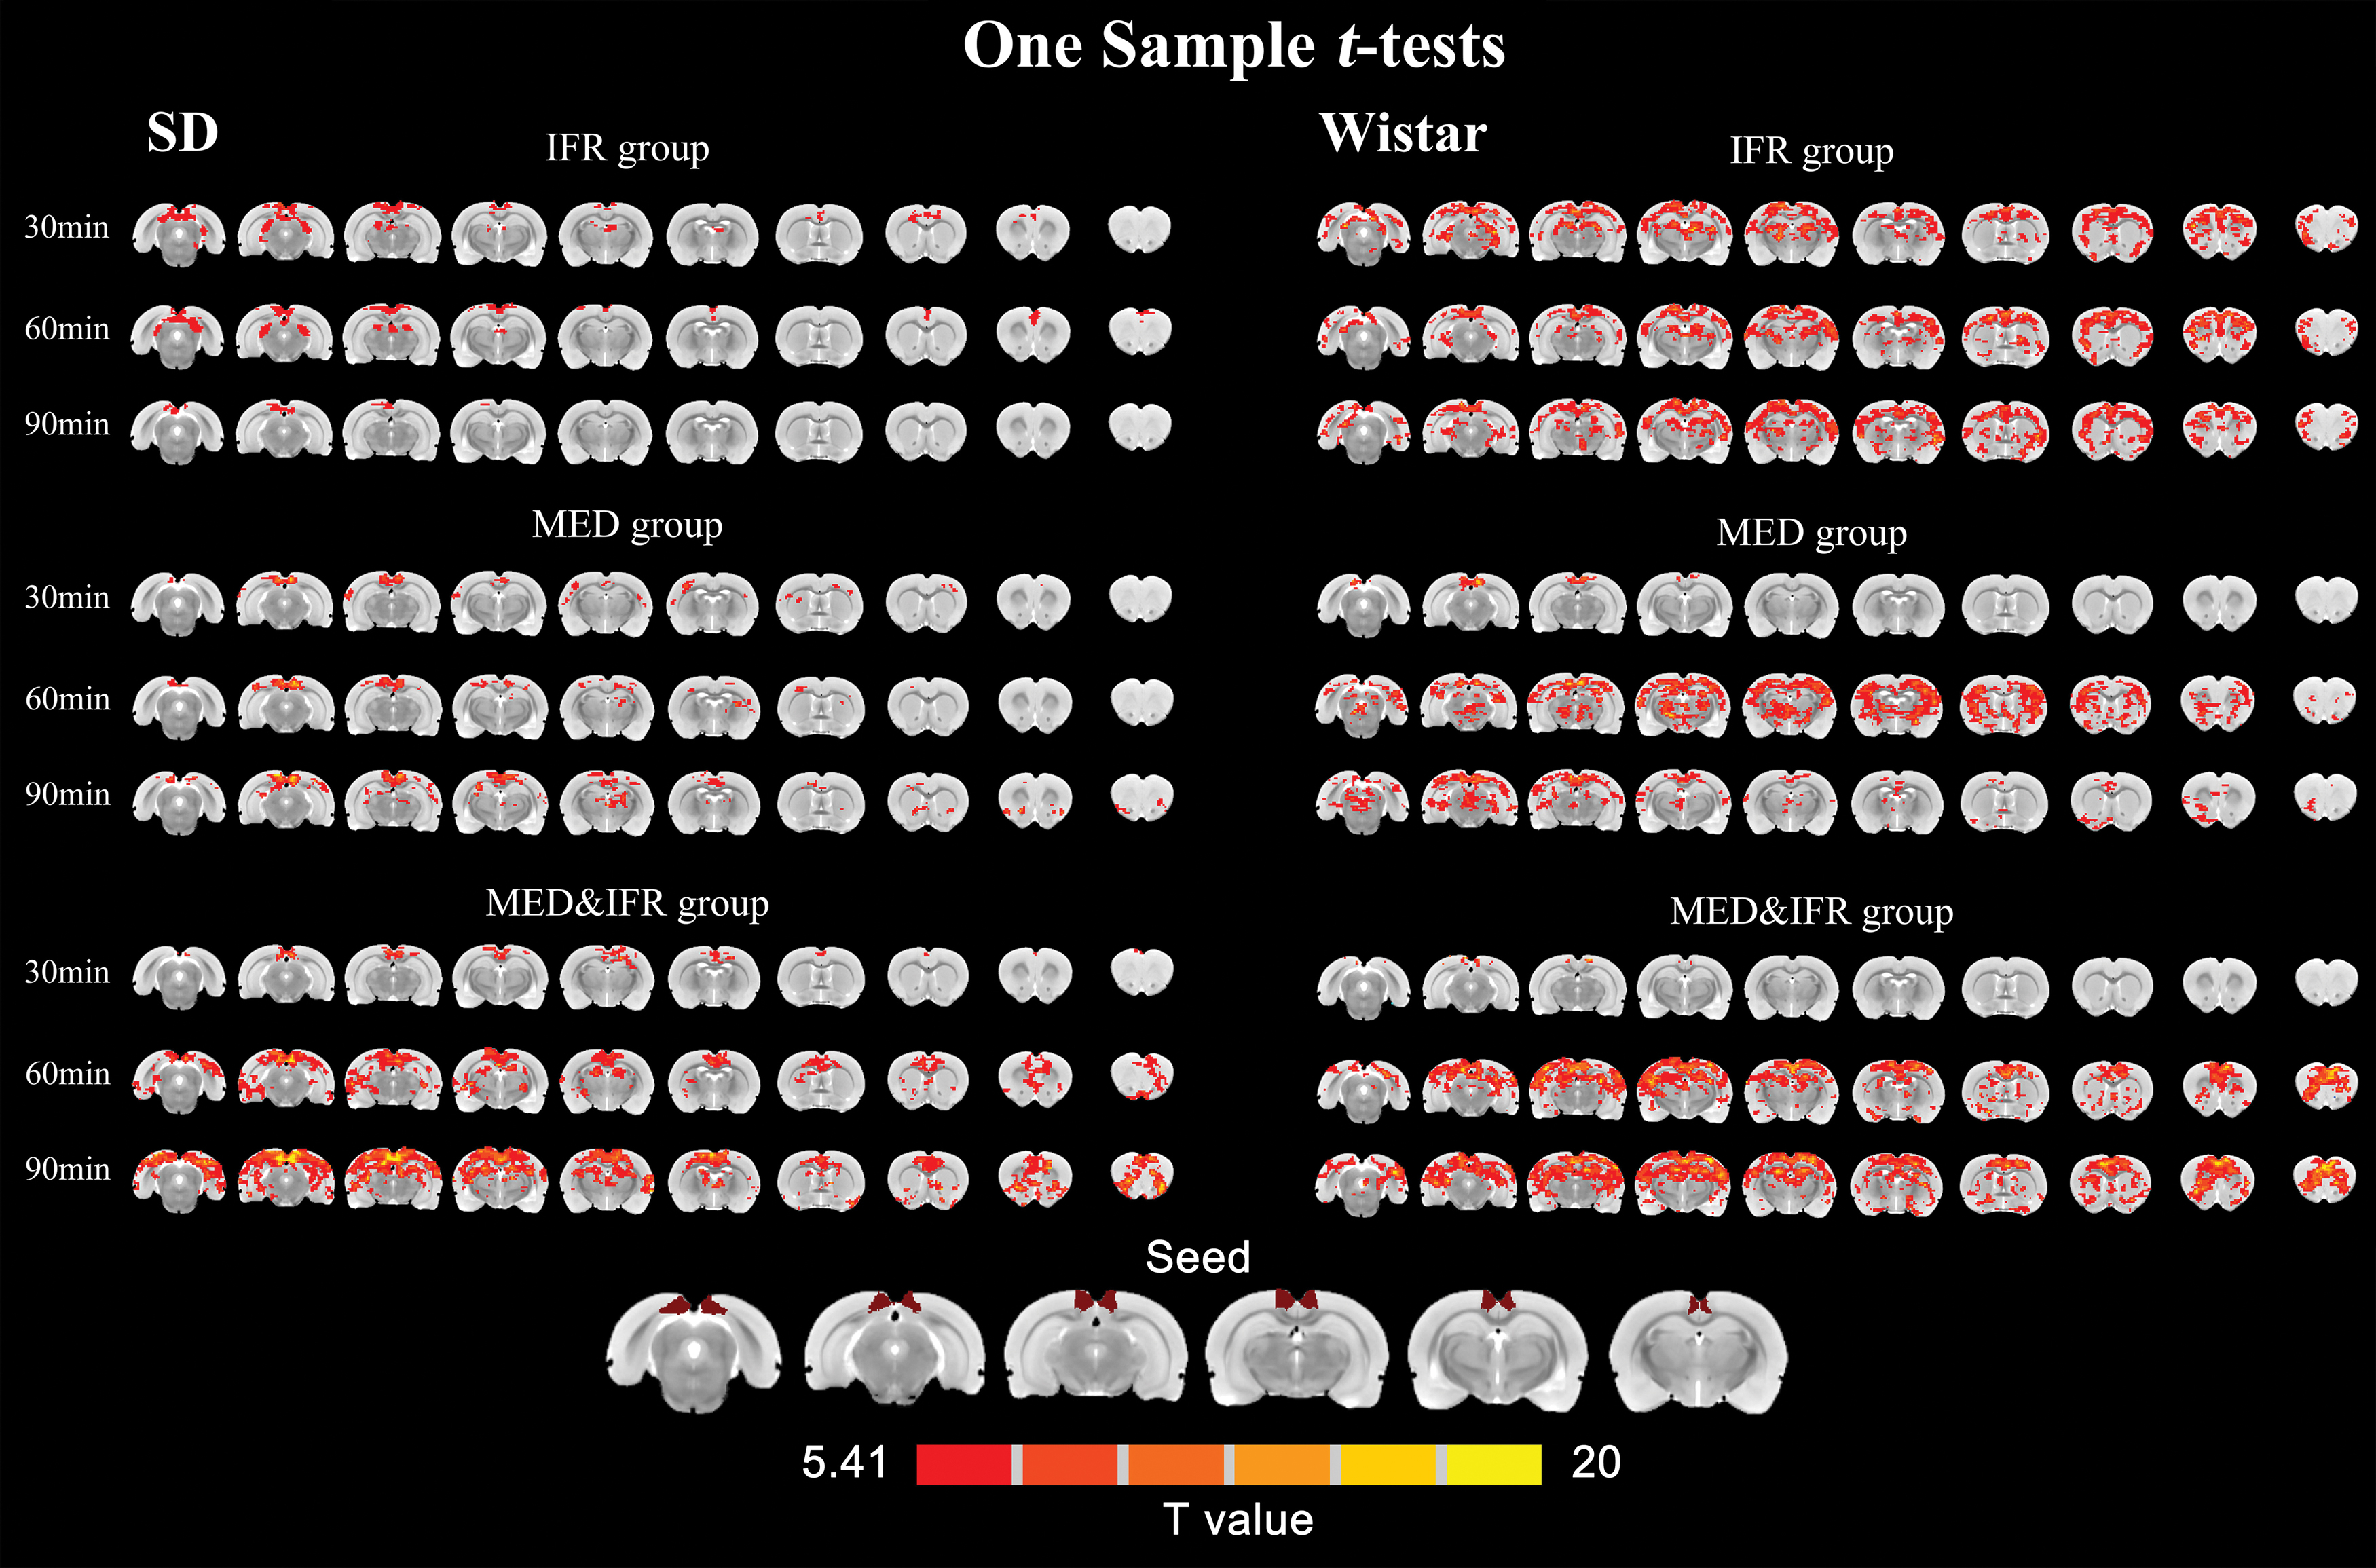
FC maps of both SD and Wistar rats in the IFR group demonstrated widespread connectivity between the right S1FL and most parts of the cortical areas and subcortical areas (Supplementary Fig. S3). FC maps of other groups are shown in Figure 2. ROI analysis showed that both SD and Wistar rats in the IFR group had the highest FC values between bilateral S1FL among the three groups (Fig. 3). However, SD rats in the IFR group also demonstrated the lowest rICS among the three groups (F = 29.48, p < 0.001). The FC and rICS values between bilateral S1FL are listed in Tables 2 and 3.

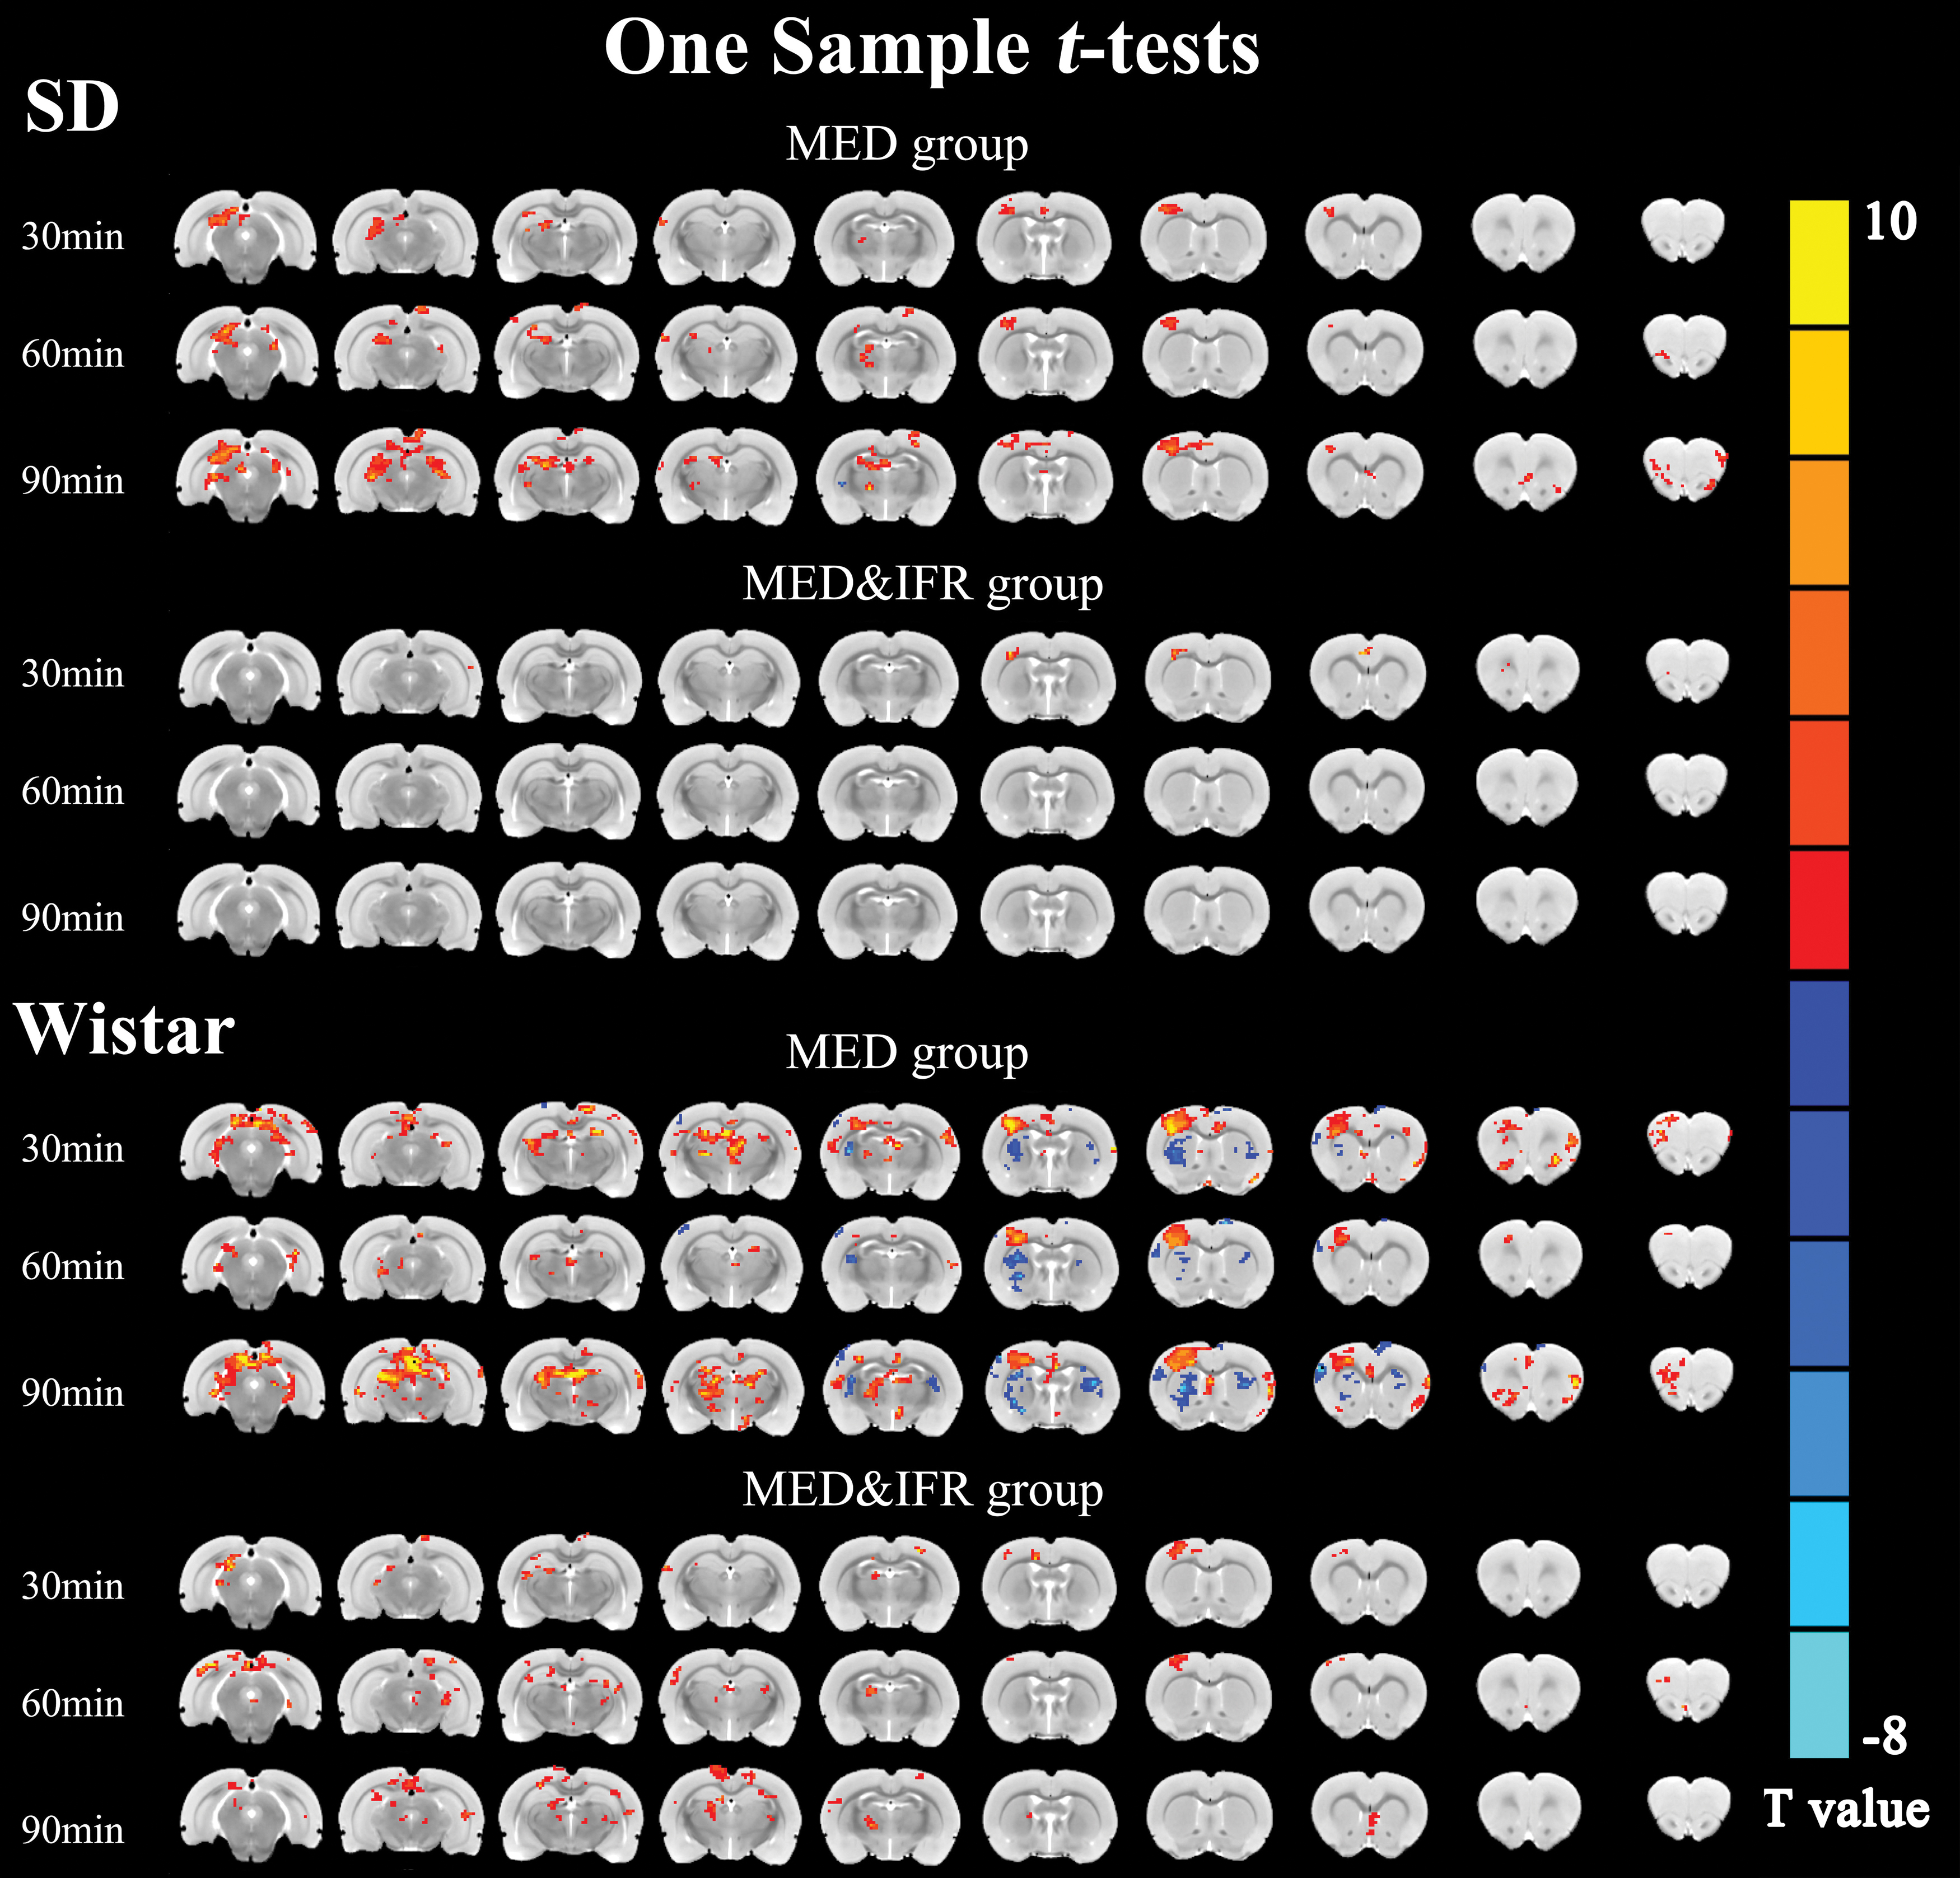
Group-level, one-sample t-test results (p = 0.001, AlphaSim corrected) of FC map of rats in MED and MED&IFR groups with right S1FL served as seed (neurology convention). SD rats in MED&IFR group showed the most regional-specific interhemispheric FC between bilateral S1FL. Wistar rats did not exhibit a clear regional-specific interhemispheric FC under all the three anesthetic regimens. FC, functional connectivity; IFR, isoflurane. Color images are available online.
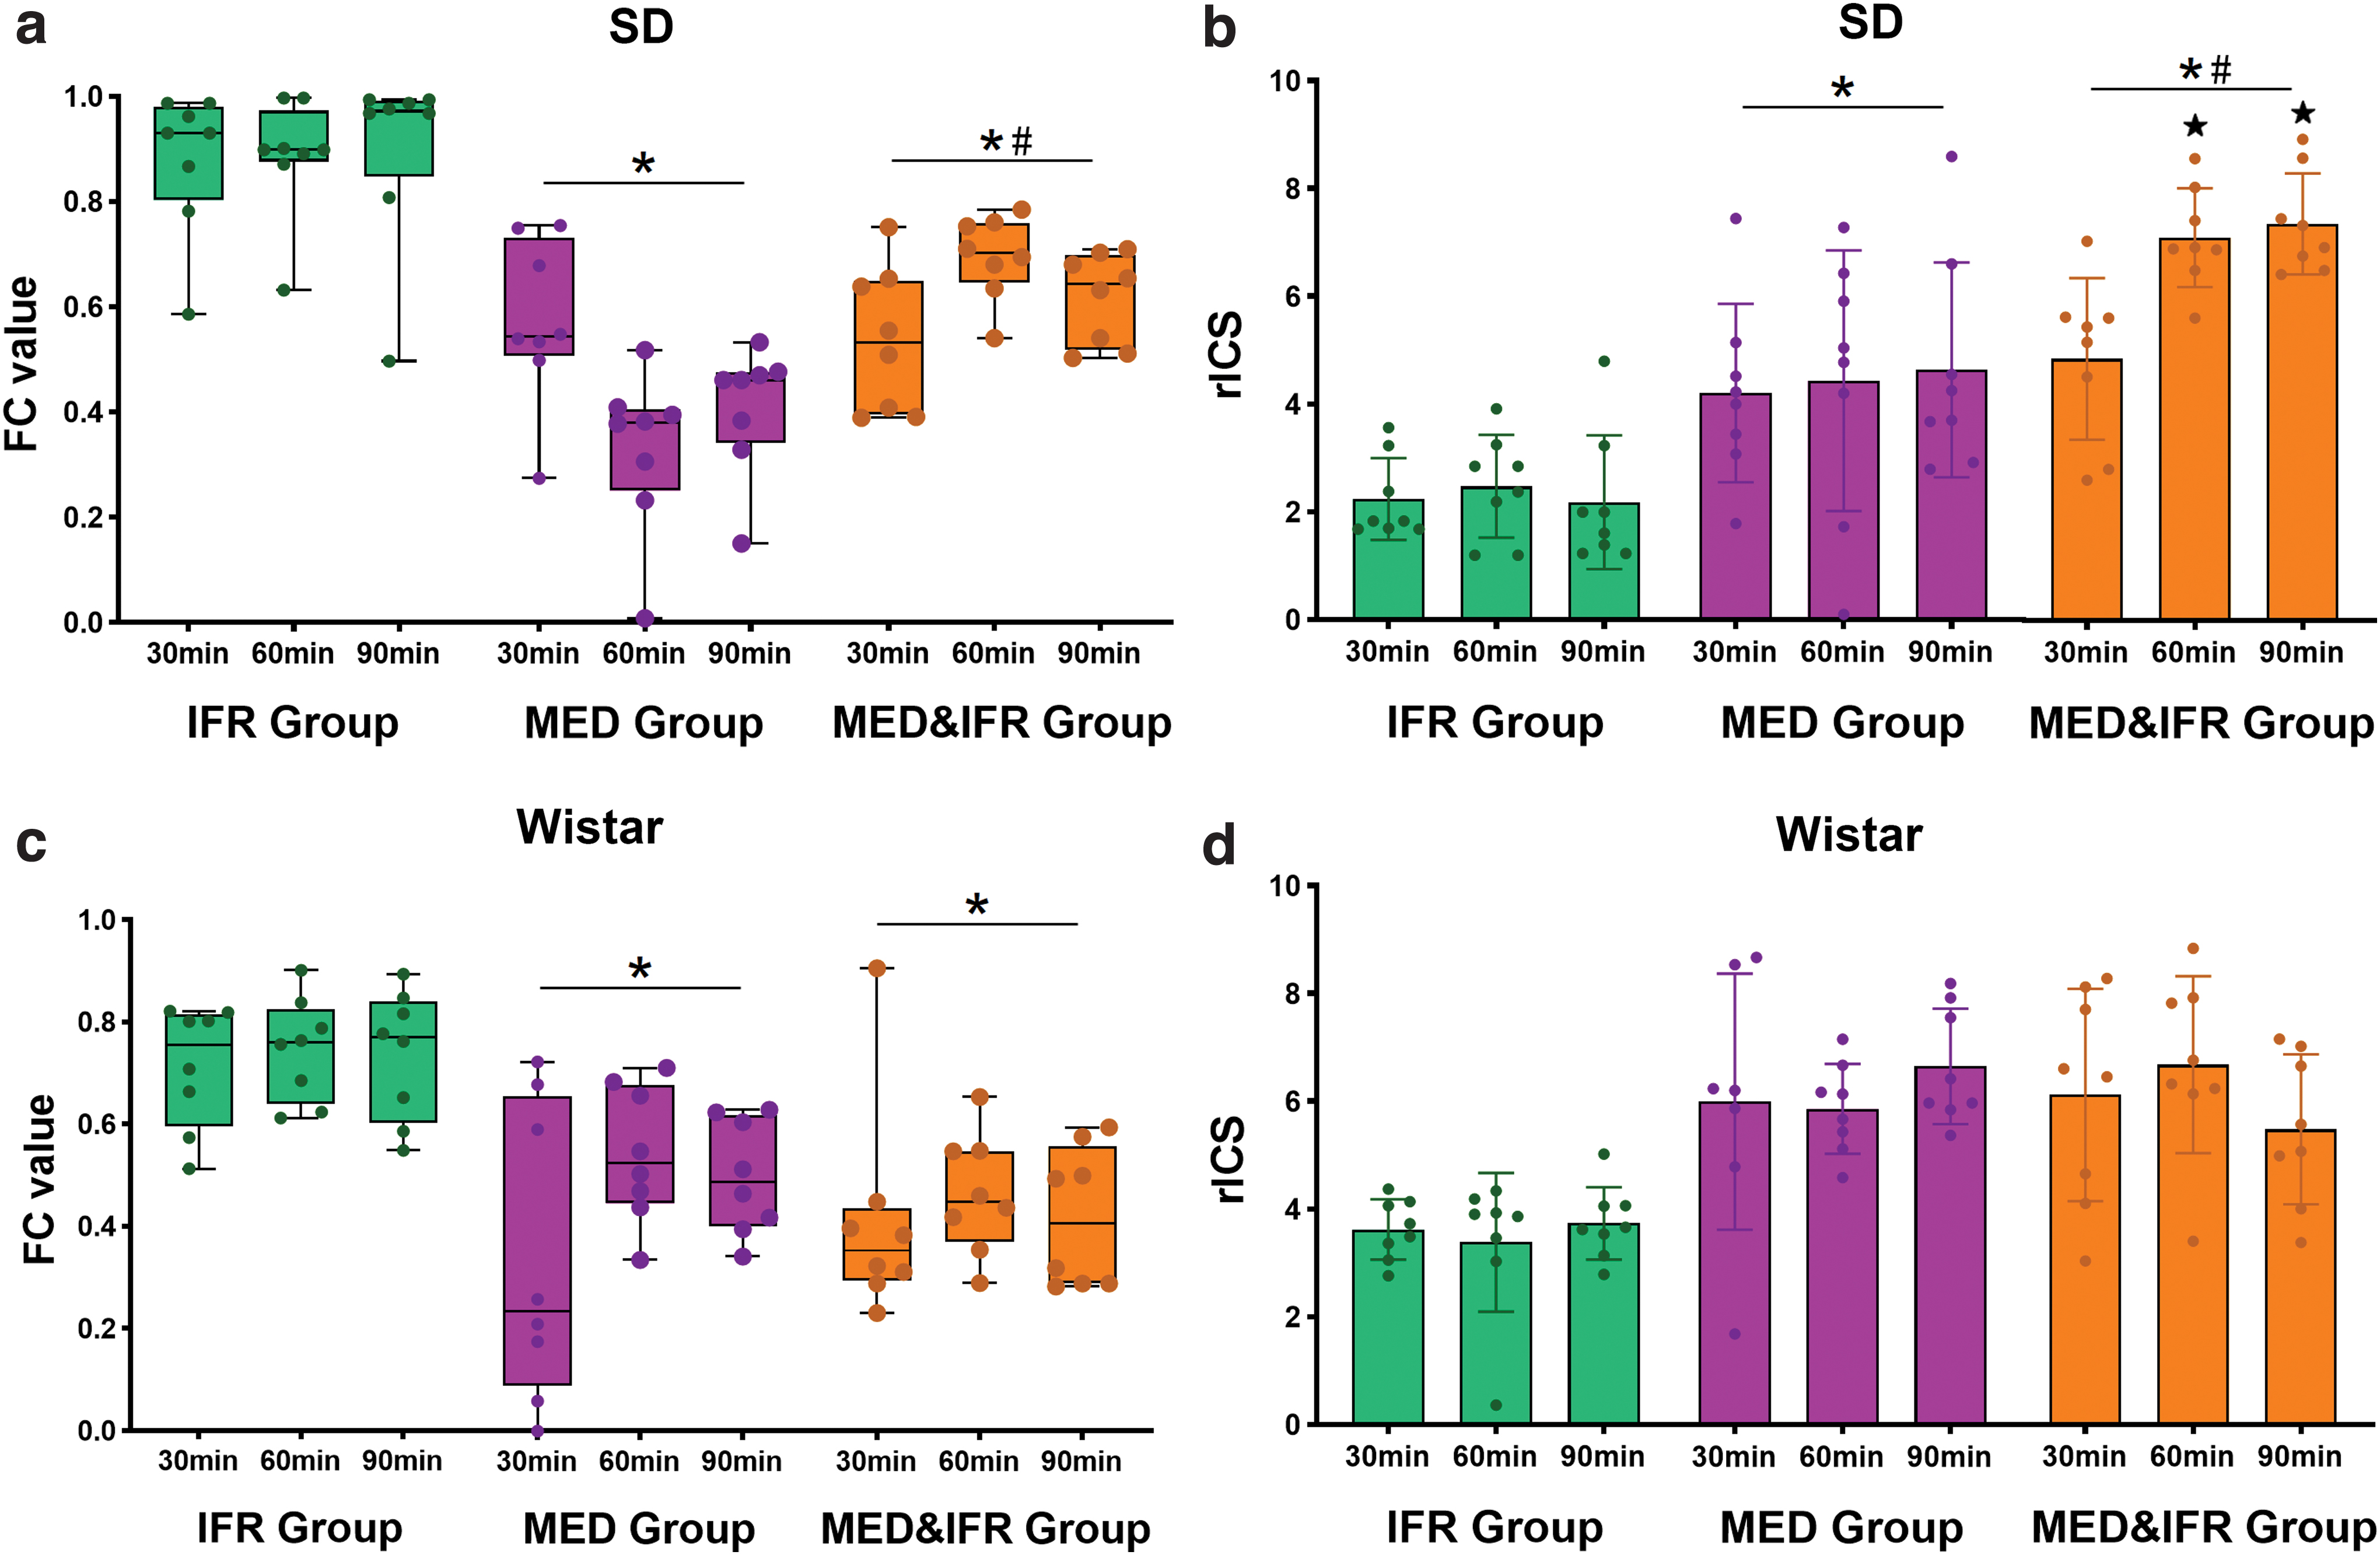
FC and rICS values between bilateral S1FL of rats.
Functional Connectivity Values Between Bilateral Primary Somatosensory Forelimb Cortex
All data are presented with mean ± standard deviation. Statistical comparisons are illustrated in Figure 3.
Relative Interhemispheric Connectivity Strength Values in the Three Groups
All data are presented with mean ± standard deviation. Statistical comparisons are illustrated in Figure 3.
Dexmedetomidine bolus combined with a continuous infusion
SD rats under dexmedetomidine sedation exhibited widespread connectivity patterns between right S1FL and other parts of the brain at the 30-min time point (Fig. 2). Then, symmetrical patterns of regional-specific FC between bilateral somatosensory cortexes were observed at the 60- and 90-min time points in the SD rats. In Wistar rats, significant connectivity was confined in seed ROI at the 30-min time point and then spread to most parts of the brain at the 60- and 90-min time points. SD rats had a significantly higher connectivity between bilateral S1FL in the MED group than in the IFR group (p = 0.001, Fig. 5). However, Wistar rats demonstrated little difference in rICS values among all groups and time points.
Dexmedetomidine bolus combined with 0.3% isoflurane
FC maps showed a symmetrical regional-specific FC pattern between the bilateral somatosensory cortexes at 60 and 90 min in SD rats in the MED&IFR group, but not at the 30-min time point (Fig. 2). SD rats had significantly higher rICS values in the MED&IFR group compared with those in the other two groups (IFR, p < 0.001 and MED, p = 0.001). Meanwhile, rICS of SD rats at 60 and 90 min was significantly higher than rICS at the 30-min time point (60 min, p = 0.003 and 90 min, p = 0.001). SD rats of the MED&IFR group also showed higher FC values between bilateral S1FL than those of the MED group (p = 0.003), but there was no time effect on the FC value of SD rats in the MED&IFR group (p = 0.257). In Wistar rats, seed ROI did not have connectivity with other parts of the brain at the 30-min time point, while widespread FC between the right S1FL and most parts of the cortex at 60 and 90 min was observed. On the contrary, both FC and rICS measurements of SD rats in the MED&IFR group had a lower variation (standard error) than those in the MED groups. These results may indicate that SD rats in the MED&IFR group had a more region-specific interhemispheric FC pattern than in the MED group.
SD versus Wistar
There was a significant effect of rat strains on the rICS (F = 9.867, p = 0.003) and FC value between bilateral S1FL (F = 43.178, p < 0.001). SD rats had significantly higher rICS and FC values between bilateral S1FL than Wistar rats.
An rICS analysis of multiple seed ROIs on different brain regions was also performed on the 60- and 90-min time points between the two rat strains in the MED groups and the MED&IFR groups (Supplementary Fig. S4). The results showed that SD rats have a higher rICS value than Wistar rats in some other seed regions than S1FL in the MED&IFR group. These results may indicate that Wistar rats have a higher global connectivity under the current experiment setting, leading to a less specific interhemispheric FC pattern.
DMN analysis
Voxel-wise DMN analysis in the MED&IFR group showed significant clusters that were mainly located in the orbital cortex, prelimbic cortex, cingulate cortex, retrosplenial cortex, auditory/temporal association cortex, hippocampus, and posterior parietal cortex at the 60- and 90-min time points (Fig. 4). SD rats showed stronger DMN connectivity at the 90-min time point than 60 min in the MED&IFR group. Typical pattern of DMN was not observed in the MED&IFR group at the 30-min time point and in the other two groups.
Group-level, one-sample t-test results (p = 0.001, AlphaSim corrected) of DMN in rats with retrosplenial cortex served as seed, right panel for SD rats and left for Wistar rats. Only rats (both SD and Wistar rats) in MED&IFR group at the 60- or 90-min time points showed a relatively intact pattern of DMN compared with other groups. SD rats showed a more strong DMN connectivity at the 90-min time point than 60 min in the MED&IFR group. DMN, default mode network. Color images are available online.
ROI-wise DMN analysis showed very strong RSFC among all DMN nodes in the IFR group of SD rats (Fig. 5). The mean RSFC value in the DMN was highest in the IFR group among the three groups in both rat strains. In contrast, the MED group showed the lowest mean RSFC value. The mean RSFC values were generally higher at 90-min time points than those at 60 min in the MED&IFR group, although this difference was not statistically significant. Meanwhile, the mean RSFC values had relatively low variations at the 90-min time points in the MED and MED&IFR groups.

RSFC of DMN.
Discussion
There are three major findings of this study. First, SD rats had a lower mean BOLD signal response to electrical forepaw stimulation in contralateral S1FL than Wistar rats under the three anesthetic regimens. Second, Wistar rats seemed to have a less regional-specific bilateral interhemispheric connectivity pattern than SD rats. Finally, there appears to be an uncoupling of task-related BOLD response and region-specific interhemispheric FC in SD rats under isoflurane/medetomidine sedation.
Both SD and Wistar rats anesthetized with 2–2.5% isoflurane had the lowest BOLD signal response in S1FL during forepaw electrical stimulation among the three groups. In our preliminary experiment, approximately half of the rats anesthetized with isoflurane with a concentration of 1.5% exhibited excessive head movement under task-fMRI sessions. Therefore, we used a higher level of isoflurane than 1.5%. All the rats anesthetized with 2–2.5% isoflurane demonstrated a widespread FC pattern as opposed to region-specific during the rs-fMRI session. This widespread FC pattern is thought to originate from an increased cerebrovascular fluctuation amplitude or highly synchronized hemodynamic fluctuations under the burst-suppression state (Kalthoff et al., 2013; Williams et al., 2010). In this study, low-level isoflurane (0.3–0.5%) could also suppress the stimulation-induced BOLD response when combined with dexmedetomidine sedation in both Wistar and SD rats. However, low-level isoflurane seems to reduce variation in the FC strength in SD rats under dexmedetomidine sedation. Our results support the opinion that high-level isoflurane may not be suitable for an fMRI study (Williams et al., 2010), but it also suggests that low-level isoflurane has different effects on task-fMRI and rs-fMRI results. A study by Masamoto and colleagues (2007) suggested that optimized forepaw stimulation parameters could increase the stimulation-induced responses under isoflurane. Cerebrovascular activation studies using various anesthetics, including isoflurane, are still warranted.
Medetomidine sedation was first introduced to rodent fMRI studies and showed robust fMRI activation in Wistar rats by Weber and colleagues (2006). In our study, robust activations in S1FL of Wistar rats were also observed. In this study, the late time point leads to a higher percent BOLD signal change than the earlier time points in the MED group of Wistar rats. Compared with Wistar rats, SD rats demonstrated a weaker activation (1–1.5% vs. 3–4% peak signal change) in the S1FL under dexmedetomidine sedation, which almost diminished when combined with low-level isoflurane. In the studies of Lu and colleagues (2012), dexmedetomidine and low-level isoflurane were combined in a different way and produced a mean BOLD signal response ranging from 0.5% to 2% depending on anesthesia time. Lu and colleagues (2012) regarded it as a new anesthesia regimen to achieve more stable fMRI results. We got similar results of interhemispheric FC to the results of Lu and colleagues (2012). However, the results for task stimulation in the MED&IFR group were inconsistent with the results of Lu and colleagues (2012). This may be due to the higher backgroud noise of our scaner or unoptimized stimulation parameters. It is also possible that the rats may have had an unstable arterial blood gas status in this study, such as aberrant pCO2 or pO2. A study by Brynildsen and colleagues (2017) showed that SD rats were slightly hypercapnic during isoflurane/medetomidine sedation with a respiratory rate of 50–80 bpm. It has been reported that the baseline BOLD signal increased linearly from hypocapnia to hypercapnia, while stimulation-induced BOLD response decreased (Cohen et al., 2002). It is possible that the SD rats were under moderate-to-severe hypercapnia condition in this study. However, this may not be the case, since the respiratory rate of SD rats in the MED&IFR group was similar to that of rats in the study by Brynildsen and colleagues (2017).
Another concern is that SD rats under dexmedetomidine-only sedation sometimes exhibit excessive head movement, suggesting relatively unstable anesthesia of SD rats compared with the other two anesthetic regimens. This may account for a relatively high variation (standard error) in rICS and FC values in SD rats of the MED group. Meanwhile, the mean rICS and FC values of SD rats in the MED group are lower than those in the MED&IFR group. Meanwhile, a recent study compared FC results under six anesthesia protocols and showed that FC patterns under isoflurane and medetomidine differed most from those in the awake rats (Paasonen et al., 2018).
For DMN analysis, both SD and Wistar rats in the MED&IFR group at the 60- or 90-min time points showed a relatively intact pattern of DMN, while those at the early time point or in other groups did not. The late time point usually leads to a more stable RSFC result, especially at the 90-min time point in the MED&IFR group, which commonly leads to a higher RSFC value and a lower RSFC variation. Although SD rats in the IFR group showed a very strong connectivity among the DMN nodes, the significant voxel-wise clusters were mainly located around the large vessel. This result may be due to the high variations in RSFC values from these nodes in the IFR group. The MED group showed the lowest DMN RSFC value among the three groups, indicating that rats sedated only with medetomidine may not be suitable for DMN analysis in a scaning time of less than 2 h. In a study by Sirmpilatze and colleagues (2019), the mean RSFC value (around 0.5 compared with 0.2) was typically higher in Wistar rats than in our study using four different medetomidine administration methods. While it still appears that DMN nodes have a relatively lower RSFC value compared with the other seeds in their study even lasting up to 6 h.
There are studies using task-fMRI and FC rs-fMRI method to map the genetic effect of different rat strains (Huang et al., 2016; Li et al., 2014). We also demonstrated that there were different stimulation-induced BOLD responses and FC patterns between SD rats and Wistar rats. Specifically, we found that the FC pattern of the S1FL seems to be more widespread and less region-specific in Wistar rats than in SD rats. This result is consistent with the study by Paasonen and colleagues (2018), in which the somatosensory cortex has a relatively lower corticocortical FC under both medetomidine and isoflurane/medetomidine combination groups.
Conclusions
This study has several limitations. First, lack of blood oxygenation or heart rate monitoring is the main limitation of this study. Meanwhile, it should have had a group using medetomidine (bolus and continuous infusion) combined with low-level isoflurane protocol in our study for comparison, which is a more intact study design. Finally, the current results strongly rely on our study settings.
In conclusion, our study demonstrated different stimulation-induced BOLD responses and FC patterns between SD rats and Wistar rats. We also found that Wistar rats perform better in a stimulation-related task-fMRI session and SD rats perform better in an rs-fMRI session under the current study setting. We recommend using Wistar rats for forepaw electrical stimulation task-fMRI studies as they usually show higher BOLD responses than SD rats. Combination of medetomidine bolus and low-level isoflurane can maintain a region-specific RSFC pattern in rs-fMRI experiment performed with SD rats. However, neurovascular coupling might also be compromised under this regimen without artificial ventilation.
Footnotes
Authors' Contributions
S.H.J. contributed to the design of the study and revised the article for intellectual content. C.Q.L. collected the data, performed the analysis, and wrote the article. C.H.Z. and X.P.M. helped to collect the data and contributed to the revision of the article. Y.C., Y.L., and X.M.X. contributed to the analysis of the data.
Author Disclosure Statement
No competing financial interests exist.
Funding Information
This research was supported by the National Nature Science Foundation of China (NSFC, No. 82001779, No. 81830053, and No. 61821002) and the Nature Science Foundation of Jiangsu Province (No. BK20200368).
Supplementary Material
Supplementary Figure S1
Supplementary Figure S2
Supplementary Figure S3
Supplementary Figure S4
References
Supplementary Material
Please find the following supplemental material available below.
For Open Access articles published under a Creative Commons License, all supplemental material carries the same license as the article it is associated with.
For non-Open Access articles published, all supplemental material carries a non-exclusive license, and permission requests for re-use of supplemental material or any part of supplemental material shall be sent directly to the copyright owner as specified in the copyright notice associated with the article.