
Abstract
Background:
Graph-theoretical analyses have been previously used to investigate changes in the functional connectome in patients with Alzheimer's disease (AD). However, these analyses generally assume static organizational principles, thereby neglecting a fundamental reconfiguration of functional connections in the face of neurodegeneration.
Methods:
Here, we focus on differences in the community structure of the functional connectome in young and old individuals and patients with AD. Patients with AD, moreover, underwent molecular imaging positron emission tomography by using [18F]AV1451 to measure tau burden, a major hallmark of AD.
Results:
Although the overall organizational principles of the community structure of the human functional connectome were preserved even in advanced healthy aging, they were considerably changed in AD. We discovered that the communities in AD are re-organized, with nodes changing their allegiance to communities, thus resulting in an overall less efficient re-organized community structure. We further discovered that nodes with a tendency to leave the communities displayed a relatively higher tau pathology burden.
Discussion:
Together, this study suggests that local tau pathology in AD is associated to fundamental changes in basic organizational principles of the human connectome. Our results shed new light on previous findings obtained by using the graph theory in AD and imply a general principle of the brain in response to neurodegeneration.
Impact statement
In our study, we follow an innovative approach to trace the reconfiguration of neural networks in Alzheimer's disease in connection to tau pathology. We use the graph theoretical concept of communities, which allows us not only to investigate changes but also to monitor the efficiency of the neural network configuration. We believe that our current approach is innovative and may be extended as a principle disease mechanism for other diseases on the neurodegenerative disease spectrum.
Introduction
Accumulation of intraneuronal tau tangles and extraneuronal aggregation of beta-amyloid peptides are molecular hallmarks of Alzheimer's disease (AD) (Eisenberg and Jucker, 2012; Goedert et al., 2017). Recent evidence has suggested that beta-amyloid pathology preferentially accumulates in specific brain networks such as the default-mode network (Buckner et al., 2009; Sperling et al., 2009). With the advent of novel imaging ligands to selectively identify tau burden in vivo (Schöll et al., 2016), combining positron emission tomography (PET) imaging and resting-state functional magnetic resonance imaging (rs-fMRI) constitutes a unique opportunity to advance our insights into the distribution of neurodegenerative pathology and its relationship to cerebral network architecture (Greicius and Kimmel, 2012). Evidence provided thus far shows an intricate relationship of tau pathology and networks of functional connections (Cope et al., 2017; Hansson et al., 2017; Hoenig et al., 2018).
In recent years, the graph theory has become a prominent tool to investigate the network architecture of the human brain as assessed by rs-fMRI (Bullmore and Sporns, 2012; Joyce et al., 2010), as this technique allows quantifying the functionality of brain networks and assessing the individual role of specific brain regions toward a network. To this end, the brain is modeled as a network with brain regions serving as nodes and functional connectivity serving as connections. To better relate to the application of the graph theory on brain data, imagine the following metaphor:
Visualize the trade of agricultural produce ( = neuronal communication) on a large island ( = entire brain network) with many villages ( = brain communities). Each village consists of a set of farms ( = nodes), and every two farms in a village are connected by a road ( = edges). This ensures direct trade of produce inside each village. There are some special houses, or markets ( = hubs), in each village that are connected with other villages via expressways. These support the trade between villages. The villages are highly clustered with only a few expressways to balance the overall cost of trade (Bullmore and Sporns, 2012), which allows for efficient trade across the island. To assess the observed trade of the agricultural produce, the graph theory enables a data-driven analysis of the basic organizational principles of this island (i.e., which farms belong to which village? = brain communities) and the quantification of specific features of the trade network (i.e., which farms are markets? = connector hubs). In AD, the overall landscape of the brain's architecture may be modified. Keeping with the analogy: Imagine a destructive storm blows over the island: roads get potholes, expressways get damaged. As a consequence, some farms may lose their connection to their village and markets lose their importance. Now, farms may have to build new expressways to different villages and branch out to a new market. This leads to a completely different organizational structure of the island, with a new formation of villages and newly developed markets.
We here aim at (1) understanding how the specific landscape of the hierarchical organization of the brain network changes with AD, and (2) evaluating the influence of tau pathology on these changes. Several studies already suggested disruptions of functional connectivity in AD considering quantitative measures such as clustering and path lengths (Sanz-Arigita et al., 2010; Stam et al., 2007; Supekar et al., 2008) or components of large-scale neural networks (Jacobs, 2013; Lehmann et al., 2016). Here, we take a novel approach and associate possible differences in functional coherence with the reorganization of the communities (i.e., branching out of the villages after the storm). To this end, we not only compare algorithmically detected communities of healthy, aged, and diseased populations on a quantitative level but also identify nonstable brain regions losing affiliation to their “former” community (i.e., village). Finally, we propose that changes in community structures identified in patients with AD relate to tau pathology, as measured by PET.
Materials and Methods
Participants
A total of 64 subjects were included in this study. The patient cohort and young and old healthy controls were distributed as follows (see Table 1 for an overview of population characteristics): 20 patients recently diagnosed with mild cognitive impairment (MCI) or mild dementia due to AD (13 male, 7 female, ages 55–82 years), who had undergone [18F]AV-1451-PET at the Department of Nuclear Medicine underwent an MRI scanning protocol, including a resting-state scan at the Research Center Jülich, Germany. Diagnostic criteria for MCI were based on the recommendation from the National Institute on Aging and the Alzheimer's Association previously published (Albert et al., 2011). Diagnostic guidelines for AD diagnosis were informed by those published in the international working group 2 criteria (Dubois et al., 2010). A team of multidisciplinary clinicians ensured compliance with these criteria for every patient included in this study. The time interval between [18F]AV-1451 PET and the fMRI procedure was about 7 months (standard deviation [SD] = 6.1 months). A group of 20 age-matched senior healthy controls [N = 20, M(age) = 67.5; SD(age) = 3.53] underwent only structural and functional MRI scanning to compare age-related differences in network architecture. As an [18F] AV-1451-PET scan or other potential biomarkers for this senior group was not available, detailed cognitive scores, healthy information, and global cognition (Mini-Mental State Examination [MMSE]; Montreal Cognitive Assessment; Demenz-Detektions-test) were used to ensure no current AD pathology (see details:
Patient Population
AD, Alzheimer's disease; MMSE, Mini-Mental State Examination; SD, standard deviation.
The ethics committee of the medical faculty of the University of Cologne approved the study. Written informed consent was obtained from all participants before the study following the Declaration of Helsinki.
In addition, to compare how age and disease-related network architecture differs, we analyzed a sample of young, healthy controls [N = 24, M(age) = 29.5 ± 5.04 years (13M/13F)] previously utilized in Hoenig et al. (2018) from the Human connectome project.
PET acquisition and preprocessing
The PET scans were collected on a Siemens Biograph mCT Flow 128 Edge scanner (Siemens, Knoxville, TN) at the Department of Nuclear Medicine, University Hospital Cologne, Germany. A low-dose transmission scan was performed with computed tomography for attenuation correction before the beginning of the PET scans. The PET scans were acquired for 15 min after intravenous injection of a mean dose of 225 MBq of [18F]AV-1451 and a rest period of 90 min. The scans were iteratively reconstructed by using a 3D OSEM algorithm of 4 iterations and 12 subsets and smoothed with a Gaussian filter of 5 mm full width at half maximum on 128 × 128 Matrix Image. The images were co-registered and spatially normalized to the individual MRI by using Statistical Parametric Mapping (SPM) version 12 (Wellcome Trust Centre for Neuroimaging, Institute of Neurology, University College London). Each image was divided by the nonspecific binding within a whole cerebellar region of interest (ROI) to calculate standard uptake value ratios (SUVRs) employing in-house scripts in MATLAB R2016a (The MathWorks, Inc., Natick, MA). Further, PET scans from senior healthy controls (N = 15) who underwent an [18F]AV1451 PET scan were used to compute individual patient z-deviation images from mean and SD images (Bischof et al., 2016; Hoenig et al., 2017).
MRI acquisition and preprocessing
All participants underwent an rs-fMRI sequence by using a Siemens Trio 3.0 Tesla Scanner. Participants were instructed to keep their eyes open and on a fixation cross during the 5-min scan sequence. A T2-weighted, single-shot echo planar imaging sequence was used with the following imaging parameters: repetition time (TR) = 3000 msec, echo time (TE) = 30 msec, number of images = 140, flip angle (FA) = 90°272, field of view (FOV) = 200 × 200 mm2, matrix = 80 × 80, voxel resolution = 2.5 × 2.5 × 2.5, 50 oblique slices parallel to the infra-supratentorial line, gap = 0.28 mm, interleaved, scan time = 7 min. During the resting-state scan, participants were instructed to keep their eyes open, not to fall asleep, and not to think of anything in particular.
In addition, a high-resolution MRI was acquired with a TR = 2250 msec, TE = 3.03 msec, FA = 90°, FOV = 256 × 256 mm2, voxel resolution = 1 mm isotropic. Moreover, to identify functional networks in a group of young, healthy adults, we employed the publicly available rs-fMRI dataset by Berlin-Margulies (Rohr et al., 2013), which is part of the 1000 Functional Connectome Project. The scanning protocol was as follows: TR = 2300 msec, TE = 30 msec, time points = 195, slice number = 34, FA = 90°, voxel size = 3 × 3 × 4 mm3, and FOV = 192 × 192.
fMRI preprocessing
The functional images were slice-time corrected, motion-corrected, and co-registered to their anatomical references image by using SPM12 following the recommendation in Friston et al. (1995). The anatomical reference images were used to create a group-specific template in stereotactic space. After gray and white matter segmentation with SPM, we used the DARTEL (Ashburner, 2007) toolbox to create the template and transform the functional images first to template space and subsequently to MNI-Space by using the created DARTEL flow fields. The preprocessed images were then used for the functional connectivity analysis.
Network representation
In the graph theory terms, a graph consists of vertices
Atlas
We intended to create a study-specific brain atlas with sufficiently small and equally sized regions. Therefore, we combined the Harvard Oxford Cortical and Harvard Oxford Subcortical Atlas and further sub-parcellated this combined atlas into subregions that define the ROIs used in this study. The division yielded 571 regions of an approximately equal volume (mean = 2.00 mL, SD = 0.21 mL). The computation minimizes the diameter of the regions (mean = 27.2 mm, SD = 8.5 mm), thereby minimizing the ratio of the longest to the shortest side in a region, to minimize interpolation errors in the resulting mesh. Regions were separated for the left and right cerebral hemispheres.
Functional connectivity
The blood oxygen level-dependent (BOLD) contrast in each series of fMRI is used to determine the functional connectivity between brain regions. We used the CONN functional connectivity toolbox to extract the time-series of BOLD contrast for each node (Whitfield-Gabrieli and Nieto-Castanon, 2012). The realignment parameters of the motion correction in SPM were used as covariates in the denoising of the single images to account for the potential correlation of motion artifacts and connectivity measures. The correlation of each two time-series then provides a connectivity matrix Z, where
Adjacency matrix
The connectivity matrix Z represents a complete graph, meaning that every two nodes are connected by an edge. Since especially small correlations are often subject to noise, and some graph metrics are harder to evaluate or not defined for complete graphs, we created the adjacency matrix A of our graph by thresholding the connectivity matrix. We used a local thresholding method implemented in the Python package Maybrain, with a 6% network density. First, a maximum-weight minimum-spanning tree is constructed. This tree connects all nodes with the minimum number of edges and the highest possible weights, hence the highest possible connectivity. This step is crucial to obtain a connected graph such that no node is isolated from the network. Next, we grew the network by successively adding the k-strongest connected edges of each node until the desired network density was obtained (Alexander-Bloch et al., 2010).
Tau burden
SUVR images were re-aligned to the Atlas Space, and tau SUVRs from each region were extracted for further analysis.
Community structures
A community is a set of highly interconnected nodes, with only weak connections to nodes belonging to different communities. Heuristic methods algorithmically determine such partitions, usually based on the optimization of modularity
Connectivity measures
We use different graph metrics as connectivity measures to describe the brain network's architecture and the role or centrality of each node in the network. All metrics were calculated in Python with Maybrain (
Weighted degree: The weighted degree of a node is calculated as the weighted sum of its connections. We can imagine this as the number of streets attached to a farm in our introductory example. Since the brain regions used as nodes in our network all have approximately the same size, weighted degree relates to the connected volumes of the cortex and the strength of these connections. The weighted degree of a network is calculated as the average weighted degree of all nodes. It measures the overall connection strength of a network.
Participation coefficient: The participation coefficient describes the distribution of the edges of a node to different communities (Joyce et al., 2010). It is used to distinguish between provincial and connector hubs. A node with a low participation coefficient is a provincial hub, such that a high proportion of its connections are connections to nodes within one community structure, whereas a node with a high participation coefficient serves as a connector hub (i.e., a market in the farm analogy) between community structures.
The average participation coefficient across all nodes indicates the network organization. A low participation coefficient of a network means that the network has an extended community structure organization, and there are only a few connector hubs between communities.
Clustering coefficient: Groups of nodes in a graph that form a complete subgraph (i.e., every two nodes are connected) are called cliques. The local clustering coefficient of a graph describes the tendency of a node to form a clique with its neighbors. Hence, a strong averaged clustering coefficient indicates a robust network architecture, where the loss of a single edge can be easily compensated. Moreover, information processing is very efficient in a clique, as every node can communicate with every other. In our introductory example, every two houses belonging to the same village are connected by a street. The clustering coefficient of our island, therefore, is very high since all farms except the markets form a clique with its neighbors.
Analysis methods
All analyses explained later, as well as statistical analyses including Pearson correlation and independent t-test, were performed in Python by using numpy (Version 1.13.3), scipy (Version 1.0.0), statsmodels (Version 0.10.2), seaborn (Version 0.9.0), and nilearn (Version 0.6.1).
Deviation analysis
The deviation analysis was used to investigate disease-related changes in network connectivity and architecture. We compared whole-brain averaged connectivity measures in the AD and senior control group to expose changes in the global network architecture.
Community structure analysis
A new community structure analysis pipeline further investigated changes in the network architecture. We first considered group-averaged brain networks. To this end, we compared the degree to which each patient group's brain is organized in functional units by using modularity, system segregation, and community affiliation of the algorithmically detected partitions. The modularity of a partition C is calculated as
where ci
is the community of node i,
where
where
As a second step, we measured the changes of community structures from the young, healthy controls to the senior controls and the AD group. As there is no one-to-one mapping of communities possible along with the patient groups, we chose each community of the average, young healthy partition as the reference community. We defined its group-counterpart as the community with the highest node-intersection in the senior control and, respectively, AD partition. The coverage of a group-partition was then calculated as the total node intersection with the reference partition across all communities. It thereby measures the number of nodes still affiliated with the community formation of the young, healthy control sample (Fig. 1).
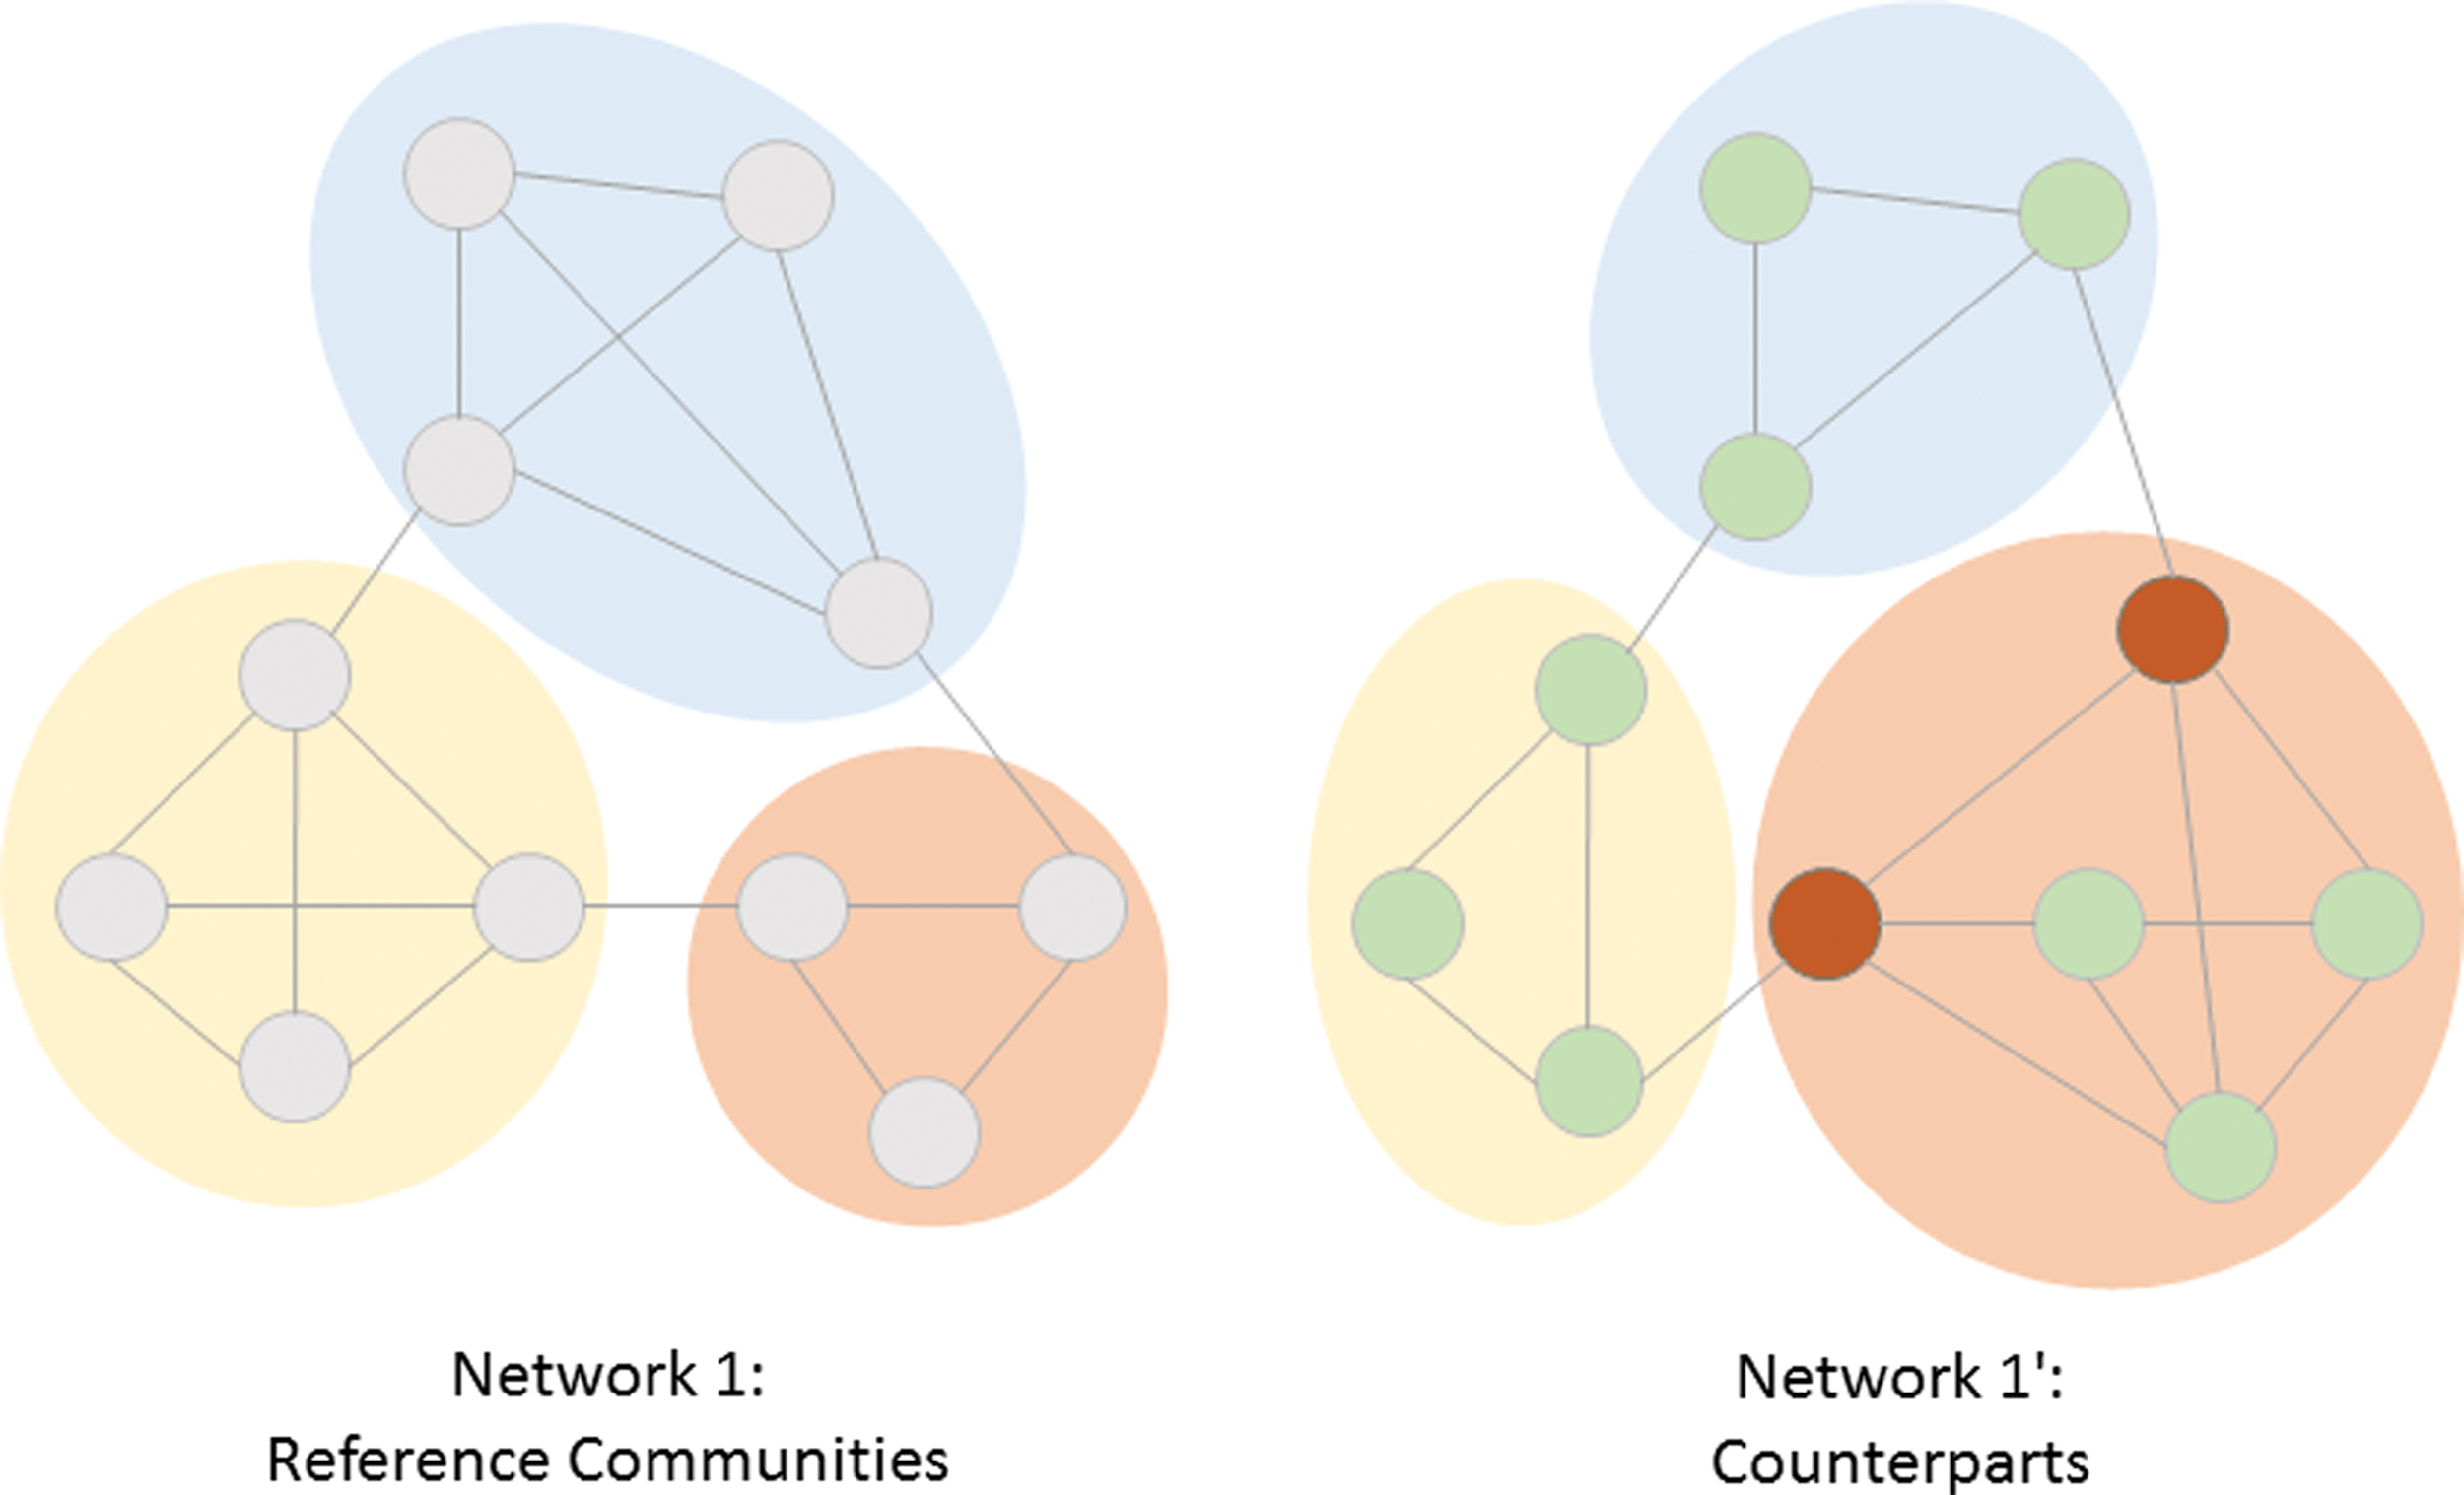
Community counterparts. Community partitions are determined in both network 1 and the changed network 1′. Communities in network 1 are used as reference communities. Their counterparts in the partition of network 1′ are determined by calculating node intersections, as explained in the Materials and Methods section. Counterparts are marked by color. Staying nodes in network 1′ are colored green; leaving nodes that lose their affiliation to the reference communities are colored red. The coverage of the partition of network 2 is ∼82% (9 nodes are affiliated to their original community; 2 nodes lose affiliation). Color images are available online.
The last analysis was designed to identify disease-related changes in community organization by analyzing the counterparts on a node-wise level. For each reference community and its associated AD-counterpart, we defined two groups of nodes: Nodes still affiliated with the reference community were called “staying nodes,” and nodes connected to a new community were called “leaving nodes.” The leaving nodes were then further differentiated into nodes that also leave the reference community in the senior control brain and nodes that only leave their community in the AD brain. Nodes leaving only in AD were used to identify disease-related changes in community organization. All groups of nodes were compared with respect to their SUVR deviation to investigate the impact of tau on community reorganization.
Results
Significant loss of connectivity and robustness in AD
The deviation analysis of age-matched controls and AD patients revealed substantial differences in the whole-brain network architecture. The significant decrease of the weighted degree [Fig. 2A; t(31.4251) = −5.90, p < 0.0001] across all patients indicates a loss of overall functional connectivity of the brain network in AD. Moreover, we observed a significant increase in the participation coefficient in AD [Fig. 2B; t(34.5071) = 3.74, p = 0.0007], suggesting a reorganization of community structures and a decline in the clustering coefficient [Fig. 2C; t(35.7412) = −6.21, p < 0.0001]. This finding indicates that the degree of coupling between small groups of nodes was reduced. With respect to the whole network, this causes a reduction of robustness.
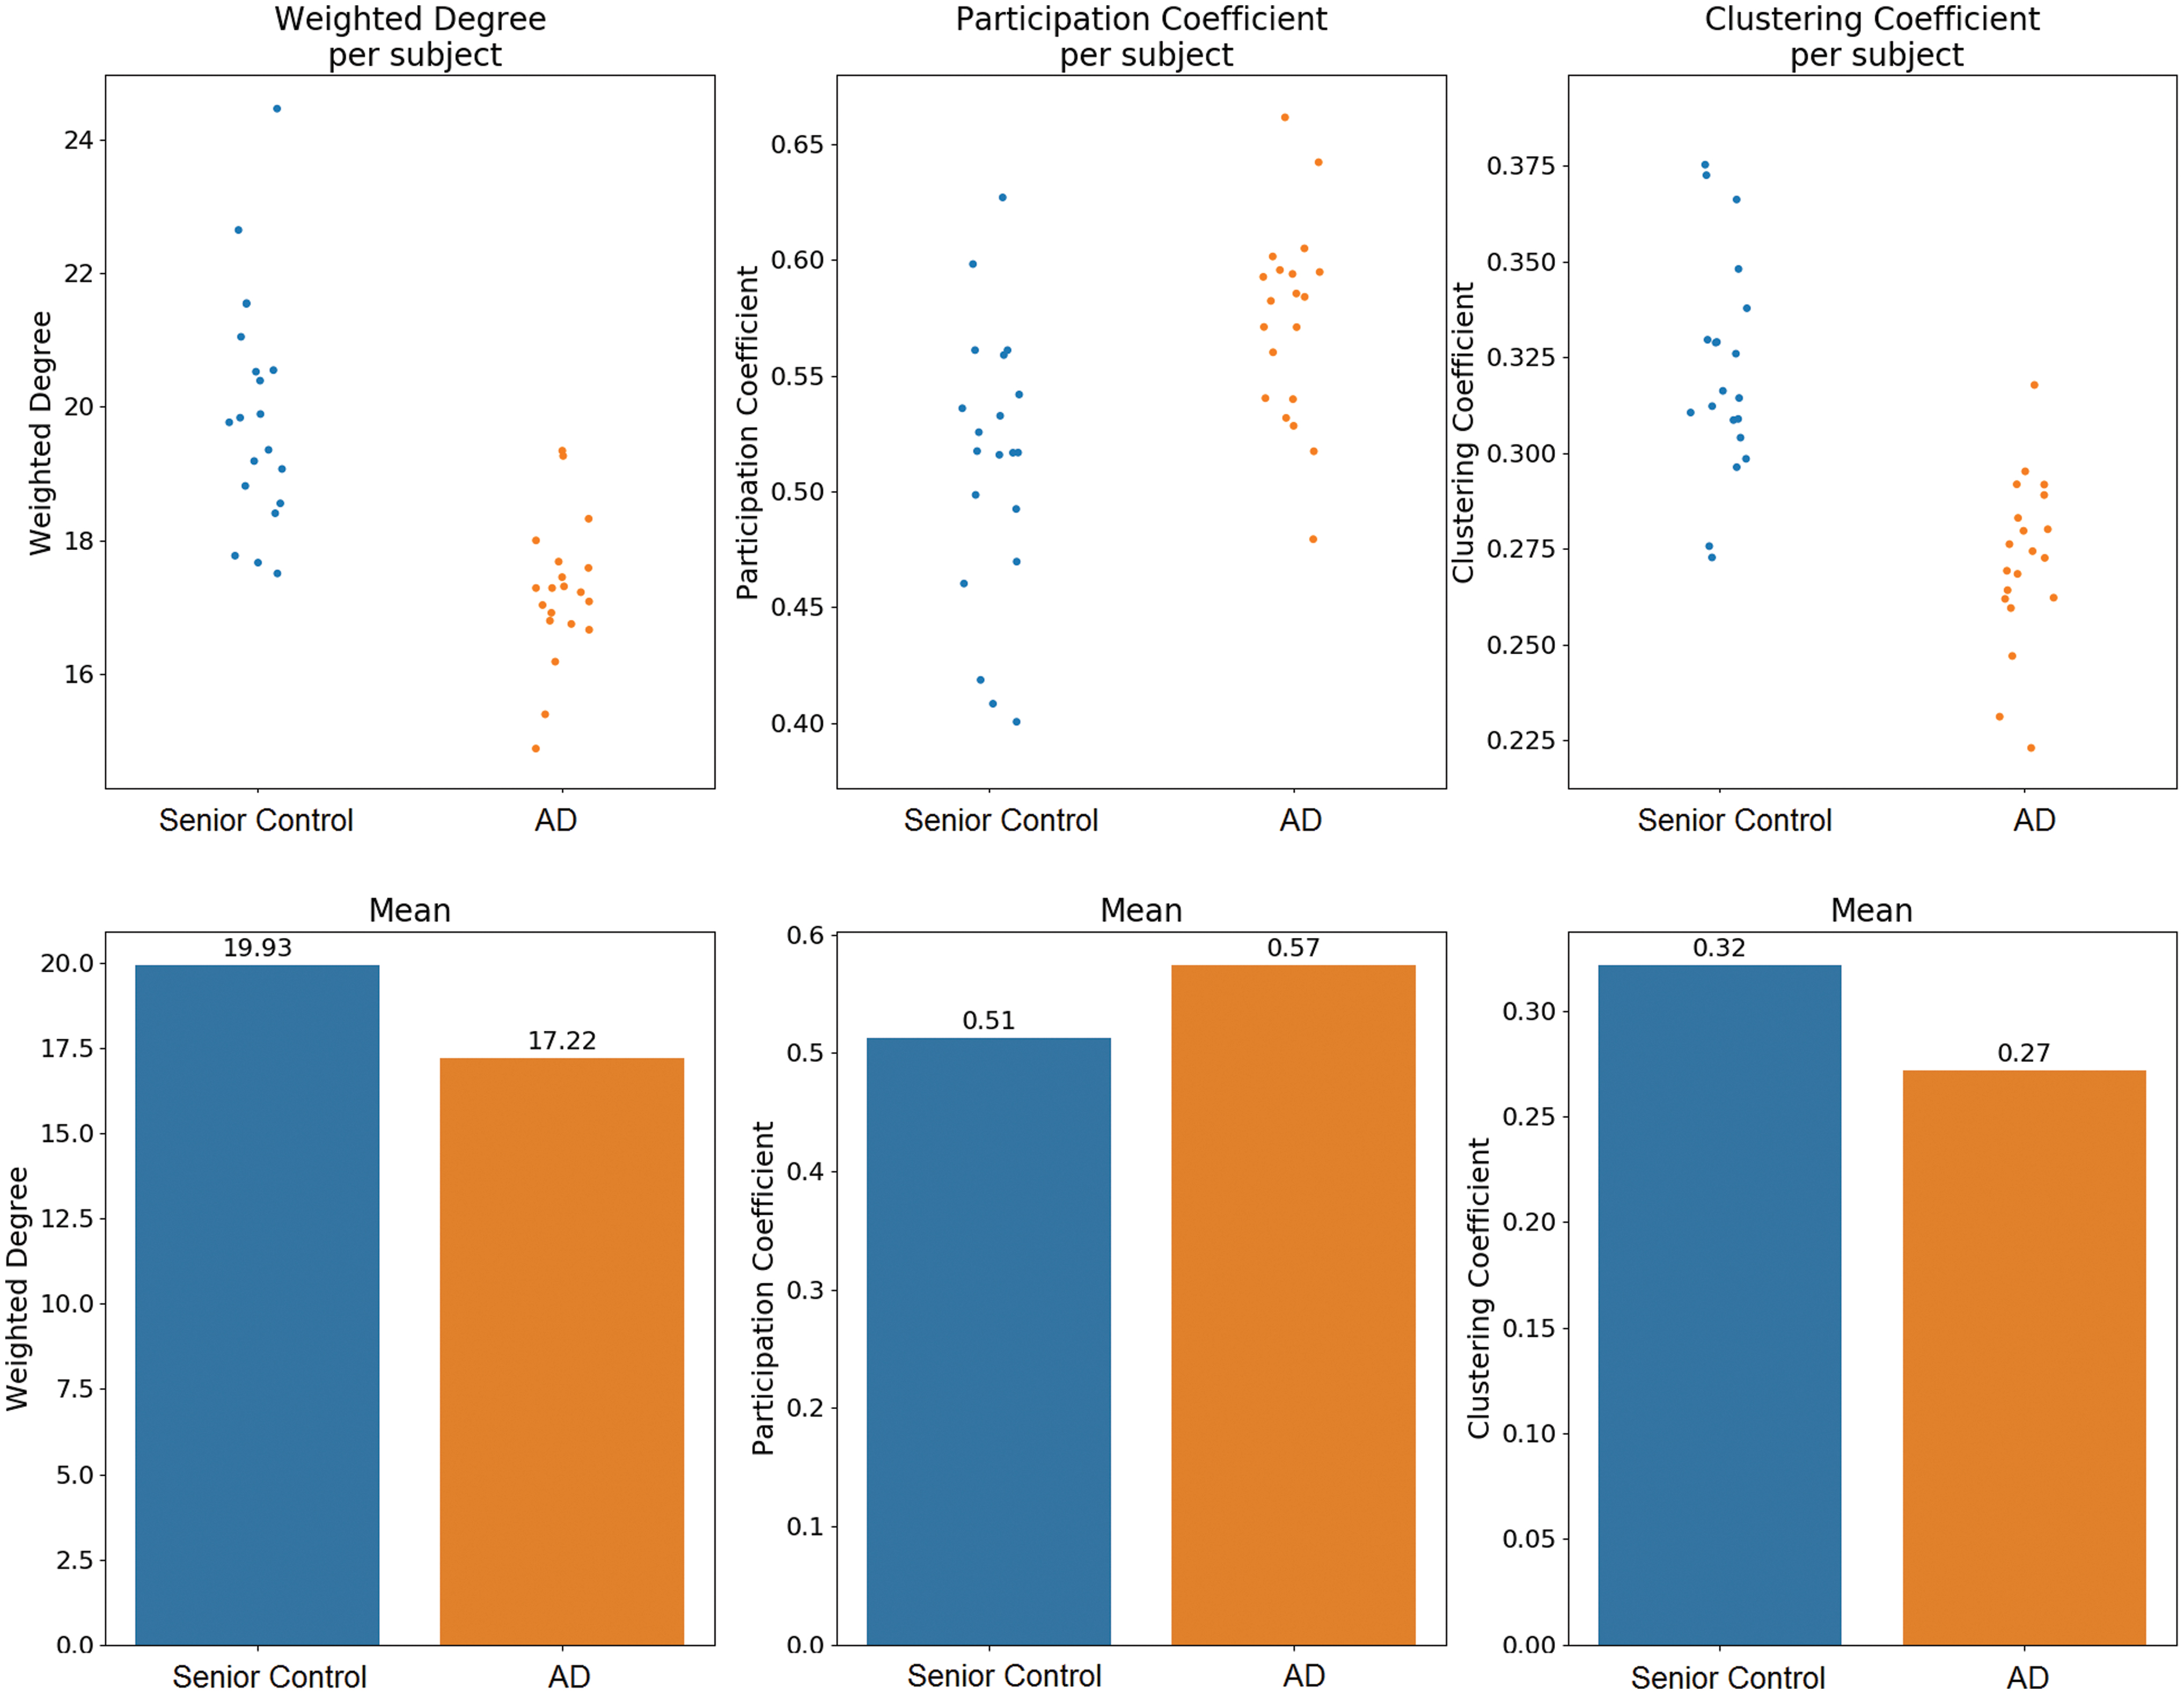
Whole-brain average deviation. Connectivity measures
Differences in network partition of the AD average brain
As pointed out in the deviation analysis, changes of connectivity measures in the brain of patients with AD suggest a network reorganization as compared with the senior control group. Especially the strong increase of the participation coefficients signifies that this reorganization affects the formation of community structures. To verify this assumption, we first compared the averaged AD brain network with both the averaged young healthy and senior control network with respect to the quality of the algorithmically detected community structures. The communities detected in the average brain network of each patient group are illustrated in Figure 3. For the young control network, eight communities were detected, whereas the AD and senior control network only consisted of seven, respectively six communities. Both the senior control and AD communities differed from the young control formations, whereby the reorganization in AD appears to be more radical. Specifically, we observed an obvious shift from a unilateral organization of the frontal lobe in young controls to a bilateral organization in both senior controls and AD, where the AD community appears to be more compact (Fig. 3).
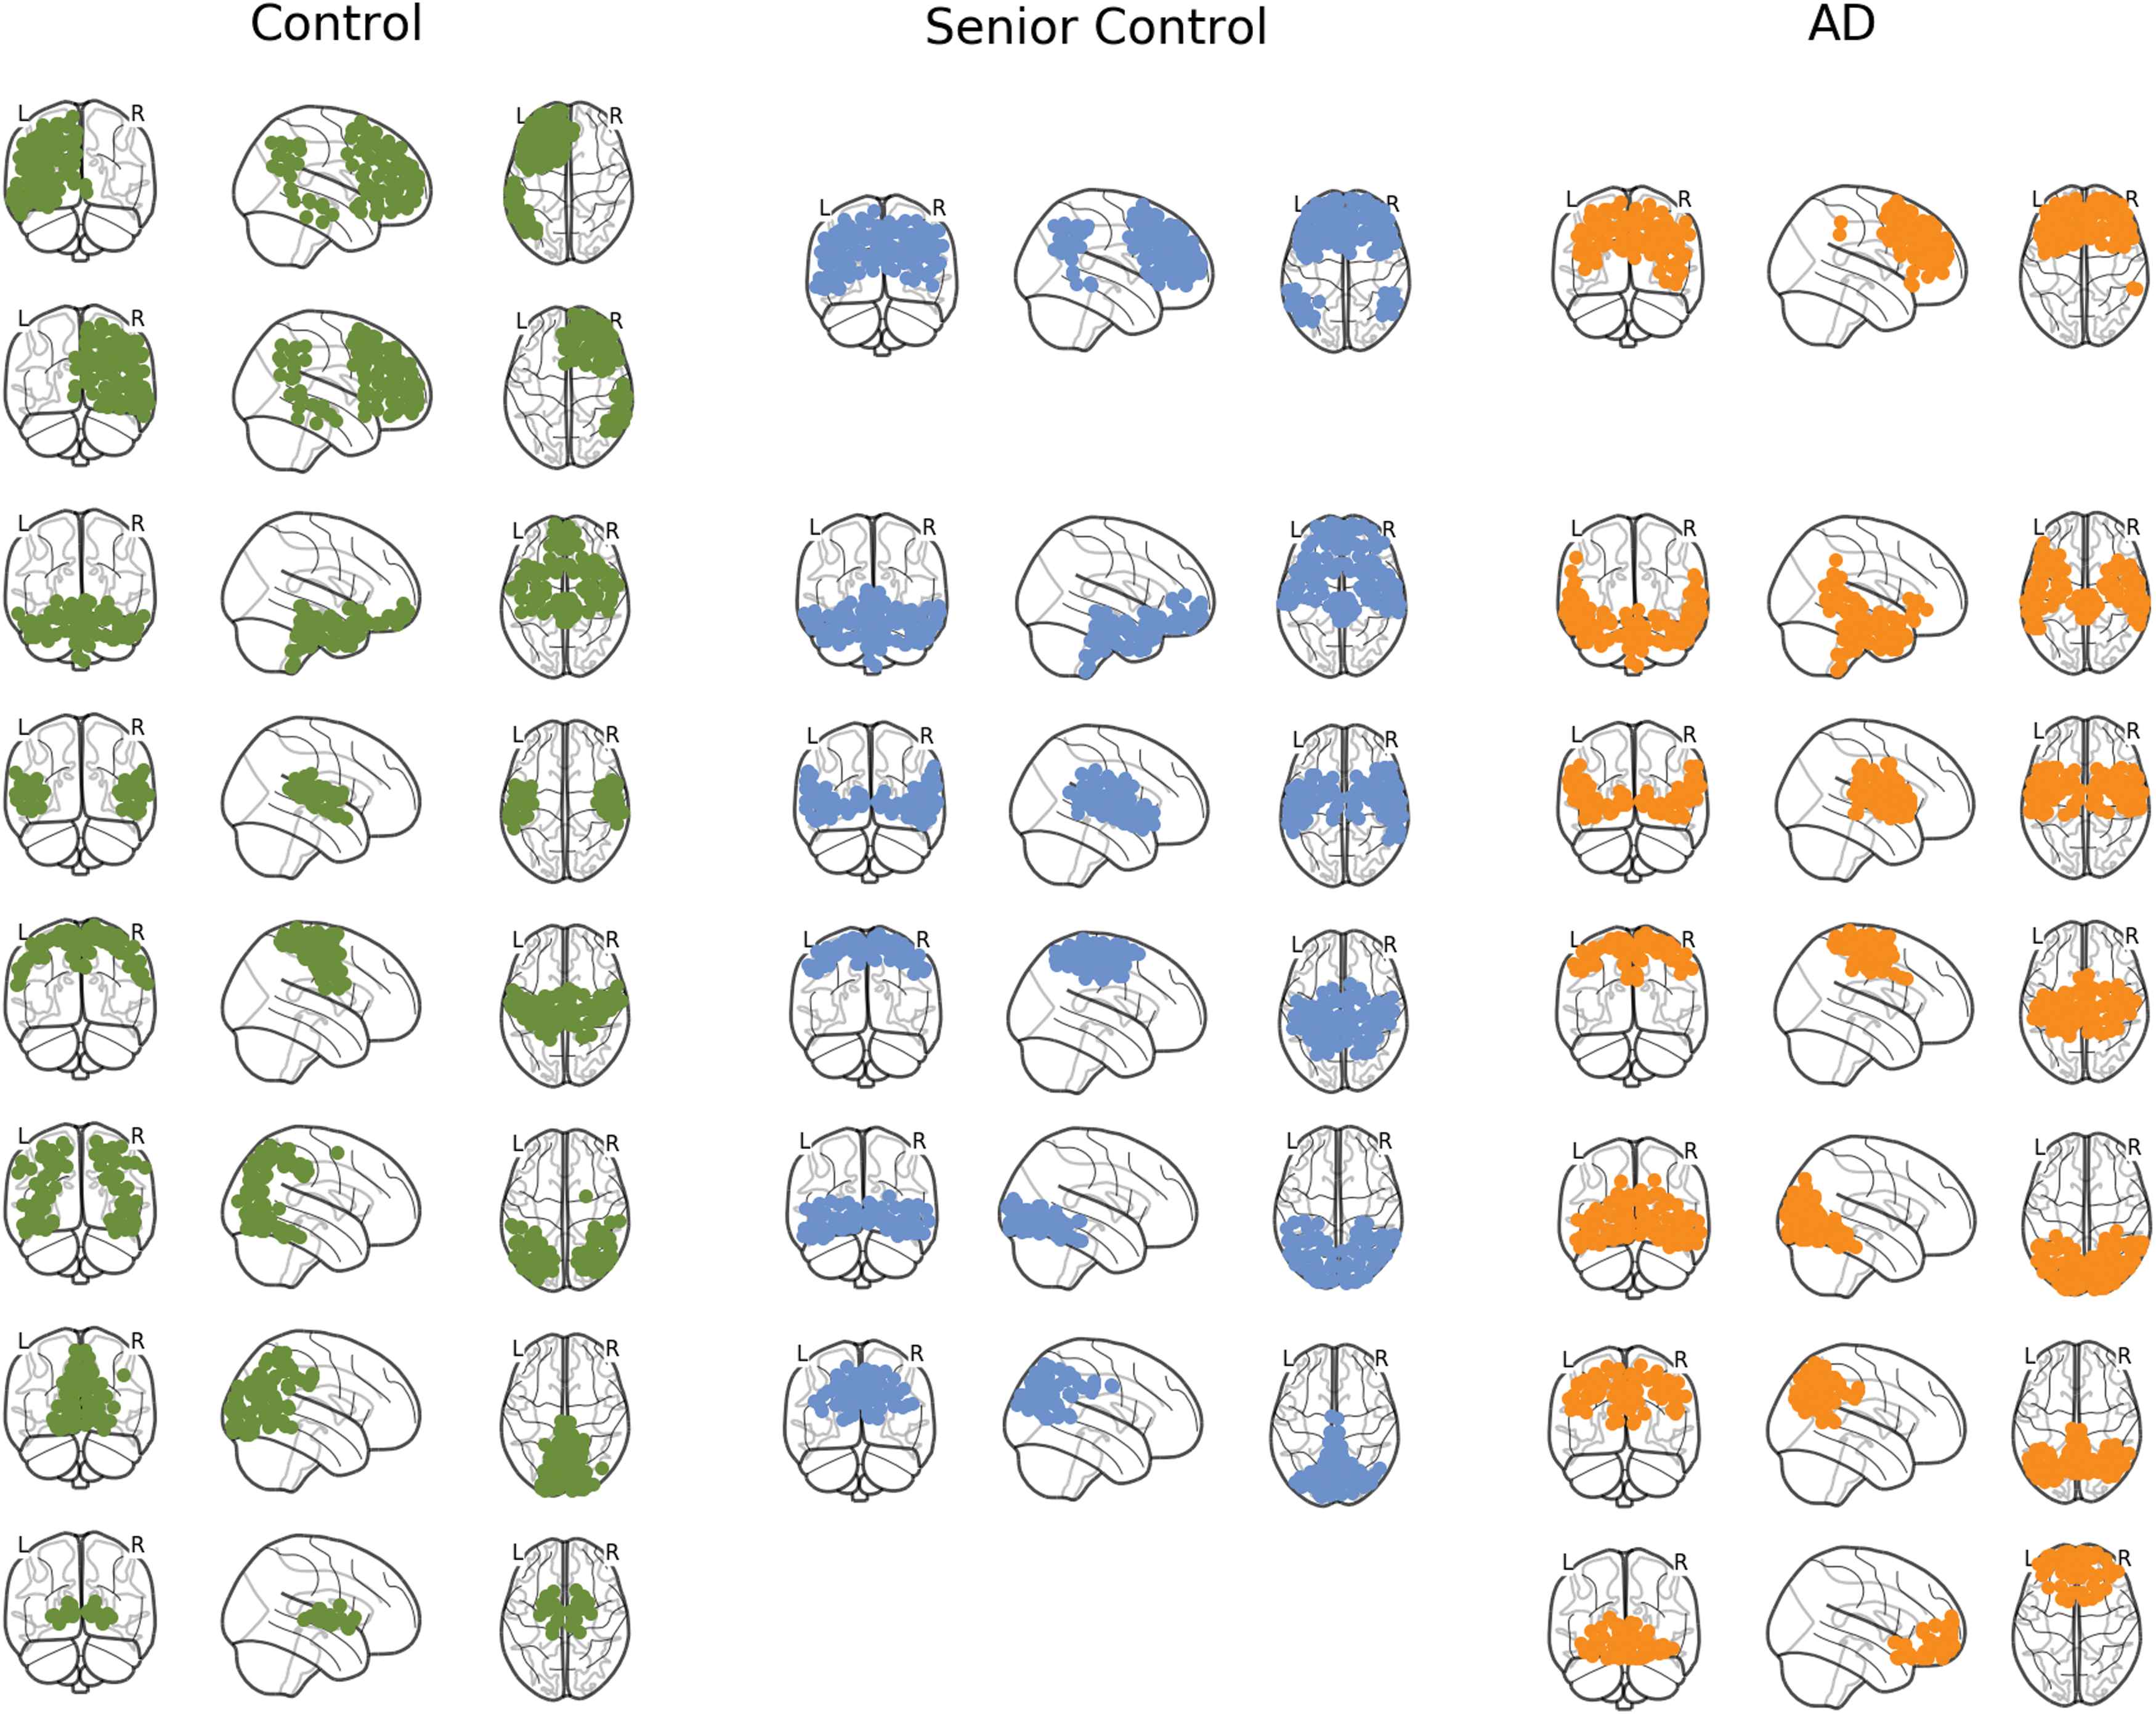
Community structures of young controls, senior controls, and patients with AD. Community structures detected by the Louvain community detection algorithm for each population. The partition yielded eight modules for the young control, seven modules for the AD group, and six modules for the senior control group. Across multiple random calls of the algorithm, similar amounts of communities were detected, ranging from 6 to 10 modules. Color images are available online.
To further quantify the observed differences in community reorganization, we examined modularity, segregation, and node affiliation measures (see Materials and Methods for details). As the detection algorithm is heuristic and therefore depends on the initial node allocation, we repeated the analysis with 1000 calls of the community detection algorithm. We observed that, in fact, modularity and segregation were reduced in the AD group compared with both control groups (Fig. 4A, B), and node affiliation was also reduced in AD (Fig. 4C) compared with the senior controls. Moreover, community structures in the AD group were characterized by lower Euclidian distance of nodes belonging to the same community (Fig. 4D).
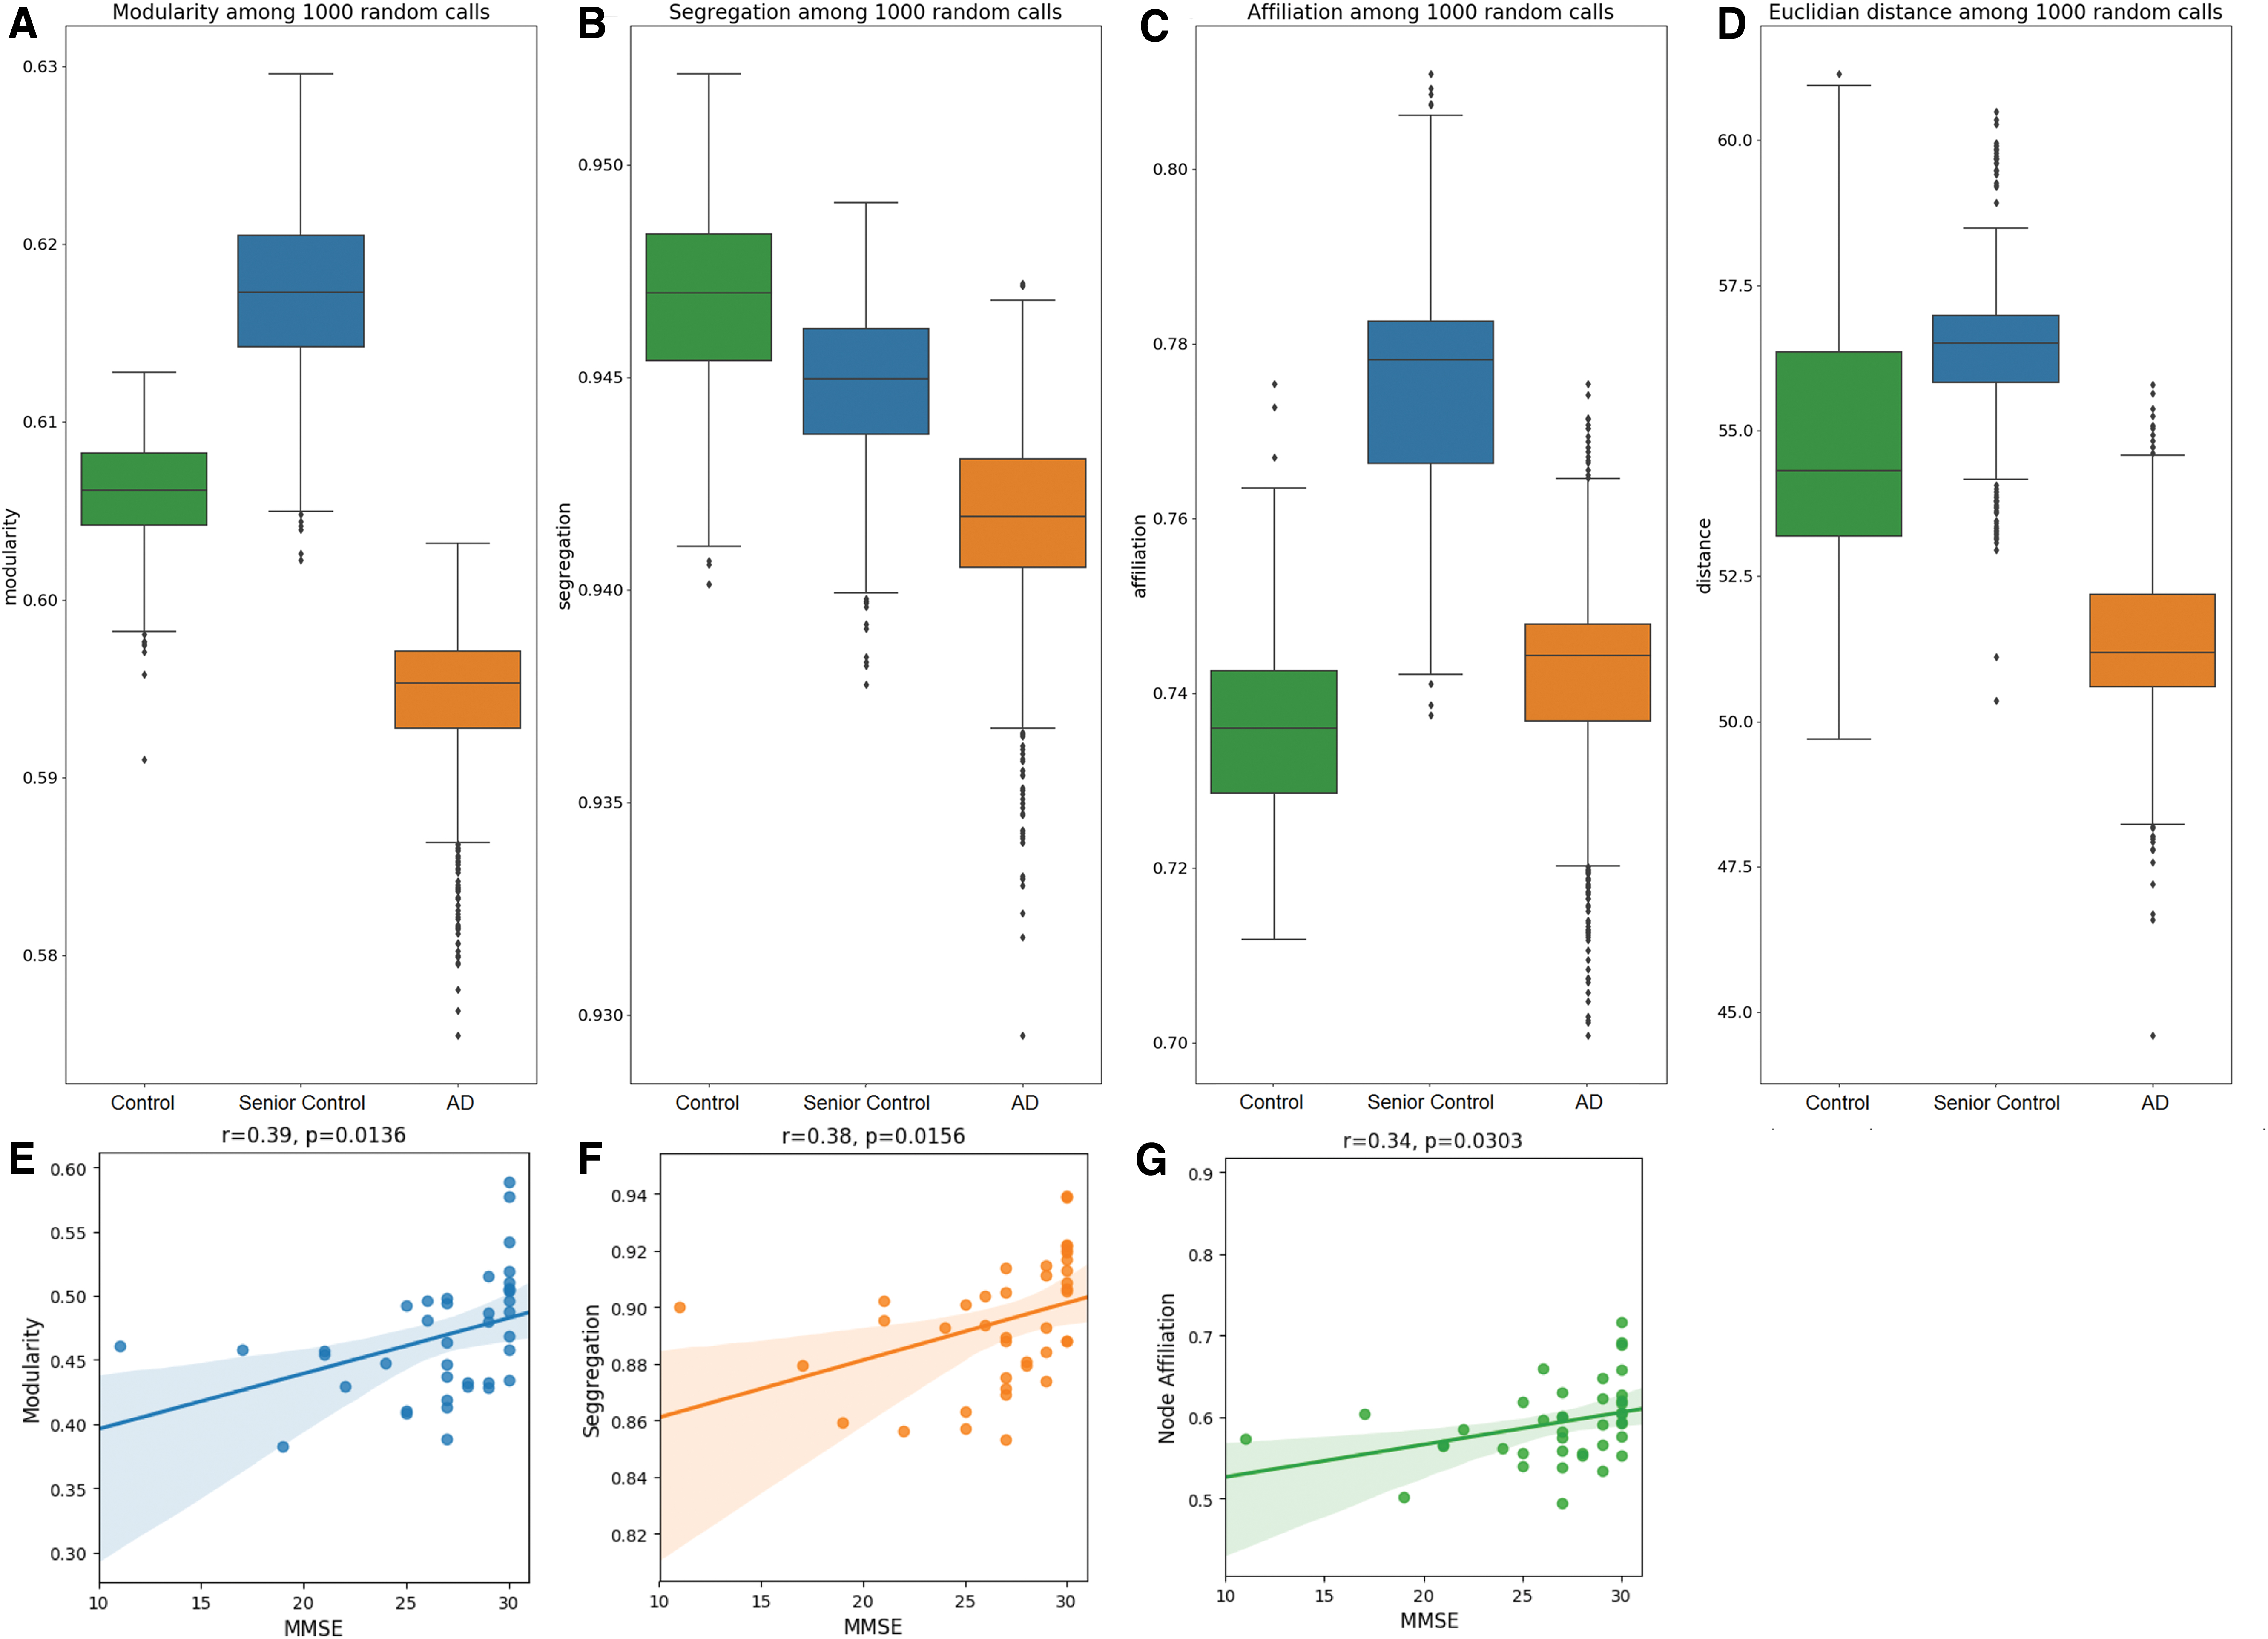
Quality of community structure organization. Different measures to characterize community structures across 1000 random calls of the community detection algorithm for each patient group
As modularity is the most common optimization function in community detection, the decrease is strong evidence for a weaker community structure organization, finding a similarly significant decrease in modularity from both young controls to AD [t(1872) = 70.05, p < 0.001] and senior controls to AD [t(1971) = 114.58, p < 0.001]. The relevance of this finding for loss of global cognitive function was further supported by significant relationships between each measure of network connectivity and MMSE scores. Specifically, we observed a significant correlation for MMSE with modularity (r = 0.39, p = 0.0136; Fig. 4E), segregation (r = 0.38, p = 0.0156; Fig. 4F), and node affiliation (r = 0.34, p = 0.0303; Fig. 4F) suggesting that decreases in any of these measures is related to a loss of global cognitive function (Fig. 4).
Striking reorganization of community structures in AD
The quality differences in community structures were further explored in two ways: First, we investigated whether the original communities keep their formation and connections are simply weaker in the AD brain or whether the whole organization changes. We used the seven community structures detected in the young, healthy controls' brains as reference communities and determined their average senior and AD counterpart communities by optimizing node intersections. The resulting coverage of the average AD counterpart communities, calculated as the total node intersections across all communities, was significantly lower [t(1965) = −40.71, p < 0.001] than the coverage across the average senior control communities among 1000 calls of the community detection algorithm (Fig. 5A), indicating a disease-related reorganization of community organization in AD. The coverage with the reference control communities was also calculated across single patients, again demonstrating a loss of coverage for patients with AD [Fig. 5B, t(35.46) = −2.21, p = 0.0332].
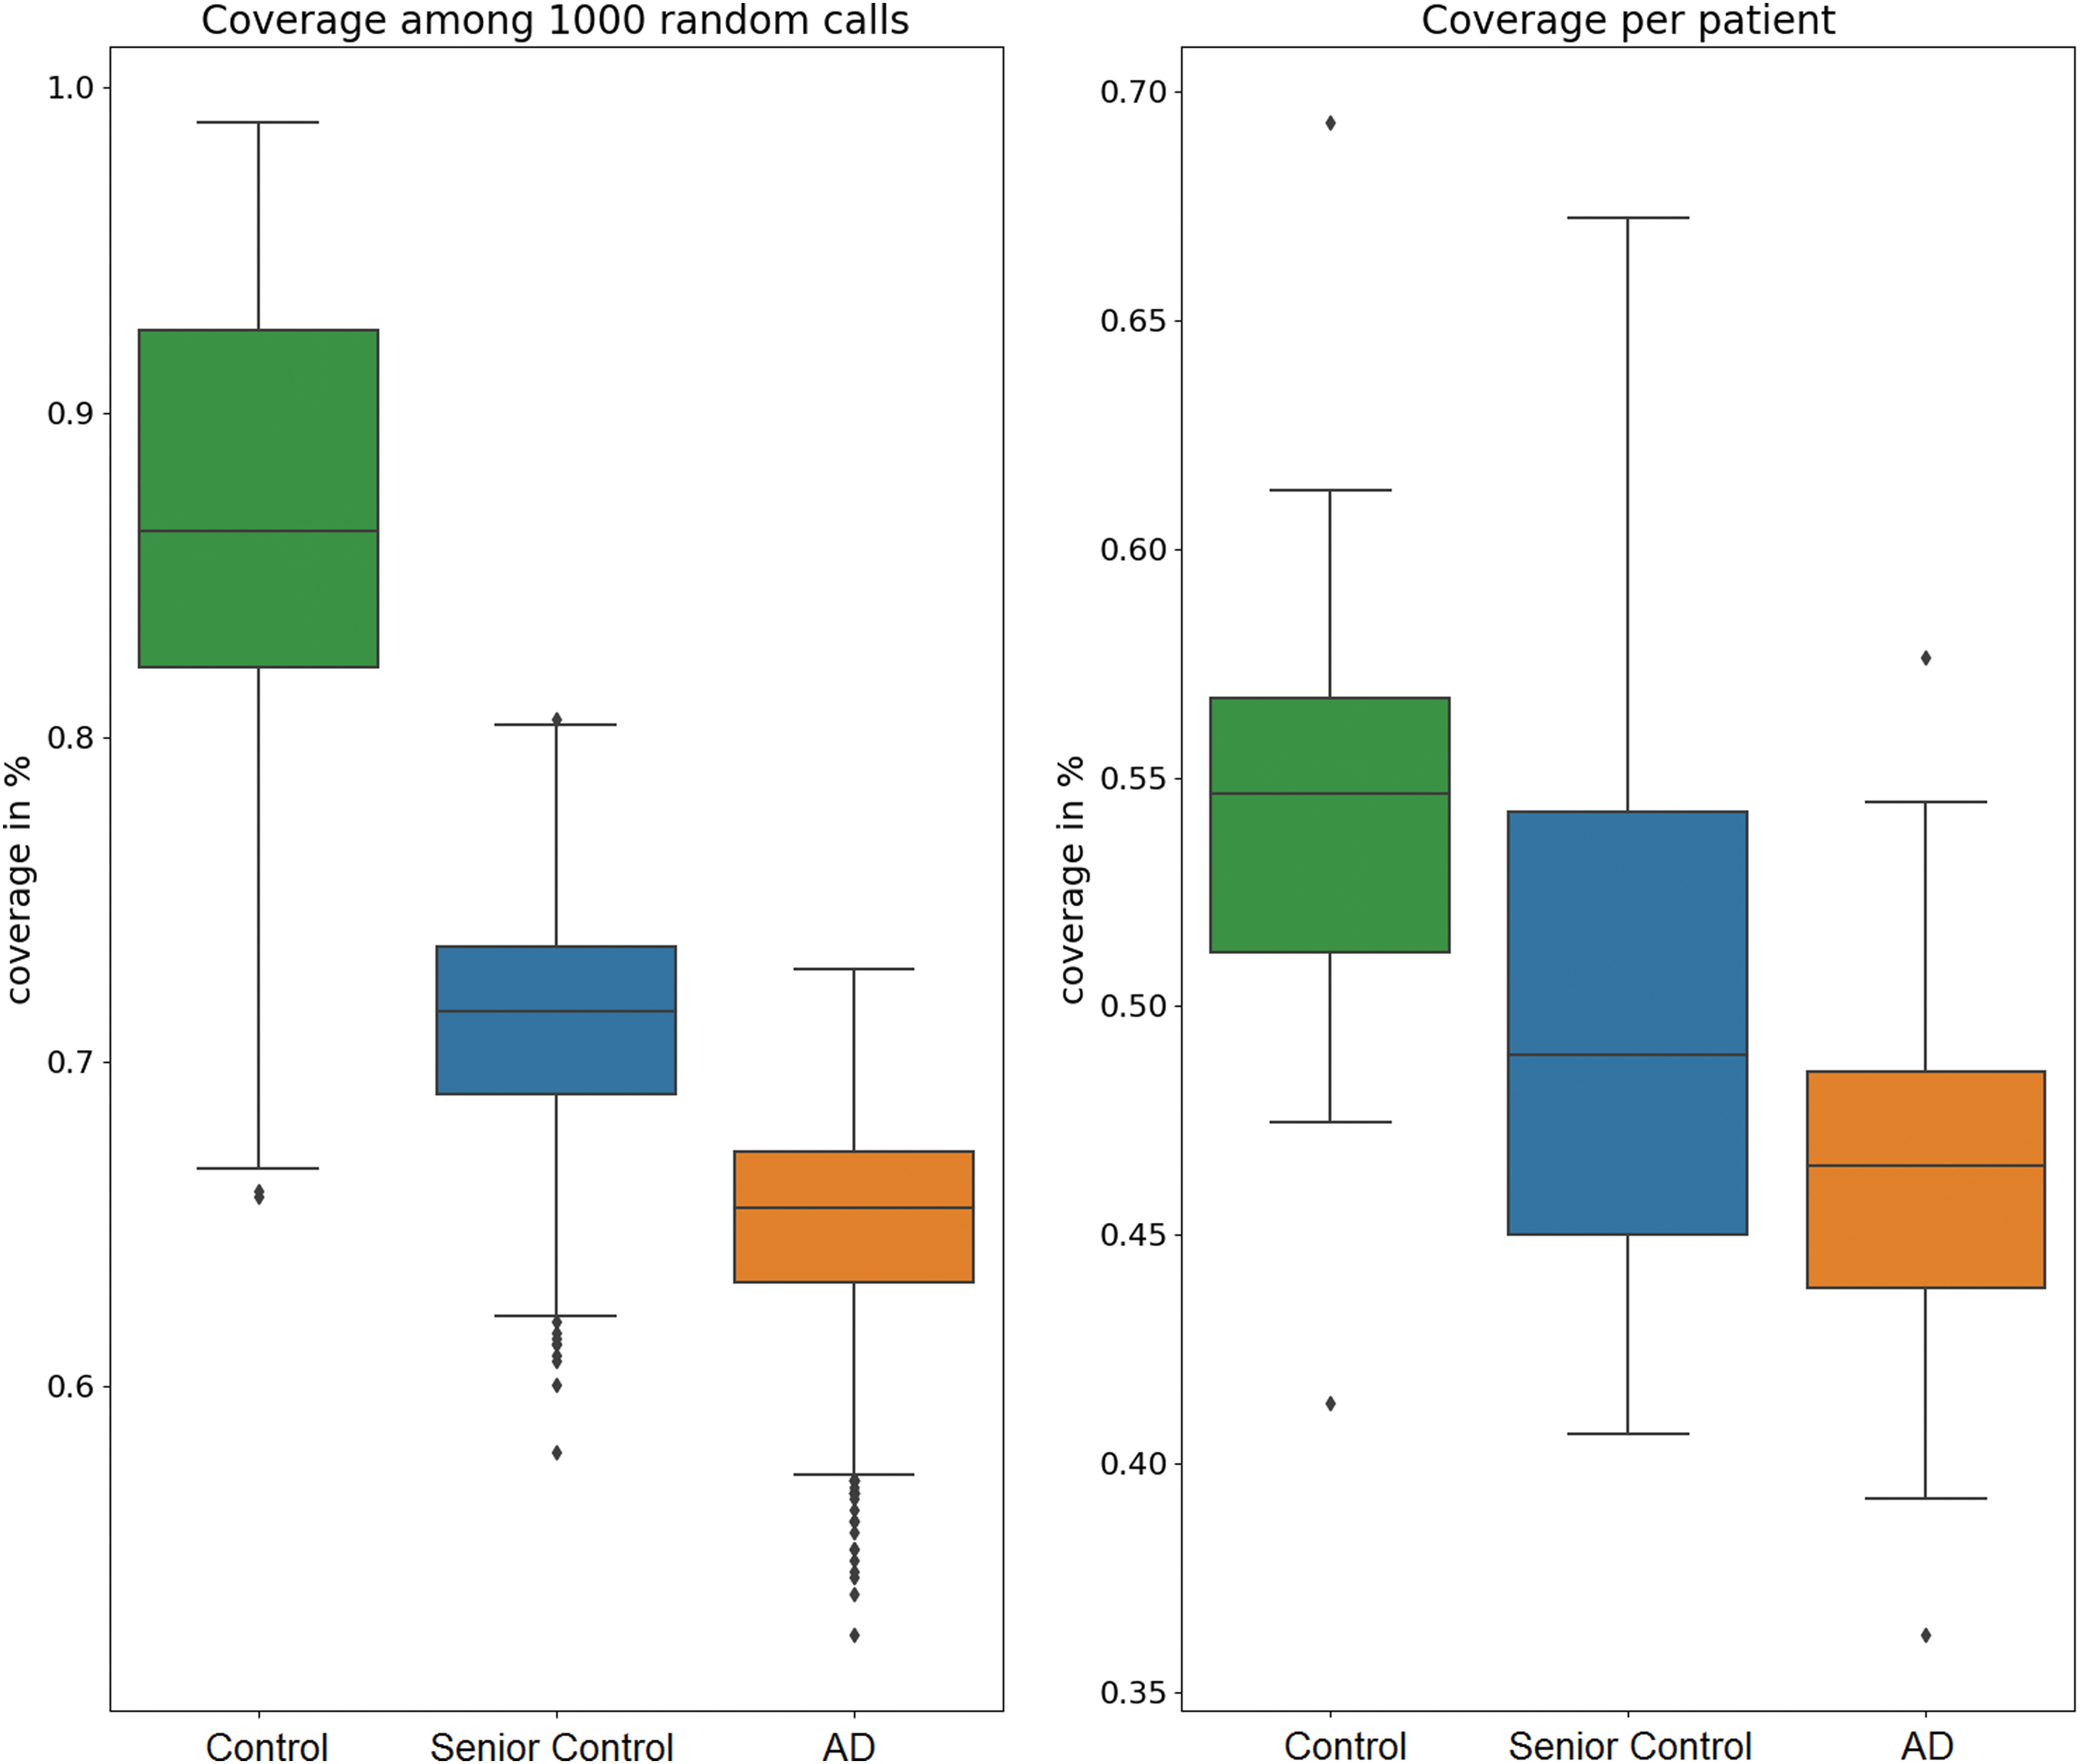
Community coverage. Communities detected in the young control population were considered as reference communities. The coverage was calculated as the total node intersection with the reference partition across all communities and evaluated across multiple calls of the community detection algorithm for the group-averaged brain networks and across individual patients. Color images are available online.
Disease-related tau accumulation is associated with community reorganization
The detailed node-wise community analysis revealed significant differences between our defined node groups. Nodes in the AD brain still belonging to their reference community of young, healthy controls are called staying nodes, whereas nodes that are no longer part of their “original” community are referred to as leaving nodes. Compared with the staying nodes, we observed a significantly higher tau-deviation (i.e., higher local tau pathology) in leaving nodes [t(1998) = 111.13, p < 0.0001], as well as a significantly higher average Euclidian distance to other nodes in the original community [t(1563.66) = 275.28, p < 0.001] (Fig. 6C). Moreover, these deviations could also be reproduced in the nodes leaving in the AD brain but not in the senior brain. These nodes are assumed to reflect a disease-related community decay and also have a significantly higher tau deviation [t(1998) = 57.45, p < 0.001] than nodes staying in their reference community in AD (Fig. 6A).
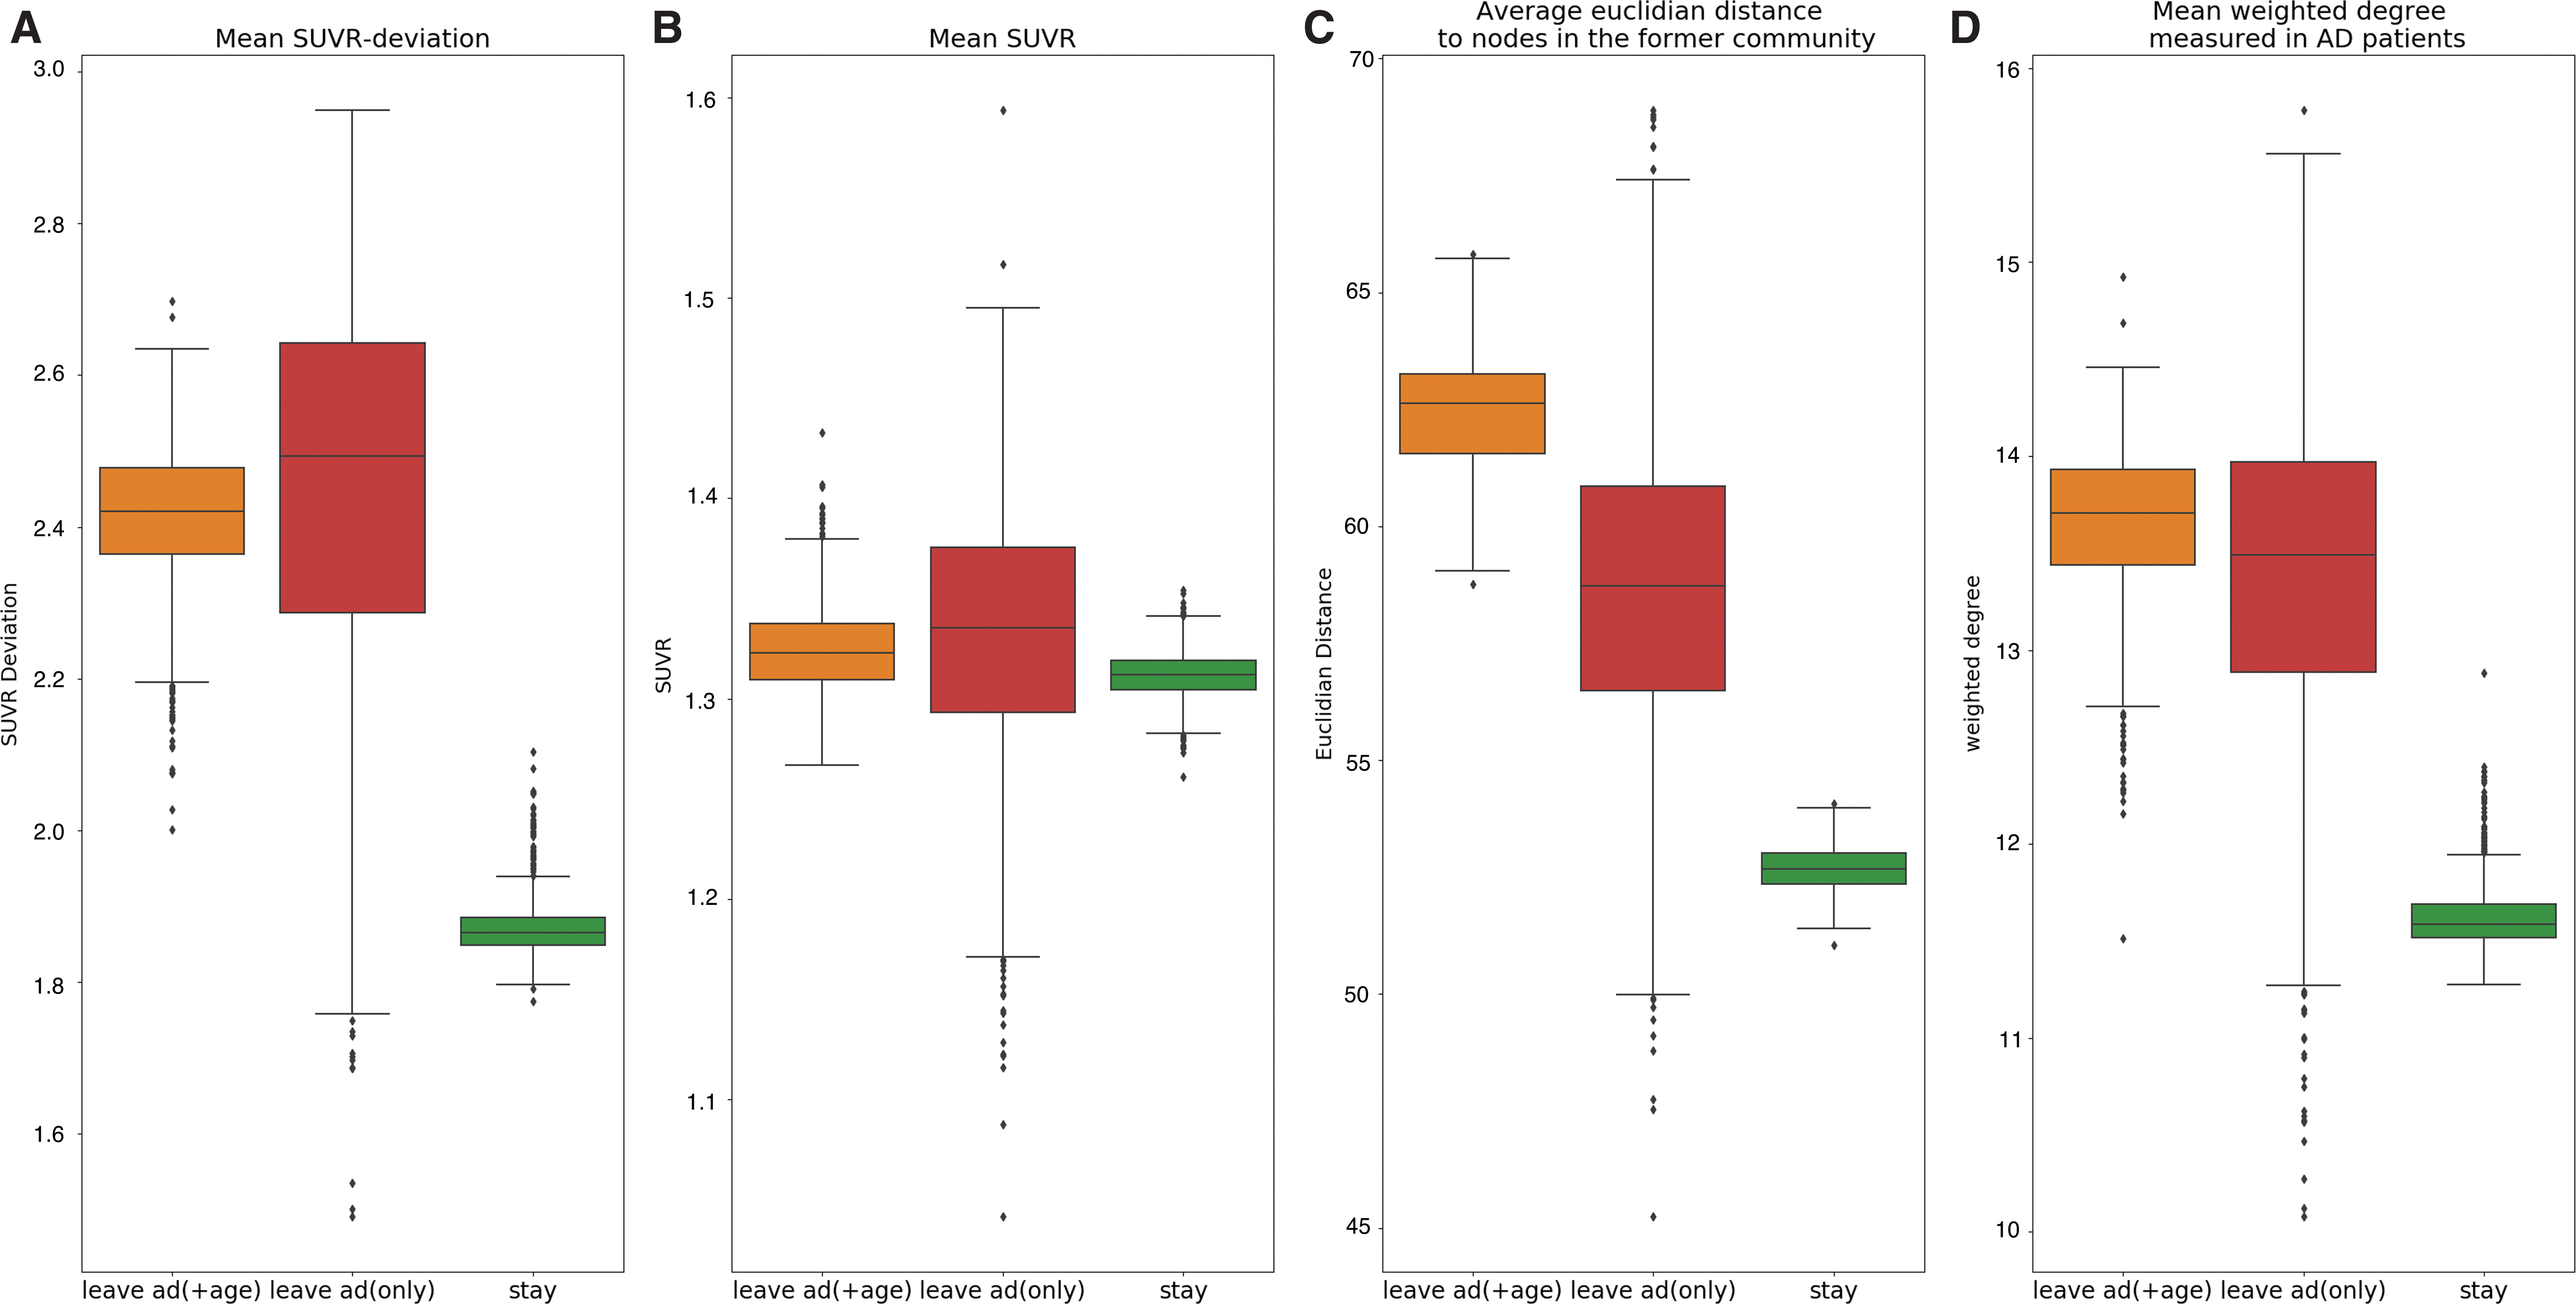
Leaving nodes. Nodes still affiliated to the reference young control community were classified as “staying nodes.” Nodes connected to a new community were called “leaving nodes.” Leaving nodes were then further differentiated into nodes that also left the reference community in the senior control brain and nodes that only left their community in the AD brain. The three groups of nodes were calculated across 1000 random calls of the community detection algorithm and compared in terms of
To emphasize the overlap between SUVR deviation and leaving probability, we depicted in Figure 7A the findings related to tau deviation and illustrated the leaving probability (over 1000 random calls of the community detection algorithm) for each node of our network separately in Figure 7B. The overlap of these two figures (Fig. 7C) underscores our observation that higher leaving probability is associated with increased SUVR deviation, particularly in mid-temporal, parietal, and occipital regions. In addition, we observed a set of regions where the leaving probability was high, but the SUVR deviation was low. These regions were predominantly not only in subcortical areas such as the thalamus, putamen, and caudate, but also in frontal regions such as the frontal medial cortex, operculum, and orbitofrontal regions.
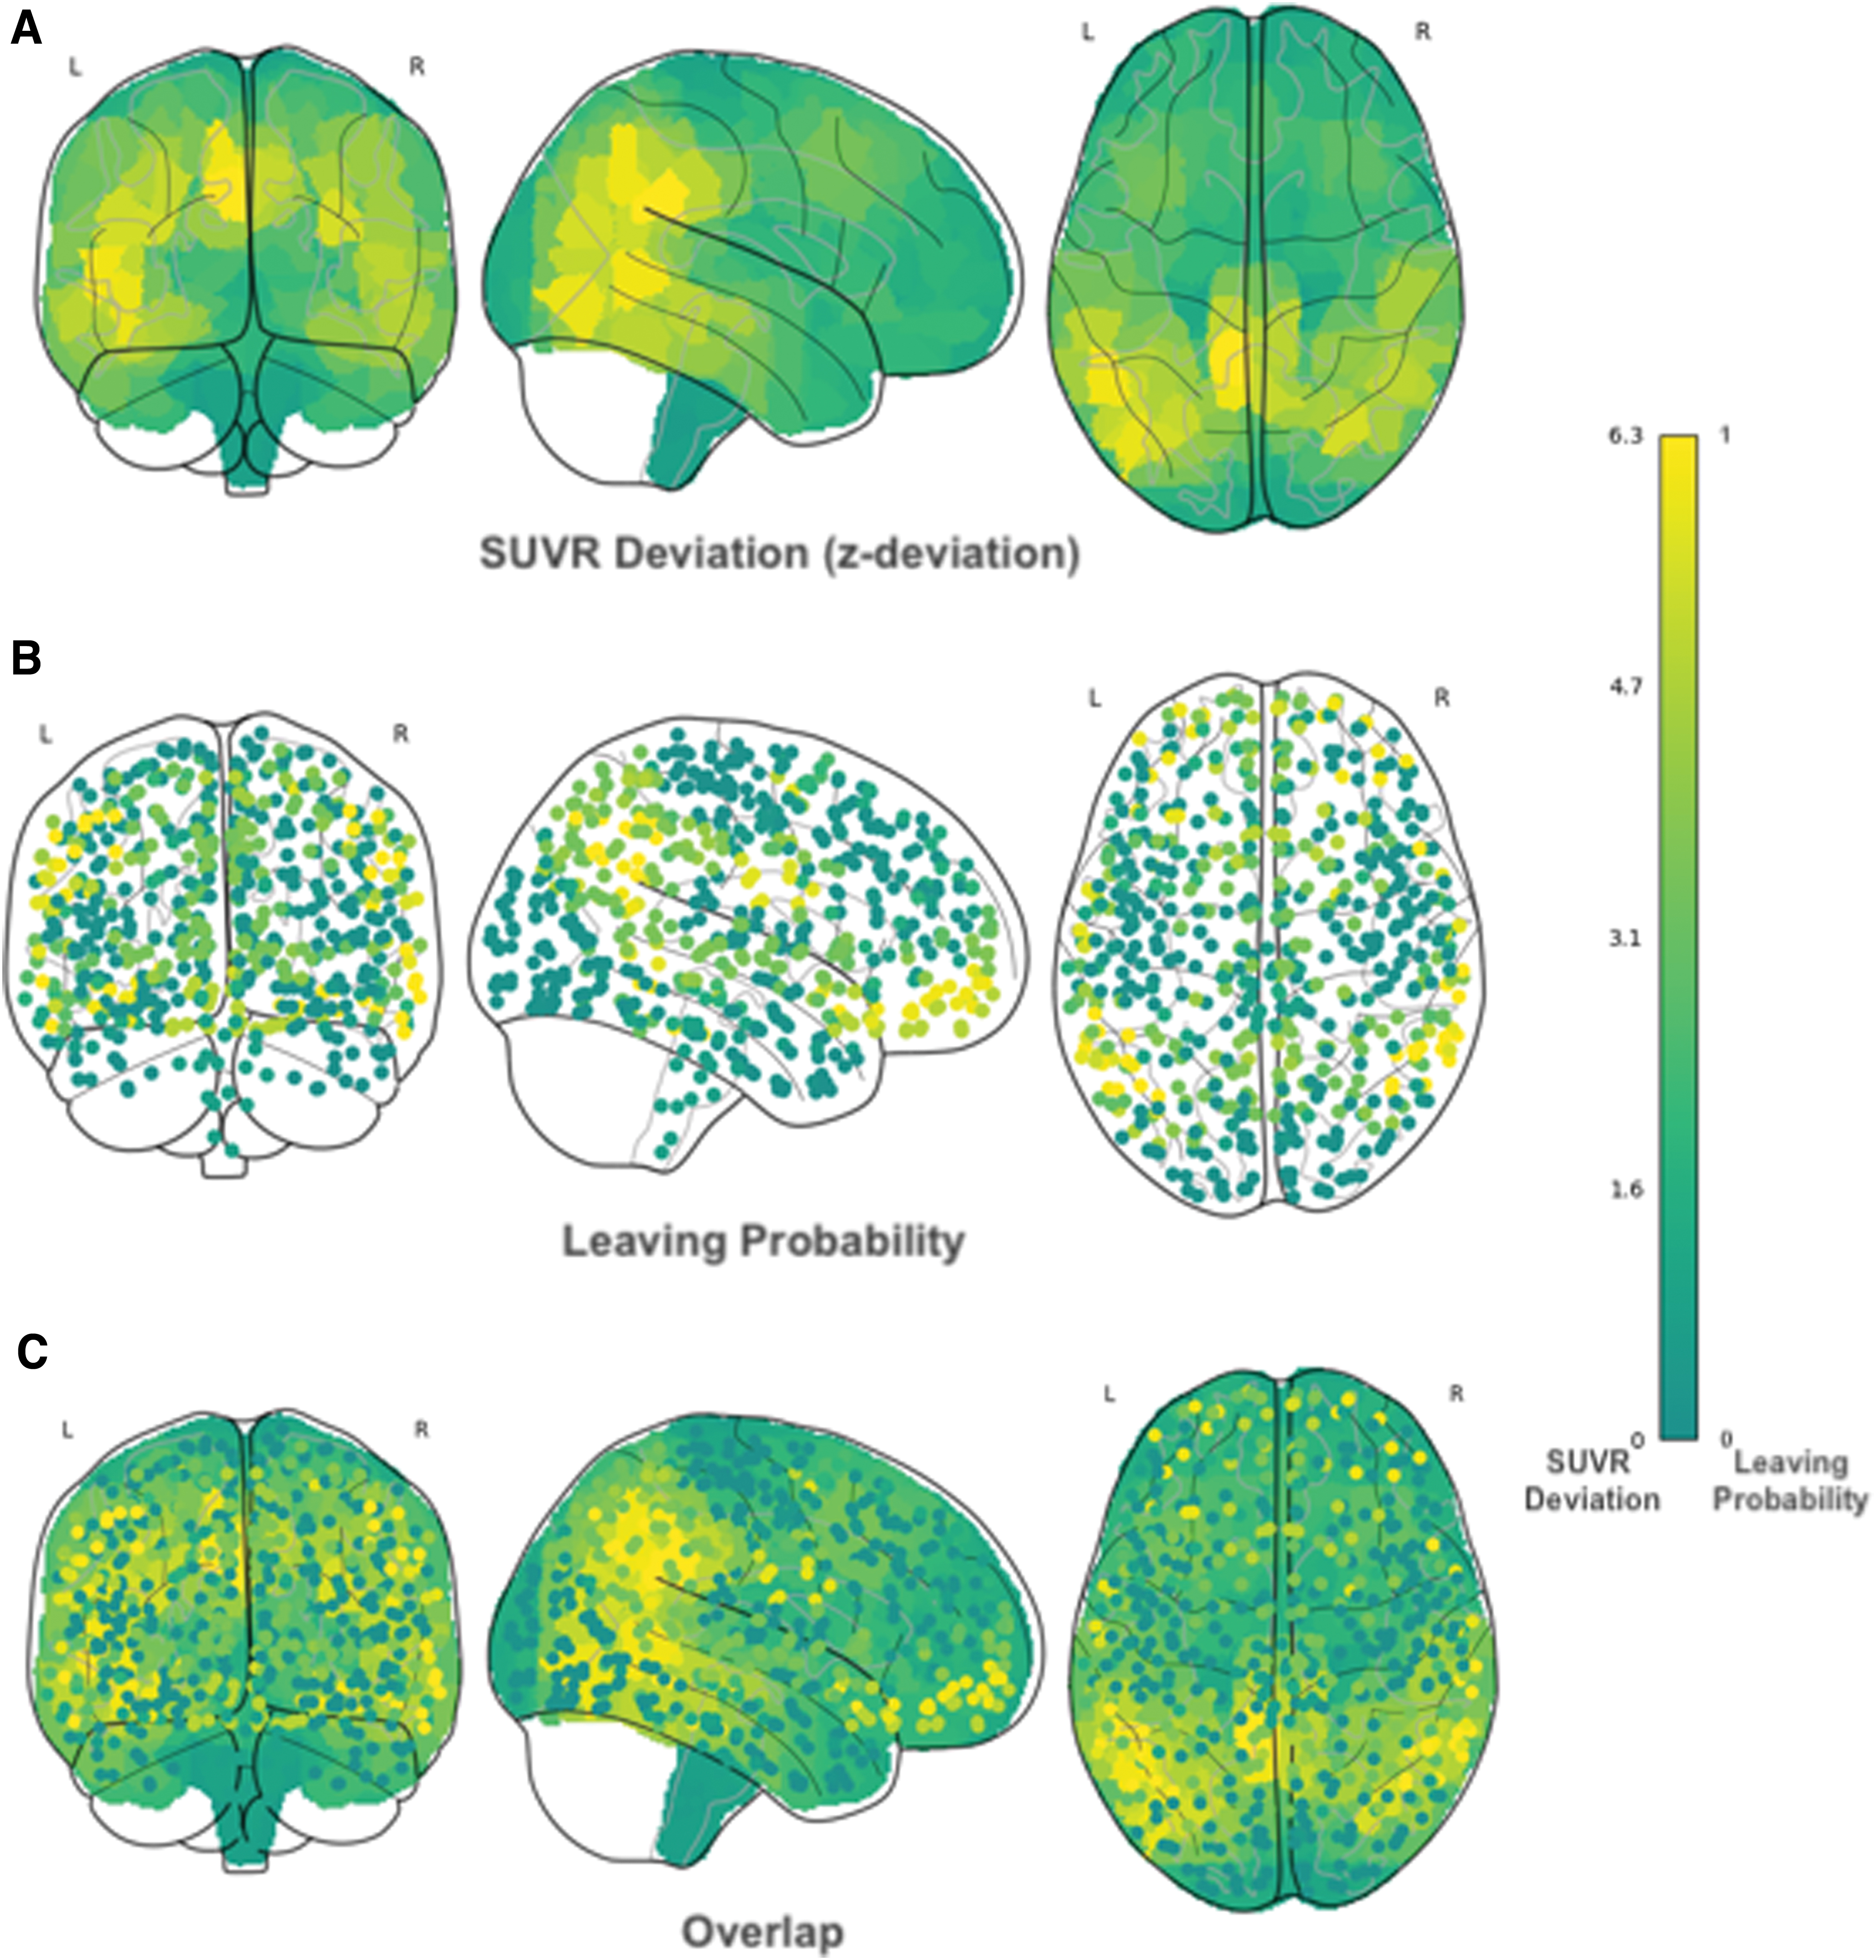
Illustration of leaving nodes and SUVR deviation. The probability to leave its community is calculated for each node in the average AD brain across 1000 random calls of the community detection algorithm and plotted in a glass brain
Discussion
We identified that basic organizational principles of the functional connectome significantly differ in AD as a function of the disease state. Specifically, we characterize the loss of efficiency in the reconfigured communities detected in the AD cohort. Moreover, we also address the mechanisms underlying network reorganization. We found that the allegiance of nodes to communities was relatively robust in aging (i.e., comparing the network architecture of young and senior adults) whereas it changed quite drastically in the disease state. These apparent effects of neural network reorganization were partly associated with the accumulation of tau pathology in regions that lost their allegiance to the communities (as identified in young controls and healthy aging). Later, we will discuss these essential results in more detail.
Loss of economic efficiency of the brain network in AD
Healthy brain networks are presumed to be organized, respecting economic principles of minimizing wiring costs and maximizing global efficiency (Bullmore and Sporns, 2012). Intuitively, the most efficient way of information processing in a network is a complete graph, meaning that every two nodes are connected and can communicate directly with each other. However, this extent of clustering results in enormous wiring costs.
Imagine every two farms on our imaginary island (see the Introduction section) are connected by an expressway, and this would cause massive construction costs. An economic trade-off would be a high clustering in local communities (villages), where wiring costs are comparably low combined with only a few expensive long-distance roads (expressways) to more remote communities.
This topological property is characterized by high modularity and is a particular kind of a small-world network architecture allowing highly efficient information transfer with low wiring costs (Bullmore and Sporns, 2009). Moreover, such modular community structures are characterized by high robustness, adaptivity, and evolvability of network function (Meunier et al., 2010). The decrease of modularity in the AD population compared with both young and senior controls indicates a loss of efficiency of information transfer across the whole brain.
Further, communities detected in functional brain networks are often found to reflect their spatial arrangement and/or functional specialization allowing segregated information processing (He et al., 2009), also suggesting a loss of local specialized functionality in AD. Although the affiliation of a node to its community was significantly higher in the aging cohort compared with young healthy controls, this effect could not be observed for patients with AD. These findings are consistent with an increase in the participation coefficient among individual subjects observed in the deviation analysis. Together with the decreased system segregation, these results suggest a lower proportion of intra-modular connections in AD, which are important for a fast adaptation or evolution in response to a changing environment (Bullmore and Sporns, 2012; Meunier et al., 2009).
Characterization of network reorganization in AD
Besides the changes in the functionality of underlying units, we also observed that the whole formation of nodes within communities was modified in AD. We proposed a new measure to quantify these changes by calculating node intersections of communities detected in the three groups. The AD communities were found to have significantly lower coverage of the healthy control reference communities than communities of senior controls, both in the average brain network and across single patients. Specifically, we observed an increase in bilateral units in AD. As asymmetry has been proposed to be a functional correlate of normal aging (Cabeza, 2002), evidence provided here of an apparent shift to bilateral network organization in AD is a novel observation. Previous work has demonstrated that network connectivity within the default-mode network changes before the measurable elevation of beta-amyloid pathology in individuals across the AD spectrum (Jones et al., 2016), lending support to the notion that network reorganization may be a prevalent marker of disease-induced alterations (Dillen et al., 2017; Jacobs, 2013). Here, we show compelling evidence for a general reorganization principle within neural networks as a major characteristic of the overall disease processes. Relating these findings to the metaphor of villages on a large island, we identified that farms have moved to different villages, with former bigger villages having lost their farms and markets, and the infrastructure among the villages having changed drastically.
Specifically, the leaving nodes were characterized by a high Euclidian distance to other nodes in their former community. Since the metabolic cost of an edge between two nodes is associated with their anatomical distance, this observation supports the hypothesis that the most metabolically expensive edges are particularly sensitive to functional disruption (Bullmore and Sporns, 2012). Together with the observed decline in average Euclidian distance of nodes in the same community, this observation is an indication that spatial proximity is an important factor of community formation and interconnection in AD. Hence, our results underscore that network failure in AD may be, in part, related to the shifting of nodes to preserve costs, resulting in a reduction of network connectivity (Jones et al., 2016).
Contribution of Tau pathology to network reorganization
The network degeneration hypothesis is a very prominent investigation of the effect of pathology on neuronal network function in neurodegenerative diseases, suggesting that molecular neuropathology leads to functional impairment of specific networks in the brain (Drzezga, 2018). Reduced functionality of intrinsic connectivity networks that is found to overlap with the distribution of tau tracers in AD stands in strong support of this hypothesis. As we identified that tau burden is related to the shifting of nodes in the comparison of healthy control and AD communities, our findings provide new evidence for the network degeneration hypothesis. It appears that the presence of tau pathology distracts the interaction of functional units and contributes to a loss of affiliation of individual nodes. These results strongly support the theory that tau protein aggregation directly disrupts the function of the network (Bischof et al., 2019; Hoenig et al., 2018; Warren et al., 2013), leading to network reorganization and, potentially, degeneration. Alternatively, it cannot be excluded that a loss of affiliation of individual nodes is accompanied by or contributing to the development of local tau pathology. Finally, our observation of regions (mostly subcortical and some frontal regions) with high leaving probability but low tau pathology is indicative that for some regions local tau pathology may not be the dominant driver for network reorganization.
Limitations of the study
Finally, putative limitations of this study should be considered: First, some of the senior, healthy controls may have suffered from age-related tau pathology (Crary et al., 2014) in the absence of significant amyloid pathology. We did not assess these molecular pathologies in vivo in our cohort of senior controls. As the senior control cohort expressed seven communities compared with eight communities in the young, healthy controls, it is conceivable that some age-related pathology not measured may have affected the community estimation in this cohort. Our study, thus, does not necessarily reflect the natural disease progression but is a snapshot of the relationship of network integrity and tau pathology in patients with AD. Further, being only a snapshot, a causative role of tau burden on reorganization of networks cannot be inferred from our study design. Both the reflection of the natural disease process and the causative role of tau give reason for a longitudinal study design of future studies. As the disease population consisted of a mix of patients in the prodromal and early phase of AD, it is also conceivable that we did not capture the full range of measurable tau pathology.
Regarding the small ROIs chosen for the network analysis, there might be considerable cortical expansion during the image transformations caused by atrophy. We tried to minimize between-group differences via first transforming the fMRI images to a group-specified template and, subsequently, to atlas space. As we expect an overlap between atrophy and tau pathology, there still might be interactions among the PET and fMRI measures due to transformations.
Conclusion
In conclusion, our novel findings suggest that in comparison to young and senior adults, the network communities in AD are reorganized, with nodes changing their allegiance from previous to different communities. Accumulation of tau pathology in AD is associated with the disruption of functional units, leading to a rigorous change in network architecture and resulting in reduced functional specialization and a loss of robustness, adaptivity, and evolvability, that is, an overall less efficient community structure. To test whether these changes in the human neural network architecture may be present in other neurodegenerative diseases and whether they contribute to the maintenance of basic cognitive function or are a maladaptive strategy to counteract neuropathology are exciting future directions from this work.
Footnotes
Authors' Contribution
A.W. and G.N.B.: conceptualized the study, preprocessed and analyzed the data, interpreted the results, and wrote the article. A.D. and T.v.E.: conceptualized the study, interpreted the results, and wrote the article. P.S.: analyzed the data with a particular focus on the atlas generation. A.K. and Y.S.: assisted in conceptualizing the study, data analysis and critically reviewed the article. N.R., J.D., J.K., K.-J.L., G.F., and O.O.: assisted in data collection and critically reviewed the article. B.N.: provided the radiosynthesis of 18F-AV1451 and critically reviewed the article.
Author Disclosure Statement
A.D. reports research support by: Siemens Healthineers, Life Molecular Imaging, GE Healthcare, AVID Radiopharmaceuticals, speaker honorary/advisory boards: Siemens Healthineers, Sanofi, GE Healthcare and stock: Siemens Healthineers. The other authors declare that there is no conflict of interest.
Funding Information
This work was supported by the Excellence Initiative of the University of Cologne and the “Marga and Walter Boll Foundation, Kerpen, Germany” (grant awarded to G.F., J.K., and Ö.O.). G.N.B. received funding from the “Alzheimer Forschungs Initiative eV, Germany” (AFI K1707). In addition, this study was supported by the German Research Foundation (DFG, DR 445/9-1) with a grand awarded to A.D.