
Abstract
Background:
The association between regional volumes and resting-state functional networks was tested within the default-mode network (DMN), influenced by Alzheimer pathology, salience network (SalN), not under similar pathological influence, and sensorimotor network (SMN), usually spared by pathology.
Methods:
A total of 148 participants, with Alzheimer's disease (AD) dementia, mild cognitive impairment (MCI), and healthy controls underwent multimodal brain magnetic resonance imaging (MRI). Functional network identification was achieved with group-level independent-component analysis of functional MRI (fMRI) scans. T1 weighted images were also analyzed. Ten regions of interest (ROI) were defined in core hubs of the three networks. Gray-matter volume/functional network strength association was tested within-ROI and cross-ROI in each group by using partial-correlation models and ROI-to-ROI, ROI-to-voxel, and voxel-to-voxel correlations.
Results:
In controls, a negative association was found between right inferior-parietal volumes and SMN expression in the left precentral gyrus, as revealed by ROI-to-ROI models. In AD, DMN expression was positively associated with the volume of the left insula and the right inferior parietal lobule, and SalN expression was positively associated with volume of the left inferior parietal lobule. ROI-to-voxel models revealed significant associations between the volume of the posterior cingulate cortex and SMN expression in sensorimotor and premotor regions. No significant findings emerged in the MCI nor from voxel-to-voxel analyses.
Discussion:
Regional volumes of main network hubs are significantly associated with hemodynamic network expression, although patterns are intricate and dependent on diagnostic status. Since distinct networks are differentially influenced by Alzheimer pathology, it appears that pathology plays a significant role in influencing the association between regional volumes and regional functional network strength.
Impact statement
Topography and strength of functional brain networks are at the basis of clinical profiles and a neuroimaging-informed proximate link to neuropathology. A framework describing major determinants of functional brain networks, however, is still missing. This investigation provides evidence in support of one of these factors, that is, regional-atrophy patterns. This extends the academic study of aging and brings evidence for potential translatability in precision medicine via investigation of atrophy-related network dysfunction dedicated clinical research. Transposing evidence-based multimodal magnetic resonance imaging to clinical settings would enable a more detailed definition of clinical profiles and, if further investigated longitudinally, could also help predict prognosis.
Introduction
The three pathophysiological mechanisms at the basis of diagnostic and staging criteria for Alzheimer's disease (AD) are amyloidosis, tauopathy, and neurodegeneration (Jack Jr et al., 2018). Of these, neurodegeneration (also referred to as neuronal injury) is the process most closely related to clinical phenotypes (Jack Jr and Holtzman, 2013).
Although neurodegeneration in AD is typically assessed via acquisition and whole-brain modeling of structural magnetic resonance imaging (MRI), synapse loss is the neurodegenerative feature best linked to deficits in mental abilities (Terry et al., 1991). Consistently (although transposed to a larger scale), a large body of research based on experimental modeling of functional MRI (fMRI) hemodynamic functional connectivity has confirmed that neural disconnection is a major substrate of specific cognitive and behavioral deficits in AD (Antoine et al., 2019; Jones et al., 2019; Liang et al., 2011; Pasquini et al., 2019; Serra et al., 2017; Vallet et al., 2013; Venneri et al., 2017; Yamashita et al., 2019). Clinical phenotypes, however, are not the sole result of an abnormally impoverished functional circuitry, but they may also be associated with aberrant increases in functional connectivity (Balthazar et al., 2014; de Lange and Scholtens, 2019; Gardini et al., 2015; Hillary et al., 2015; Liang et al., 2011).
AD-related neuronal injury, therefore, can manifest as tissue loss, as well as synaptic dysfunction leading to abnormal functional connectivity. It is still unknown, however, how these two phenomena relate to one another when informed by MRI across the clinical spectrum of the disease, that is, whether the volumetric size of network hubs is a positive, negative, or nonsignificant predictor of functional network connectivity. This unanswered question is particularly important for the default-mode network (DMN), which is the neurofunctional system most closely linked to amyloid pathology.
The DMN is sustained by a large-scale set of areas, the computational center of which is located in posteromedial regions. DMN network strength is tightly associated with deposition of amyloid peptides in cognitively normal adults (Sheline et al., 2010; Sperling et al., 2009) as well as across the clinical spectrum of AD (Pasquini et al., 2017). A number of studies have investigated the link between selective anatomical/volumetric properties of the brain and DMN expression (De Marco et al., 2019; Frau-Pascual et al., 2019; Neufang et al., 2011; Saenger et al., 2012). No investigation, however, has yet focused on the intra-regional and inter-regional correspondence between volume and network expression of major DMN hubs.
In this study, we used multimodal MRI to quantify volume and functional network strength within established computational hubs in a cohort of older healthy controls (HC), mild cognitive impairment (MCI) patients, and AD dementia patients. We then explored the statistical link between volume and network expression within each clinical cohort, focusing on: (1) the DMN as a network usually subjected to the detrimental influence of amyloidosis; (2) the salience network (SalN), of equally relevant cognitive importance, yet not comparably associated to amyloidosis in healthy adults (Lim et al., 2014; Lin et al., 2020; Schultz et al., 2017); (3) the sensorimotor network (SMN), as a control functional system. Since network dysfunction in AD can manifest as either abnormal downregulation or upregulation, an exploratory approach (i.e., with no directional hypotheses) was taken. We expected, however, that differences would emerge in the pattern of associations across the three diagnostic groups.
Materials and Methods
Participants
A total of 148 participants were included in this study. These had been recruited as part of the Virtual Physiological Human: DementiA Research Enabled by IT (VPH-DARE@IT), a multicenter research initiative funded by the European Union (Framework Programme 7) and coordinated by the University of Sheffield (United Kingdom).
Each participant completed a brain MRI inclusive of structural and resting-state functional sequences, a clinical examination carried out by a senior neurologist, and a battery of neuropsychological tests led by a senior neuropsychologist. Clinical diagnoses were made after consensus among clinicians and relying on National Institute on Aging and Alzheimer's Association clinical criteria for both patients with AD dementia (McKhann et al., 2011) and those with MCI due to AD (Albert et al., 2011).
Exclusion criteria were set as follows: cerebrovascular disease, previous cerebrovascular events, or history of transient ischemic attacks; history of epileptic events, clinical signs suggesting potential forms of neurodegenerations other than AD, that is, frontotemporal lobar degeneration; Lewy bodies disease or rapidly evolving forms of dementia, presence of neurological symptoms indicating possible movement disorders, presence of neuropsychiatric symptoms with a negative impact on everyday life, presence of significant conditions of clinical relevance that might alter normal neurological functioning (e.g., sick-sinus syndrome, peptic ulcer, abnormal levels of vitamin B12, folates or thyroid-stimulating hormone), use of medications with psychotropic effect or showing significant adverse effects, recruitment in other research presenting with methodological incompatibilities with this study, major disabilities with effects on mental abilities or daily routine activities.
Ethical approval was obtained from the Yorkshire and Humber Regional Ethics Committee, Ref No: 12/YH/0474 for the participants from the Sheffield (United Kingdom) cohort and from the ethics committee of the Northern Savonia Hospital District for the participants from Kuopio (Finland). All procedures were carried out in accordance with the 1964 Declaration of Helsinki and subsequent amendments. Each participant provided written consent for taking part in this research.
MRI acquisition
A single MRI protocol (Philips Ingenia 3T) was acquired per participant. This included four structural sequences (T1 weighted [T1W], T2 weighted [T2W], diffusion weighted imaging [DWI], fluid-attenuated inversion recovery [FLAIR]), which were used as part of the diagnostic procedures to rule out major radiological exclusion criteria. T1W images were further elaborated as part of the experimental procedure and were based on the following specifications: voxel dimensions 0.94 × 0.94 × 1.00 mm3, repetition time 8.2 msec, echo delay time 3.8 msec, inversion time 1 sec, field of view 256 mm, and matrix size 256 × 256 × 170. A single resting-state fMRI run (125 volumes acquired axially, total scanning time 6 min, and 25 sec) was also obtained per participant, based on the following parameters: 35 axial slices per dynamic, voxel dimensions 1.8 × 1.8 mm2, slice thickness 4.0 mm, repetition time 2.6 sec, and echo delay time 35 msec. Each T1W and fMRI underwent quality check to rule out the presence of signal artefacts before analytical processing.
MRI processing
All MRI analytical procedures were carried out with Statistical Parametric Mapping (SPM) 12 software running in a Matrix Laboratory computing environment. Preprocessing of T1W images was carried out following the most updated procedure originally outlined by Ashburner and Friston (2000). Images were initially segmented to separate each individual native-space brain into three complementary tissue-specific sub-maps (gray matter, white matter, and cerebrospinal fluid). This output was further processed as described by Malone et al. (2015) for the extraction of individual global tissue volumes (expressed in litres) and, in turn, total intracranial volumes. Segmented maps of gray matter were then modulated and registered to the Montreal Neurological Institute space, and they were finally smoothed with an 8-mm full-width at half maximum Gaussian kernel.
Resting-state fMRI images were preprocessed following an in-house procedure previously used by our team in published research (Postema et al., 2019). This initially included slice timing for synchronizing intra-volume temporal properties of slice acquisition and realignment for correcting volume-to-volume spatial displacement. The graphic illustration of the six rigid-body trajectories of translation and rotation describing in-scanner motion were visually inspected to identify markedly problematic scans. No participants displayed movements larger than 1 voxel in any direction. The output was then normalized and resliced, during which native space brains were registered to the Montreal Neurological Institute template with a 2 mm isotropic voxel, band-pass filtered (0.01–0.1 Hz) to remove frequencies not of neural origin, and smoothed with a 6 mm Gaussian kernel to improve signal-to-noise ratio.
Smoothed fMRI images were processed with an independent component analysis (Calhoun et al., 2001) that was computed by using the Group Independent component analysis of fMRI Toolbox (GIFT). Independent component analysis is a statistical procedure that processes voxel signal variability to estimate a set of latent variables (components) that predict voxel signal. Briefly, the sequential steps implemented by GIFT include an initial data reduction achieved via principal component analysis, a cohort-level independent component analysis (the Infomax optimization principle was applied for this purpose, which minimizes inter-component mutual information), and a process of back-reconstruction, for the estimation of participant-specific components (Calhoun et al., 2001).
These resulting images consist of voxel-based maps of beta coefficients associated with the strength of expression of each independent component. The number of components to compute was set to twenty, as previously done in influential research (Kalcher et al., 2012). The twenty resulting group-level maps were visually inspected by three independent raters (G.S., M.D.M., and A.V.) to shortlist and detect those that represented large-scale functional brain networks of interest. At this stage, a number of artefactual components resulting from non-neurogenic patterns of correlations (e.g., arising from in-scanner motion) were discarded. Of the remaining components, three were chosen from the output with 100% interrater agreement. These are the DMN, the SalN, and the SMN. The DMN was selected because of its established link with the topography of Alzheimer pathology deposition in normal and abnormal aging (Pasquini et al., 2017; Sperling et al., 2009) and because of its association with cognitive functioning and efficiency (i.e., the DMN has to deactivate when an overt cognitive task is performed). SalN was mainly selected because, although playing a central role in allocating resources for cognitive computations [i.e., it plays a mediation role in the transition between task deactivation and activation (Menon and Uddin, 2010)], it is not sustained by regions that harbor as much AD-related pathology as the DMN in normal aging (Lim et al., 2014; Lin et al., 2020; Schultz et al., 2017). Moreover, SalN is usually anticorrelated with the DMN, and this has been proposed to play a relevant role in AD in accounting for clinical profiles (Seeley, 2011). Finally, the SMN was chosen as a control network, given its limited involvement in the processing of higher cognitive functions and since it tends to be spared from AD pathology until the most severe disease stages (Braak and Braak, 1995). To confirm the accuracy of the three selected components, one-sample t-tests were run to visualize the cohort-level spatial contour of the three maps (Fig. 1A). This was consistent with the outline of the networks reported in published studies, in support of our selection.
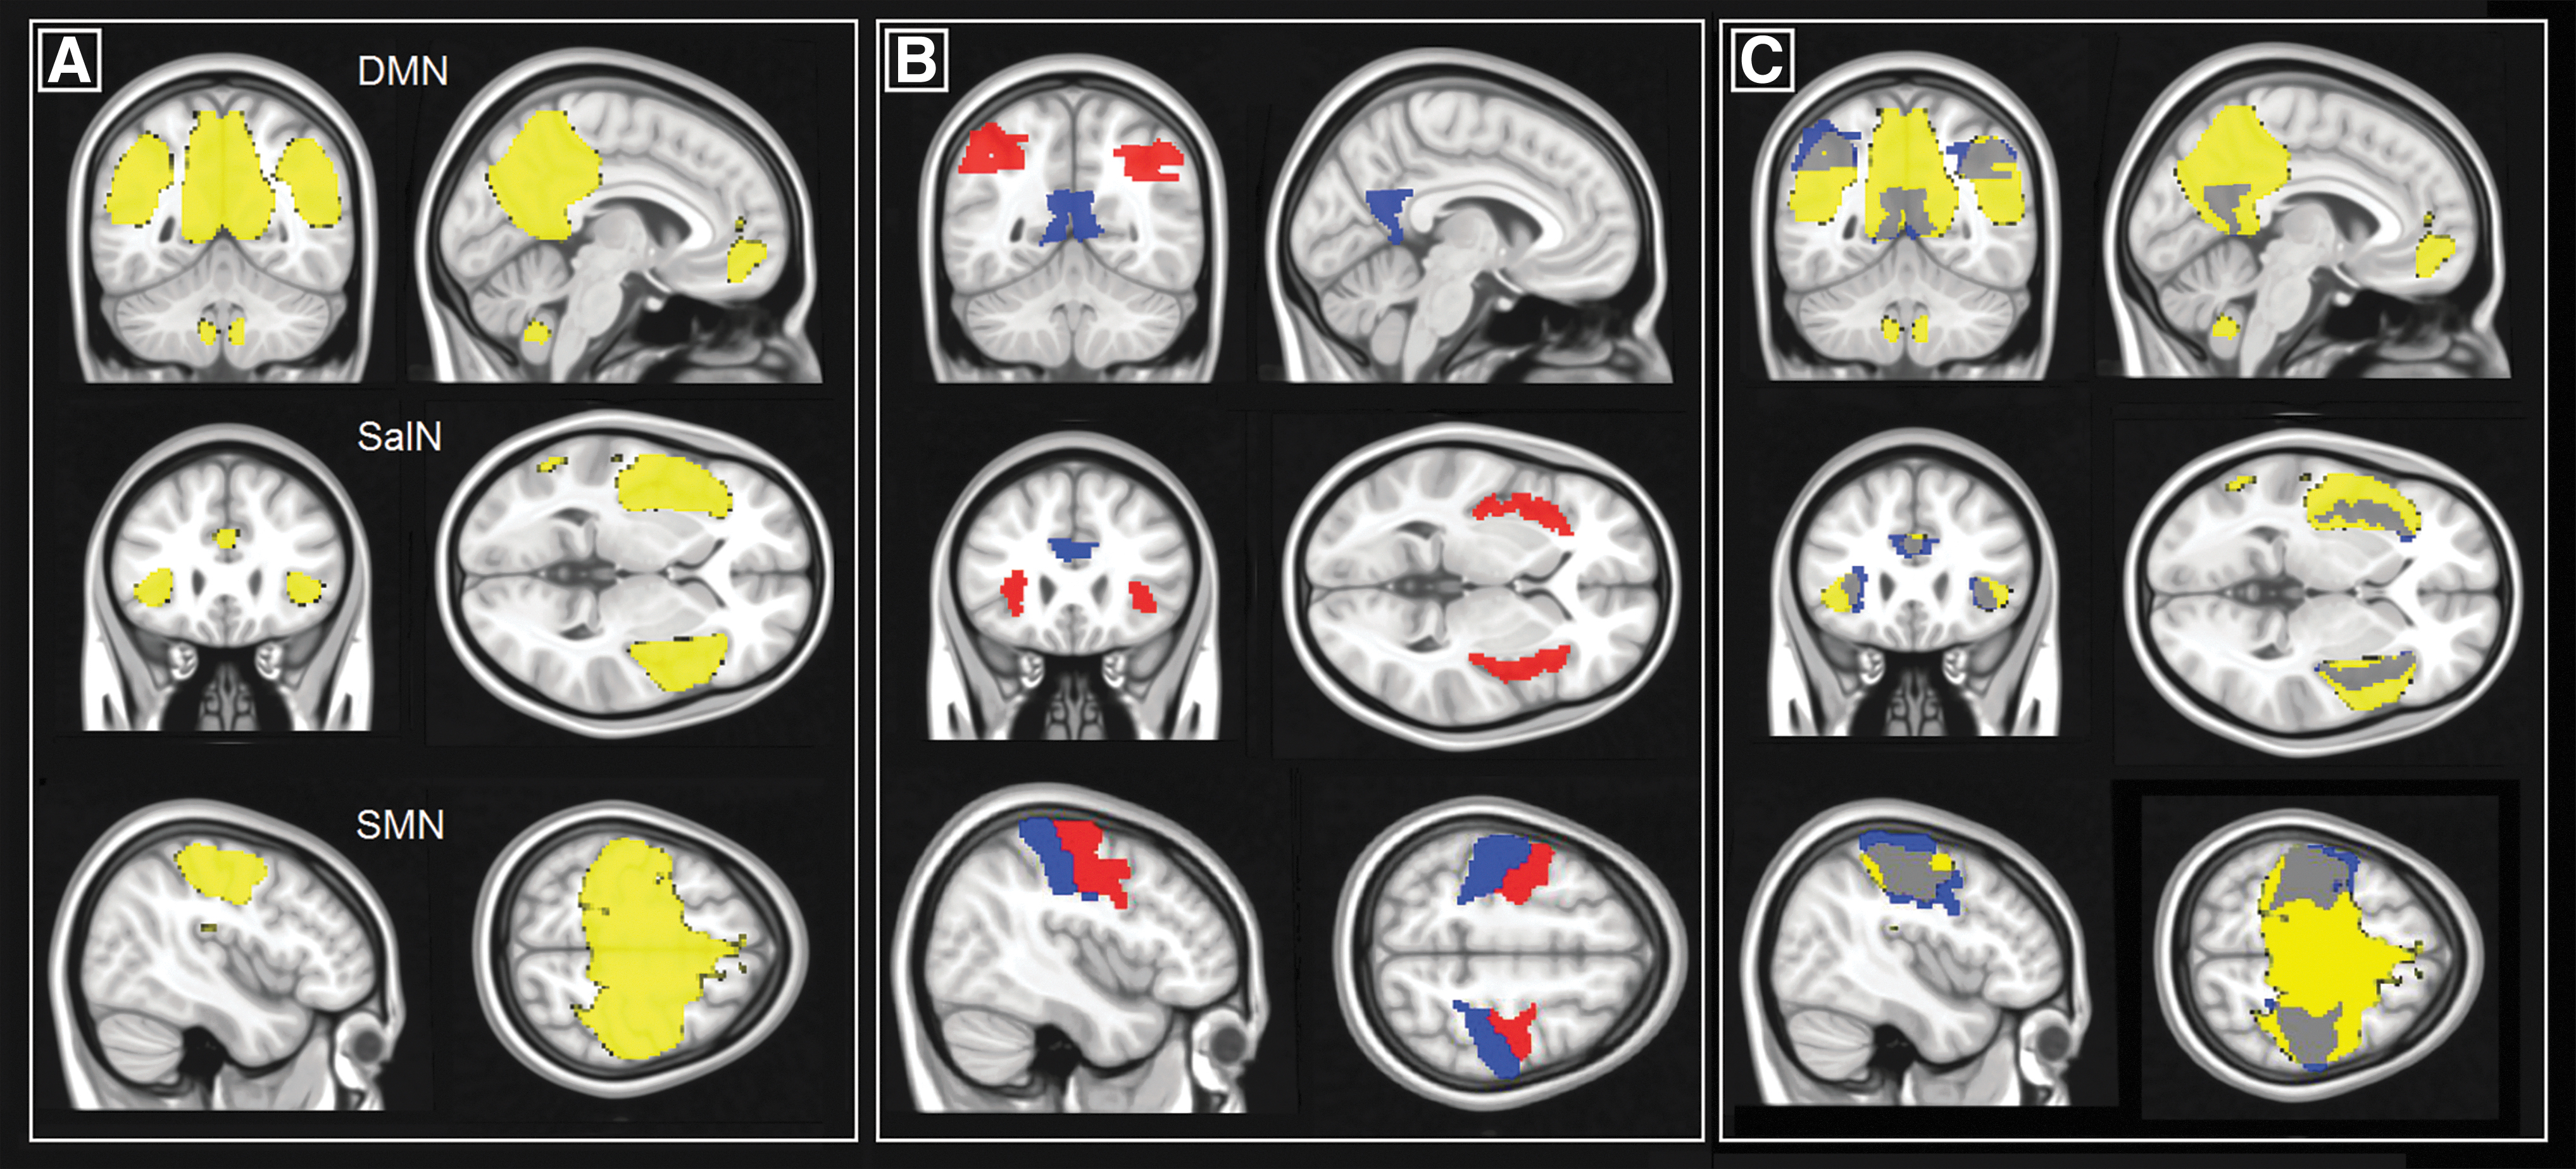
Visualization of the regions investigated in this study.
The automated anatomical labelling atlas 3 (AAL3) (Rolls et al., 2020) was used to define a series of 10 regions of interest (ROI) at the basis of the three hemodynamic networks investigated. These were: the posterior cingulate cortex (AAL3 areas 39 and 40), left (AAL3 area 65) and right (AAL3 area 66) inferior parietal lobule as main hubs of the DMN, the supracallosal portion of the anterior cingulate cortex (AAL3 areas 155 and 156), left (AAL3 area 33) and right (AAL3 area 34) insula as main hubs of the SalN, and the left (AAL3 area 1) and right (AAL3 area 2) precentral and left (AAL3 area 61) and right (AAL3 area 62) postcentral gyrus as main hubs of the SMN. To avoid biases and optimize the number of selected regions, the medio-prefrontal cortex was not included as part of the DMN since its contribution to the network tends to weaken in patients presenting with MCI and dementia (Koch et al., 2012). All hubs are illustrated in Figure 1B. The position of each region was superimposed onto its respective network map to confirm their topographical appropriateness (Fig. 1C).
Regional gray-matter volume and functional network strength were extracted from each of the 10 regions. Volumes were quantified with the “get_totals” script. Functional network strength was instead computed as the average beta coefficient for each component of interest. By doing so, the statistical strength of the distinctive network typically expressed in each region was calculated (e.g., the strength of the DMN in the posterior cingulate), as well as the statistical strength of networks non-distinctive for that region (e.g., the strength of the SalN in the posterior cingulate). As a result, 10 volumetric indices of gray matter and 30 indices of network strength were extracted for each participant (i.e., DMN in the posterior cingulate, SalN in the posterior cingulate, SMN in the posterior cingulate, DMN in the left inferior parietal lobule, SalN in the left inferior parietal lobule, etc.).
Statistical modeling
To characterize the sample and provide a descriptive picture of their clinical profile, between-group analyses were initially run to test for differences in demographic variables, neuropsychological performance, and global neurovolumetric indices. One-way analyses of variance were run to test the effect of the variable “group” and, in case of significance, this was followed by group-to-group post hoc Bonferroni-corrected t-tests. Gender ratio was instead analyzed with a Chi-squared test. Maps of gray-matter volume density and functional networks were analyzed with SPM 12 between groups to describe the neural profile of the two groups of patients. Independent-sample t-tests were run for this purpose, correcting for years of age, years of education, and total intracranial volume. A cluster-forming threshold of p < 0.001 (uncorrected) was set, and clusters were reported as significant when surviving a Family-Wise Error (FWE)-corrected p < 0.05.
To address the experimental hypothesis, region-to-region, region-to-voxel, and voxel-to-voxel models were applied. Each diagnostic group was analyzed separately to characterize different clinical statuses with more precision. Region-to-region models were run with IBM SPSS Statistics 22 software to test the association between regional volumetric values and regional network indices. Since most but not all variables expressing network strength were normally distributed (as per Kolmogorov–Smirnov test of normality), nonparametric statistical models were designed. Partial rank-based correlation models (Spearman's ρ) were devised to test the association between regional volumes and network strength, controlling for the following continuous nuisance variables: years of age, years of education, total intracranial volume, fractional volume of gray matter, and the following three indices of in-scanner movement derived from the six rigid-body motion regressors estimated during realignment: average absolute displacement in translation and rotation and maximal framewise displacement (Power et al., 2014). A Bonferroni-corrected p-value of 0.00167 (correcting for 30 independent models) was selected as the threshold of significance.
Region-to-voxel analyses were run with SPM-12 by testing the association between regional volumetric values (in mL) and network maps, using the same set of covariates. As with region-to-region analyses, Bonferroni-corrected p-values were applied to the original uncorrected p < 0.01 cluster-forming threshold, resulting in a corrected p < 0.00033. Moreover, only clusters further surviving a cluster-level p(FWE) <0.05 were considered significant.
Finally, exploratory analyses were run to test the voxel-by-voxel correlation between maps of gray matter volume and network strength across the entire template. To do this, the Biological Parametric Mapping toolbox (Casanova et al., 2007) was used. Images were mutually coregistered and models were run controlling for the same set of covariates as in the previous analyses. Resulting statistical maps were thresholded at an uncorrected p < 0.001 and at a cluster extent of ≥100 contiguous voxels.
Results
Demographic and neuropsychological characteristics
Analysis of demographic variables showed that the three diagnostic groups were of similar age and were based on a comparable ratio of males and females. Both group of patients, however, had on average significantly fewer years of education than controls. Neuropsychological profiles indicated that MCI patients had reduced performance in tests of episodic and semantic memory, whereas patients with dementia showed a more compromised profile with significant differences from controls for almost all cognitive tests. All these findings are reported in Table 1.
Demographic and Neuropsychological Characteristics of the Cohort
Means and standard deviations are indicated (apart from gender, which is expressed as a proportion). One-way analysis of variance tests were run to test the effect of the variable “group” and, where significant, t-tests were carried out at a Bonferroni-corrected p < 0.05. Gender ration were instead analyzed with a Chi-squared test.
The total score for the CERAD battery was computed based on the methodology described by Chandler et al. (2005).
Cut-offs were defined based on published normative data (Welsh et al., 1994).
CERAD, consortium to establish a registry on Alzheimer's disease; DEM, dementia patients; HC, healthy controls; MCI, mild cognitive impairment patients; WAIS, Wechsler Adult Intelligence Scale.
Neurostructural and neurofunctional characteristics
Controls had significantly more gray matter than dementia patients across almost the entirety of the brain. Along similar lines, MCI patients had more gray matter than dementia patients in the majority of the posterior part of the brain. Although trends were seen in the mediotemporal lobe, no significant differences in gray-matter structure were seen between controls and MCI patients. All significant differences are reported in Figure 2.
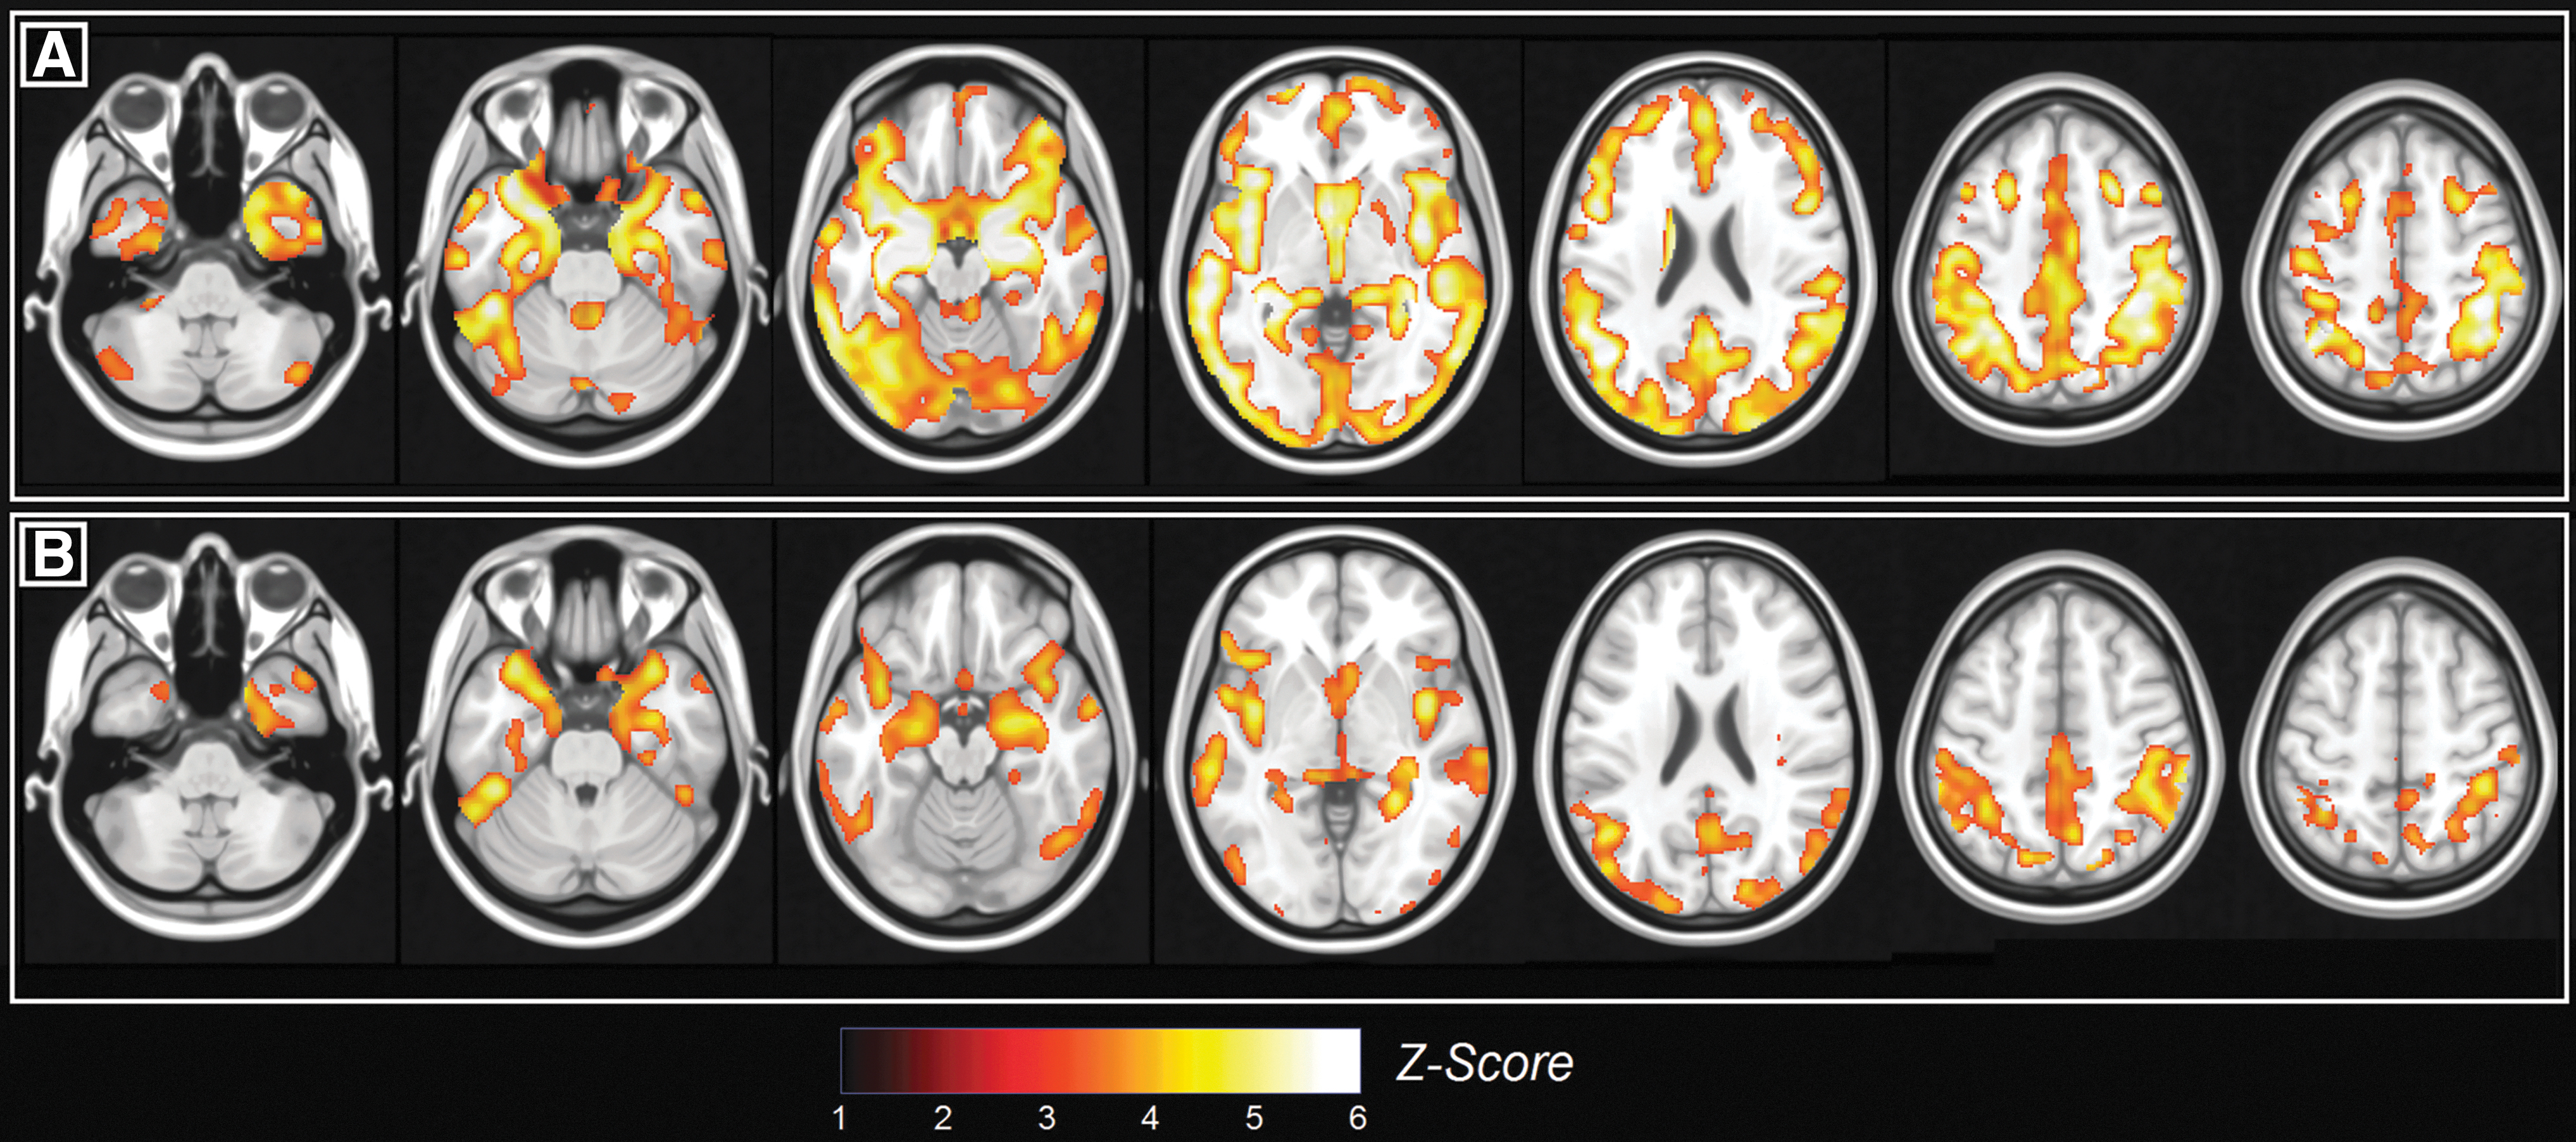
Between-group differences in the pattern of gray-matter density.
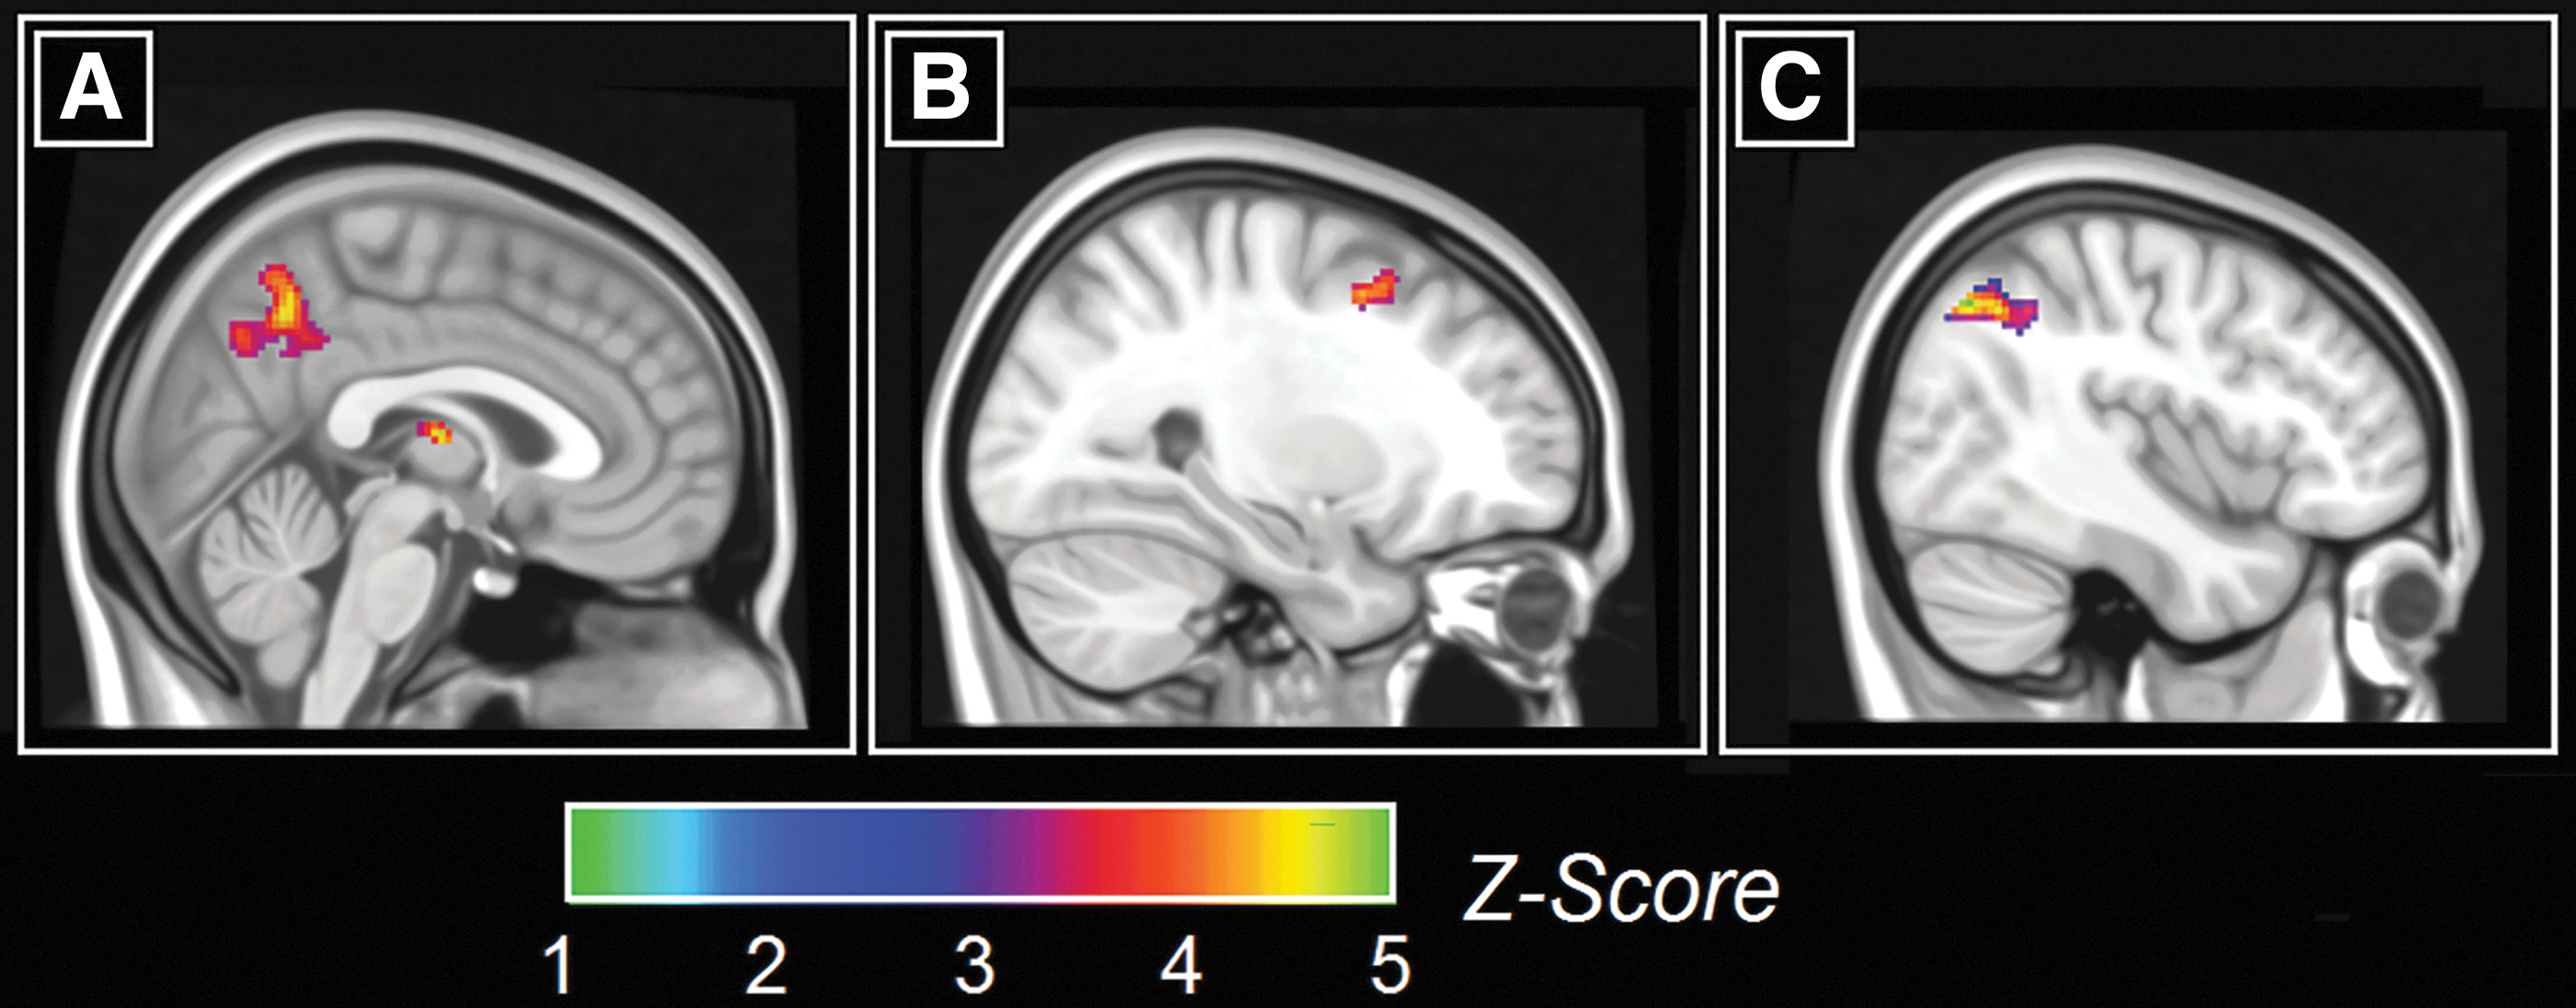
The analysis of the three neurofunctional maps revealed that in controls the DMN was significantly more expressed than in dementia patients in the posterior cingulate cortex/precuneus and thalamus (Fig. 3A and Table 2). A similar, yet nonsignificant trend was found between healthy controls and MCI patients. MCI patients had a stronger SalN than controls in the posterior portion of the right middle frontal gyrus (Fig. 3B and Table 2). Finally, dementia patients had a stronger SalN than controls in the right inferior parietal lobule (Fig. 3C and Table 2). Regional volumes tended to be moderately-to-highly correlated with one another in each diagnostic group (all r coefficients were between 0.6 and 0.95), whereas simple correlation coefficients testing the association between structure and function within each ROI were either non-significant or barely significant.
Between-group differences in the pattern of network functional connectivity.
Between-Group Differences in the Patterns of Network Functional Connectivity
BA, Brodmann area; DMN, default-mode network; FWE, family-wise error; L, left; R, right.
Association between regional volume and strength of functional brain network expression in resting state
In the group of HC, only one region-to-region model reported a significant coefficient of partial correlation. The volume of the right inferior parietal lobule was negatively associated with the strength of the SMN in the left precentral gyrus (ρ = −0.504, p = 0.0006). No significant findings emerged in the group of MCI patients. Finally, three positive associations survived the corrected threshold of significance in the group of dementia patients. First, the volume of the left insula was significantly associated with the strength of the DMN in the posterior cingulate (ρ = 0.505, p = 0.0008). Then, the volume of the right inferior parietal lobule gyrus was associated with the strength of the DMN in the left postcentral gyrus (ρ = 0.511, p = 0.0006) and, finally, the volume of the left inferior parietal lobule was associated with the strength of the SalN in the left postcentral gyrus (ρ = 0.570, p = 0.0001). All four significant associations are illustrated in Figure 4.
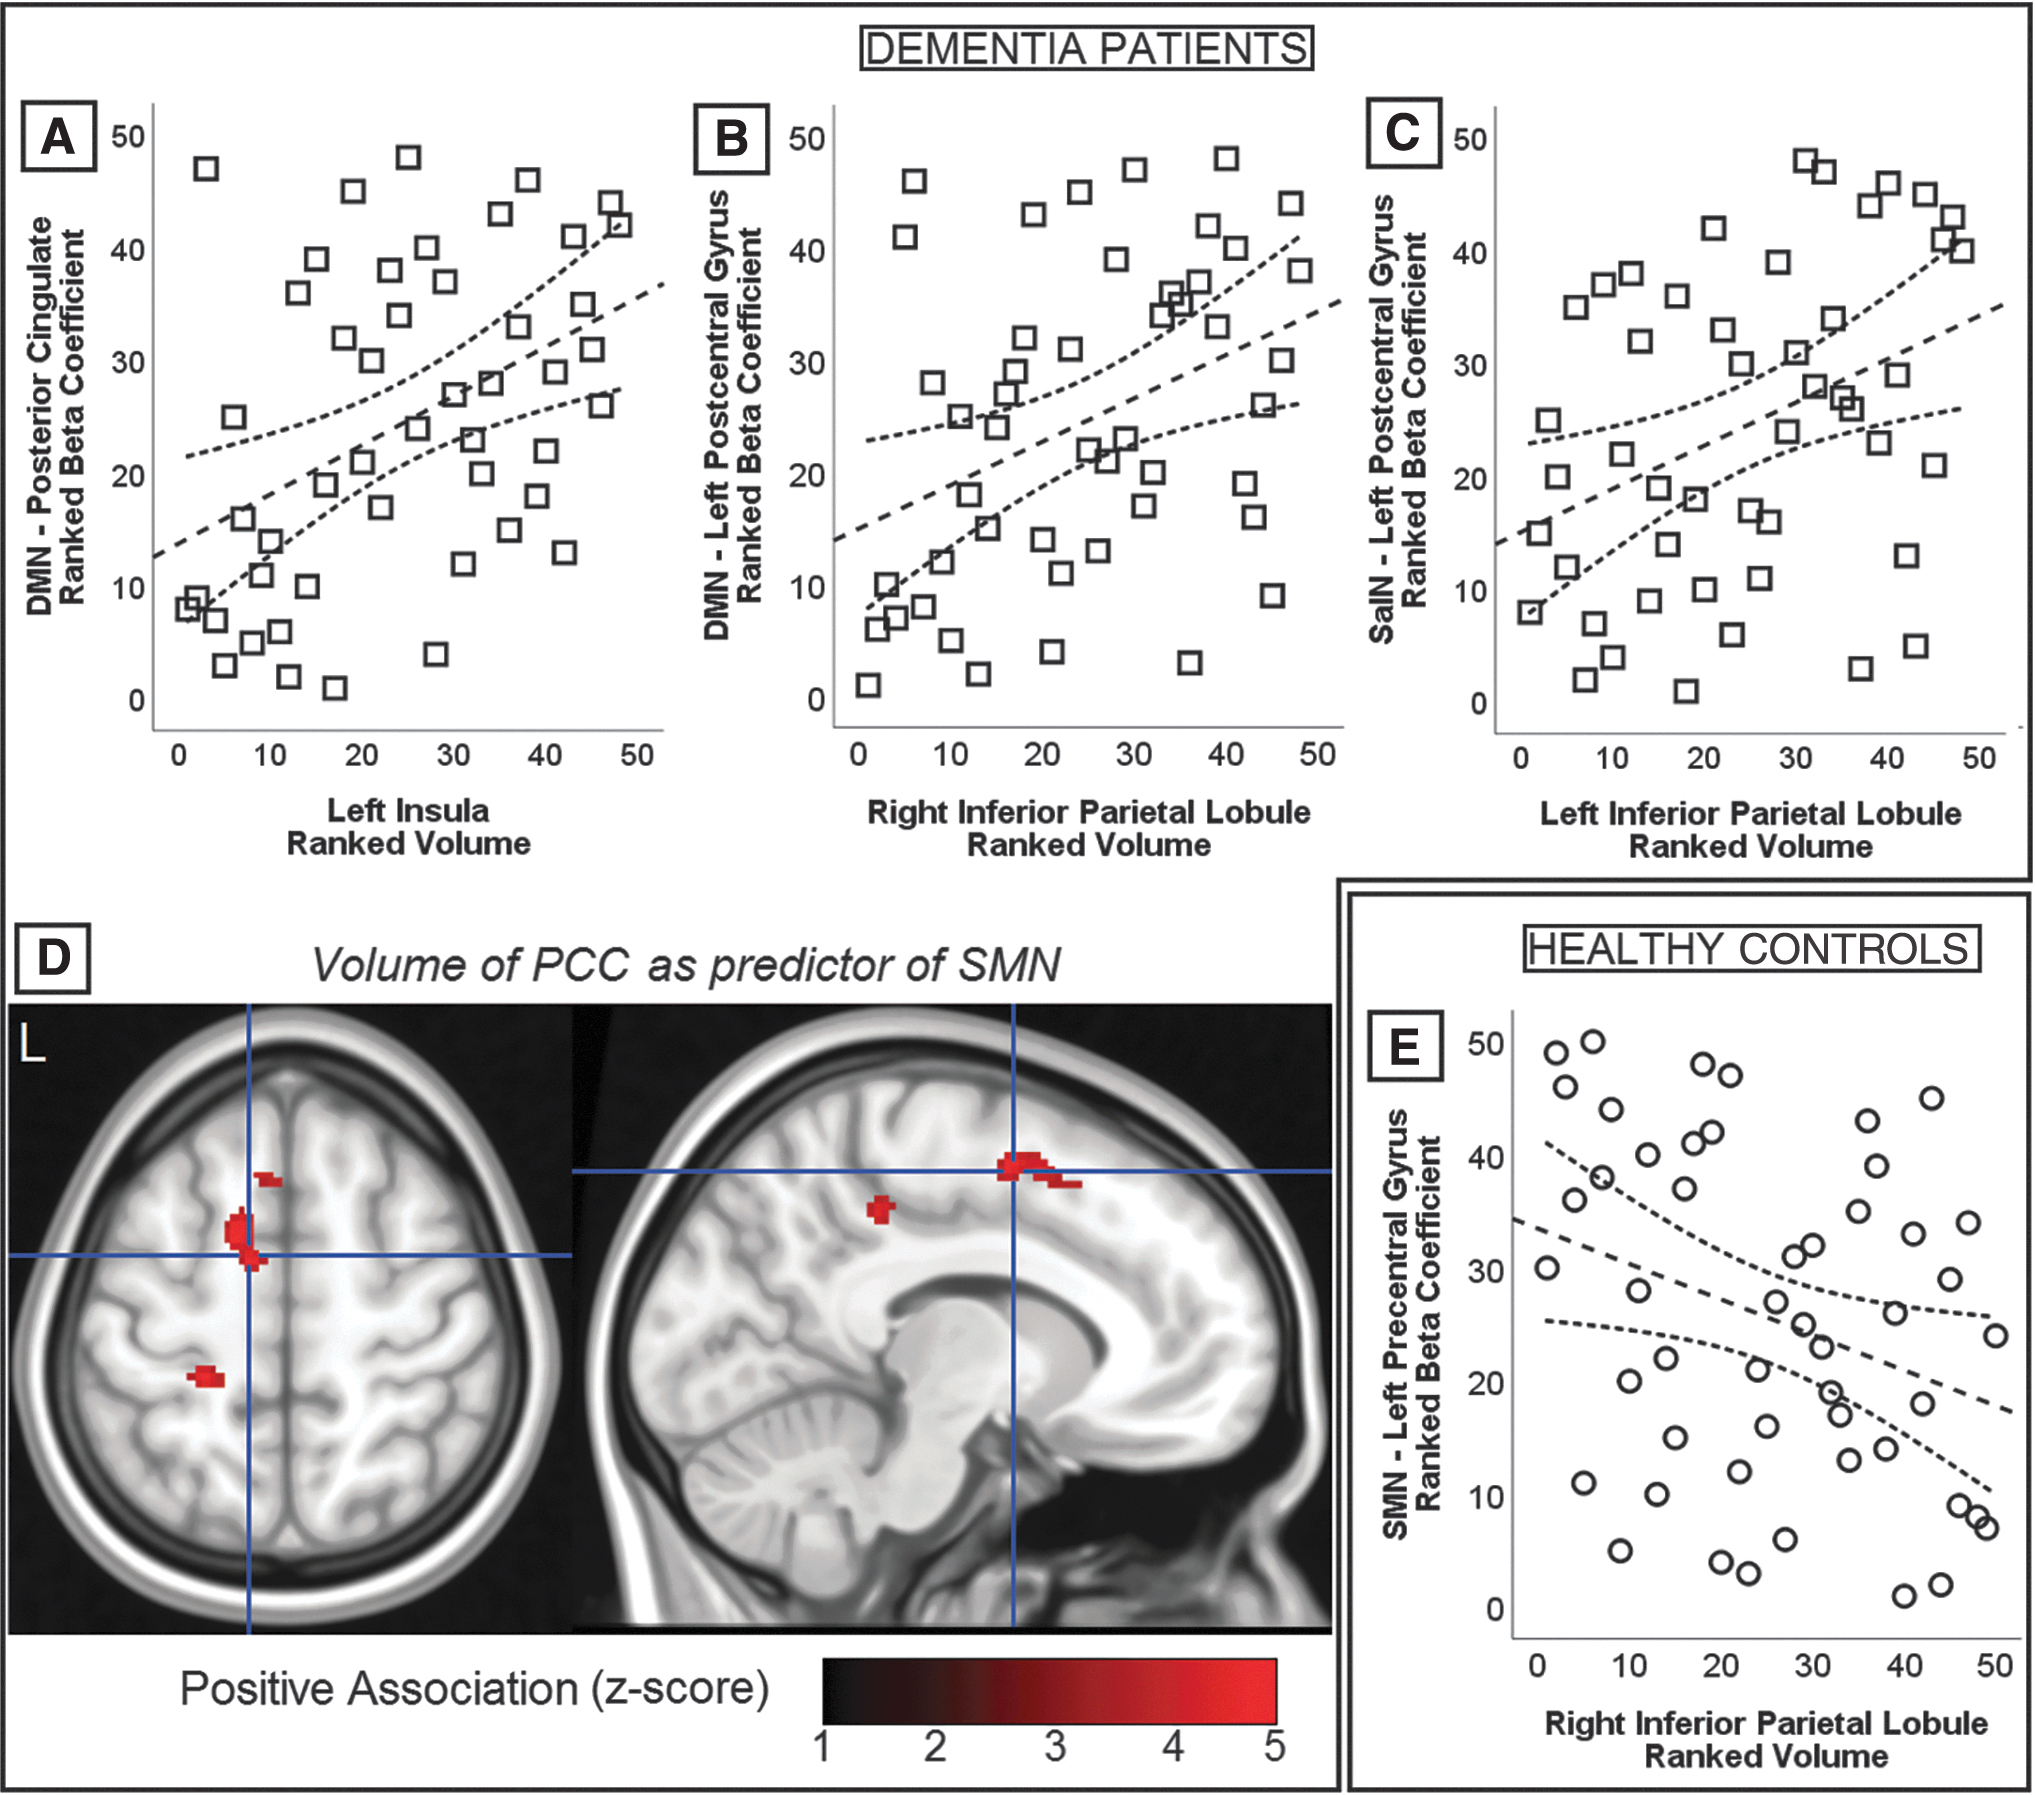
Graphical representation of the significant associations emerged from region-to-region and region-to-voxel correlational models. Scatterplots show rank-transformed indices of regional volume and functional network strength and, although the main body of analyses was based on partial correlation models, these graphs show simple correlations. Spearman's ρ coefficients are reported in text. Significant findings are shown in association with dementia patients
Only one pattern of region-to-voxel association survived the threshold of significance. In the group of dementia patients, the volume of the posterior cingulate was positively associated with SMN strength in left sensorimotor and premotor regions (Fig. 4D; Table 3). Finally, the outcome of voxel-to-voxel correlations did not reveal any significant cluster of findings.
Region-to-Voxel-Based Associations Between Regional Volumes and Whole-Brain Network Maps
BA, Brodmann area; FWE, family wise error; PCC, posterior cingulate cortex; SMN, sensorimotor network.
Since the 10 regions investigated in this study were of diverse size, post hoc proof-of-concept analyses were run to rule out the possibility that larger regions would result into less noisy indices of functional network strength and, in turn, act as an artefactual player behind the resulting pattern of associations. A series of spherical ROI of incremental radius (i.e., 3, 5, 8 and 10 mm) were drawn in the posterior cingulate cortex (center: x = 6, y = −46, z = 22). Regional volumes and indices of network strength were calculated within each of the four spherical regions, and correlational models (i.e., Pearson's r) were run to test the association between volume and network expression and assess whether increases in regional size would alter this association. The results, shown in Figure 5, indicate little or no change in the patterns of association, ruling out major effects triggered by variability in region size.
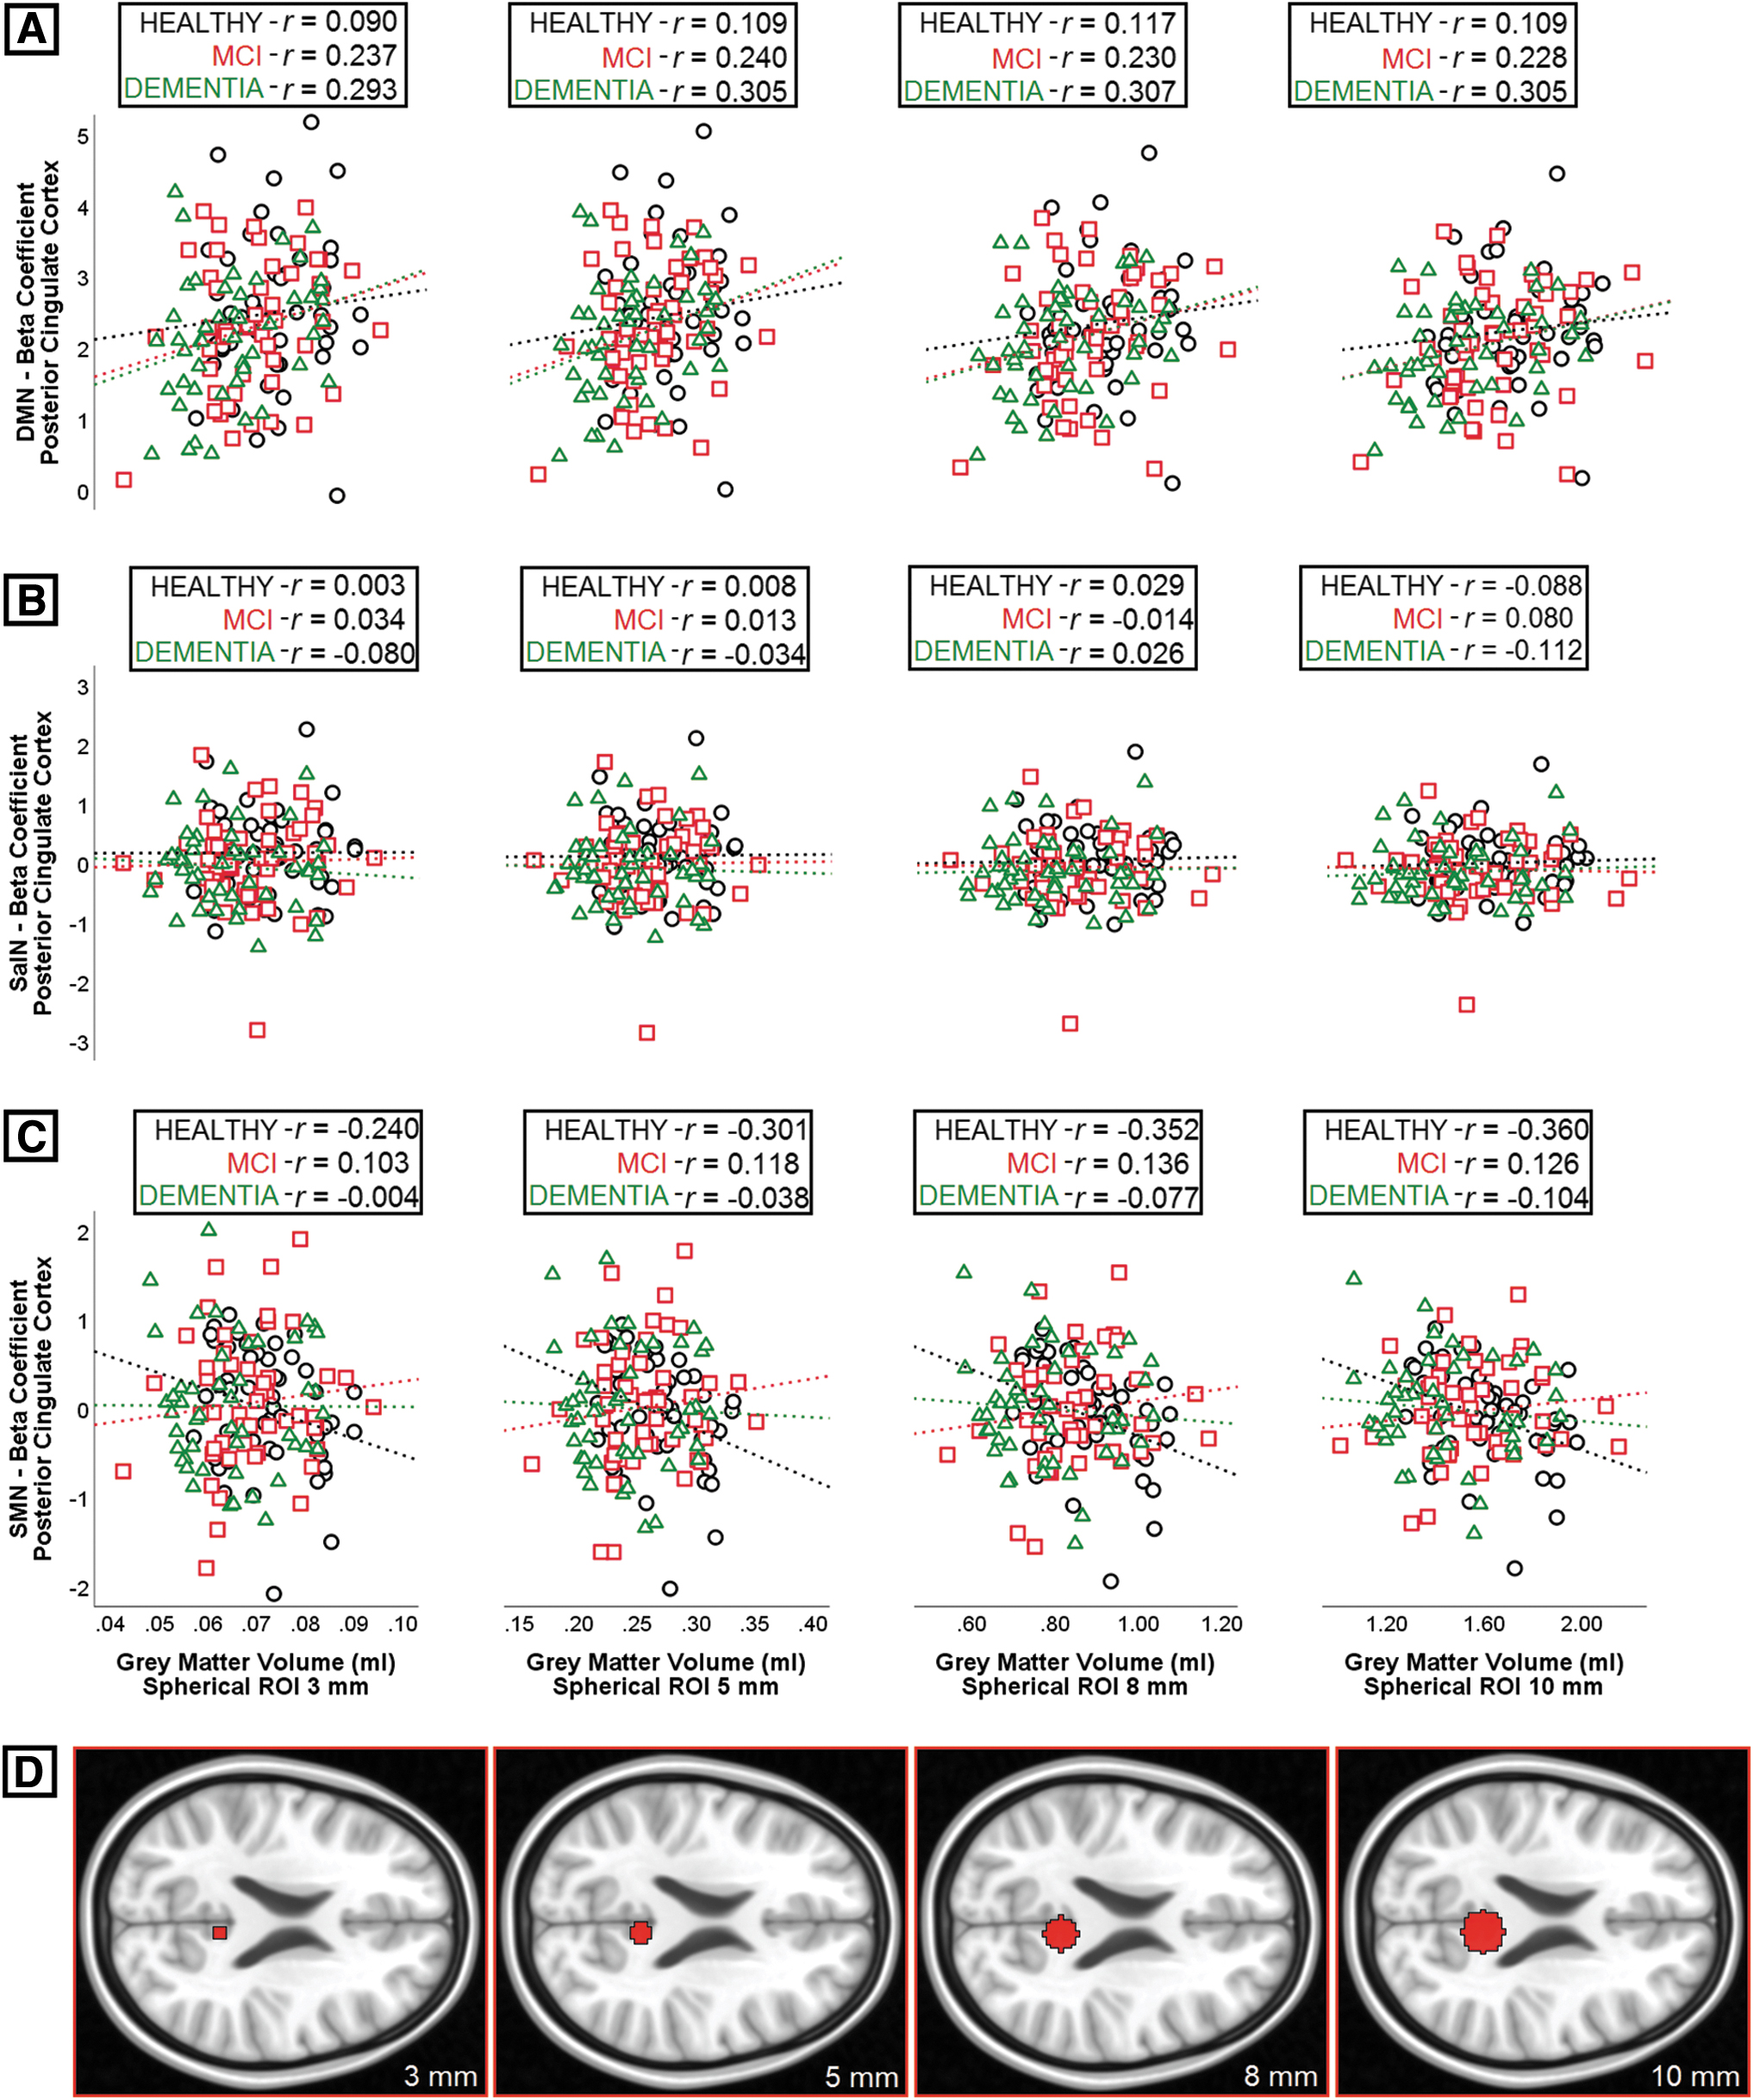
Linear association between gray-matter volume and connectivity in four regions of interest of different size constructed in the posterior cingulate gyrus. Coefficients of correlation (Pearson's r) were calculated for
Discussion
This study explored the association between volumes of regions sustaining major large-scale functional brain networks and the statistical strength of these networks within and outside the same regions. This was investigated in three diagnostic groups, that is, older healthy controls, patients with MCI due to AD, and patients with AD dementia. We specifically focused on three functional networks: the DMN, a cognitive network the variability of which is, under normal aging conditions, influenced by amyloid pathology; the SalN, a cognitive network, the variability of which is not equally influenced by amyloid pathology; and the SMN, a non-cognitive network.
DMN expression was statistically dependent on regional volumes only in patients with AD dementia. In this diagnostic group, the statistical strength of the DMN in the posterior cingulate (i.e., its main computational hub) was associated with the volume of the left insula. Although not specific to AD (Fathy et al., 2020), insular atrophy has been often described as a pivotal mechanism of neuropsychiatric symptoms such as apathy and agitation (Rosenberg et al., 2015). Insular volumes in AD, however, appear to undergo processes of atrophy different from those characterizing other neocortical regions known to be under the effect of AD pathology (Moon et al., 2015). On the basis of this divergence, volumetric quantification of the left insula may help “tag” those patients in whom the neural resources associated with this region may be better preserved.
Although it is not possible to speculate on the mechanisms that may be at the basis of the link between insular integrity and DMN, interestingly a study found that, in older adults at genetic risk for AD (i.e., carriers of the Apolipoprotein E ɛ4 allele), activity of the left insula may help protect levels of memory performance against the detrimental impact of amyloid pathology (Lin et al., 2017). Moreover, given the anticorrelated nature of DMN and SalN, the two networks are often referred to as the “DMN/SalN axis,” and it is in this conceptual form that their efficiency and their link with AD pathology is assessed (Schultz et al., 2020). In this context, volumetric integrity of the insula may be at the basis of network-to-network segregation and result in stronger DMN expression.
No link between regional volumes and DMN expression was instead found in HC. A recent study reported that for another region affected by AD pathology (Tau pathology, in this case), the hippocampus, volumetric integrity is unrelated to hippocampal function in healthy adults (Clark et al., 2020). This suggests that there is no linear correlation between regional structure volumetry and function of central AD-related brain regions in normal aging. Plausibly, a number of intervenient factors may contribute to alter this association, for example, cognitive reserve, that is at the basis of the optimization of neural resources (Stern et al., 2020).
Additional significant region-to-region associations were found in the sample of dementia patients between the volume of the left inferior parietal lobule and the expression of the DMN and SalN in the left postcentral gyrus, a region normally supporting the SMN, not DMN/SalN. Network encroachment of regions normally deputed to other types of computation has been described among the abnormal features along the AD trajectory (van Hooren et al., 2018; Weiler et al., 2017). On this note, a higher level of DMN and SalN expression in areas deputed to sensory processing is likely to be the outcome of tentative compensatory processes, which, being inefficient, may result in maladaptive activity upregulation.
The pattern of associations between regional volumes and network expression in SMN territory among dementia patients also emerged from region-to-voxel models. Specifically, the volume of the posterior cingulate predicted SMN strength in left pericentral and premotor clusters. Although the directionality of this finding would point at a general mechanism based on retained integrity controlling both distributions, that is, patients who retain sufficient degree of integrity within the posterior cingulate cortex would also have more neural resources available for computation in the SMN, we limit our interpretation by highlighting the heterogeneous and mixed pattern of statistical associations, whereby left sensorimotor regions are at the center of multiple statistical associations involving distinct and largely anticorrelated neural systems.
One significant result was found in the group of HC: The volume of the right inferior parietal lobule was a negative predictor of the SMN in the left precentral gyrus. SMN connectivity within the motor cortex tends to be upregulated with age, indicating that a stronger SMN may help retain normal levels of motor function (Seidler et al., 2015). The inferior parietal lobe contributes to motor functioning by integrating motor and visual information (Fogassi and Luppino, 2005). This negative association suggests, therefore, that adults presenting with less atrophy or less volumetric decline affecting the inferior parietal lobule might show better motor functioning and would thus not require any SMN upregulation within the primary motor cortex.
No significant finding emerged in the group of MCI patients. Although the MCI diagnostic label is meant to identify a well-defined clinical stage, no comparable homogeneity exists in the MRI-informed profile of these patients. A meta-analysis, in fact, found ample inter-study variability in the pattern of DMN findings detected in MCI patients (Eyler et al., 2019). The MCI due to AD is a transitional stage and, aside from the effects of early stage pathology, a large number of additional mechanisms actively contribute toward modulating the association between pathophysiological and clinical profiles, for example, those proposed by the models of resilience, reserve and maintenance (Cabeza et al., 2018), or by more complex frameworks of cognitive aging (Reuter-Lorenz and Park, 2014).
No significant findings emerged from voxel-to-voxel correlational models. We argue that this methodology was excessively conservative, as it was based on the assumption that gray-matter density and functional network strength would not simply be mutually associated within regions (which are typically quantified by averaging a large number of voxels), but would instead be associated within each single voxel.
Since these findings arise from statistical models, no pathophysiological interpretation can be drawn into play. There is strong evidence, however, that neurotoxic misfolded proteins (a major, and possibly the main, pathological substrate of AD) propagate through the brain following patterns of connectivity (Adams et al., 2019). This has been proposed also to occur from network to network (Zhou et al., 2012), and it might be a factor at the basis of the network-to-network associations found in this study. The SalN, in particular, is not affected by amyloid pathology in its core hubs in normal aging (Lim et al., 2014; Lin et al., 2020; Schultz et al., 2017).
This investigation is not free from limitations. Although the scientific literature indicates that the two functional networks of interest considered in this study are differently influenced by the pathological mechanisms of AD, this was not specifically addressed on a subject-by-subject basis by our methodology (i.e., via measurement of cerebrospinal fluid biomarkers or with neuromolecular imaging). Indeed, CSF biomarker evidence could only be obtained from a proportion of this cohort. Second, although a large body of studies has addressed network expression by describing intra-network and inter-network components of functional connectivity in more detail, we did not address this distinction in a direct way.
Our research question, in fact, focused on the association between structural and functional properties, and, on this note, any intra/inter-network pattern was interpreted a posteriori, as a function of the results. Given the exploratory nature of the study, however, these points define aspects of possible methodological improvement for future investigations. A major development will certainly be the study of the link between regional volume and functional network expression using longitudinal designs in which impoverishment in the pattern of resting-state brain function is investigated as a function of test–retest volumetric decrements typically resulting from age-dependent atrophy.
Conclusions
Regional volumes of main functional network hubs act as significant statistical predictors of hemodynamic network expression. In healthy adults, the strength of the SMN is associated with DMN volumes. In dementia patients it is the strength of the DMN that is linked to SalN volumes. Moreover, in this same group of patients, additional associations indicated maladaptive network encroaching. Finally, no significant findings emerged among MCI patients, plausibly due to the intrinsic heterogeneity that characterizes neural processing in this diagnostic group.
Overall, no simple scheme of associations exists between structural and functional properties of key brain regions involved in the expression of major large-scale functional brain networks. The picture is instead that of an intricate set of patterns that depends on diagnostic stage, network of interest, and, in all likelihood, the underlying presence of pathology as the main determinant of network dysfunction.
Footnotes
Authors' Contributions
G.S. contributed to data processing and analysis, and to the drafting, revision, and finalizing of the article. M.D.M. contributed to data analysis and visualization, and to the drafting of the article. H.S. and A.V. conceived the project, devised and conduced the experiments, and contributed to the revision and finalizing of the article. G.B. contributed to the conception of the project and to the revision and finalizing of the article. M.H. contributed to data acquisition, revision and finalizing of the article. All authors approved the final version of the article.
Acknowledgments
This is a summary of independent research carried out at the NIHR Sheffield Biomedical Research Centre (Translational Neuroscience). The views expressed are those of the authors and not necessarily those of the NHS, the NIHR, or the Department of Health. The support of the NIHR Clinical Research Facility—Sheffield Teaching Hospital is also acknowledged. M.D.M. and A.V. acknowledge the support from Neurocare. G.S. acknowledges the support from a scholarship from University La Sapienza, Rome. Italy.
Author Disclosure Statement
H.S. reports consultation fees from ACImmune, MERCK, and Novo Nordisk not related to this work. A.V. has received consultation fees from MERCK and Biogen not related to this work. The other authors have no conflicts of interest to report.
Funding Information
Scan acquisition for this study was supported by funding from the European Union Seventh Framework Programme (FP7/2007e2013) under grant agreement no. 601055, VPH-DARE@IT to H.S. and A.V.