




Abstract
Background:
Graph theory and connectomics are new techniques for uncovering disease-induced changes in the brain's structural network. Most prior studied have focused on network statistics as biomarkers of disease. However, an emerging body of work involves exploring how the network serves as a conduit for the propagation of disease factors in the brain and has successfully mapped the functional and pathological consequences of disease propagation. In Alzheimer's disease (AD), progressive deposition of misfolded proteins amyloid and tau is well-known to follow fiber projections, under a “prion-like” trans-neuronal transmission mechanism, through which misfolded proteins cascade along neuronal pathways, giving rise to network spread.
Methods:
In this review, we survey the state of the art in mathematical modeling of connectome-mediated pathology spread in AD. Then we address several open questions that are amenable to mathematically precise parsimonious modeling of pathophysiological processes, extrapolated to the whole brain. We specifically identify current formal models of how misfolded proteins are produced, aggregate, and disseminate in brain circuits, and attempt to understand how this process leads to stereotyped progression in Alzheimer's and other related diseases.
Conclusion:
This review serves to unify current efforts in modeling of AD progression that together have the potential to explain observed phenomena and serve as a test-bed for future hypothesis generation and testing in silico.
Impact statement
Graph theory is a powerful new approach that is transforming the study of brain processes. There do not exist many focused reviews of the subfield of graph modeling of how Alzheimer's and other dementias propagate within the brain network, and how these processes can be mapped mathematically. By providing timely and topical review of this subfield, we fill a critical gap in the community and present a unified view that can serve as an in silico test-bed for future hypothesis generation and testing. We also point to several open and unaddressed questions and controversies that future practitioners can tackle.
Introduction
As a large and complex network the brain is capable of sustaining prodigious computational processes, operating at many spatial and temporal scales. The connections between distant nodes may be via local dendritic and axonal arbors, or long-range bundles of axonal projections. The latter is now a well-studied field, under the general phrase “connectome” (Sporns et al., 2005). Advances in graph theory of brain networks make it possible to model structural wiring that supports the brain's functional behavior (Engel et al., 2013; Hagmann et al., 2008; Iturria-Medina, 2013; Rubinov and Sporns, 2010). Disturbances in global and local network organization are well documented in neurodegenerative diseases, including Alzheimer's disease (AD) (Lo et al., 2010), frontotemporal dementia (FTD) (Kuceyeski et al., 2012), and amyotrophic lateral sclerosis (ALS) (Verstraete et al., 2011).
Often the connectome is dynamically altered due to ongoing brain changes due to development, aging, or during the course of disease (Bassett and Sporns, 2017), and investigation of these dynamics is emerging as a new area of research. Indeed, both pathology and connectivity affect each other, in two broad ways: First, some diseases directly target neural connections, for example, via demyelination (Bartzokis, 2004; Gold et al., 2010) and axonal injury (Deleglise et al., 2014; Fjell et al., 2010; Leoni, 2011; Salehi et al., 2006), leading to anomalous connectivity that then cause widespread information-processing impairments and aberrant function (Iturria-Medina, 2013). Second, disease can cause malfunctioning of the nodes, which can then spread via neural connections to other areas and cause either localized or widespread structural and functional impairment.
Thus, going beyond the popular study of static changes between diseased and healthy networks is the potential to understand the disease dynamics these networks can sustain. The mechanistic role of structural networks for shaping brain dynamics was cited as a key rationale for mapping the human connectome (Sporns et al., 2005). These two different modes of connectome-mediated disease effects were suggested and reviewed as “dynamics on and of brain networks” by Bassett and Sporns (2017). Of course, AD brains display behavior characterized by both modes (Oxtoby et al., 2017).
Scope of this review
In this mini review, we survey the emerging field of network spread modeling, specifically in the context of AD and related dementias. This is a highly selective and focused review with a distinct neuroimaging slant that only cites those articles that directly advance its logic; consequently, many worthy articles do not find mention. Our objectives are twofold: first, to collect recent efforts in mathematical modeling of disease progression in AD; and second, to theorize about the potential of these efforts to catalyze a new, unified understanding of AD and other neurodegenerative diseases as primarily network-driven phenomena. We hope this review will open to the reader a new set of tools for addressing several key open questions in Alzheimer's research that to date remain unresolved: How do protein aggregation and the subsequent spread lead to stereotyped progression in the Alzheimer brain? Why do misfolded τ oligomers selectively target certain specific structures? Can mathematical network models that describe these processes recapitulate in vivo measurements in human brains?
To keep the discussion focused on this somewhat narrower set of concepts involving the spread of pathology on networks and its pathophysiological and clinical effects, we do not discuss the larger general field of graph theory in neurological diseases that is aimed at uncovering the alteration of network statistics in disease. The subject of brain graph theory is vast, and no attempt is made here to provide completeness in coverage. The topic of how brain networks or graphs can be extracted from in vivo neuroimaging data, including diffusion and functional magnetic resonance imaging (MRI), is not included. The computational algorithms such as tractography, inferring structural connectivity between each region pairs to obtain the whole-brain regional connectivity graph, are not covered. For excellent reviews on those aspects, please refer to Garyfallidis and colleagues (2014), Glasser and colleagues (2013), and Van Essen and colleagues (2012).
Graph theoretic analysis of brain network is also a large field, with excellent advances being made routinely. Characteristic graph metrics to examine differences in network organization are now widely available and published. These network metrics include global (network-wide) metrics such as connection density, global efficiency, clustering coefficient, small-worldness, average shortest path length, and modularity. Several metrics have local counterparts, which can be defined at the node or edge level such as local connection strength, local efficiency, and local modularity. A widely cited open resource available in MATLAB for computing these metrics is the Brain Connectivity Toolbox as described in Rubinov and Sporns (2010). Specific network statistics are well-studied and been examined extensively in prior reviews (Bassett and Sporns, 2017; Bullmore et al., 2009; Rubinov and Sporns, 2010). These studies, although valuable and pertinent to the current topic, are also purposefully not being reviewed here, since our focus is on how brain connections enable pathology spread, and not how these networks are affected themselves.
It would be appropriate at the outset to recognize the limitations of the neuroimaging methods on which the approaches surveyed here are based. Atrophy from MRI and amyloid/tau uptake data from positron emission tomography (PET) share sensitivity and accuracy issues common to image acquisition and computational neuroanatomic data processing pipelines (Diaz-de-Grenu et al., 2014). Tau and amyloid PET uptake can show substantial nonspecific binding (Barrio, 2018). The estimation of white matter connectivity too inherits technical limitations of the volumetric and tractography processing pipelines, including HARDI spatial and angular resolution, coregistration errors, and the distance bias inherent in tractography (Behrens et al., 2007; Calamante, 2019). The validation of pathology spread models using MRI-derived atrophy assumes that two are colocalized; this is limiting yet reasonable, as tau appears strongly associated with degeneration (Arriagada et al., 1992; Nelson et al., 2012; Xia et al., 2017). While the focus of this article is on AD-specific effects, those can be challenging to disentangle from the dynamics of normal aging across the life span (Chang et al., 2015; Crary et al., 2014; Jagust and Mormino, 2011; Lowe et al., 2018).
The article is divided into eight sections, roughly arranged in order of generality, going from the most specific and fine-grained to the most abstract. A more speculative section is included at the end that discusses open questions, controversies, and future work.
Ethics statement
This review does not include any original or derived data on human subjects.
Neurobiological Basis for Considering Neurodegeneration As a Network Disease
AD involves widespread and progressive deposition of amyloid beta (Aβ) protein in cortical plaques and of protein tau (τ) in tangles. Aβ usually first appears in frontal regions and subsequently spreads to allocortical, diencephalic, brainstem, striatal, and basal forebrain regions (Jagust and Mormino, 2011; Thal et al., 2002). The τ protein is mainly intraneuronal and in physiological conditions promotes the assembly and stabilization of microtubules. In AD patients, this microtubule-associated τ undergoes hyperphosphorylation (Noble et al., 2013), loses its stabilizing function, mis-sorts into the somatodendritic compartment (Li et al., 2011), and eventually aggregates into neurofibrillary tangles (Chien et al., 2013; Clavaguera et al., 2009; Elobeid et al., 2012; Tai et al., 2014). Evidence suggests that metastable, soluble oligomers formed early in the aggregation process and small fibril fragments are the predominant toxic species (Cárdenas-Aguayo et al., 2014; Gerson and Kayed, 2013). Neurofibrillary τ tangles appear first in locus coeruleus, then entorhinal cortex, then spreads into the hippocampus, amygdala, temporal lobe, basal forebrain, and association areas, in order (Braak and Braak, 1996; Braak and Del Tredici, 2012; Thal et al., 2002).
Conventionally, neurodegeneration was thought to spread via progressive disconnection in brain structure through which earlier disease-affected brain regions may cause degeneration, which then cascades through the entire network. This is a vast topic in itself, and more comprehensive reviews are available (Brier et al., 2014). More generally, the apparent network spread of AD pathology might happen via aberrant connectivity and network degeneration (Brier et al., 2014; Drzezga et al., 2011; Iturria-Medina, 2013) via demyelination and axonal injury, secondary Wallerian degeneration, loss of signaling, and axonal and dendrite retraction (Acosta-Cabronero et al., 2010; Agosta et al., 2012; Avants et al., 2010; Ballatore et al., 2007; Boluda et al., 2015; Bourgeat et al., 2010; Kuczynski et al., 2010; Lewis et al., 2001; Su et al., 1997).
However, more recently, another mechanism is becoming apparent. Instead of being primarily impaired in degeneration, in this evolving view the network is unaltered (in early stages) and serves primarily as a conduit for disease transmission. Neuroimaging studies suggest that highly connected hub-like regions appear to be facilitators of pathology (Buckner et al., 2009; Drzezga et al., 2011) and anchor epicenters or attractors into which pathology accumulates (Buckner et al., 2009; Raj et al., 2012; Seeley et al., 2009; Wang et al., 2017; Zhou et al., 2010, 2012). Disease factors can directly propagate along (possibly unchanging) neural connections, underpinned by “prion-like” protein aggregation followed by their trans-synaptic transmission (Clavaguera et al., 2009; Frost and Diamond, 2010; Frost et al., 2009; Iba et al., 2015; Jucker and Walker, 2013; Liu et al., 2012; Palop et al., 2006). After initial seeding and local aggregation, misfolded τ might then propagate through neuronal pathways, transmitting trans-synaptically, and thus spread throughout the brain.
Several lines of evidence suggest disease progression might occur via trans-synaptic transmission of toxic proteins along neuronal pathways. This process has been implicated in a wide variety of neurodegenerative diseases, including AD (tau, amyloid), FTD (tau, TDP-43, ubiquitin), progressive supranuclear palsy (tau), and Parkinson's disease (PD; α-synuclein) (Ahmed et al., 2014; Clavaguera et al., 2009; de Calignon et al., 2012; Frost and Diamond, 2010; Frost et al., 2009a,b; Gerson and Kayed, 2013; Iba et al., 2013; Jackson, 2014; Jucker and Walker, 2013; Liu et al., 2012; Walker and LeVine, 2012; Walker et al., 2013, 2018; Wu et al., 2013).
Modeling Protein Aggregation
Many biophysical models are available of how proteins are destabilized from their native conformation into partially folded intermediates with increased aggregation propensity (Gillam and MacPhee, 2013). See the thorough review by Carbonell and colleagues (2018). These include the heteromer model (Prusiner et al., 1990) and nucleated polymerization model (NPM) (Masel et al., 1999). The initial conformational change is referred to as “monomer activation” (Morris et al., 2009). Subsequent fibrillation follows a nucleation/elongation process. Small, oligomeric species may then form by association of the partially folded protein units and proceed to assemble into larger, fibrillar aggregates, which in turn associate with mature fibril-like amyloid structures (Gillam and MacPhee, 2013; Serpell et al., 1997).
It is not our goal to survey the entire field of protein aggregation; this literature is extensive and surveyed in numerous recent reviews, including of amyloid fibril structure (Eisenberg and Jucker, 2012; Serpell et al., 1997), mechanism of toxicity (Eisenberg and Jucker, 2012; Walsh and Selkoe, 2007), and the aggregation process (Wetzel, 1996). A few selected aggregation and diffusion models are listed in Table 1 to show the commonalities between them. These approaches are further described below.
Essential Mathematics of Protein Aggregation Models
Although mathematical models have been explored in related prion disease (Morris et al., 2009; Serpell et al., 1997), they are only recently becoming available in Alzheimer's and dementia, focusing mainly on Aβ. Many groups have utilized Smoluchowski equations (Smoluchowski, 1917), a system of discrete differential equations for the study of coagulation of Aβ and tau (Achdou et al., 2013; Bertsch et al., 2017; Franchi and Lorenzani, 2016, 2017; Franchi and Tesi, 2012; Gillam and MacPhee, 2013; Murphy and Pallitto, 2000; Pallitto and Murphy, 2001). Kinetic and thermodynamic descriptions of protein aggregation were reviewed by Morrisand colleagues (2009), and mathematical models in Gillam and MacPhee (2013). A caveat in these explorations is that current models of protein aggregation involve kinetic and aggregation parameters that must be estimated from detailed in vitro experimental data on reaction kinetics. Kinetics in solution or suspension does not frequently capture the complex environments and the pathological milieu of proteins in tissue in vivo. Hence, further experimental effort is needed to pin down kinetic parameters and reduce the risk of overfitting in these models.
From local aggregation to spatial spread
To augment the above protein aggregation models (Payne and Krakauer, 1998), introduced classical spatial diffusion within prion aggregation (Bertsch et al., 2017), introduced diffusion in addition to truncated Smoluchowski equations, and (Matthaus, 2006) combined spatial diffusion with NPM. The latter also explored network spread on “toy” connectomes but not real data. A classical Fisher–Kolmogorov reaction-diffusion model of two-species protein aggregation was combined with anisotropic spatial diffusion within the brain (Weickenmeier et al., 2019) to simulate misfolding across the entire brain. Anisotropy was derived from the white matter fiber architecture, under the assumption that protein diffusion would be highest along rather than across fiber bundles. In their recent condensed historical review, Carbonell et al. (2018) summarize the mathematical underpinnings of complex misfolded protein mechanisms, and how they relate to transmission at the local/regional and whole-brain level.
Mathematical Modeling of Trans-Neuronal Network Propagation
Based on emerging bench science, it is clear that spatial diffusion alone might not be the most appropriate means of capturing protein spread along fibers, since active axonal transport is commonly expected to be the dominant manner for the intra-axonal movement of tau and amyloid before their trans-synaptic transmission (de Calignon et al., 2012; Gerson and Kayed, 2013; Li et al., 2011; Pigino et al., 2009; Song et al., 2014; Wu et al., 2013; Yamazaki et al., 1995). Under this mode, the process of spread will most likely involve the strength of inter-regional connectivity rather than its distance along fiber projections. Several mathematical models are now available in the literature that utilizes this primary model of protein network transmission, all utilizing the structural connectivity matrix or the connectome.
A generic model that combines network spread with aggregation is illustrated in Figure 1, consisting of three processes: misfolded monomer protein production; subsequent aggregation into oligomers and tangles; and the spatiotemporal progression of misfolded protein as it ramifies into neural circuits. The power of such approaches hinges on their parsimonious bottom-up biophysical modeling, and ideally all model parameters should be global and region-invariant. Certainly, as higher complexity and disease specificity are added, regionally varying parameters and interaction terms may need to be added—see section below on Open Questions.

Illustration of the mechanisms and processes being reviewed in this article.
Early models of trans-neuronal network propagation
An early graph theoretic model of neurodegenerative pathology spread was described by Matthaus (2006), utilizing a synthetic model of local circuit connections between cells from the mouse visual system. Comparison of spread on this simple synthetic local network against spatial diffusion suggested that the time until a cell becomes infected does not only depend on the distance of the cell to the origin of infection, but also on the cell's connectivity (Matthaus, 2006). Matthaus (2006) subsequently extended this work, combining simple spatial diffusion with classic network science to obtain a model through which disease spreads stochastically along connections. This work provided an early mathematical window into the mechanisms underlying pathology spread, proposing that the brain's structural organization affects the speed at which disease spreads as well as regions that are selectively vulnerable to attacks. This understanding, which implicates connectivity as a crucial component in disease progression, has contributed to the conception of neurodegeneration as network diseases.
Network models of trans-neuronal propagation
The landmark work of Matthaus (2006) laid the foundation for further graph theoretic models to explore progressive disconnection in neurodegeneration. Due to the vastly different topology and scale of human brain connectomes and the availability of in vivo imaging data, these recent advances have generally come from the field of neuroimaging instead of the older field of protein aggregation and diffusion community. Mathematical models of reaction-diffusion or network processes have become increasingly popular for evaluating the brain-wide consequences of biophysical mechanisms underlying the self-assembly and propagation of neurodegenerative pathologies (Fornari et al., 2019; Iturria-Medina et al., 2014; Pievani et al., 2011; Raj et al., 2012, 2015; Weickenmeier et al., 2019; Zhou et al., 2012). In Table 2, we provide the essential mathematics and descriptions regarding some of the popular models of network spread of AD pathology. The table also serves to demonstrate the essential similarity between these models, since they primarily differ in how the source or seeding term is formulated. These studies are described in detail below.
Essential Mathematics of Protein Network Spread Models
NDM, network diffusion model.
One of the earliest studies in this series was the 2012 article describing the network diffusion model (NDM) that mathematically derived the behavior of protein transmission as a graph heat equation under a connectivity-driven mechanism (Raj et al., 2012). In this approach, the concept of network diffusion was applied to model in vivo trans-neuronal pathology spread of AD on structural connectivity networks (Raj et al., 2012). The NDM postulated that the rate of increase over time of disease pathology between two connected but remote regions depends on the concentration gradient as well as the anatomical connection strength between them. Note that they did not incorporate the effect of fiber distance, under the assumption that the distal spread is mediated by active transport, which is independent of distance, rather than passive spatial diffusion, which is not. It may be clarified that despite the title of the article, their model does not in fact capture classic diffusion at all, but only trans-neuronal transmission.
This was the first and to date only analytical model (i.e., accessible in closed form via the solution of a linear differential equation). Validation of the model was performed via MRI-derived regional atrophy as a surrogate for tau protein. Since the NDM was capable of predicting the future states of atrophy, this aspect was subsequently validated in a different, much larger, Alzheimer's Disease Neuroimaging Initiative (ADNI) cohort, showing a high predictive ability of future disease patterns in 418 subjects on the AD spectrum (Raj et al., 2015). This aspect has since been applied to many other degenerative diseases (Freeze et al., 2019; Pandya et al., 2017, 2019; Poudel et al., 2019, 2020).
A somewhat different yet complementary approach was taken by Iturria-Medina and colleagues (2014), who loosely modeled protein aggregation as a stochastic process of epidemic spread on the brain's network and successfully validated on amyloid PET data of 733 subjects, also taken from the ADNI study. This landmark study provided further support to the applicability of network spread models describing disease pathology throughout the brain. They were able to incorporate through the inclusion of appropriate mathematical terms the effect of production/clearance of pathogenic proteins as well as individual genetic/demographic properties (Iturria-Medina et al., 2014). This study was one of the first to link individuals' structural connectivity with demographic differences. This approach too has been widely adopted in related contexts (Iturria-Medina et al., 2017; Pandya et al., 2019; Vogel et al., 2020; Yau et al., 2018; Zeighami et al., 2015).
A more recent study (Fornari et al., 2019) added a simplified logistic growth source term, similar to Weickenmeier and colleagues (2019), to a classic network diffusion process along the lines of Raj and colleagues (2012), to simulate the aggregation of misfolded protein using three classes of kinetic models: the Fisher–Kolmogorov model, the heterodimer model, and the Smoluchowski model. They were able to verify that their simulations resemble realistic AD staging; however, a full quantitative validation on neuroimaging data is awaited. Similarly, sparse impulse sources were added to the classic NDM, allowing both global diffusivity and network-independent local seeding or source terms (Yang et al., 2019). Using a gradient descent approach to solve a sparsity-constrained optimization problem, they were able to identify distinct patterns of propagative and generative buildup of tau at a population level.
Equivalence between network spread models?
As suggested above and in Table 2, the common spread models are fundamentally similar, and mainly differ in how the source term is specified. The most complex formulation, the epidemic model (Iturria-Medina et al., 2014; Vogel et al., 2020), while formulated stochastically and differently, may also be reduced, with suitable approximations, to the others as a special case. This general sense of equivalence is not surprising, since all models rely on trans-neuronal spread of underlying pathology. However, we stress that an analytical exposition of the equivalence between different spread models has not yet been published, and these remarks may be considered speculative at this point of time.
Most network models are excellent at capturing the empirical spatial and temporal aspects of AD disease topography; illustrative figures from key articles are given in Figure 2.

Examples of key network spread models in AD.
Inverting network spread to infer sites of pathology origin
With the success of the above mathematical expositions in predicting future states of the AD brain, researchers began to explore another clinically relevant application: the possibility of “going back” in time to infer the likely sources of pathology initiation that would best explain the current measured patterns of atrophy and pathology in a patient. A beginning in this regard was presented in Zhou and colleagues (2012), who attempted to infer epicenters of the functional network from which putative pathology might have emanated. To analytically predict future patterns of atrophy and pathology in the NDM framework, one must specify the initial state of the system on which the “forward” NDM is applied. Hu and colleagues (2016) used the NDM as the forward model, but added additional terms describing the effect of several seeding events of unknown location and time. They proposed to infer the unknown events using sophisticated sampling-based Bayesian inference procedures. The inference procedure was shown to be generally successful, but whether due to the ambitiousness of the approach, the need to fit so many unknowns, or inherent clinical heterogeneity, the results were not fully in line with expected seed locations in AD.
Torok and colleagues (2018) also developed a similar algorithm to “reverse” the NDM to infer the prior disease states of individual patients on the AD spectrum. In contrast to Hu and colleagues (2016), they formulated a much simpler problem through which only a single seeding event of unknown time was postulated. They imposed a sparsity condition on the seed patterns under the expectation that only a few sites across the individual's brain are initially involved in the disease. This model identified seeds of origin that successfully reproduced known trends in AD and demonstrated that the inferred individualized seed vectors outperform the best single-loci seed vector placed in the hippocampus (Torok et al., 2018). A very similar approach was also found subsequently to be successful in PD (Maia et al., 2020).
Mathematical modeling of pathology spread using animal data
Although successful on human neuroimaging data, these models have largely remained unvalidated with respect to direct measurement of whole-brain pathology that is possible in animal models but not in humans. Of late, several reports have begun to fill this gap. Mezias and colleagues (2017) illustrated that a network transmission model of pathology spread effectively predicts whole-brain progression of tau pathology in transgenic mouse models of AD. It was also shown that the contribution of network connectivity far exceeds innate region-specific molecular factors governed by gene expression of AD-implicated genes (Fig. 3). A caveat here is that network transmission appears more relevant for tau than for Aβ, since a similar model on amyloid load in transgenic mice was capable of predicting Aβ spread, but not necessarily better than a model of spatial spread—one that does not involve network transmission, revealing a potentially important distinction between their respective mechanisms (Mezias and Raj, 2017).
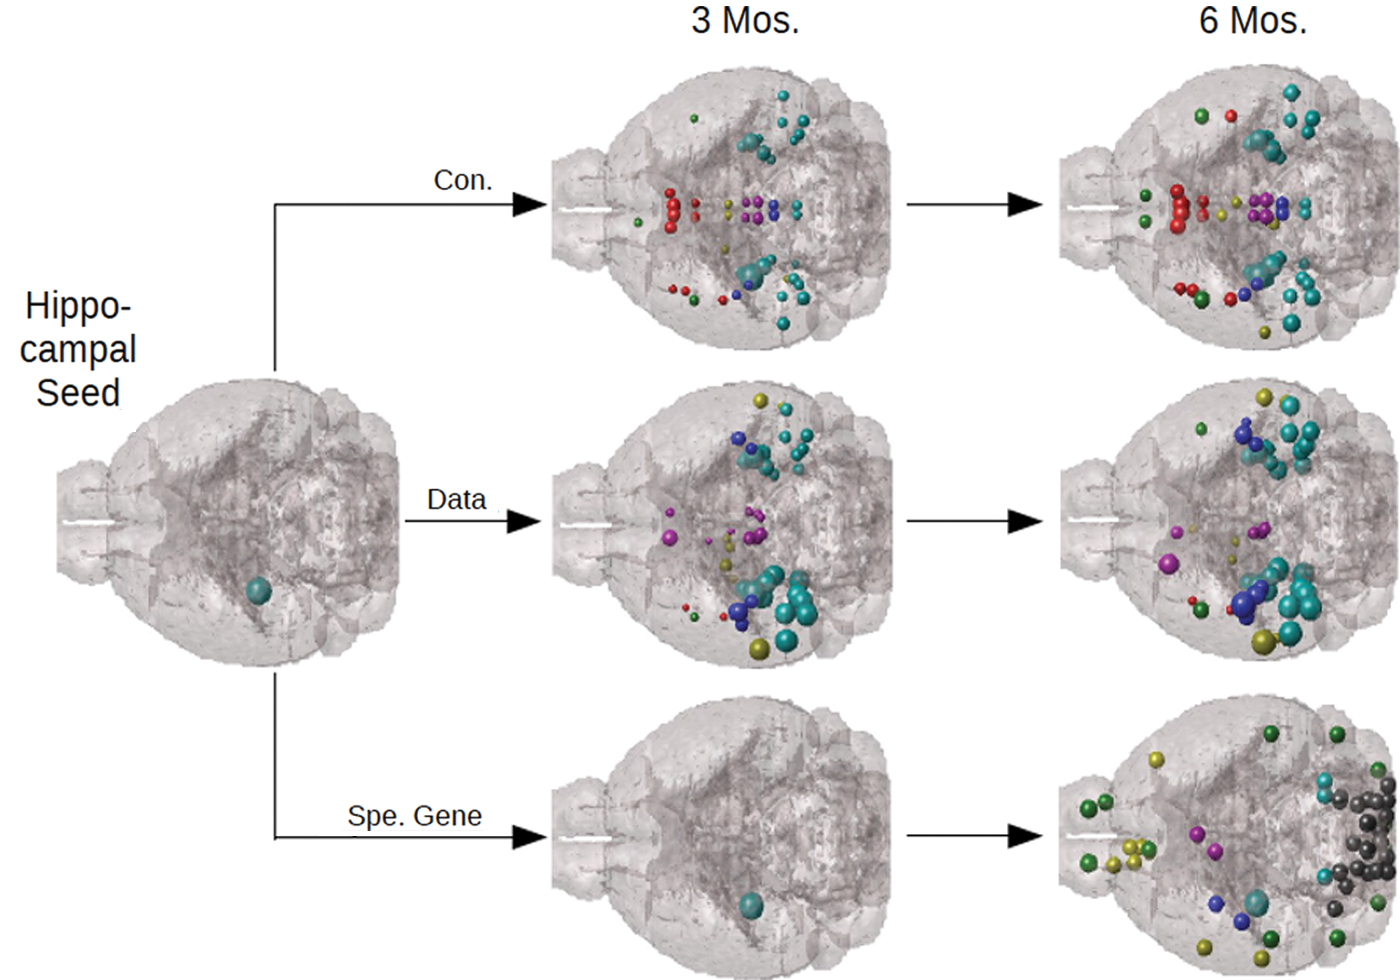
Example of successful network spread model in mouse tauopathy. Taken from Mezias and colleagues (2017), this figure illustrates an NDM evaluated on the mouse mesoscsale connectome, seeded at the hippocampus (mimicking injection site in actual mouse tau experiments). The model (top row) correctly recapitulates empirical tau proliferation seen in exogenously seeded transgenic tau mice (middle row). Interestingly, when tau spread was modeled using gene expression similarity between brain regions (bottom row), the resulting pattern did not resemble empirical tauopathy, suggesting that tau spread follows the connectome rather than proliferates between molecularly similar regions, an outcome that appears to negate selective regional vulnerability hypotheses. Color images are available online.
Models of Spread on Functional Connectomes
Both structural and functional connectivities serve as good substrates for network spread. Previous proposals involving network epicenters in neurodegenerative diseases used resting-state functional networks, suggesting that intrinsic topology of the functional network mediates template-directed misfolding (Seeley et al., 2009; Zhou et al., 2012). Many studies have observed the resemblance of vulnerable regions to spatially distinct networks characterized internally by close functional correlations (Du et al., 2007; Seeley et al., 2009; Zhou et al., 2010). Longitudinal tau-PET studies show that the brains' functional connectivity architecture is associated with the future spread of tau (Franzmeier et al., 2019, 2020). Whether neurodegenerative pathology patterns are mediated by structural or functional connections is controversial (Brettschneider et al., 2015; Jones et al., 2016; Raj et al., 2012; Schmidt et al., 2016; Zhou et al., 2012). There are two nonexclusive possibilities:
First, it is plausible that pathology follows network dysfunction or cascading failures in brain activity (Jones et al., 2016), quite independent of the above-noted role of misfolded proteins to spread along long-range fiber projections. Conjectures regarding selective vulnerability of different functional networks sharing similar genetic susceptibility (Franzmeier et al., 2020), synchronous neural activity, region-specific functional loads, or some as yet unknown structural, metabolic, and physiological aspects of neural network biology were put forth (Saxena and Caroni, 2011). Buckner and colleagues (2005) conjectured that early metabolic activity in the default network is somehow later implicated in AD progression. Hubs of metabolic activity are especially vulnerable to AD atrophy (Buckner et al., 2009; de Haan et al., 2012; Pievani et al., 2011; Rabinovici et al., 2010; Villain et al., 2010). Thus, tau and amyloid can spread to areas sharing these vulnerable factors, without a direct requirement for those regions to receive misfolded proteins via structural connections.
Second, it is possible that the primary effect of pathology transmission is indeed mediated by the structural connectome, and the apparent role of the functional connectome is merely an epi-phenomenon due to the tight collinearity between the two types of connectomes (Greicius et al., 2009; Honey et al., 2009). It was previously noted that the network harmonics, or eigenvectors, of the structural graph and functional graphs are roughly homologous (Raj et al., 2012). There is now a mounting body of work exploring these relationships using graph theoretic models similar to the NDM and its eigenmodes (Abdelnour et al., 2014, 2018; Atasoy et al., 2016; Becker et al., 2018; Deslauriers-Gauthier et al., 2020; Honey et al., 2009; Meier et al., 2016; Tewarie et al., 2020). This homology may explain why dementias appear to fall into distinct intrinsic functional networks such as the default mode—as a strictly mechanical consequence of network spread on the structural connectome. There does not appear as yet sufficient evidence to rule out either of these possibilities.
Data-Driven and Graph Theoretic Prediction Models of AD
The development of prognostic biomarkers of AD progression is a topic of intense interest, but has proved challenging. Although multiple AD imaging biomarkers are now routinely acquired, the relationships between them are poorly understood, hampering clinical explorations. Despite remarkable progress in prognostic neuroimaging and molecular biomarkers (Ba et al., 2017; Tosun et al., 2016), the relationship between baseline and longitudinal progression is inconsistently described (Mattsson et al., 2009; Schindler et al., 2017), and the overall accuracy of clinical diagnosis based on cognitive metrics is low (Beach et al., 2012). Dependence on cognitive/clinical score as a metric of disease progression is problematic, because clinically diagnosed AD can have non-AD etiologies, and some cognitive controls may have pre-clinical AD (Hassenstab et al., 2016). Prior work supports that baseline biomarker profiles can distinguish AD from other neurological diseases, assess risk for progression to AD, or distinguish progressors from nonprogressors in clinical trial environments (Ewers et al., 2015; Mattsson et al., 2014; Shaw et al., 2011; Tosun et al., 2016).
It is in these aspects of clinical translation that graph models could provide a unique opportunity for computational tracking and prediction. A few instances of the ability of network spread models to successfully capture the longitudinal evolution of tau and atrophy and the relationship between various evolving biomarkers are available (Iturria-Medina et al., 2014, 2017; Raj et al., 2015; Vogel et al., 2020; Yang et al., 2019). Once they have been refined and applied to individual subjects, they will enable multimodality integration and tracking of patients' imaging data.
Although the above examples were highlighted to demonstrate that biophysical models of protein transmission can produce effective network models of AD progression, we emphasize that more general, abstract, and nonbiophysical graph theoretic approaches can also be quite insightful in the AD context. Some of the earliest and most impactful studies in this area involved abstract graph concepts such as resting-state functional activity networks, especially default mode network (Buckner et al., 2005).
Many recent graph studies of network spread have included models of cooperative spread (Avena-Koenigsberger et al., 2017) and communication cascades (Mišić et al., 2015), which lend further support that the brain organization shapes global communication and facilitates integration function. Specifically, it was illustrated that the hub regions in the network facilitate early spreading (de Haan et al., 2012; Drzezga et al., 2011; Mišić et al., 2014), while the short path structures of the connectome accelerate speed of communication cascades (Mišić et al., 2015). For a comprehensive review evaluating more general models of communication dynamics, see Avena-Koenigsberger and colleagues (2017). The cascading failure model (Jones et al., 2016) is another recent example. Networks obtained from correlations between brain regions of their amyloid-PET levels (Sepulcre et al., 2013), and similar studies using canonical correlation analysis (Tosun et al., 2011) were predictive of pathology deposition and atrophy.
Successful models of AD progression do not need to be network based at all; for example, the work of Oxtoby and colleagues (2017) and Young and colleagues (2014) explored how the pathology propagates through the brain via a data-driven event-based model. In a similar vein, computational methods for combining various high-dimensional biomarkers into a common score of AD progression are available (Bilgel et al., 2014; Jedynak et al., 2015). By analyzing the changes in the elderly brain over the course of AD, these authors demonstrated how changes in various biomarkers of AD can be modeled to obtain diagnosis and prognosis.
There is burgeoning interest in applying data-driven multimodal machine learning and deep learning approaches for longitudinal tracking, prediction of conversion to AD, and early detection (Abuhmed et al., 2021; Hett et al., 2021; Huang et al., 2017; Lee et al., 2019; Lu et al., 2018; Maroco et al., 2011; Moradi et al., 2015; Nguyen et al., 2020; Suk et al., 2014; Venugopalan et al., 2021; Yang et al., 2019). A detailed survey of machine learning approaches is outside the scope of this review; however, they must be considered equally capable of recapitulating pathophysiology, and future studies may fruitfully explore combining biophysical and statistical and data-driven models. Perhaps a successful recent example of this approach is one where physics-based network modeling was combined with, and used to regularize, machine learning models, specifically graph neural networks (Song et al., 2020).
Other Open Questions and Controversies
Role of Aβ
The protein/protein interaction between amyloid and tau in neurodegenerative diseases is a central feature and key to understanding AD pathophysiology (Ittner and Götz, 2011; Kara et al., 2018; King et al., 2006; Walker et al., 2018), now commonly called the A-T-N model (Jack et al., 2016). However, this model has been difficult to reconcile with the observations of dissociated spatial distribution of tau and amyloid. The temporal and regional distributions of tau, atrophy, metabolism, and Aβ are dissociated (Jack et al., 2010; La Joie et al., 2012; Rabinovici et al., 2010). The dominant “amyloid cascade hypothesis” (Hardy and Selkoe, 2002) as the causing factor for disease initiation and progression has become increasingly contentious in light of repeated failures of large clinical trials targeting the reduction of Aβ plaques, and has led to the search of other mechanisms involving tau.
Several convergence zones were identified where amyloid and tau might undergo potential interactions, especially in inferior–lateral temporal areas and entorhinal cortex (Sepulcre et al., 2016), which were linked to the high density of tau in dystrophic neurites in the inferior–lateral and posterior temporal areas (Marquié et al., 2015). Using a local-to-distributed approach, this study (Sepulcre et al., 2016) found specifically that tau accumulation in these temporal areas relates to “massive Aβ elsewhere in the brain,” hence suggesting these areas as critical regions for linking both pathologies at the large-scale level, in which spreading mechanisms of pathology, possibly involving Tau aggregation in neuritic plaques (Medina and Avila, 2014), might take place. Emerging neuroimaging evidence supports this role of amyloid in tau facilitation in temporal areas: for example, tau uptake in amyloid-negative healthy elderly is restricted to (inferior lateral) the temporal cortex, but is observed in the extratemporal areas in amyloid-positive controls, MCI, and AD, in increasing order (Franzmeier et al., 2019).
The large-scale connectivity approaches described above are yet to address the role of protein-specific mechanisms in disease evolution (Warren et al., 2012). It will be necessary in future mathematical models to incorporate available data on the interaction between these proteins (Bolmont et al., 2007; Götz et al., 2001; Ittner and Götz, 2011; Ittner et al., 2010; Rosso et al., 2000; Skaper, 2012; Tatarnikova et al., 2015).
Network models are not pathology or disease specific
Network approaches have previously been critiqued due to lack of a mapping from specific molecular pathologies to clinical disease. Generic networked spread described above cannot capture the divergence between neurodegenerative diseases, nor explain how the same network process can be enacted by so many different misfolded proteins. To begin addressing these issues, Warren and colleagues (2013) proposed the term “molecular nexopathy” to refer to a coherent conjunction of pathogenic protein and intrinsic neural network characteristics. They noted diverse mechanisms by which molecular dysfunction can interact with the neural architecture to produce observed disease topography. These include dysfunction of synaptic function or maintenance, axonal transport or repair, or downstream trophic or cell–cell signaling. Local profiles of protein expression were thought to confer selective vulnerability of network elements to particular neurodegenerative diseases, and their functional phenotypic signature (Warren et al., 2013). In this molecular nexopathy paradigm, a central role is reserved for network spread, and also for cell-type, architectonic, and other intrinsic properties of brain regions.
To address these possibilities would require the introduction of new pathophysiological details and protein specificity within mathematical models. It would also be necessary to include genetic and molecular biomarkers of each degenerative disease within their network model—an aspect that has so far been addressed only superficially (Acosta et al., 2018; Fornari et al., 2019; Glodzik et al., 2014; Harrison et al., 2019; La Joie et al., 2020; Mezias et al., 2017; Pandya et al., 2019).
The question of divergent topographies in AD variants
Several neurodegenerative disorders, including AD, FTD, PD, ALS, and Huntington's disease, report aggregation and trans-neuronal transmission of pathogenic proteins between cells (Hansen et al., 2011; Herrera et al., 2011; Jack and Holtzman, 2013; Lee et al., 2001; Neumann et al., 2006; Spillantini et al., 1998). Despite these shared mechanisms, the topographic patterning observed in each disease is unique and different, leading to the concept of “selective vulnerability” (Jackson, 2014; Seeley et al., 2009), a subject that has received tremendous attention (Kim et al., 2012; Ling et al., 2016; Rosenbloom et al., 2011; Seeley, 2008; Seeley et al., 2009; Subramaniam, 2019; Verstraete et al., 2011; Zhou et al., 2012). Amyloid deposition, metabolism, and atrophy in AD show spatially distinct involvement of the posterior temporal heteromodal network (Buckner et al., 2005, 2009; Drzezga et al., 2011; He et al., 2008). The behavioral variant of FTD appears restricted to the orbitofrontal network (Seeley, 2008).
The same is also true for AD variants—a small set of clinically similar but syndromically and etiologically distinct diseases, including typical AD, posterior cortical atrophy, and logopenic primary progressive aphasia (Gorno-Tempini et al., 2004; Rosenbloom et al., 2011). All three variants share the same pathological culprits: amyloid and tau, yet have vastly different topography and clinical presentation. Intriguingly, the selectively vulnerable regions in each disease appear to bear little relation to the factors that presumably cause it, especially There exists a notable dissociation between where upstream genes are normally located in the brain and downstream pathology, an observation that has been called one of the key mysteries in the field of neurodegenerative diseases (Fusco et al., 1999; Jackson, 2014; Subramaniam, 2019).
Hence, it is puzzling how selective regional vulnerability can arise from essentially the same pathological progression process. Therefore, future mathematical modelers will be expected to incorporate regional variations among diseases and to explain more satisfactorily how the same network spread process can give rise to such a large range of topographies in closely related diseases.
It was hypothesized that specific disconnection topography is likely a result of differential patterns of insults governed by genetic, molecular, metabolic, or oxidative factors (Saxena and Caroni, 2011). Another plausible explanation for the differential patterns observed in variants can be that they have different starting points. From a seeding event in the entorhinal and mesial temporal lobe, AD pathology spreads outward to wider cortices. This has led to the well-known network epicenter hypothesis (Raj et al., 2012; Seeley et al., 2009; Zhou et al., 2012), which posits that canonical epicenters anchor each neurodegenerative disease—entorhinal cortex in AD (Braak and Braak, 1996; Braak and Del Tredici, 2011), and von Economo neurons of the frontoinsula in FTD (Kim et al., 2012). From these canonical epicenters, pathology ramifies outward, such that individual variability in disease topography may then be viewed as a process of divergence from a common epicenter within each variant. Further study is required to understand the molecular and network correlates of these epicenters, already a subject of intense research.
Directional transmission
Due to MRI and tractography limitations, current human structural networks are necessarily nondirectional (Woolrich and Stephan, 2013) as water diffusion along fiber bundles cannot discriminate cell polarity (soma to axon terminal or vice versa). This is unfortunate, since animal model studies reveal a distinct directional preference for different pathologic species, an effect that gets stronger with time (Mezias et al., 2020). Mechanistic explorations have also thrown up the intriguing possibility that toxic tau in axons is subject to a hypothesized directional diffusive barrier, whose breakdown may result in somatodendritic missorting and a shift in directionality of tau transmission over time (Li et al., 2011). Although animal connectomes do not suffer from this limitation, it would be a tremendous advance if human connectomes too could be imparted directionality via a principled cross-species approach.
A beginning in this direction was reported using an extrapolation of axonal directionality from mouse tracer data to human homologous connections. It was shown that an NDM simulated on this directional human connectome under retrograde (axon terminal to soma) transport achieves better results than a nondirectional connectome or anterograde model (Pandya et al., 2017). Novel methods using metabolic activity mapping have been proposed to detect directed connectivity in human neuroimaging data (Neitzel et al., 2018). If further validated, the addition of directionality has the potential to improve predictive accuracy of connectivity-based spread models. When these techniques are refined and adopted, the issue of pathology spread on directional networks might assume new-found importance.
Canonical healthy or disease-specific connectomes?
It is important to note that the network models we discussed typically simulate pathology spread using healthy white matter networks. The implicit assumption in these models is that intrinsic organization of the connectome itself does not significantly deteriorate throughout disease life course, but rather serves as a conduit for disease spread. Recently, Powell and colleagues (2018) tested this assumption by modeling network diffusion of AD pathology on a young template connectome, older template connectome, and AD patient-specific connectomes. Their model's performance was not significantly altered by the choice of connectome. This suggests that despite measurable changes in the integrity of specific fiber tracts, the overall structural network organization in AD is either preserved or does not materially affect mathematical simulations (Powell et al., 2018). Nevertheless, there is much scope for using disease-specific or individual-specific connectomes, and for combining models of pathology transmission with concomitant degradation of the network.
Summary and Outlook
Graph theoretic approaches are effective at a statistical or descriptive level in uncovering network alterations due to brain diseases. However, this conventional approach has limited utility in tracing the underlying network dynamical processes. This review was aimed at surveying current approaches of modeling the role played by the structural network in mediating neurodegenerative disease spread. It is, however, important to understand that a network model cannot fully address disease etiology or pathophysiology; its value lies in showing that the macroscopic effect of network spread can largely explain the stereotyped patterns of disease, on which individual subjects' and diseases' etiologic factors are added factors. The future outlook of mathematical modeling of network spreads is highly promising for clinical, diagnostic, and therapeutic interventions.
Success of the many dynamic network models, described above, together constitutes a new, systemic conception of neurodegeneration as a mechanical result of the way the disease moves around on the structural network. Most importantly, formal models can serve as computational test-beds, to test preliminary new theories, quickly identifying the most relevant hypotheses or rejecting those less likely to lead to new insights. By serving alongside detailed experimental studies, in silico models can be used for reducing experimental costs or for overcoming structural difficulties. It can aid in the generation of potential efficacious therapeutic targets, much like modern bioinformatic algorithms are revolutionizing drug discovery and precision medicine.
Footnotes
Acknowledgments
The author acknowledges the helpful discussions and insights from Bruno Franchi, an expert in Smoluchowski theory; Sri Nagarajan for model fitting; and the graduate students Chris Mezias and Justin Torok for neurobiological knowledge.
Author's Contribution
A.R. conceived, wrote, and revised the article.
Author Disclosure Statement
No competing financial interests exist.
Funding Information
Ashish Raj was supported by the NIH grants R01NS092802, RF1AG062196, and R56AG064873.