
Abstract
Introduction:
Neuroimaging studies of intellectual disability (ID) have been published over the last three decades, but the findings are often inconsistent, and therefore, the neural correlates of ID remain elusive. This article aims to study the different publications in task-functional magnetic resonance imaging (fMRI) and different ID populations to make a qualitative and quantitative analysis on this field.
Methods:
After duplicates were removed, only 10 studies matching our inclusion criteria were incorporated. Moreover, a quality assessment of the included studies was done. Qualitative results of the different articles were analyzed, separated by type of task and type of ID. Seed-based d mapping (SDM) software was used.
Results:
The right temporal gyrus was more activated in control subjects than in ID. Concretely, the right temporal gyrus is implicated in many cognitive domains as semantic memory processing and language. Moreover, it can be highly influenced by the type of task used in every study. Heterogeneity was not detected. A jackknife sensitivity analysis was also estimated to improve the analysis reliability, and both results were confirmed.
Conclusions:
More task-fMRI studies on ID must be published to add larger samples to address the pathophysiological questions more directly.
Impact statement
In this article, the state-of-the-art in the field of functional magnetic resonance imaging (fMRI) and intellectual disability (ID) is reviewed. Moreover, we perform a meta-analysis of every article's results to summarize the principal outcomes in the field. It is very relevant because it has become the first meta-analytic study to overcome all the principal studies published in fMRI and ID to find the principal neurological substrates while the subjects are performing a task.
Introduction
Intellectual disability (ID) is a common lifetime condition that significantly impacts the individuals and their family. Important limitations in cognitive performance and adaptative behaviors characterize this population (Schalock et al., 2010). This definition is proposed by the American Association on Intellectual and Developmental Disabilities (AAIDD). It highlights the importance of the social and ecological models focused on the person and the environment. At the same time, it recognizes the importance of the individualized support application to improve the person's functioning. The conception toward people with ID has changed, and nowadays, it is not only focused on intellectual functioning (Tassé et al., 2016).
The recognition of the three intelligence components and their correlation with adaptative behavior (conceptual, social, and practical skills) has brought up a new approach toward people with ID that offers new perspectives and intervention models linked with supports. Due to the individualized support mediation, optimal environments for the development and well-being of the person with ID can be promoted (Luckasson et al., 2002). Nowadays, there is a firm conviction that with adequate support application, a person's functional abilities can be enhanced, and his or her results and quality of life can be improved.
From this perspective of ID and considering that it answers to the environmental demands thanks to the support's mediation, we ask ourselves if the brain functioning of people with ID could present some irregularities. In other words, due to the adaptative behavior and the individualized supports, people with ID can develop and have a quality of life, despite their low intellectual functioning. The brain connectivity patterns of people with ID could be different from the brain connectivity patterns of people without ID.
To study brain connectivity, our principal aim is to study the different publications in functional magnetic resonance imaging (fMRI) and people with ID.
As it is well-known, fMRI estimates functional connectivity, which describes the temporal dependence between different brain areas (Friston et al., 1993). The study of the brain as an integrative network of functional connections contributes to the human behavior knowledge and also provides helpful information for the comprehension of the neuropsychiatric disease (Greicius et al., 2007; Greicius, 2008), as well as the influence of aging in cognitive function (Damoiseaux et al., 2008). The study of specific populations, as ID population, assumes that limitations in different areas result in similar functional abnormalities in brain signal (Reiss et al., 2000).
In this sense, neuroimaging studies have been published over the last three decades (Azuma et al., 2009, 2015; Bernardino et al., 2014) in ID field. For instance, Vega and associates (2015) compared the resting-state functional connectivity in three different populations: Down syndrome (DS), Williams syndrome (WS), and healthy controls. Their findings suggest that differences in brain connectivity can be found within neurodevelopmental populations with ID compared with controls.
In general, sample sizes in these types of studies are tiny, and therefore, the effects found in the different studies are often low and inconsistent (Button et al., 2013). Consequently, researchers are driven into different methodologies as thresholding and analysis that may increase the type I errors (Eklund et al., 2016). In addition, these single imaging studies do not assemble the whole concept of ID, they are about a specific ID population, and they aim to find a specific pattern of the concrete ID population (Azuma et al., 2009, 2015; Bernardino et al., 2014).
Therefore, the neural correlates of ID persist unknown. In the field of neuroimaging, we can only find few meta-analyses that describe a single population with ID focused only on 22q11.2 deletion syndrome (22q11 DS; Scarpazza et al., 2019) or WS (Binelli et al., 2014).
From our perspective, some explanations justify why there is no meta-analysis found in fMRI with ID. First, problems that take place when using fMRI register may be exacerbated for the ID population (Carbó-Carreté et al., 2020). For instance, regarding the DS population, movements during registration can be highly increased. Consequently, experimental issues can arise (Pujol et al., 2014). In ID population, it can be a challenging task to be quiet and stay focused during the registration (Lightbody and Reiss, 2009).
Nevertheless, with considerable training and instruction for the scan (Fassbender et al., 2017), movements can be reduced. Therefore, in the last few years, some researchers have achieved the study of brain signal in the ID population. Second, it is not easy to sample this population (Carbó-Carreté et al., 2020), and people with more common disabilities will probably be more represented than people with more rare disabilities.
To date, it is therefore unclear if common aberrant connectivity patterns associated with ID can be found (Walter et al., 2009).
In this sense, as it has been mentioned above, the findings of Vega and colleagues (2015) show an altered between-network connectivity common in WS and DS. They suggest that this could be characteristic of different disorders coursing with ID. Their findings highlight the utility of using a task-based procedure, a noninvasive technique that measures brain activity while participants perform different types of tasks (e.g., executive functions, language, memory, motor, among others). This technique could help resolve the association between brain function and intellectual functioning across different disorders coursing with ID (Vega et al., 2015).
Therefore, based on previous literature, this article aims to study the different publications in task-fMRI and different ID populations to make a qualitative and quantitative analysis in this field. Previous studies sustain the reason to study task-fMRI designs such as the one of Vega and associates (2015), outlining this procedure's utility. We hope to find a pattern in different brain abnormalities with ID compared with healthy controls. Moreover, to guarantee solid and valid results, additional heterogeneity and jackknife sensitivity analysis were estimated. In this study, Seed-based d mapping (SDM) was used. It is a meta-analysis tool for neuroimaging data that has proved high levels of validity and consistency (Iwabuchi et al., 2015; Li et al., 2019; Radua and Mataix-Cols, 2009; Radua et al., 2012; Sheng et al., 2015).
Methods
Inclusion of studies
Following PRISMA guidelines, an extensive review was performed to identify studies published from January 2009 until September 3, 2020. Also, the search, the inclusion criteria, and the article selection were made by three independent investigators and there was a complete agreement between them for the study search and selection. The search was carried out in PubMed and Web of Science (WoS) databases, and the Boolean algorithm with the keywords used is presented in the Supplementary Appendix SA1. This Boolean algorithm was created based on a systematic search conducted on the six principal journals of ID. The more frequent diseases coursing with ID were included in the search.
Moreover, all the meta-analyses published in the last 5 years in those journals were revised to find the best Boolean algorithm. However, autism spectrum disorder was excluded because there is a significant variability in this population's characteristics, and ID is not the principal one. We consider that this population deserves a unique study for its characteristics. Moreover, it is still discussed the presence of ID (Thurm et al., 2019).
The inclusion criteria for the studies were as follows: (1) functional MRI scan was conducted with a specific task during the register, (2) functional activation in the brain was compared between ID persons and the control group without ID, and (3) only studies that report the specific whole-brain coordinates in Talairach or Montreal Neurological Institute (MNI) spaces were included. The selection process is shown in Figure 1.

Flowchart of the meta-analysis search conducted.
The literature review yielded 775 studies found in the WoS database and 84 studies in the PubMed database. One hundred seventy-six records were removed due to duplication in both databases. Six hundred forty-seven studies were excluded after title/abstract screening because they did not accomplish the inclusion criteria.
After this process, only 35 articles remained. However, after the full-text screening, 9 articles were excluded because they did not inform about the peak's activation coordinates, 5 articles were excluded because they did not analyze the whole brain, 6 studies did not compare groups or did not have a second-level analysis, 2 articles were excluded because the participants did not have ID, 1 article was excluded because it was not an original research,1 record was excluded because it was resting-state fMRI and no task was performed. Finally, 1 article was excluded because it had no control group. Only 10 studies matching our inclusion criteria were included and are marked with an * in the reference list.
Voxel-wise meta-analysis
SDM software was used to estimate the differences between the ID population and control people without ID. The procedure and methods of the tool have been described elsewhere (Iwabuchi et al., 2015; Li et al., 2019; Radua and Mataix-Cols, 2009; Radua et al., 2012; Sheng et al., 2015). The SDM uses the peak coordinates found in every included article to reproduce an effect size map of the differences between ID and controls.
First, the areas that were statistically significant differentiating between ID and controls were reported. All the included studies must have the same thresholding at the whole-brain level to assure possible future comparison. Second, the coordinates previously reported were established with a standard MNI map of the group difference effect size based on their peak t value through a non-normalized Gaussian kernel to the voxels near the peak. This procedure assigns larger values to the voxels nearby peaks. By trying to avoid voxels from appearing both positive and negative simultaneously, the same map was used to represent the positive and negative coordinates (Radua and Mataix-Cols, 2009). The aforementioned positive coordinates imply increased brain activation, whereas the negative coordinates estimate the decreased brain activation.
Considering the sample size, the variance of each study, and the between-study heterogeneity, the mean map was estimated. Finally, a usual p-value of 0.05 was used as a threshold with an additional peak height of z = 127.
Furthermore, we performed a descriptive analysis according to the ID sample and the fMRI tasks of the included studies. Concretely, after the calculation of the cohen's d and the confidence intervals (CIs), a descriptive analysis of every article's results was resumed in different images and tables to clarify the results obtained in every included study, separately by the type of task and by the type of ID. We pretend, with this description, to summarize and report the different results distinguishing by ID type and task type.
To validate and test the replicability of the results, a jackknife sensitivity analysis was performed. This analysis systematically excludes one study of the data set and establishes whether the results remained significant.
Quality assessment
A 10-point checklist based on previous meta-analyses (Chen et al., 2015; Du et al., 2014; Shepherd et al., 2012) was used to assess the quality of the included studies through an evaluation of the imaging-specific methodology and some demographic and clinical areas of the included studies. The quality assessment is shown in Supplementary Appendix SA2. Two authors reviewed the included articles and independently determined a complete rating. An 80% rate agreement was found between both investigators in the quality assessment. In those articles where different scores were obtained, an agreement score was obtained after discussing the two different scores.
Some variables at this point were coded for each chosen study to make the quality assessment and to be able to study the possible heterogeneity. Type of population, sample size in each group, % of women, and mean age are some variables codified in Table 1. Moreover, the quality assessment is also found in Table 1.
Demographic and Clinical Characteristics of the Participants in the 10-Neuroimaging Data Included in This Meta-analysis
n, sample size of every group.
22q11DS, 22q11.2 deletion syndrome; DS, Down syndrome; FPMT, full picture matching test; FXS, fragile-X syndrome; ID, intellectual disability; MRI, magnetic resonance imaging; PWS, Prader–Willi syndrome; T-HVOT, two choice revised version of Hooper visual organization test; WBS, Williams–Beuren syndrome; WS, Williams syndrome.
Results
Studies included in the meta-analysis
In Table 1, the different characteristics of the studies are shown. Four studies had 22q11 DS population; two studies had Prader–Willi syndrome, one DS, one WS, one fragile-X syndrome, and finally, one Williams–Beuren syndrome. All these disorders course with ID. Regarding the tasks conducted in the resonator, these were classified in visual, audition, language perception, and executive function tasks. The specific task in every experiment is found in Table 1. As shown in the same table, some studies had different tasks that included different regions. In this case, the study was separated to analyze the coordinates separately. In Table 1, we can also find the imaging modality used in every study, and in addition, we can see the sample size of every sample. Finally, in the last column, we can see the quality assessment made by two investigators separately.
Qualitative study
As mentioned above, to our knowledge, it is the first time that a meta-analysis is done using different types of ID. Therefore, we first analyze all the articles' results and then expose the meta-analysis results.
Table 2 shows the principal results obtained in the first step of the program. In this sense, for each study, both the smallest and higher possible effect size of each voxel are estimated, fixing a lower and upper bound of the possible effect sizes (Albajes-Eizagirre et al., 2009).
Peak Coordinates Obtained in the Different Studies Included in the Meta-analysis
Max, maximum peak; Min, minimum peak.
Figures 2–5 were visualized with the BrainNet Viewer (Xia et al., 2013). Figure 2 represents the different positive and negative coordinates of the results in every article after the first analysis made with SDM. Moreover, the size of every node is proportioned to Cohen's d calculated through the meta-analysis, and so, the bigger the node is, the more total the effect. More concretely, Table 3 shows the same results classified by type of ID. Figure 3 represents the different peak coordinates separating by type of ID. Another time, the node's size is proportioned to Cohen's d.
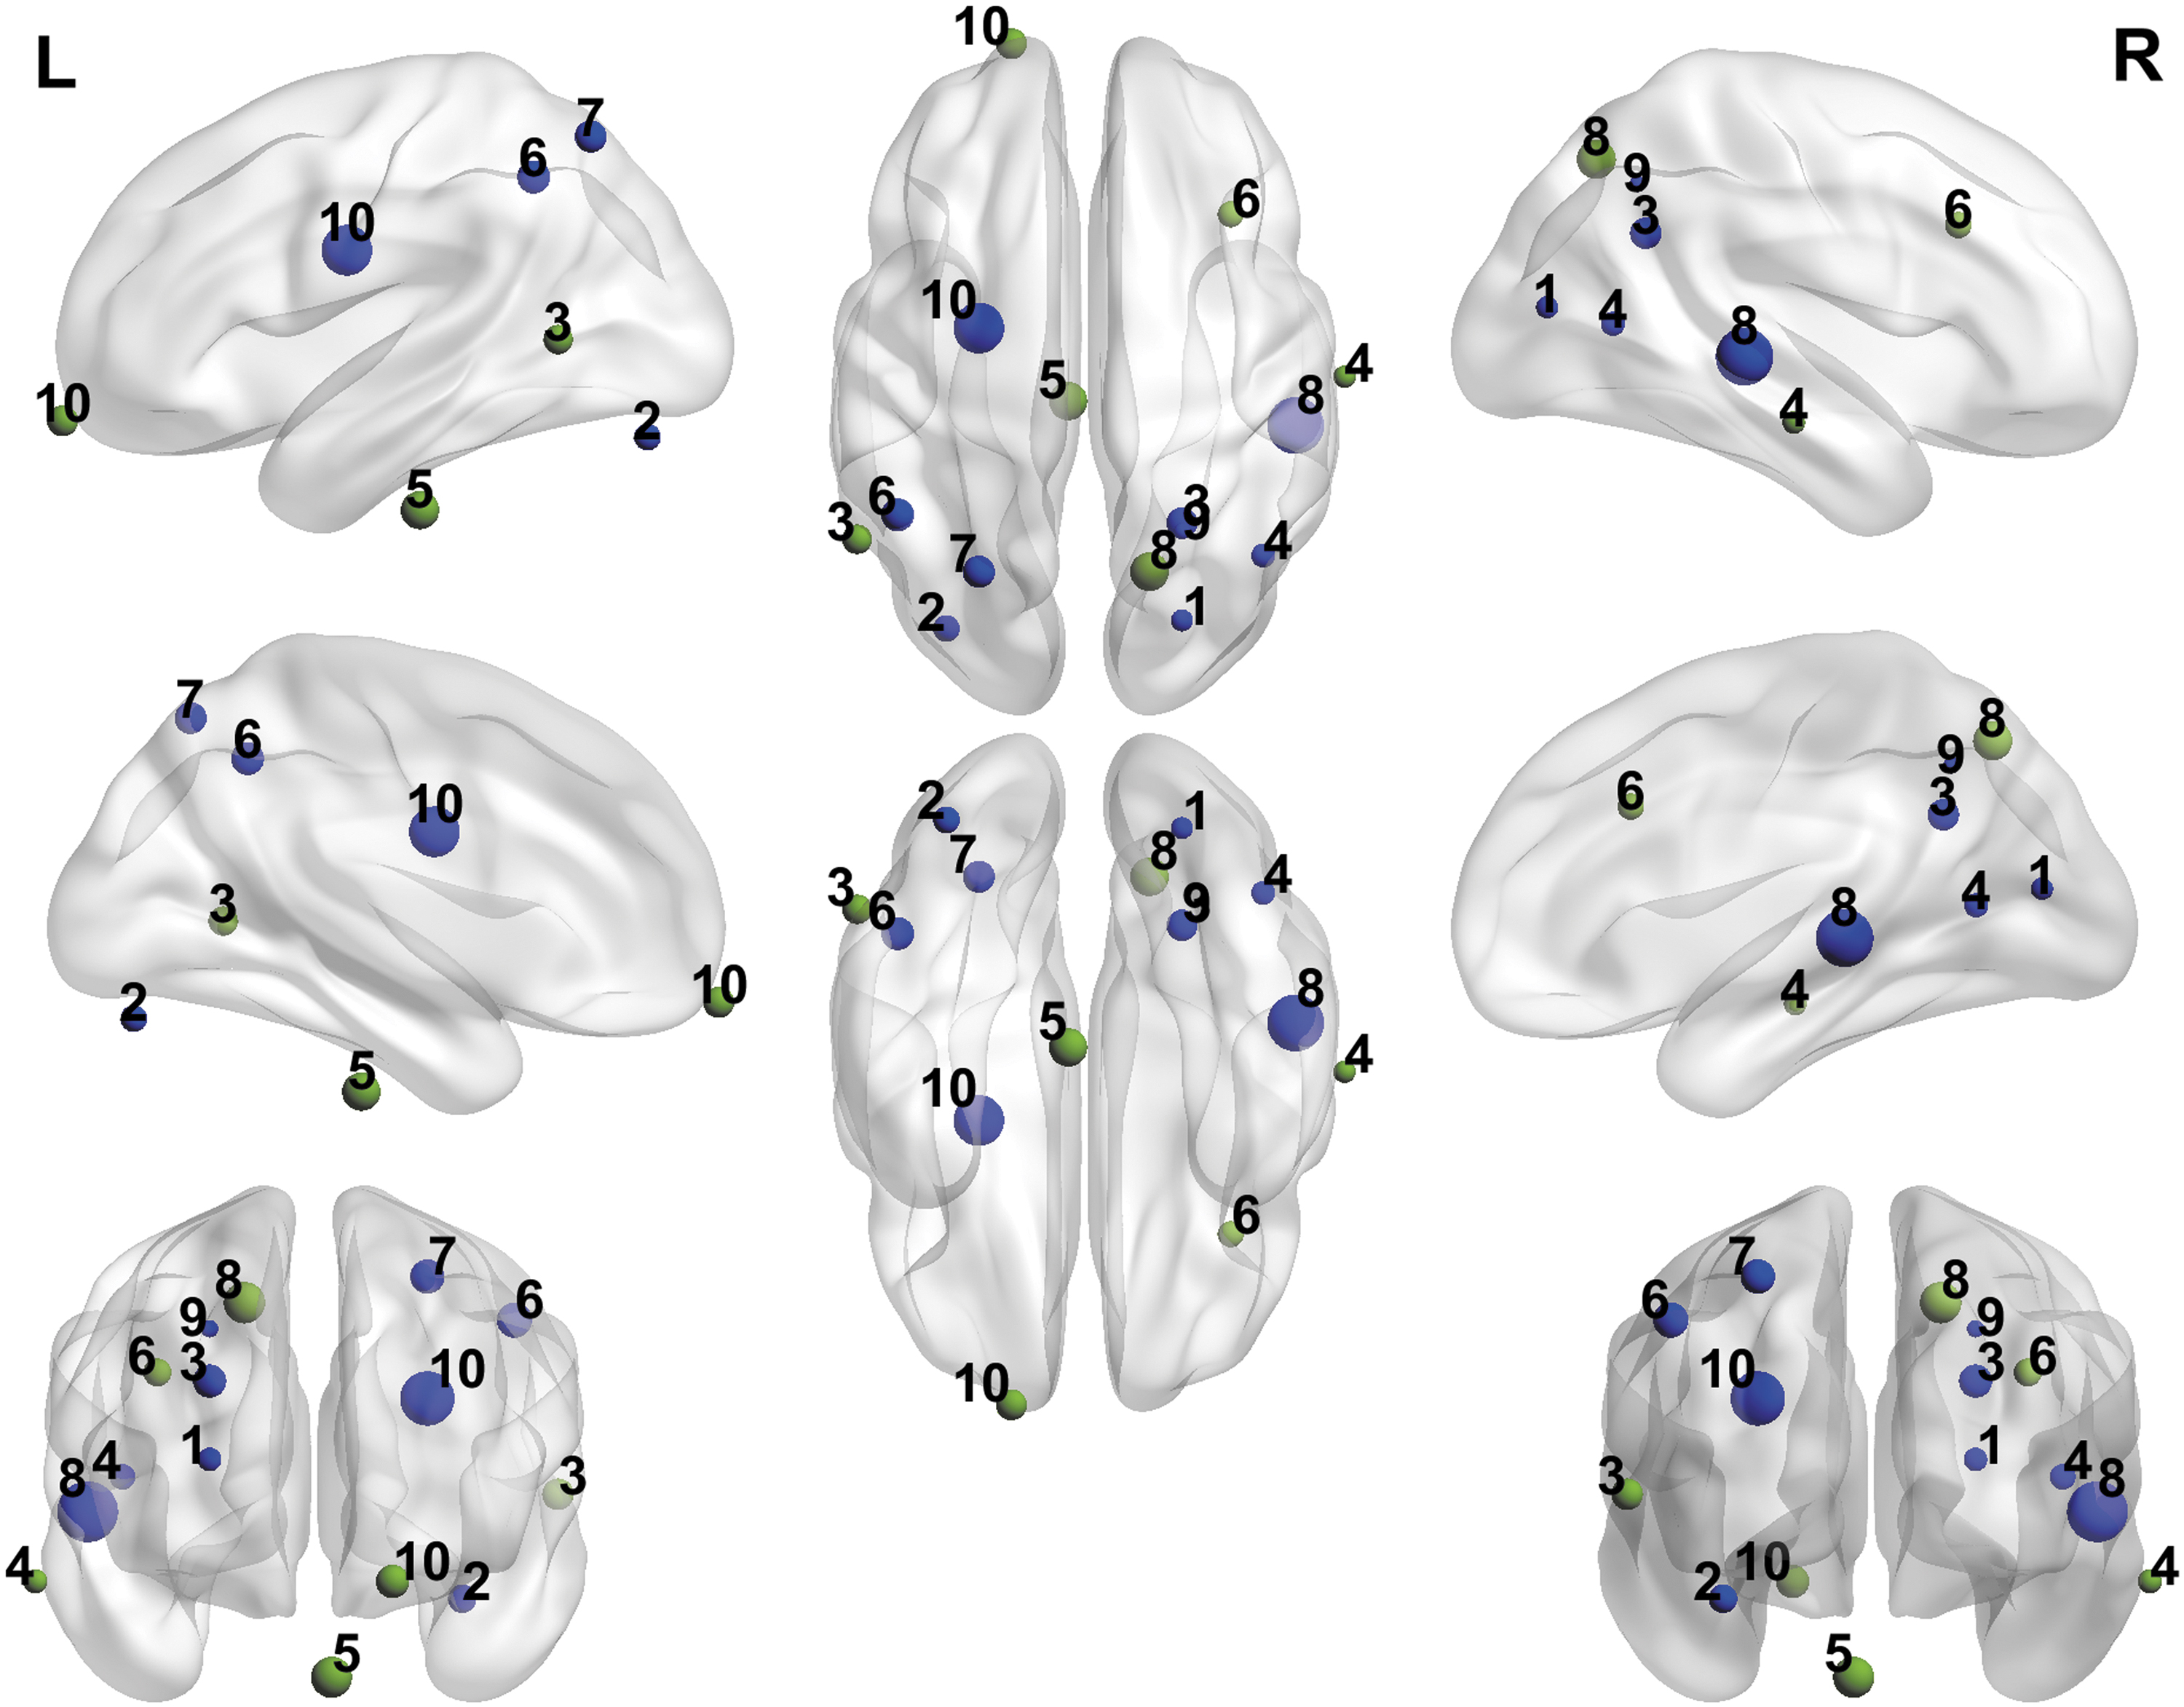
Representation of the positive and negative peak coordinates obtained in the different studies included in the meta-analysis. The size of every node is proportioned to the Cohen's d calculated through the meta-analysis. Blue color represents the positive peaks and green color represents the negative peaks. 1: Azuma et al. (2009); 2: Azuma et al. (2015); 3: Bernardino et al. (2014); 4: Binelli et al. (2016); 5: Hall et al. (2009); 6: Montojo et al. (2013); 7: Montojo et al. (2014); 8: Reynolds Losin et al. (2009); 9: Wan et al. (2017);10: Woodcock et al. (2010).
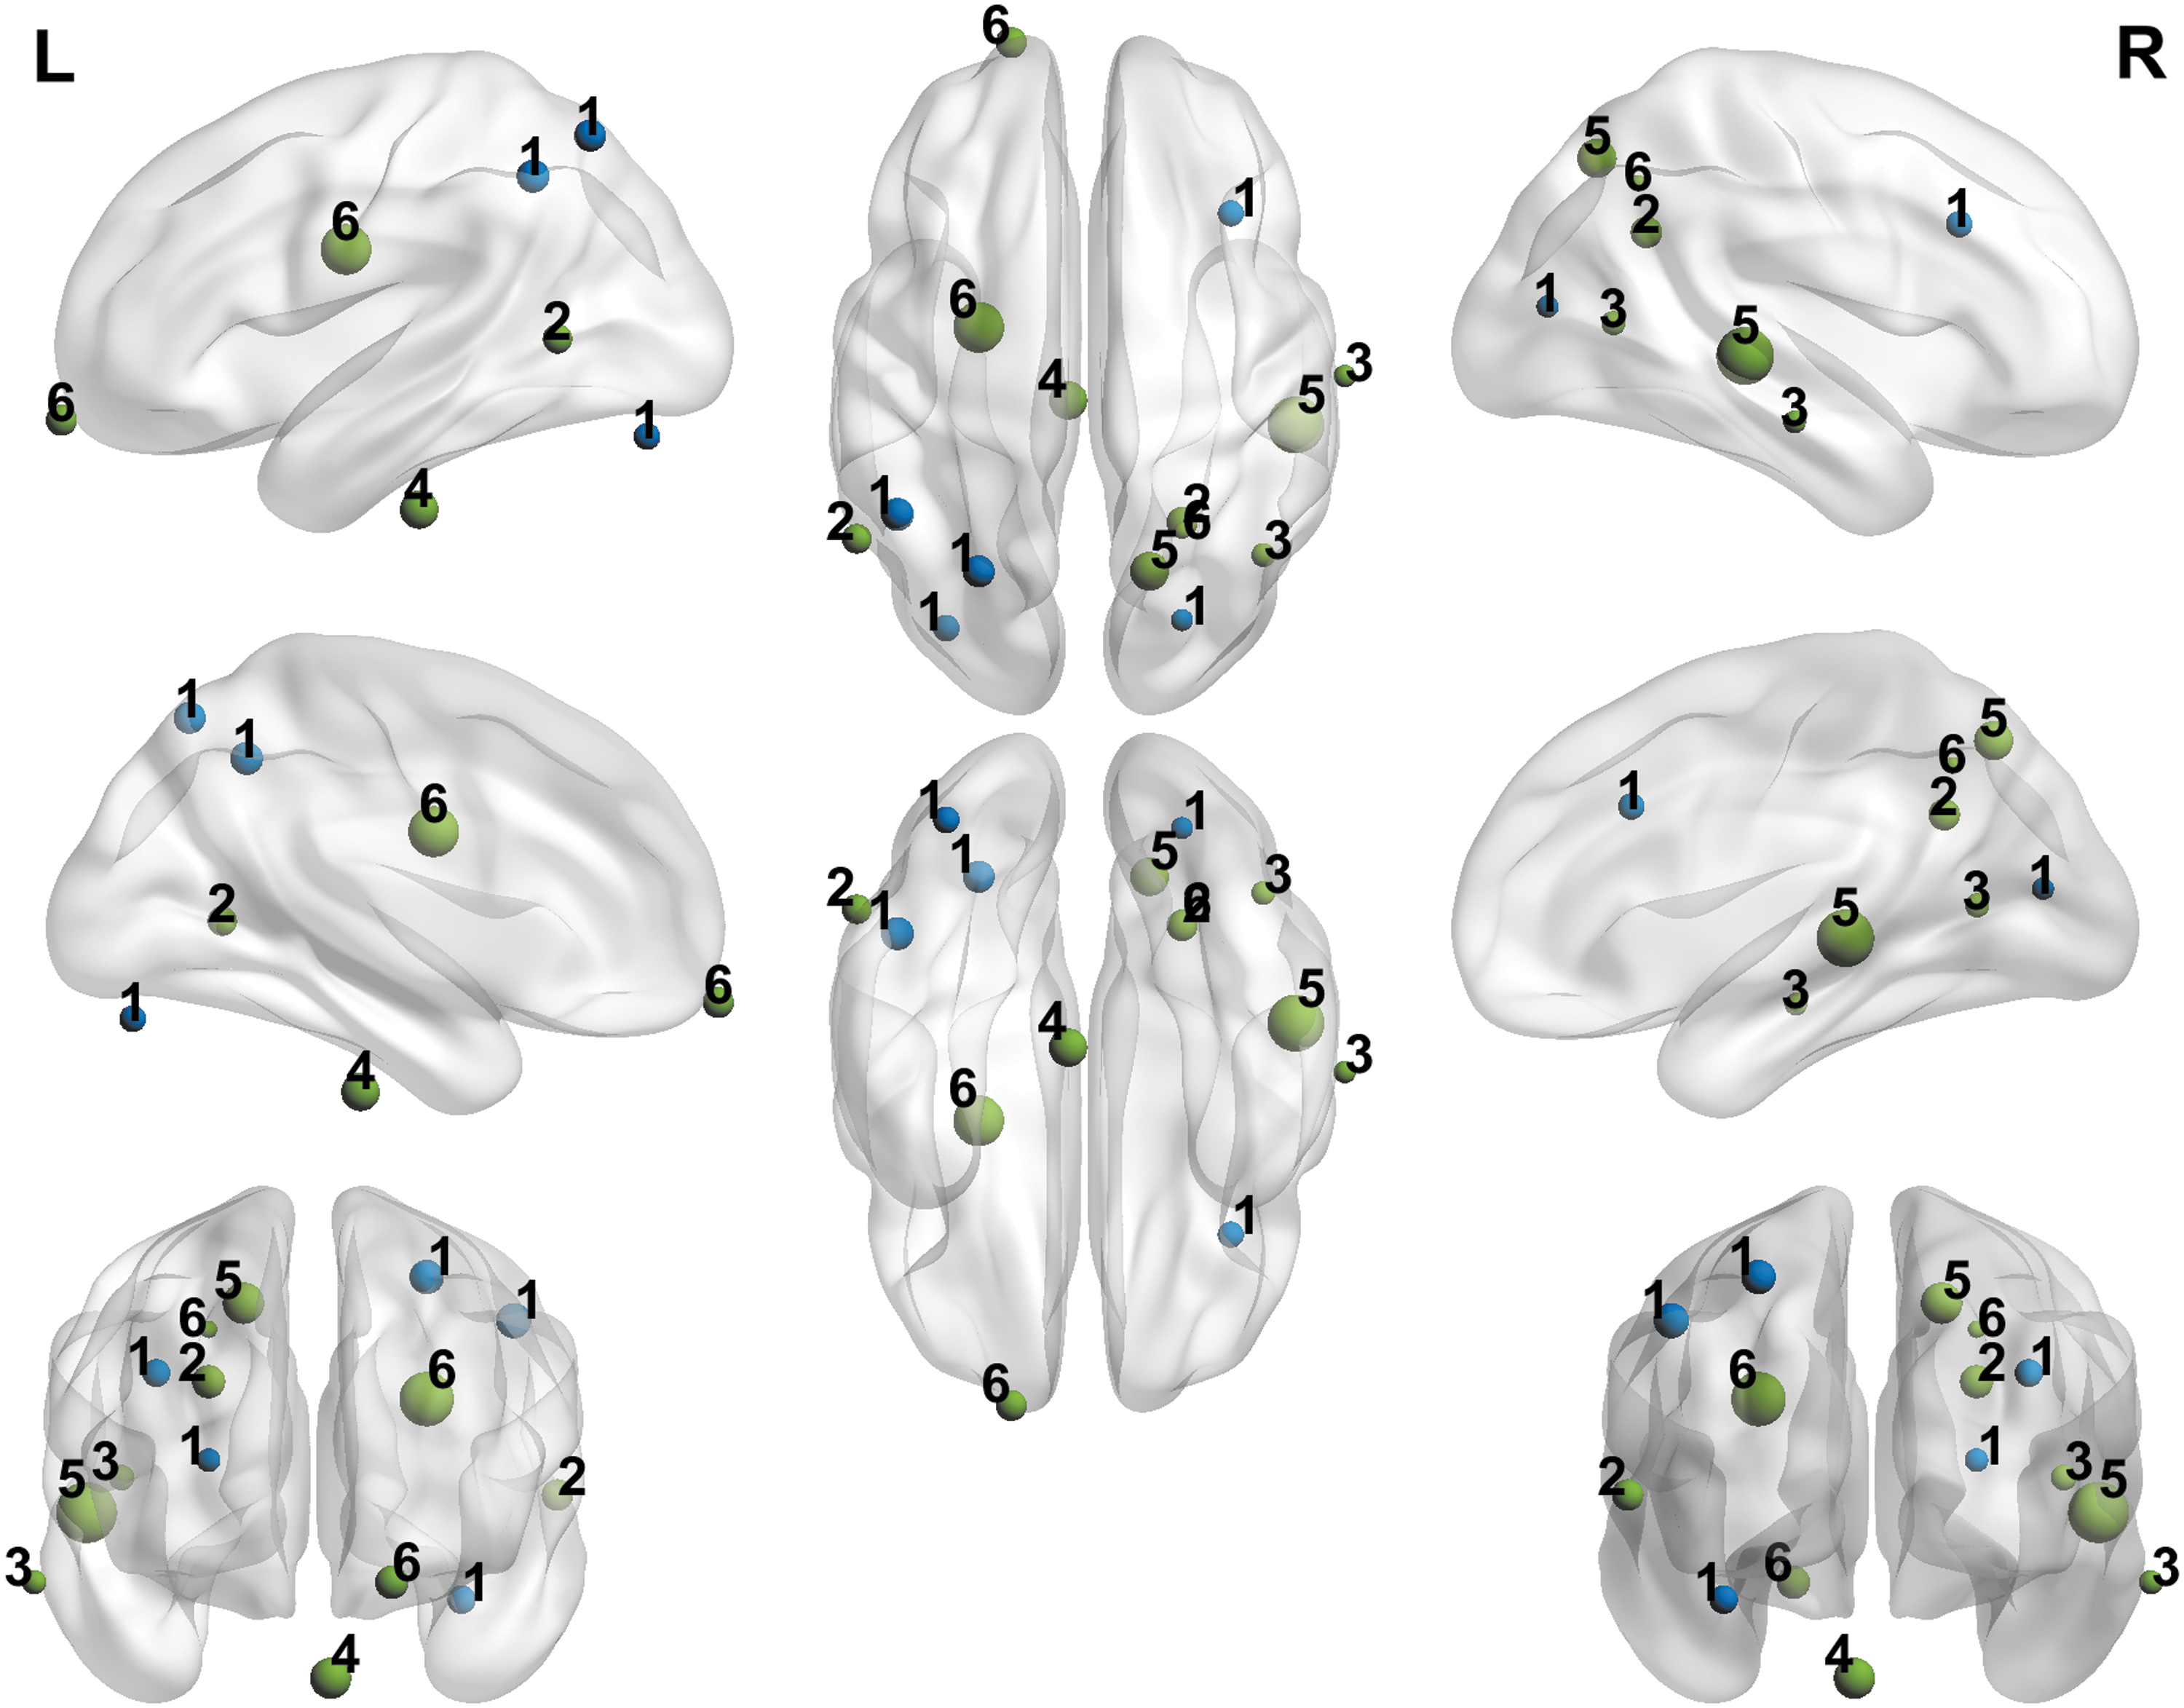
Representation of the coordinates obtained in the different studies included in the meta-analysis classified by the different types of ID. The size of every node is proportioned to the Cohen's d calculated through the meta-analysis. Blue color represents the positive peaks and green color represents the negative peaks. 1: 22q11DS; 2: Williams syndrome; 3: Williams–Beuren syndrome; 4: fragile-X-syndrome; 5: Down syndrome; 6: Prader–Willis syndrome. 22q11DS, 22q11.2 deletion syndrome; ID, intellectual disability.
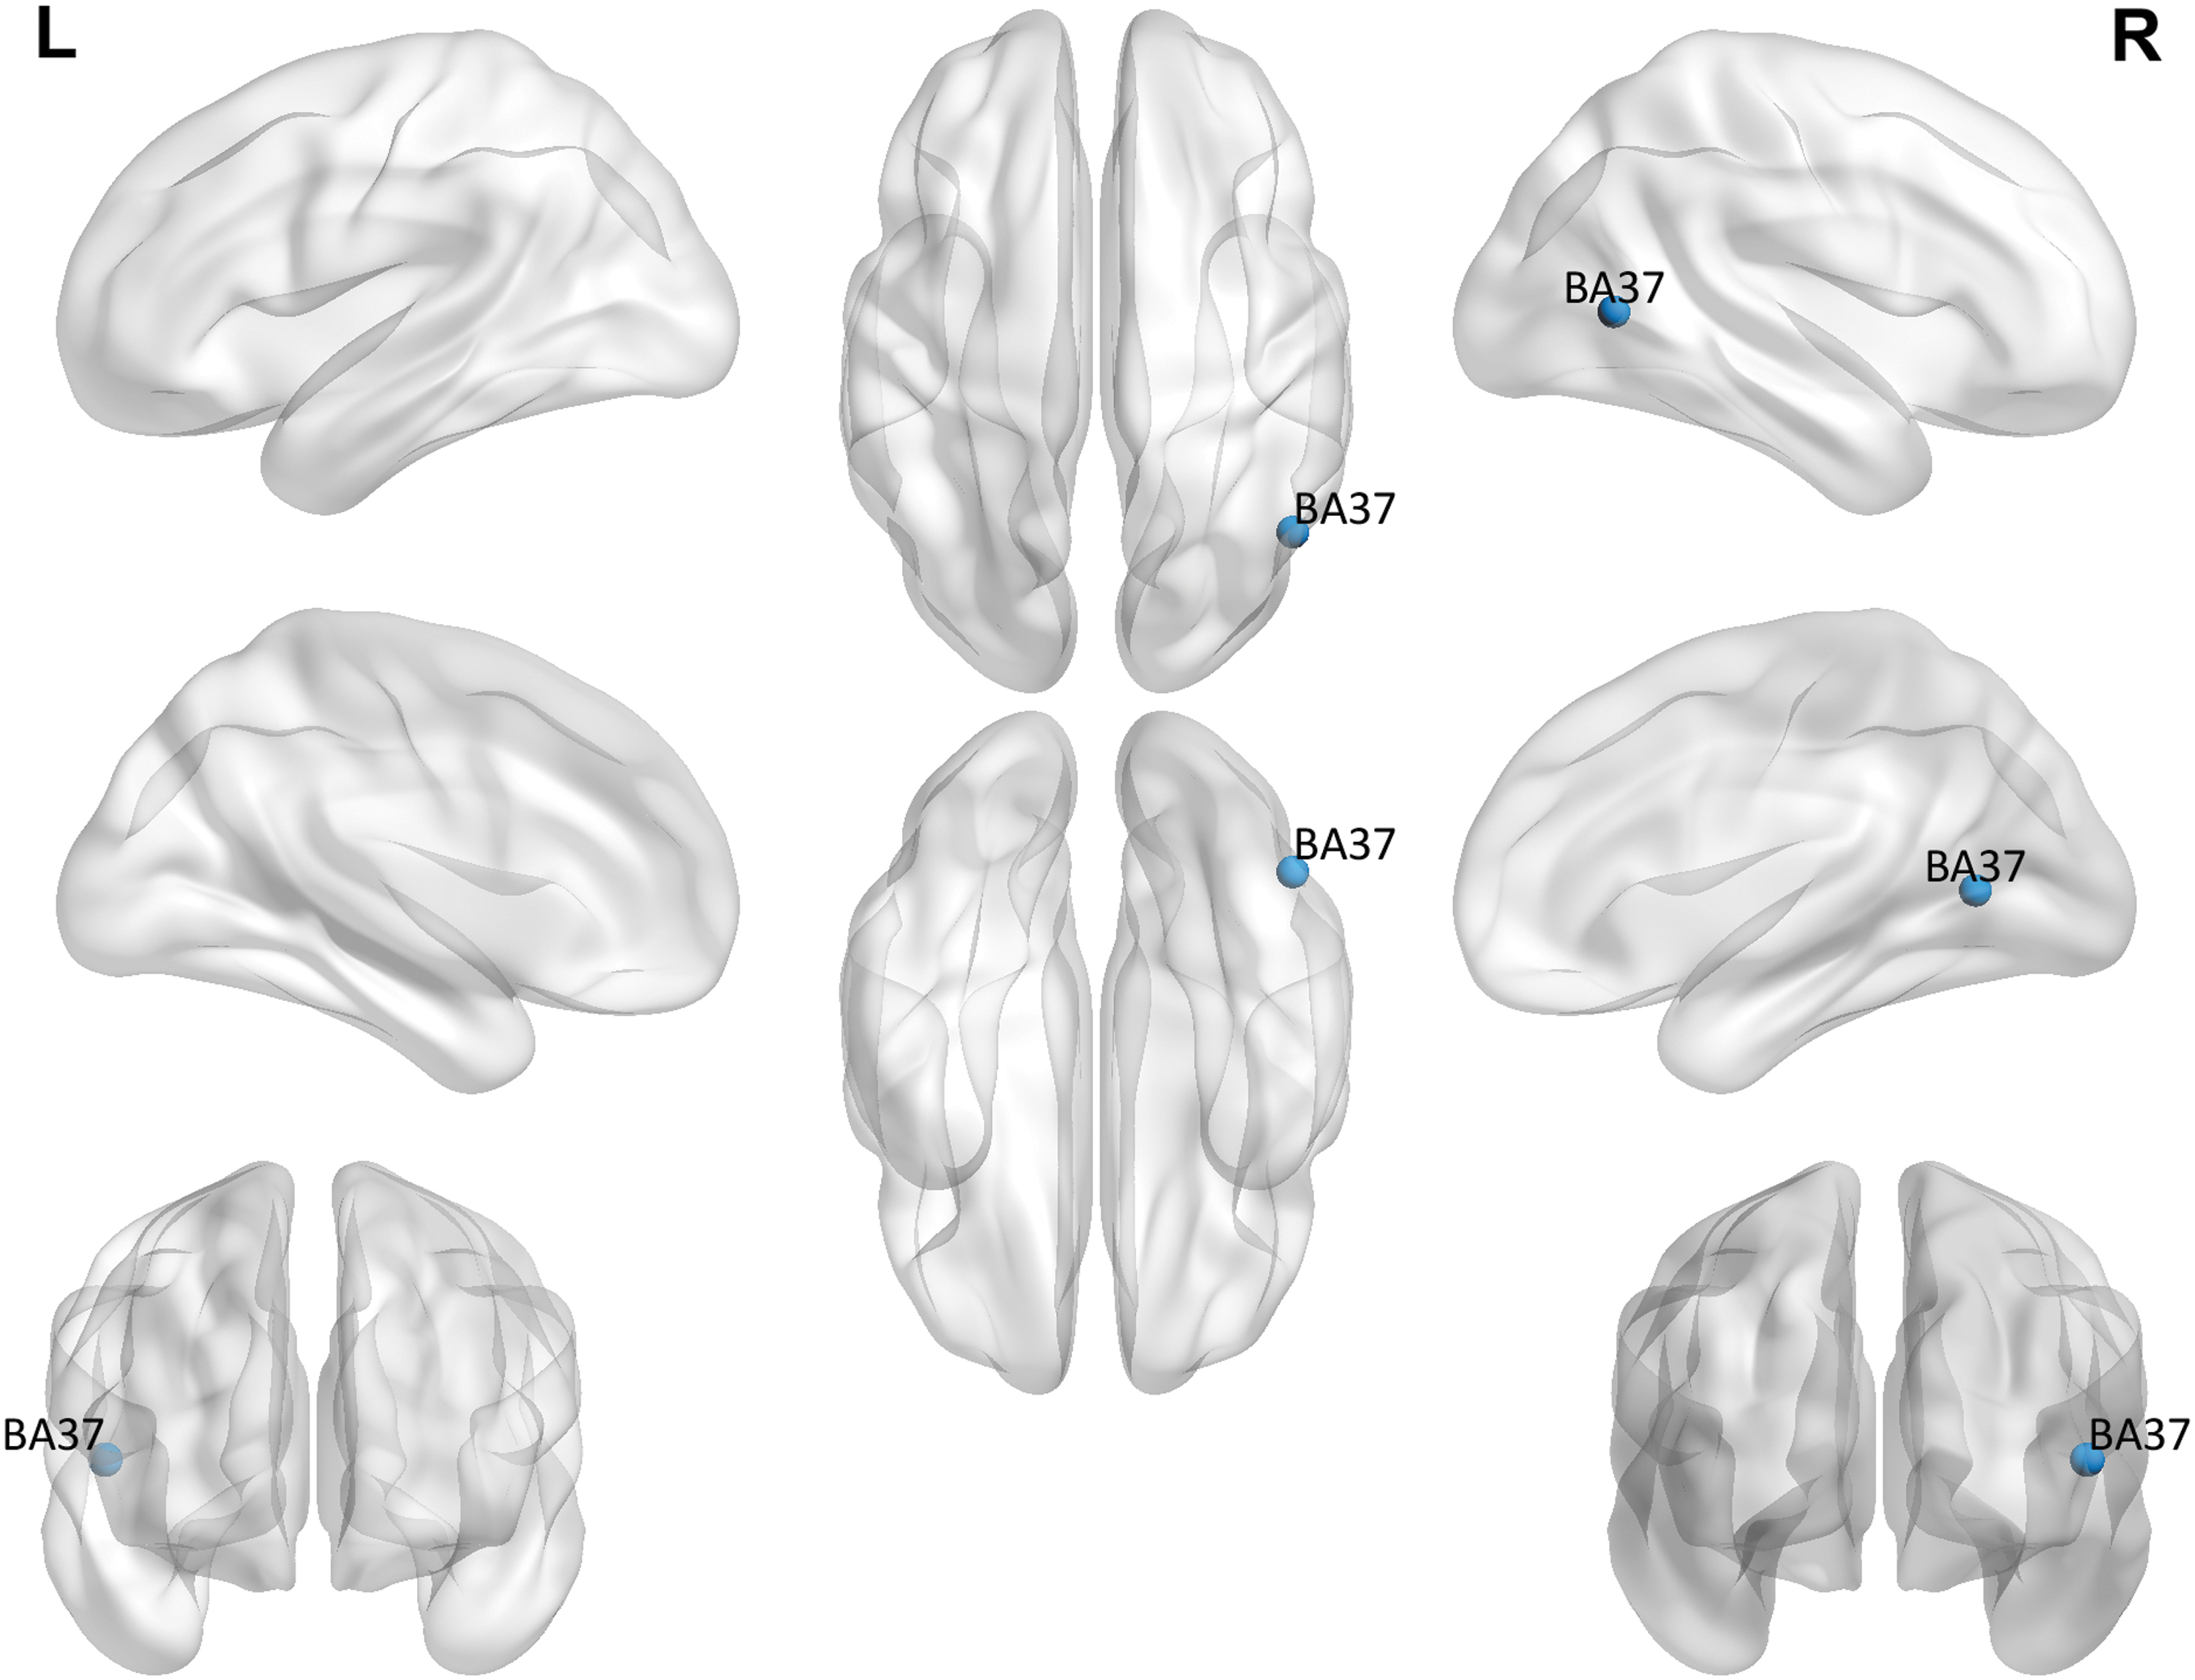
Representation of the differences in brain activation between ID patients and controls in the meta-analysis.
Peak Coordinates Classified by Intellectual Disability Type
We can see that the activated areas in 22q11 DS syndrome in front of controls were both the right inferior and middle frontal gyrus. The deactivation areas of 22q11 DS syndrome in front of controls were right occipital precuneus, left cerebellum, left occipital cortex, angular gyrus, supramarginal gyrus, superior parietal lobe, and intraparietal sulcus. In the case of Prader–Willi, the more activated areas were inferior and the anterior frontal pole right compared with controls, and the more deactivated areas were right precuneus and middle frontal gyrus. Finally, in the same way, Table 4 shows the peak coordinates classified by type of tasks. Figure 4 shows the results regarding the type of tasks used following the classification in Table 1.
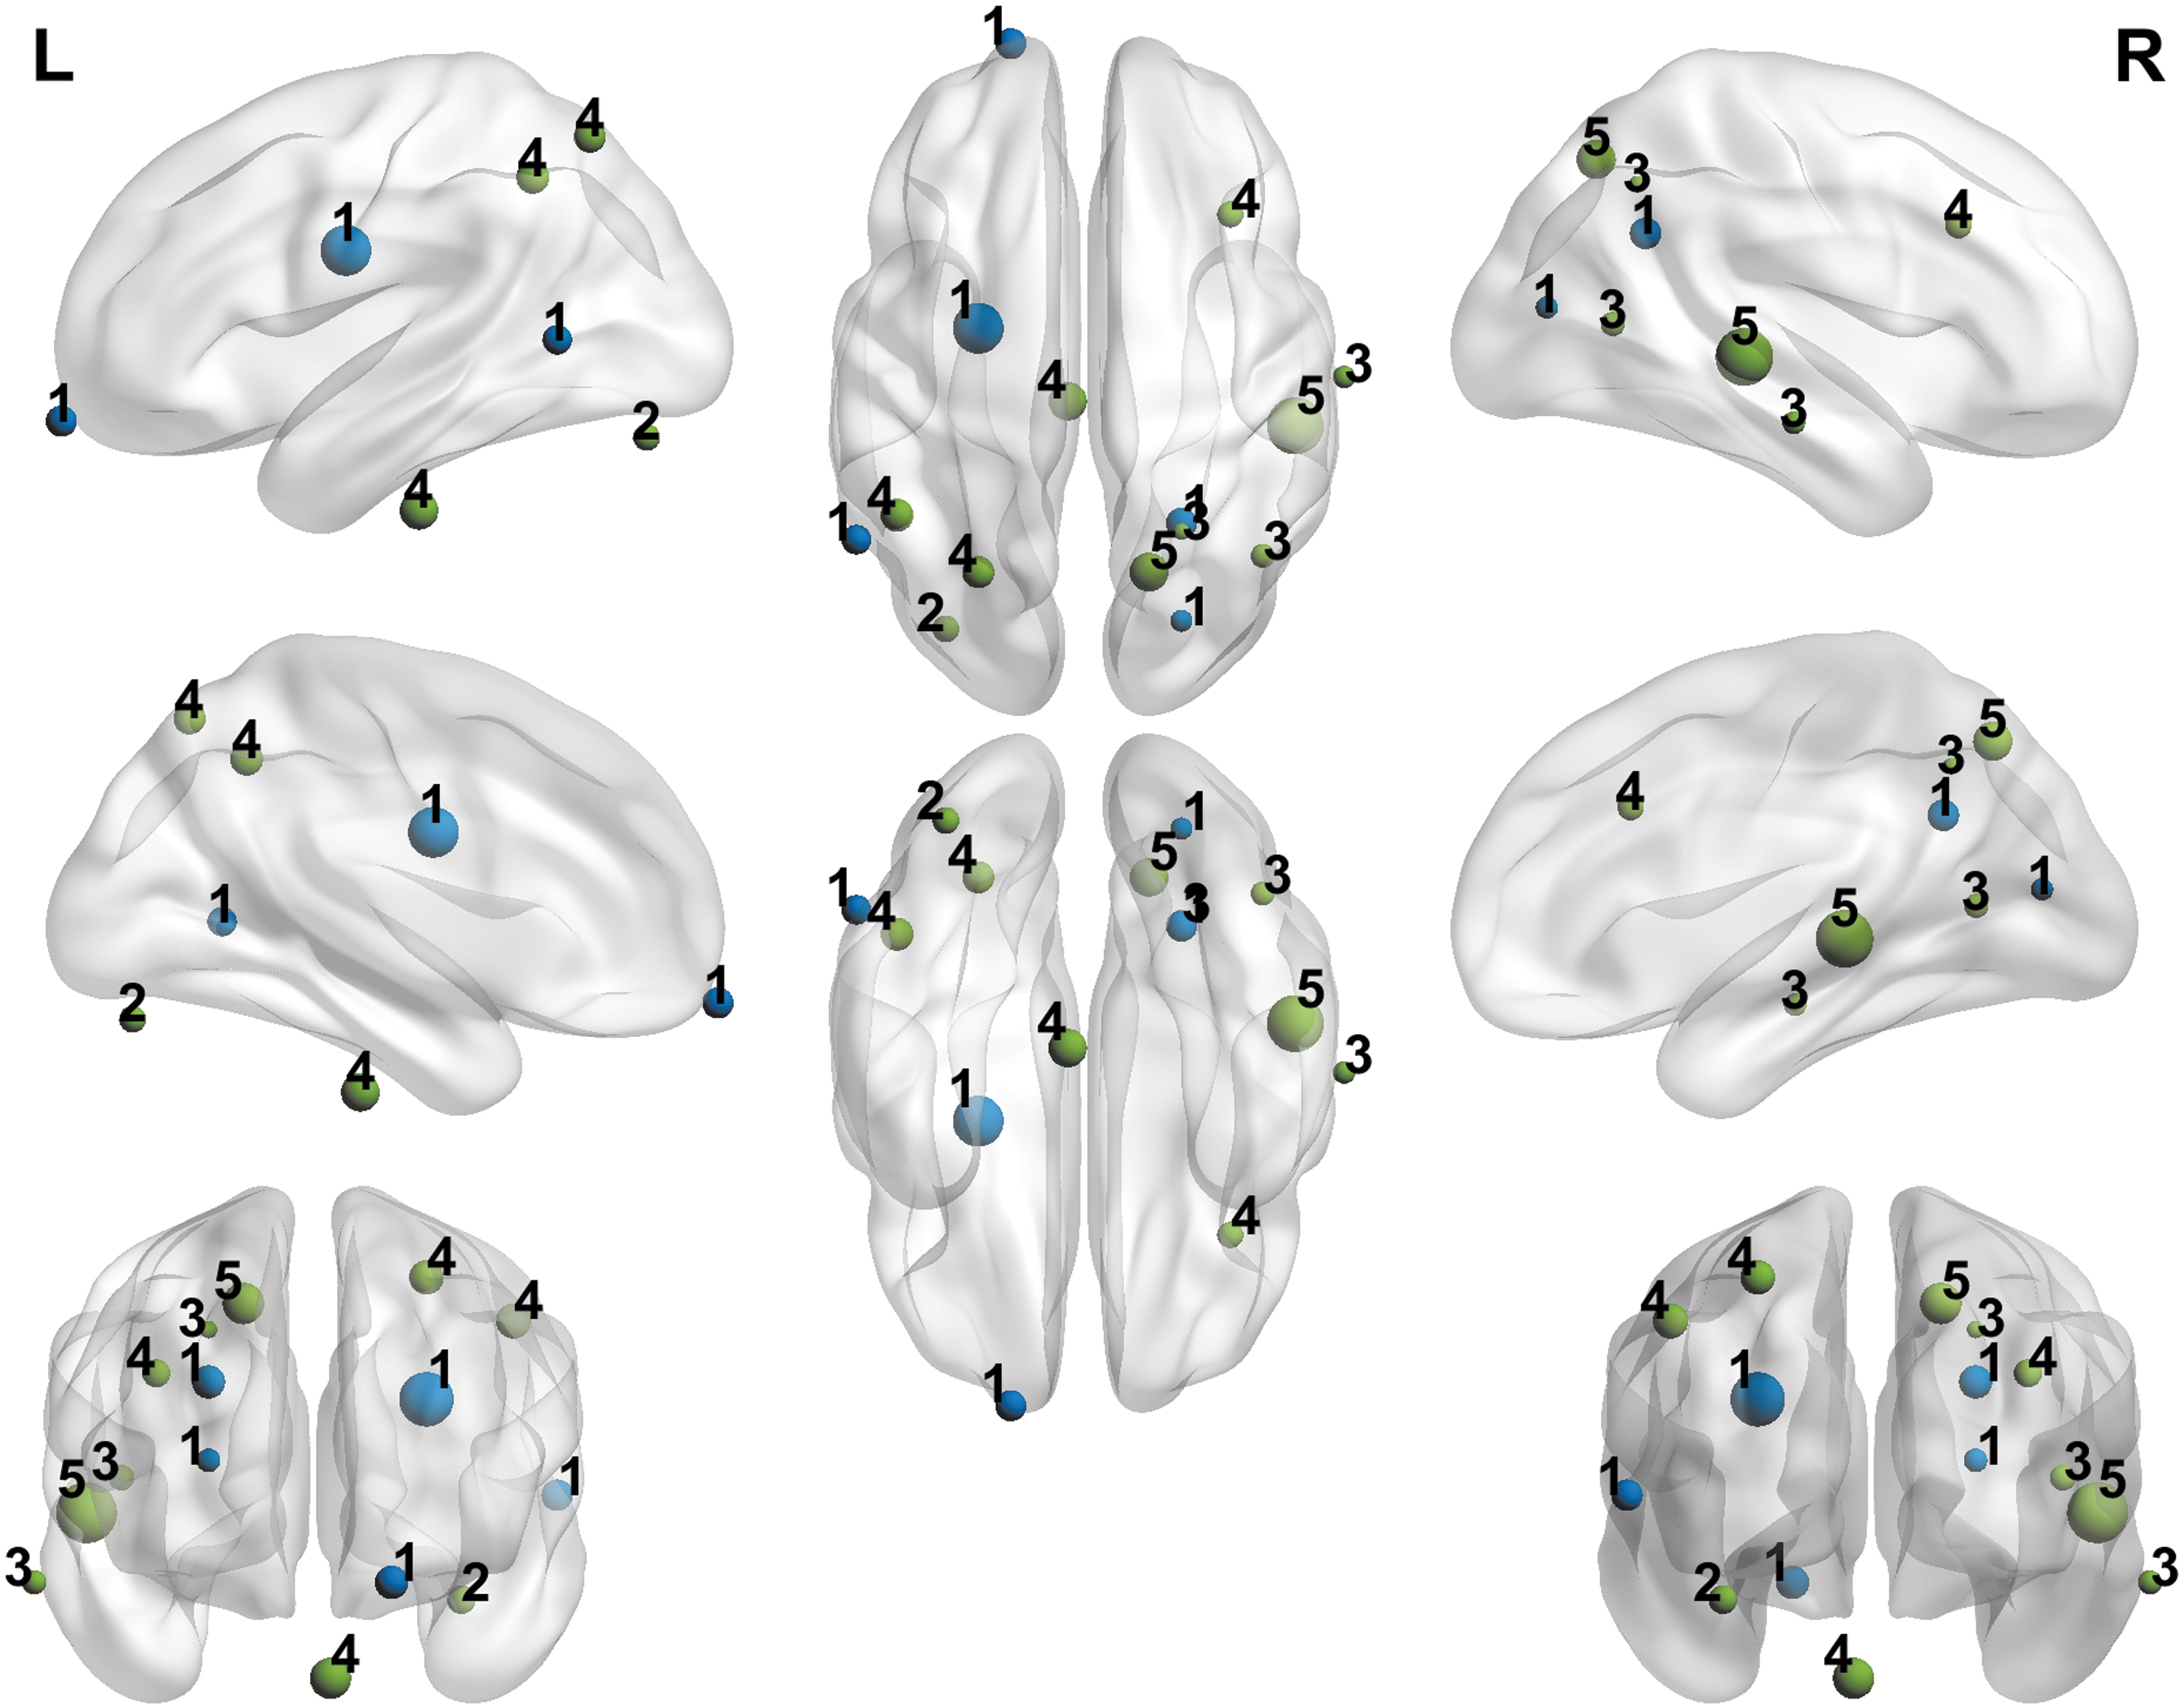
Representation of the coordinates obtained in the different studies included in the meta-analysis classified by the different tasks used in the different studies. The size of every node is proportioned to the Cohen's d calculated through the meta-analysis. Blue color represents the positive peaks and green color represents the negative peaks. 1: Visual perception and executive functions; 2: emotion recognition and visual perception; 3: visual perception; 4: auditive perception; 5: executive functions; 6: language, auditive, and visual perception.
Peak Coordinates Classified by Type of Task Used in the Different Studies
Compared with controls, people with ID in visual perception and executive function tasks demonstrated increased brain activation in left middle temporal gyrus and inferior anterior frontal pole right. However, they showed decreased activation compared with controls in occipital precuneus right, caudal intraparietal sulcus of the right hemisphere, and middle frontal gyrus. In visual perception tasks, people with ID appeared to have higher activation in the right middle temporal gyrus and lower activation in the right lateral occipital area and right precuneus. Concerning executive functions tasks, people with ID displayed a higher activation in the right inferior/middle frontal gyrus and decreased activation in left occipital cortex, angular gyrus, supramarginal gyrus, superior parietal lobe, and intraparietal sulcus.
Meta-analysis result
In Supplementary Appendix SA3, the forest plot of the studies with their effect size, low CI, and high CI is shown. As we can see, the more significant effects are found in the study of Woodcock and colleagues (2010), and as in all articles CI 0 is not included, there are significant effects in all the studies.
In the meta-analysis, people with ID did not show any increased brain activation compared with controls. However, people with ID showed decreased activation in right temporal gyrus, concretely, in the right middle temporal gyrus, in Brodmann area (BA) 37, compared with controls. Two clusters were found in this same area, one of two voxels and one of four voxels. The results are shown in Table 5. Moreover, in Figure 5, we can see the represented areas of the study.
Differences of Brain Activation Between Intellectual Disability Patients and Controls in the Main Meta-analysis
BA, Brodmann area; MNI coordinates, Montreal Neurological Institut; SDM, Seed-based d mapping.
To determine the possible heterogeneity across studies, Q and I 2 statistics were calculated. The results are shown in Supplementary Appendix SA4. In positive and negative peaks, nonsignificant Q statistics were found, and so, the results demonstrate that the variability is due to random variation rather than study heterogeneity. Due to the nonexistence of heterogeneity in the effect sizes, it is unnecessary to study the possible moderate variable effects. Therefore, it was decided not to conduct a meta-regression with external variables.
Reliability analysis
The jackknife sensitivity analysis (Supplementary Appendix SA5) reported that the right middle temporal gyrus (with coordinates in 48, −62, 69, and BA 37) was replicable in all 16 data sets. However, the same right middle temporal gyrus in different coordinates (46, −66, 6, and BA 37) was replicable in 14 data sets. This reveals a significant reliability of the results reported in this study.
Discussion
This study aimed to identify brain abnormalities mainly associated with ID. To the best of our knowledge, it is the first meta-analysis exploring differences in brain activation between people with ID and control subjects. In this sense, it is important to highlight that although our aim and our search were centered on all types of ID, our search concludes that only studies with fMRI in different genetical syndromes associated with ID exist. The inclusion of genetic syndromes only could be because of the facility identifying the genetic syndromes and increasing the possibilities to control the different variables. The studies in fMRI with this population are very recent, and we hope that more studies with different types of ID are published in some years.
Regarding the qualitative part of the study, there are common patterns regarding the type of ID and the type of task that are important to highlight.
About the type of ID, in 22q11 DS, we can find an overall deactivation in different areas of the left occipital cortex and lobule, as well as of the superior parietal lobule. This is congruent with some abnormalities in the thickness of the occipital cortex found in this population in a group with psychosis (Sun et al., 2020). In the case of Prader–Willi syndrome, we can find a deactivation in comparison with the control population near the insula in both hemispheres.
Regarding the type of task used in the study, in visual perception and executive functions, deactivation in the occipital and parietal areas, left and right, was found. These areas have been identified as necessary in visual perception (Kaas et al., 2010). However, there is an activation in ID compared with controls in the middle temporal gyrus and in the frontal pole right. The most interesting result is in executive functions, where we can find a clear common pattern. We can see that there is deactivation in the left occipital cortex, supramarginal gyrus, superior parietal gyrus, and angular gyrus, also congruent with certain studies about executive functions (Fassbender et al., 2017).
Compared with controls, people with ID did not show any increased activation in the quantitative analysis of every study. However, people with ID showed decreased activation in two areas located in the right middle gyrus compared with controls. This area comprised the BAs 21, 22, 37, and 39. In particular, in our case, only the BA number 37 was deactivated in the case of ID population compared with controls. Early functional neuroimaging articles have demonstrated that the middle temporal gyrus is involved in specific cognitive domains (Cabeza and Nyberg, 2000; Laufer et al., 2011; Raposo et al., 2006; Sass et al., 2009), for instance, semantic memory processing or language (Cabeza and Nyberg, 2000; Chao et al., 1999; Tranel et al., 1997). These domains can be associated with 70% of the tasks used in the studies included in the meta-analysis.
In schizophrenia, functional deficits in these cognitive domains, that is, language (Kuperberg et al., 1998), semantic memory (Nestor et al., 1998), and complex visual perception (Tek et al., 2002), have been demonstrated. In the same line, functional deficits, concretely, in the middle temporal gyrus (Chang et al., 2016; Fusar-Poli et al., 2011) have been found in current studies with samples at high risk of psychosis.
In a recent meta-analysis where the aim was to study the differences between 22q11 DS and controls, some regional differences were identified. Specifically, the results reported that the 22q11 DS population has structural and functional abnormalities. In particular, these abnormalities were mainly found within the right precuneus and superior temporal gyrus, bilateral inferior parietal lobe, and posterior cingulate cortex (Scarpazza et al., 2019). This could be congruent with our findings because 40% of our sample has 22q11 DS.
Moreover, two articles were shared between this paper and the meta-analyisis from Scarpazza et al. (2019). In the same line, a recent study (Marshall et al., 2017) conducted with 321 participants identified the 22q11 DS gene as one of the most linked to psychosis (Marshall et al., 2017). Consequently, the middle temporal gyrus and inferior temporal gyrus could be related to the appearance of schizophrenia and therefore may have a relationship with 22q11 DS.
Limitations
This study has several limitations. First, there exists a scarcity of studies in task-fMRI with the ID population. This is probably attributable to the relatively low commonness of this population and, in addition, the difficulties of using a resonator in this particular disease. Therefore, all our studies analyzed consisted of a tiny sample, and also, there are few studies in these meta-analyses. It is important to remark that the available studies do not allow us to draw clear conclusions about brain functional irregularities in ID. We should interpret our results with caution. Therefore, functional connectivity in the ID population remains unexplored.
Second, and due to the limited data, the effects of some variables such as type of ID, type of task used, % of women, or mean age of the participants have not been analyzed due to the low heterogeneity found. Our heterogeneity indexes were very low, and this can be due to the limited sample. Finally, the studies included used different tasks. In general, it is essential to highlight the low heterogeneity in all the included articles of this study. Therefore, we are not able, with these preliminary results, to generalize to the ID population. To address the functional brain abnormalities in this population, more task-fMRI studies are needed, and a task-specific meta-analysis should address this topic more directly.
Conclusions
Previous studies in ID and neuroimaging suggest an altered between-network connectivity that could be common of different disorders involving ID, including DS and WS. Considering the perspective of ID based on the individualized supports and the adaptative behavior, this study aimed to examine if differences in the connectivity pattern exist in this population compared with healthy controls. However, this population faces different problems that complicate the register. This article aims to integrate the last years of knowledge in this field in a meta-analytic review.
Only 10 articles met the inclusion criteria, and all the disabilities were associated with genetical syndromes. Regarding the qualitative part of the study, common patterns of dysconnectivity and connectivity versus controls are found in specific populations such as 22q11 DS and Prader–Willi syndrome. Also, in the type of task, and considering that all the different syndromes are mixed, common patterns were found in executive functions and visual perception.
In conclusion, this meta-analysis revealed changes in brain activation in the right middle temporal gyrus regarding the quantitative part of the study. This area is implicated in cognitive areas, including semantic memory processing and language. These results can be highly influenced by the type of task that has been made in all the studies included in the meta-analysis, including 70% of tasks that would include the domains mentioned before. However, other issues can influence.
For instance, the high percentage of the 22q11 DS population that we have included in the studies (a 40%) could mediate the functional disconnection seen in the right middle temporal gyrus (Scarpazza et al., 2019). This region is linked with schizophrenia and psychosis, and 22q11 DS is at high risk of presenting this pathology (Nestor et al., 1998). Despite the efforts of the present study to provide state-of-the-art on this issue, it was not possible to demonstrate the differences in brain irregularities of the ID population and controls. Indeed, the current results are based on the available literature and do not allow the assumption of differences between the two populations. Clarifying if a pattern underlying the different types of ID exists compared with healthy controls would lead to a better understanding of the ID population.
Data Availability
The data sets generated during and/or analyzed during the current study are available from the corresponding author on reasonable request.
Footnotes
Authors' Contributions
All authors have made substantial contributions to the study, have approved the submitted version, and have agreed both to be personally accountable for the author's own contribution and to ensure that questions related to the accuracy or integrity of any part of the work are appropriately investigated, resolved, and the resolution documented in the literature. Concretely, C.C.-M. and J.G.-O. conceived the study as well as acquired, analyzed, and interpreted the data. M.C.-C. and M.P.-C. substantively revised the work and also interpreted the results.
Authors Disclosure Statement
No competing financial interests exist.
Funding Information
Funders: Ministerio De Ciencia, Innovación Y Universidades, Agencia Estatal De Investigación, Grant No. PGC2018-095829-B-I00.
Supplementary Material
Supplementary Appendix SA1
Supplementary Appendix SA2
Supplementary Appendix SA3
Supplementary Appendix SA4
Supplementary Appendix SA5
References
Supplementary Material
Please find the following supplemental material available below.
For Open Access articles published under a Creative Commons License, all supplemental material carries the same license as the article it is associated with.
For non-Open Access articles published, all supplemental material carries a non-exclusive license, and permission requests for re-use of supplemental material or any part of supplemental material shall be sent directly to the copyright owner as specified in the copyright notice associated with the article.