
Abstract
Background:
Prader–Willi syndrome (PWS) is a genetic syndrome with clinical behavioral phenotypes, including autistic characteristics. However, brain functional connectivity (Fc) remains underreported. This study aimed at investigating alterations in functional network architecture in the cortical and subcortical structures of brains in individuals with PWS.
Methods:
Twelve individuals with PWS (age range: 15–42 years; female 4, male 8), and 14 age- and sex-matched controls with typical development (TD), participated in a 3 Tesla resting-state functional magnetic resonance imaging study. Fc was analyzed: (1) voxel-based group independent component analysis and correlations with Autism-Spectrum Quotient (AQ) scores, (2) seed-based neuroanatomical region of interest (ROI) analysis.
Results:
In individuals with PWS, AQ showed a significant positive correlation with Fc in the right frontal area, and the ROI analysis exhibited enhanced dorsolateral prefrontal Fcs compared with those in TD controls; the frontopolar-parietotemporal Fcs were attenuated.
Discussion:
The observed Fc indicated altered Fc in specific brain regions, which is consistent with the behavioral features in individuals with PWS. The enhanced versus attenuated connectivity in distinct frontal regions may contribute to not only autistic features but also other behavioral characteristics, and it provides a clue for better understanding of the brain–behavior relationship in PWS.
Impact statement
Individuals with Prader–Willi syndrome (PWS) have altered functional connectivity (Fc) in specific brain regions. Notably, distinct frontal regions have either enhanced or attenuated Fc. These alterations may contribute to autistic and behavioral features of those with PWS.
Introduction
Prader–Willi syndrome (PWS) is a genetic syndrome with multisystem involvement and neurodevelopmental and behavioral phenotypes (Holm et al., 1993). It is characterized by neonatal hypotonia, developmental delay, and hyperphagia that is likely to cause obesity, all of which are pronounced in an age-dependent manner (Curfs, 1992). Moreover, the characteristics of PWS frequently overlap with developmental disorders, such as autism spectrum disorder (ASD) (Dykens et al., 2017), susceptible to maladaptive behavior. Therefore, the common behavioral spectrum of PWS has been considered to be based on functional alterations in the brain, supported by increasing evidence on a gene–behavior relationship associated with 15q11–13 (Schaaf et al., 2013). However, the translational research in individuals with PWS has thus far been sparse.
Neuroimaging investigations have noninvasively revealed some brain characteristics of individuals with PWS. Early conventional magnetic resonance imaging (MRI) studies have detected structural and volumetric alterations of the brain at a macroscopic level. A recent longitudinal observational study explored regional brain volume alteration trajectory and revealed relevant pathogenetic implications (Manning et al., 2018). Moreover, alterations in white matter microstructural integrity in clinically relevant brain regions were detected in individuals with PWS by diffusion tensor imaging (Rice et al., 2017; Yamada et al., 2006), and they were correlated with regions showing altered functional connectivity (Fc) detected by using a resting-state functional MRI (rsfMRI) (Lukoshe et al., 2017). Using seed-based connection analysis (SCA), these functional studies have identified brain structures, including the prefrontal and anterior cingulate cortices, limbic structure, and basal ganglia, that are relevant to specific behavioral and developmental characteristics, such as food-related functioning, obsessive behavior, and task-switching difficulty (Klabunde et al., 2015; Pujol et al., 2016).
From a clinical standpoint, understanding the key neuroanatomical structures for such neurobehavioral substrates may provide a clue for effective interventional strategies. However, given the difficulties associated with detecting both enhanced and attenuated connectivity linked with clinical behavioral characteristics, a better understanding of the properties of the Fc framework might be more beneficial. Recent advances in neuroimaging analysis introduced the combined use of independent component analysis (ICA) and SCA, which has enabled the analysis of such connectivity properties (Seewoo et al., 2020), as shown by an investigation of the brain with neurodevelopmental disorder (Mattiaccio et al., 2018).
Here, we aimed at detecting brain Fc characteristics in individuals with PWS by using rsfMRI analysis; we specifically focus on the attenuated and enhanced Fc associated with behavior by using ICA and SCA.
Methods
The study was conducted according to the human research guidelines of the Institutional Review Board of the University of Niigata under the approval of the research ethics committee (approval no. 2482). Written informed consent and child assent were obtained from all participants and parents or guardians before any aspect of research participation.
Study design and general clinical measures
An age- and sex- matched case-control study in a single institute was designed. All participants with PWS were recruited through advertisements in support groups for PWS. The control participants with typical development (TD) were recruited from a local community around our city. The study size was determined based on our previous neuroimaging study (Yamada et al., 2006).
The clinical diagnoses of PWS were confirmed based on the clinical diagnostic consensus criteria with the genetic testing results (Holm et al., 1993). Semi-structured interviews were conducted for all individuals regarding past history, medical treatment, and behavioral characteristics along with age and developmental course. Comorbid psychiatric disorders were identified according to The Diagnostic and Statistical Manual of Mental Disorders, fifth edition. The behavioral characteristics were assessed by using the Autism-Spectrum Quotient (AQ) (Wakabayashi et al., 2004). The Kohs Block test was performed to assess global intellectual functioning.
No individuals had a history of any other neurological diseases or traumatic brain injury that resulted in any neurological sequelae. The TD control individuals underwent a neurological examination and an interview to confirm the absence of developmental abnormalities. All individuals were free of smoking, illicit drugs, and alcohol.
Imaging procedure and data analysis
All imaging studies were performed by using a Signa LX 3.0 Tesla (General Electric Healthcare, Milwaukee, WI) imaging system with an 8-channel phased array head coil. Functional images were obtained with interleaved multi-slice single-shot gradient-echo, echo planar pulse sequences (field of view: 200 × 200 mm; matrix: 64 × 64; repetition time [TR]: 1000 ms; echo time [TE]: 30 ms; flip angle: 70°; slice thickness: 5 mm; and slice spacing: 2.5 mm). Fifteen axial slices covered the whole cerebrum. Image acquisition was performed in an awake state, with participants viewing a clear screen with a fixation point via mirror reflection. Head motion of the participant during the scan was estimated from acquired data by using an in-house original script based on translation and rotation of a rigid–body assumption to ensure that the range of translation and rotation could be limited within ±0.4 mm in all studies. The scan time for each fMRI data acquisition was 10 min 30 sec; data from the first 30 sec were discarded to ensure a steady state. For familiarization with the imaging procedures, the “Zero-tesla” mock scanner preparation system that we have developed in-house was utilized as a rehearsal session before the actual imaging. Audio–visual aids were utilized to maximize comfort and effectively reduce anxiety in the real MRI scanner (Yamada et al., 2020). No sedative agent was administered nor was it required.
All rsfMRI data processing was performed by using the CONN toolbox release 18.b (Whitfield-Gabrieli and Nieto-Castanon, 2012), within SPM12 based on MATLAB 2018a (Mathworks, Natik, MA). Preprocessing was performed as follows: (1) realignment and unwarping (subject motion estimation and correction), (2) centering to (0,0,0) coordinates (translation), (3) slice-timing correction, (4) outlier detection (Automatic Registration Toolbox-based identification of outlier scans for scrubbing), (5) direct segmentation and normalization (simultaneous gray/white/cerbrospinal fluid segmentation and Montreal Neurological Institute template-based normalization), and (6) spatial smoothing (spatial convolution with Gaussian kernel) with 8 mm full width half maximum. Second, noise reduction was applied based on band pass filter 0.008–0.09 Hz. Third, as a first-level analysis, Fc was estimated on region of interest (ROI)-to-ROI by using multivariate pattern analysis and voxel-based analysis using ICA for each individual.
After the first-level analysis, a second-level analysis was performed with age and sex as covariates in the following workflow: (1) voxel-based analysis using group ICA. The components were selected in descending order of statistical significance as much as the degrees of freedom allowed. The components detected in cerebellar structures were excluded from the current study for the same reason, (2) linear correlation analysis with the behavioral scores, which consisted of AQ, and (3) SCA using ROIs. The ROIs in SCA were defined in 106 areas by using the CONN toolbox default setting, and importation from the following sources: Cortical ROIs were obtained from the FMRIB software library (FSL) Harvard—Oxford Atlas maximum likelihood cortical atlas by dividing bilateral areas into the left/right hemisphere (91 ROIs); subcortical ROIs were imported from FSL Harvard—Oxford Atlas maximum likelihood subcortical atlas by disregarding cerebral white matter, cerebral cortex, and lateral ventricular areas (15 ROIs). To eliminate false positive results associated with image distortion artifacts, the 26 ROIs used as seed regions in cerebellar structures were excluded from the current study. All image processing steps were independently performed by two researchers to ensure reproducibility of the components or ROIs detected.
Statistical analysis
The voxel-based comparison between the two groups (PWS and TD controls) was performed by using analysis of covariance, with age and sex as covariates, based on cluster-based inferences using Gaussian random field theory parametric statistics. Cluster threshold was set at p < 0.05 with family wise error (FWE) corrected; cluster size was false discovery rate (FDR) corrected, and voxel threshold was p < 0.001 without correction (unc). Graphics was created by using the CONN toolbox.
Results
Twelve individuals with PWS (age range: 15–42 years; male 8, female 4) and 14 age- and sex-matched healthy controls with TD participated in this study. The primary characteristics of the participants are summarized in Table 1.
Participant Characteristics
Data are presented as n or as the median (range).
Mann–Whitney rank sum test.
Laterality quotient is derived from the Edinburg Handedness Inventory.
AQ, Autism-Spectrum Quotient; BMI, body mass index; Del, deletion; IQ, intelligence quotient; PWS, Prader–Willi syndrome; RhGH, growth hormone; T2DM, type 2 diabetes mellitus; TD, typically developing; Upd, uniparental disomy.
Voxel-based analysis using group ICA
Initially, a total of 20 components were to be used for ICA (Fig. 1 and Supplementary Tables S1, S2, Supplementary Fig. S1). However, one component was excluded as an artefact. Consequently, 19 independent components showing significant differences in Fc between the PWS and TD control groups were detected and adopted. The components were scattered in the frontal, parietal, temporal, and occipital lobes of cerebral structure. The structures with the most spatially extensive components were the superior lateral occipital complex followed by right postcentral gyrus; the most statistically significant components were the superior lateral occipital complex (15%, 755 voxels), left angular gyrus (33%, 312 voxels), left superior parietal lobule (3%, 44 voxels), and posterior supramarginal gyrus (1%, 11 voxels).
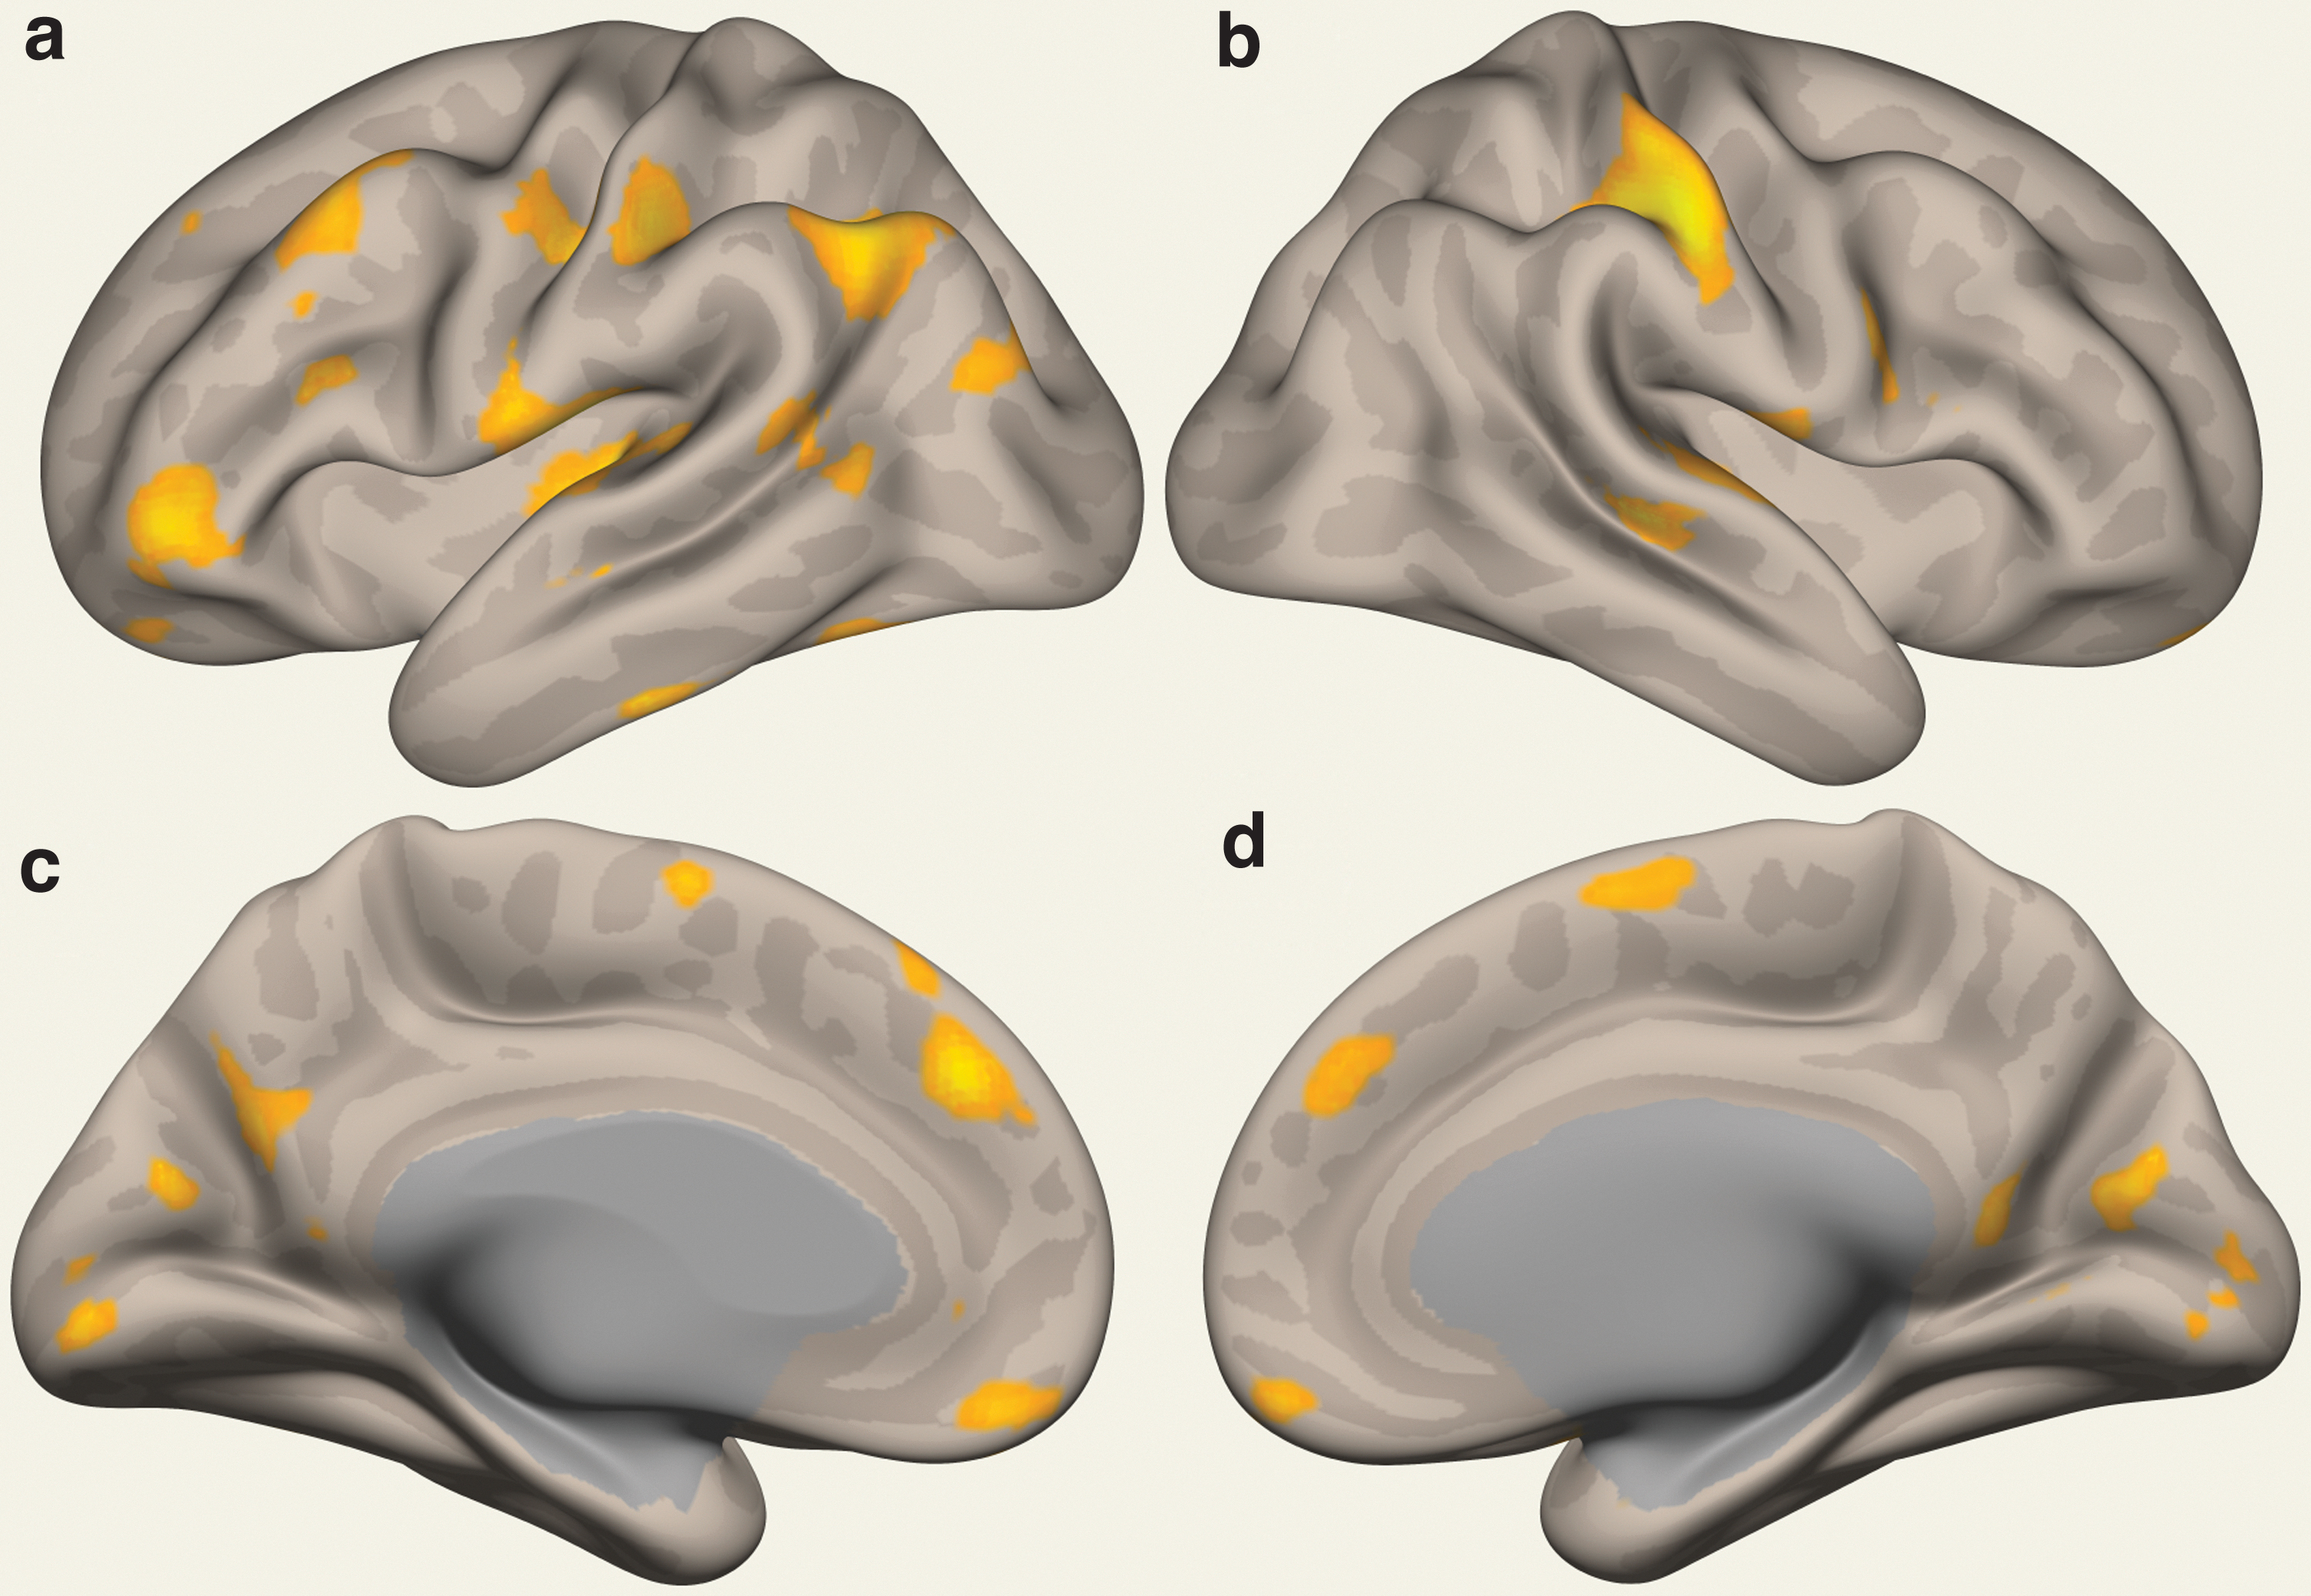
Pictorial presentation of the components showing significantly altered Fc for individuals with PWS and those with TD, detected by rsfMRI. The altered Fcs are indicated in yellow (cluster-based inferences using Gaussian random field theory parametric statistics. Cluster threshold, p < 0.05 family wise error corrected; cluster size, free discovery rate corrected; voxel threshold, p < 0.001 uncorrected). Participants were asked to view a fixation point on a screen during each scan. The altered Fcs are scattered over the frontal, parietal, and temporal areas.
Correlation analysis with behavioral scores
The AQ scores were found to be significantly correlated with Fc in the right inferior frontal area (coordinate [x, y, z], [+18, +30, −04]; size, 157; size FWE, p = 0.057054; size FDR, p = 0.046607; size unc, p = 0.003329; peak FWE, p = 0.073369; peak unc, p < 0.00001) (Fig. 2).
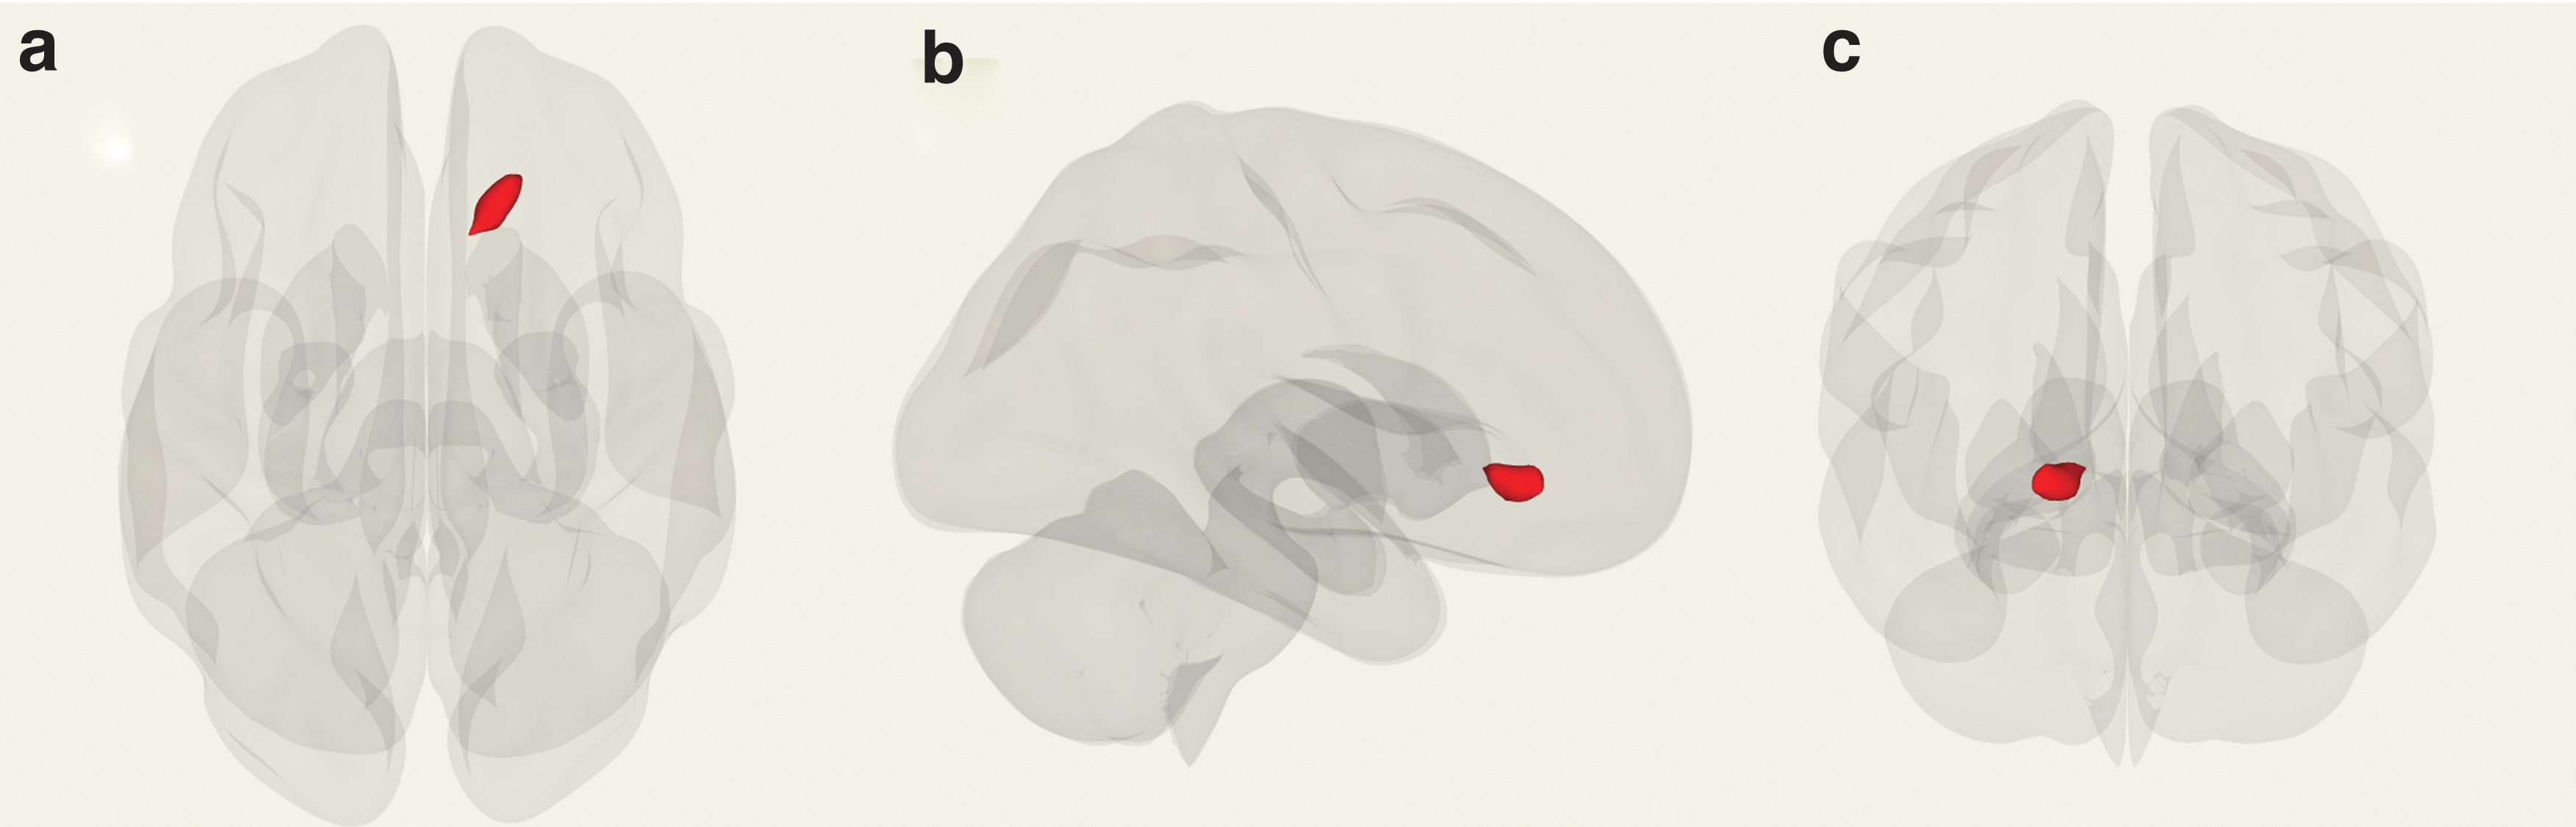
Clusters showing a significant correlation between Fc and AQ scores (significance level: p < 0.05).
SCA using ROIs
The PWS group exhibited differences in Fcs over several brain regions as indexed by clusters compared with that in the TD control group (Fig. 3 and Supplementary Table S3). Each ROI is shown as a gray-colored ball. The representative connection clusters detected were as follows: frontoparietal (cluster no. 1, F [2,21] = 23.36; FDR, p = 0.001), supramarginal gyrus and superior parietal lobules (no. 2, F [2,21] = 18.72; FDR, p = 0.00249), temporoparietal (no. 8, F [2,21] = 8.53; FDR, p = 0.04995), frontal-temporoparietal (no. 4, F [2,21] = 12.85; FDR, p = 0.01308, no. 5, F [2,21] = 10.93; FDR, p = 0.02406), and hippocampus and brainstem structures (no. 7, F [2.21] = 9.92; FDR, p = 0.03054) along with interhemispheric Fcs in each connection.
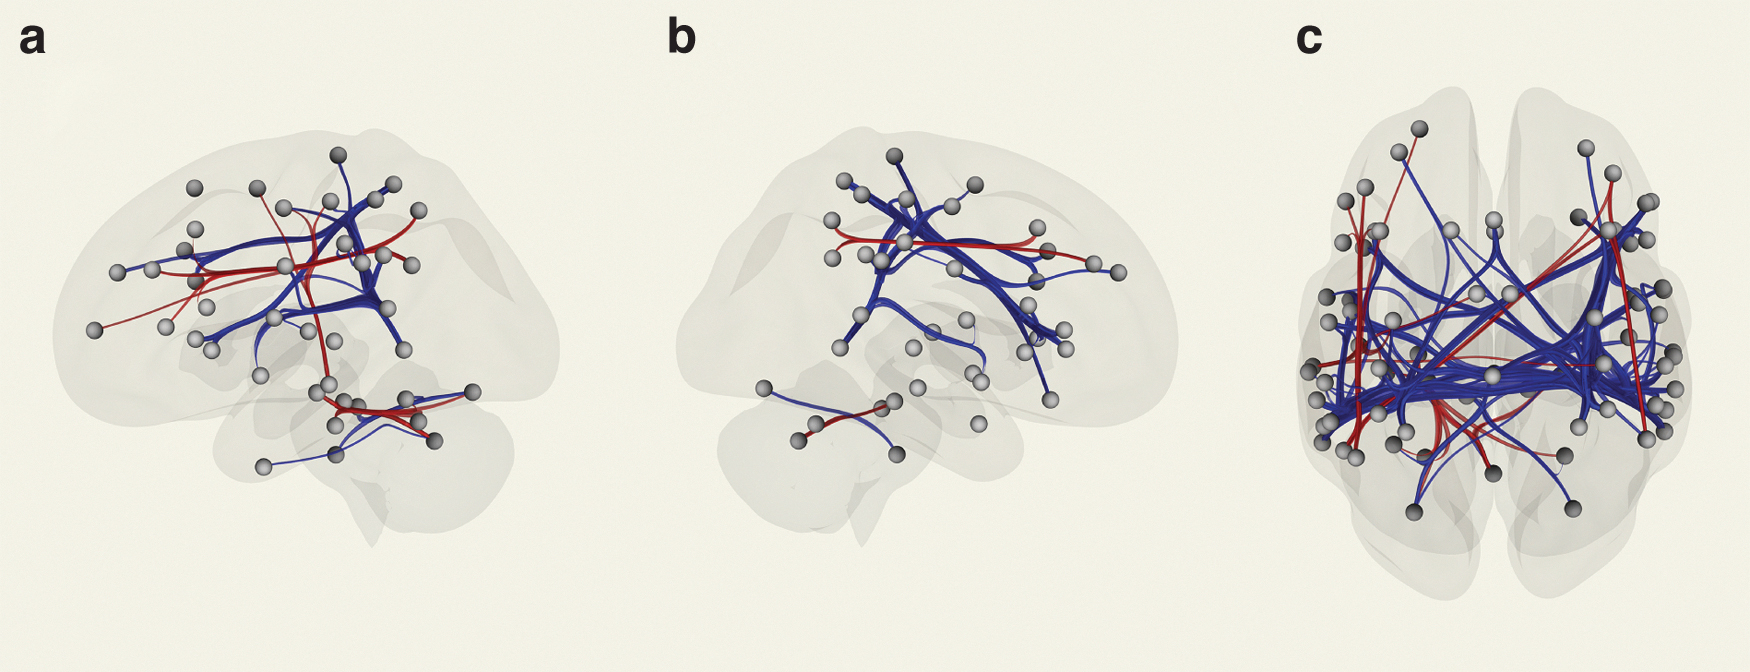
Pictorial presentation of the regional connection showing significantly altered Fc between regions of the brain in individuals with PWS compared with that in regions of the brain of control participants with TD. This is detected by rsfMRI; participants were asked to view a fixation point on a screen. The atlas-based ROI analysis detects attenuated and enhanced Fc, indicated by blue and red, respectively.
Discussion
Altered Fcs, which are estimated via correlations in the trend of blood-oxygen level dependent (BOLD) signal change, have been believed to reflect altered synchronization in neurovascular coupling associated with neuroglial activity. The current findings indicate regional alteration of synchronization based on the assumption that the degree of synchronization between the clusters reflects altered Fc in its neuronal circuits (Harris et al., 2011). Although it remains controversial how BOLD responses are coupled with metabolic activity, the results may reflect maturational alteration in PWS.
Altered Fcs detected in the current study adds further information on “bi-directional” contributions, including enhanced and attenuated brain circuitries (frontopolar-parietal vs. dorsolateral prefrontal-parietal connections), both in which specific brain regions have been considered in PWS. Although the reward and inhibitory circuitries, which are likely to be pronounced in addiction-like PWS behaviors, are considered to be supported by the frontal-striate-parietal circuit (Holsen et al., 2012), binge drinking, lucid dreaming, and subtypes of sleep and impulse control difficulties have been associated with the frontopolar-parietotemporal network (Herman et al., 2019), which has also been implicated in PWS. Moreover, the private–public distinction, an ability that is central to successful social interaction, has been recently mapped to a medial–lateral division of the prefrontal cortex and lateral frontopolar cortex. Therefore, the functional alteration of these connections in our study is consistent with previous research and provides a promising framework for understanding the difficulty in flexible social behavior associated with PWS (Bang et al., 2020). Taken together, our findings strongly indicate that circuit-based functional alterations, indeed, exist and involve frontoparietal connections.
The significant correlation between Fc at the specific brain region and the autistic features, as indexed by the AQ, ensures functional contribution, and it can be associated with ASD-like symptoms observed in individuals with PWS. The right inferior frontal area that was detected has shown to be associated with inhibition, attentional control, and task switching (Hampshire et al., 2010). Although better understanding and management of task switching has been explored for individuals with PWS (Woodcock et al., 2010), recent observations have shown that compulsivity and insistence on sameness are more salient in PWS and likely impede adaptive functioning, compared with problems in social interactions, even if it is the core behavioral feature of ASD (Dykens et al., 2017). Considering that there has been much debate about the similarity and difference between ASD-like traits in PWS and typical autistic traits, our findings may provide a clue to help decipher a constellation of ASD-like symptoms in PWS. Moreover, it remains unknown whether these alterations are genetic or a result of experience-dependent learning and modification. Considering that individuals with a uniparental disomy (UPD) genetic defect are more likely to present with ASD-like traits than those with the deletion (Del) type (Dimitropoulos, 2019), comparative studies would reveal whether the contribution has a genetic background: This might further result in the development of personalized, rational, and noninvasive interventions via neuromodulation (Campanella et al., 2018).
All imaging was conducted in line with a strict compliance for safety under our optimized preparation protocol, and possible influences of attentional modulation during the scan were best considered and well controlled by preparation. Nevertheless, prudence dictates cautious interpretation of our findings. Further evaluation with a larger sample size comprising genetic subtype (Del vs. UPD) is highly warranted.
Conclusions
The observed Fc detected by rsfMRI indicated altered Fc in specific brain regions, which is consistent with the behavioral features in individuals with PWS. The enhanced versus attenuated connectivity in distinct frontal regions with interhemispheric patterns may contribute to not only autistic features but also other behavioral characteristics.
Footnotes
Acknowledgments
The authors thank the Prader–Willi Syndrome Association Japan and the Takenoko-no-kai (the parents' organization for PWS) for announcing the advertisement and recruiting individuals with PWS to participate in their project. They also thank Emiko Aiba, SLP, for supporting neurodevelopmental assessments in each participant. Finally, they thank and pay tribute to Tsutomu Nakada, MD, PhD, FAAN, Emeritus Professor and Director, Center for Integrated Human Brain Science, Brain Research Institute, University of Niigata.
Authors' Contributions
K.Y. conceptualized and designed the study. Participant preparation and data collection were performed by K.Y., M.W., and K.S. The imaging system was optimized and maintained by M.W., and the data were analyzed by K.Y. and interpreted by K.Y. and K.S. The first draft of the article was written by K.Y., and all authors commented on previous versions of the article. All authors read and approved the final article.
Author Disclosure Statement
No competing financial interests exist.
Funding Information
This study was supported by KAKENHI, the grants from the Japanese Society of Promotion of Science (grant no. 17K10049 to K.Y.). The funding source had no involvement in study design; in the collection, analysis, and interpretation of data; in the writing of the article; and in the decision to submit the article for publication.
Supplementary Material
Supplementary Figure S1
Supplementary Table S1
Supplementary Table S2
Supplementary Table S3
References
Supplementary Material
Please find the following supplemental material available below.
For Open Access articles published under a Creative Commons License, all supplemental material carries the same license as the article it is associated with.
For non-Open Access articles published, all supplemental material carries a non-exclusive license, and permission requests for re-use of supplemental material or any part of supplemental material shall be sent directly to the copyright owner as specified in the copyright notice associated with the article.