
Abstract
Background:
Recently, a new resting-state functional magnetic resonance imaging (rs-fMRI) measure to evaluate the concordance between different rs-fMRI metrics has been proposed and has not been investigated in Alzheimer's disease (AD).
Methods:
3T rs-fMRI data were obtained from healthy young controls (YC, n = 26), healthy senior controls (SC, n = 29), and AD patients (n = 35). The fractional amplitude of low-frequency fluctuations (fALFF), regional homogeneity (ReHo), and degree centrality (DC) were analyzed, followed by the calculation of their concordance using Kendall's W for each brain voxel across time. Group differences in the concordance were compared globally, within seven intrinsic brain networks, and on a voxel-by-voxel basis with covariates of age, sex, head motion, and gray matter volume.
Results:
The global concordance was lowest in AD among the three groups, with similar differences for the single metrics. When comparing AD to SC, reductions of concordance were detected in each of the investigated networks apart from the limbic network. For SC in comparison to YC, lower global concordance without any network-level difference was observed. Voxel-wise analyses revealed lower concordance in the right middle temporal gyrus in AD compared to SC and lower concordance in the left middle frontal gyrus in SC compared to YC. Lower fALFF were observed in the right angular gyrus in AD in comparison to SC, but ReHo and DC showed no group differences.
Conclusions:
The concordance of resting-state measures differentiates AD from healthy aging and may represent a novel imaging marker in AD.
Impact statement
The usefulness of a new resting-state functional magnetic resonance imaging (rs-fMRI) measure to assess the concordance between different rs-fMRI metrics has been demonstrated in mental disorders such as depression and schizophrenia. Our study, to the best of our knowledge, is the first to confirm a decreased concordance in Alzheimer's disease (AD) patients compared to healthy young and senior individuals on global, network, and voxel-wise levels, which moreover seems to be sensitive in differentiating age-related from AD-related functional brain changes. Our findings suggest that the concordance of rs-fMRI metrics may be useful as a candidate biomarker for neurodegenerative disorders such as AD.
Introduction
Resting-state functional magnetic resonance imaging (rs-fMRI) is well established to study brain functional connectivity in healthy aging and Alzheimer's disease (AD). The most frequently applied data analysis methods include seed-based connectivity analysis and independent component analysis. More recently, voxel-level, data-driven measurements have been proposed, eliminating the need for a priori seed and component selection. The most commonly used metrics are fractional amplitude of low-frequency fluctuations (fALFF), regional homogeneity (ReHo), and degree centrality (DC).
fALFF reflect the relative magnitude of the slow fluctuations of the blood-oxygen-level-dependent (BOLD) signal for each voxel, that is, it represents a measure of regional spontaneous activity (Zou et al., 2008). Reduced fALFF have been previously reported in AD (Cha et al., 2015; Marchitelli et al., 2018) and are gradually disturbed as the disease progresses (Yang et al., 2018).
ReHo is a voxel-based measure exploring local functional connectivity by estimating the BOLD signals' synchronization across neighboring voxels (Zang et al., 2004). Notably, it was reported that the progression of ReHo abnormalities in AD patients corresponds to the clinical deterioration (Liu et al., 2014; Zhang et al., 2012).
DC characterizes the strength of connectivity between a given voxel and the rest of the brain. Considering the entire brain functional connectome, both global and local connectivity properties can be captured (Zuo et al., 2012). The impaired functional connectivity patterns of DC were progression dependent along the AD continuum (Wang et al., 2015, 2019), similar to that of the fALFF and ReHo.
ReHo and fALFF are tightly coupled and overlap spatially in the precuneus, the posterior cingulate cortex (Marchitelli et al., 2018), the middle temporal gyrus, and the postcentral gyrus (Cha et al., 2015) while differentiating AD patients from senior healthy controls. Concerning verbal working memory in healthy young subjects, findings for fALFF, ReHo, and DC identified a convergence around the left angular gyrus and the posterior middle temporal gyrus (Yang et al., 2015). In healthy seniors, pairwise correlations between the three metrics indicated a substantial similarity of their spatial distributions, voxel-wise for the whole brain and in the major functional networks such as the default mode network (Aiello et al., 2015).
Importantly, however, these metrics might rely on different hemodynamic components (Marchitelli et al., 2018) while investigating single-voxel functional activity (fALFF), local processing (ReHo), and global processing (DC) (Takeuchi et al., 2017). The decoupling from one another may reflect an underlying pathological process. For example, a negative correlation between local and distant connectivity was found in the aging hippocampus, especially within the tau-vulnerable anterior-temporal regions (Harrison et al., 2019). In view of the conceptualization of AD as a disconnection syndrome with abnormal functional integrity in the brain (Palesi et al., 2016; Sha et al., 2018; Wang et al., 2013), the interaction between the three metrics may provide insights into the pathophysiological mechanisms underlying this disease that cannot be derived from the individual metrics.
The possibility of assessing the coupling between different voxel-wise measures of brain activity has been made available through an extension of the Data Processing & Analysis of Brain Imaging (DPABI) toolbox (Yan et al., 2017). The concordance of different voxel-wise metrics is calculated for each brain voxel across time using a sliding-window approach (Preti et al., 2017) and Kendall's W as a nonparametric statistic insensitive to scale differences between the different indices. Analyses revealed that during periods of high concordance, there were also greater signal strengths of the individual rs-fMRI metrics and increased connectivity both within and between functional networks (Yan et al., 2017).
To date, this index has been investigated in healthy subjects (Yan et al., 2017), autism spectrum disorder (ASD) (Lu et al., 2018), schizophrenia (Zhu et al., 2018), and major depressive disorder (MDD) (Zhu et al., 2019). In healthy participants, the concordance is independent of physiological noise (e.g., cardiac, respiratory) and to decrease with age (Yan et al., 2017). In patients with neuropsychiatric disorders, it was lower than in healthy controls (Lu et al., 2018; Zhu et al., 2018, 2019). In addition, a lower concordance was linked with more communication deficits in ASD, later onset in schizophrenia, and worse cognitive performance in MDD. These correlations between behavioral effects and the concordance suggest that this summary metric may be useful as a biomarker. However, the effect of a progressive neurodegenerative disorder, such as AD, on concordance remains to be explored.
In the present study, we calculated the concordance of three of the most frequently used voxel-wise metrics (i.e., fALFF as a measure of local brain activity, ReHo measuring regional functional connectivity, and DC as a measure of global functional connectivity) in healthy young and senior controls and patients diagnosed with AD on the following levels: (1) the whole brain (i.e., one value per subject); (2) the network level, focusing on the seven most prominent intrinsic brain networks (Yeo et al., 2011) (i.e., default mode, ventral attention, dorsal attention, frontoparietal control, limbic, visual and somatomotor; one value per network = seven values per subject); and (3) on a voxel-by-voxel basis calculated across all brain voxels (i.e., one voxel-wise concordance map per subject). We hypothesized that the concordance is lower in AD patients than healthy older controls and that in AD this integrated metric may constitute an imaging marker of higher sensitivity than the single indices.
Methods
Participants
Data from 45 patients diagnosed with AD (aged 68.8 ± 6.7, within the range of 55–82 years; 22 females), 30 healthy senior controls (SC, aged 63.0 ± 6.6, within the range of 50–72 years; 10 females), and 26 healthy young controls (YC, aged 22.9 ± 1.4, within the range of 20–25 years; 19 females) were used in the current study. The current study population and analyses are part of a larger study (Dillen et al., 2016, 2017), including YC, SC, adults with subjective cognitive decline, and patients suffering AD (prodromal or dementia). For this study, we included YC, SC, and AD patients with structural and fMRI. YC and SC were recruited from the local facility (Jülich Research Center, scientific and nonscientific personnel) through online advertisements.
Healthy controls were required to have no deficits on neuropsychological tests according to normative data and no depressive symptoms as measured by the Hamilton Depression Rating Scale.
Patients were recruited from the memory clinic Cologne-Juelich. They presented with memory impairment at least 1.5 standard deviations (SDs) below the normative mean of the verbal learning memory test delayed recall (Helmstaedter and Durwen, 1990). Prodromal AD patients scored in the mini-mental state examination (MMSE) (Folstein et al., 1975) above 23 and preserved activities of daily living reported by a relative. Patients with dementia due to AD scored between 15 and 22 on MMSE and had compromised activities of daily living. For all analyses, both patient groups were combined as the AD group, given the notion that they represent two stages on a continuum of AD (Jack et al., 2018). Diagnosis of AD was confirmed by an interdisciplinary team (neurologists specialized in dementia care, clinical neuropsychologists, neuroradiologists, and nuclear medicine specialists), based on the criteria for prodromal AD as described by Albert et al. (2011) or dementia due to AD by Dubois et al. (2014). Notably, patients had a biomarker profile indicative of AD by cerebrospinal fluid analysis (tau/amyloid β 1–42 ratio of >0.52) (Duits et al., 2014) or positron emission tomography ([11C]PIB or [18F]Florbetapir amyloid PET and [18F]AV-1451 tau PET), which was part of their clinical workup.
General exclusion criteria were MRI contraindications, a history of (other) neurological or psychiatric disorders (apart from mild depression in the AD group), structural abnormalities (such as severe hydrocephalus, large postischemic lesions, or incidental findings), insufficient fluency in the German language, and medications affecting the central nervous system or cognition (except for memantine, acetylcholinesterase inhibitors, or antidepressants in the patient group). Written informed consent was obtained from each participant or a relative. The study was part of a larger study with approval from the local ethics committee and was conducted in accordance with the Helsinki declaration. Ethics committee approval number 12–073.
Data acquisition
Structural and fMRI data were acquired using a 3T MAGNETOM Trio Magnetic Resonance (MR) scanner (Siemens, Erlangen, Germany). The rs-fMRI images were obtained using a T2*-weighted, single-shot echo planar imaging (EPI) sequence: time of repetition (TR) = 3000 msec, time of echo (TE) = 30 msec, flip angle = 90°, matrix size = 80 × 80, field of view = 200 mm, resolution = 2.5 × 2.5 × 2.8 mm3, gap = 0.28 mm, descending. During the resting state scan, participants were instructed to rest with eyes open, and no movements were allowed. A vacuum cushion was placed to minimize head motion. For anatomical reference, high-resolution T1-weighted magnetization-prepared structural images were also acquired using the following sequence: TR = 2250 msec, TE = 3.03 msec, flip angle = 9°, field of view = 256 mm, matrix size = 256 × 256, resolution = 1 mm isotropic, no gap, interleaved. In addition, T2-weighted Fluid Attenuated Inversion Recovery (FLAIR) images were used to assess white matter lesion load and detect structural abnormalities (TR = 12,900 msec, TE = 111 msec, flip angle = 130°, field of view = 224 mm, voxel resolution = 0.5 × 0.5 × 3.0 mm, 48 slices, interleaved).
Data preprocessing
Data were preprocessed using the Data Processing Assistant for Resting-State fMRI (DPARSF,
Single rs-fMRI metrics
fALFF are a single-voxel indicator of the functional signal frequency power (Zou et al., 2008). It was calculated as the ratio of the amplitude within the low-frequency band (0.01–0.1 Hz) to that of the entire frequency range at each voxel over the Fourier transformed time courses.
ReHo is a measure of regional similarity among neighboring voxel time series. The individual ReHo maps were obtained by computing Kendall's W for each voxel in correlation to its neighboring 27 voxels after filtering within the low-frequency band (0.01–0.1 Hz) (Zang et al., 2004).
DC is a local-scale measure indexing the number of significant connections for a given voxel (Zuo et al., 2012). It was generated as the weighted sum of positive correlations between an individual voxel and every other voxel across all brain voxels by thresholding each correlation at r > 0.25 after filtering within the low-frequency band (0.01–0.1 Hz). To assure maximum comparability with the concordance metric (see section Concordance of rs-fMRI metrics), all measures were estimated on unsmoothed images, and the resulting maps were smoothed using an isotropic full width at half maximum (FWHM) Gaussian kernel of 8 mm.
For whole-brain volume-wise analyses, mean values were extracted from the custom group mask for every metric, resulting in one value per subject. For network-based analyses, mean values were extracted from the seven networks in nonlinear MNI152 volume space provided by Yeo et al. (2011), resulting in seven values per subject (
Concordance of rs-fMRI metrics
The concordance among fALFF, ReHo, and DC was investigated across sliding time windows, with the window length being 90 sec and the sliding step being 3 sec (default settings), resulting in 101 time windows. We also examined windows with a length of 60 sec with the same basic results. For global volume-wise analysis of concordance, within each time-window Kendall's W of the three rs-fMRI indices was computed for all brain voxels within the customized group mask (resulting in one value per subject), and the mean Kendall's W across time windows was calculated (resulting in one volume-wise concordance value for each subject). Voxel-wise concordance maps were computed as Kendall's W for the three rs-fMRI metrics for every voxel within the mask across sliding time windows (resulting in one value per voxel). These voxel-wise concordance maps then underwent spatial smoothing (8 mm FWHM Gaussian kernel) for subsequent analyses (Yan et al., 2017). Network-based mean values were extracted from voxel-wise concordance maps, as described above for the single metrics.
All images and outputs were carefully inspected. Exclusion criteria for image data analysis were as follows: (1) severe cerebral white matter lesions (Fazekas score >2 = five subjects) as visually assessed on T1 and FLAIR images; (2) technical or structural abnormalities on either functional or structural imaging (one subject); (3) translational or rotational motion parameters more than 3 mm or 3° (four subjects); (4) EPI coverage <2 SDs below the group mean 90% coverage (two subjects); and (5) more than 2 SD above the group mean motion as assessed by mean frame-wise displacement (FD), calculated as per Jenkinson's approach (Jenkinson et al., 2002; Yan et al., 2013) (i.e., mean FD >0.3 = four subjects). Finally, the data of 26 YC, 29 SC, and 35 AD patients entered further analysis. Group characteristics after exclusion can be found in Table 1.
Demographics and Frame-Wise Displacement of All Three Groups
FD calculated as per Jenkinson et al. (2002).
p Values were obtained by two-sample t-tests.
p Values were obtained by ANOVA.
p Values were obtained by the Chi-square test.
AD, Alzheimer's disease; FD, frame-wise displacement; SC, healthy senior controls; YC, healthy young controls.
Statistical analysis
Analyses of the demographics and volume-wise data were performed with SPSS (version 26.0; IBM Corp., Armonk, NY), whereas the voxel-based statistical evaluations were conducted using DPABIs statistical analysis module.
The main effect of global concordance between the groups was assessed by analyzing covariance (ANCOVA) adjusted for age, sex, and mean FD. Follow-up comparisons were performed by ANCOVA, with YC versus SC adjusted for age and mean FD and SC versus AD adjusted for sex and mean FD. To meet the normality assumption, the response variables underwent z-standardization followed by normal score transformation using the Blom method (Solomon and Sawilowsky, 2009), and the equivalent normalizations were performed in the following volume-wise analyses.
Network-based comparisons were conducted by multivariate ANCOVA (MANCOVA) controlling for age, sex, and FD for the main effect between three groups, followed by post hoc tests of YC versus SC and SC versus AD.
To examine whether the network-level group differences interacted with the measurements, a repeated measures ANCOVA with the within-subject factors measurement (volume-wise concordance, fALFF, ReHo, and DC) and network (default mode, dorsal attention, ventral attention, frontoparietal control, limbic, visual, and somatomotor), the between-subject factor group (YC, SC, and AD), and the covariates age, sex, and mean FD was performed.
Voxel-wise single metrics and concordance maps were compared between the three groups using ANCOVA (covariates: voxel-wise grey matter (GM) density maps, age [SC vs. AD], sex, and mean FD). Post hoc tests (YC vs. SC, SC vs. AD) were thresholded at p < 0.05 FWE (family-wise error)—corrected at cluster level (cluster forming threshold p < 0.001). For all analyses, Bonferroni corrections were used in case of multiple comparisons; age was not included as a covariate when comparing YC versus SC because they were already classified by age.
Results
Global-level analyses
Across the whole brain there was a significant difference in all measures [concordance: F (2, 82) = 8.023, p = 0.001, η2 p = 0.164; fALFF: F (2, 82) = 5.108, p = 0.008, η2 p = 0.111; ReHo: F (2, 82) = 3.335, p = 0.040, η2 p = 0.075; DC: F (2, 82) = 6.361, p = 0.003, η2 p = 0.134] between the three groups by ANCOVA, while adjusting for sex, age, and mean FD (Fig. 1). A follow-up ANCOVA indicated that AD patients had lower whole-brain global concordance than SC [F (1, 60) = 10.400, p = 0.002, η2 p = 0.148], while YC showed higher concordance than SC [F (1, 50) = 4.152, p = 0.047, η2 p = 0.077]. The individual measures differed significantly in the follow-up ANCOVA as well: compared to SC, fALFF, ReHo, and DC were consistently lower in AD patients [fALFF: F (1, 60) = 7.512, p = 0.008, η2 p = 0.111; ReHo: F (1, 60) = 6.567, p = 0.013, η2 p = 0.099; DC: F (1, 60) = 3.328, p = 0.073, η2 p = 0.053]. Furthermore, there was a significant decrease in ReHo and DC in the SC group relative to the YC group [ReHo: F (1, 50) = 5.533, p = 0.023, η2 p = 0.100; DC: F (1, 50) = 9.376, p = 0.004, η2 p = 0.158].
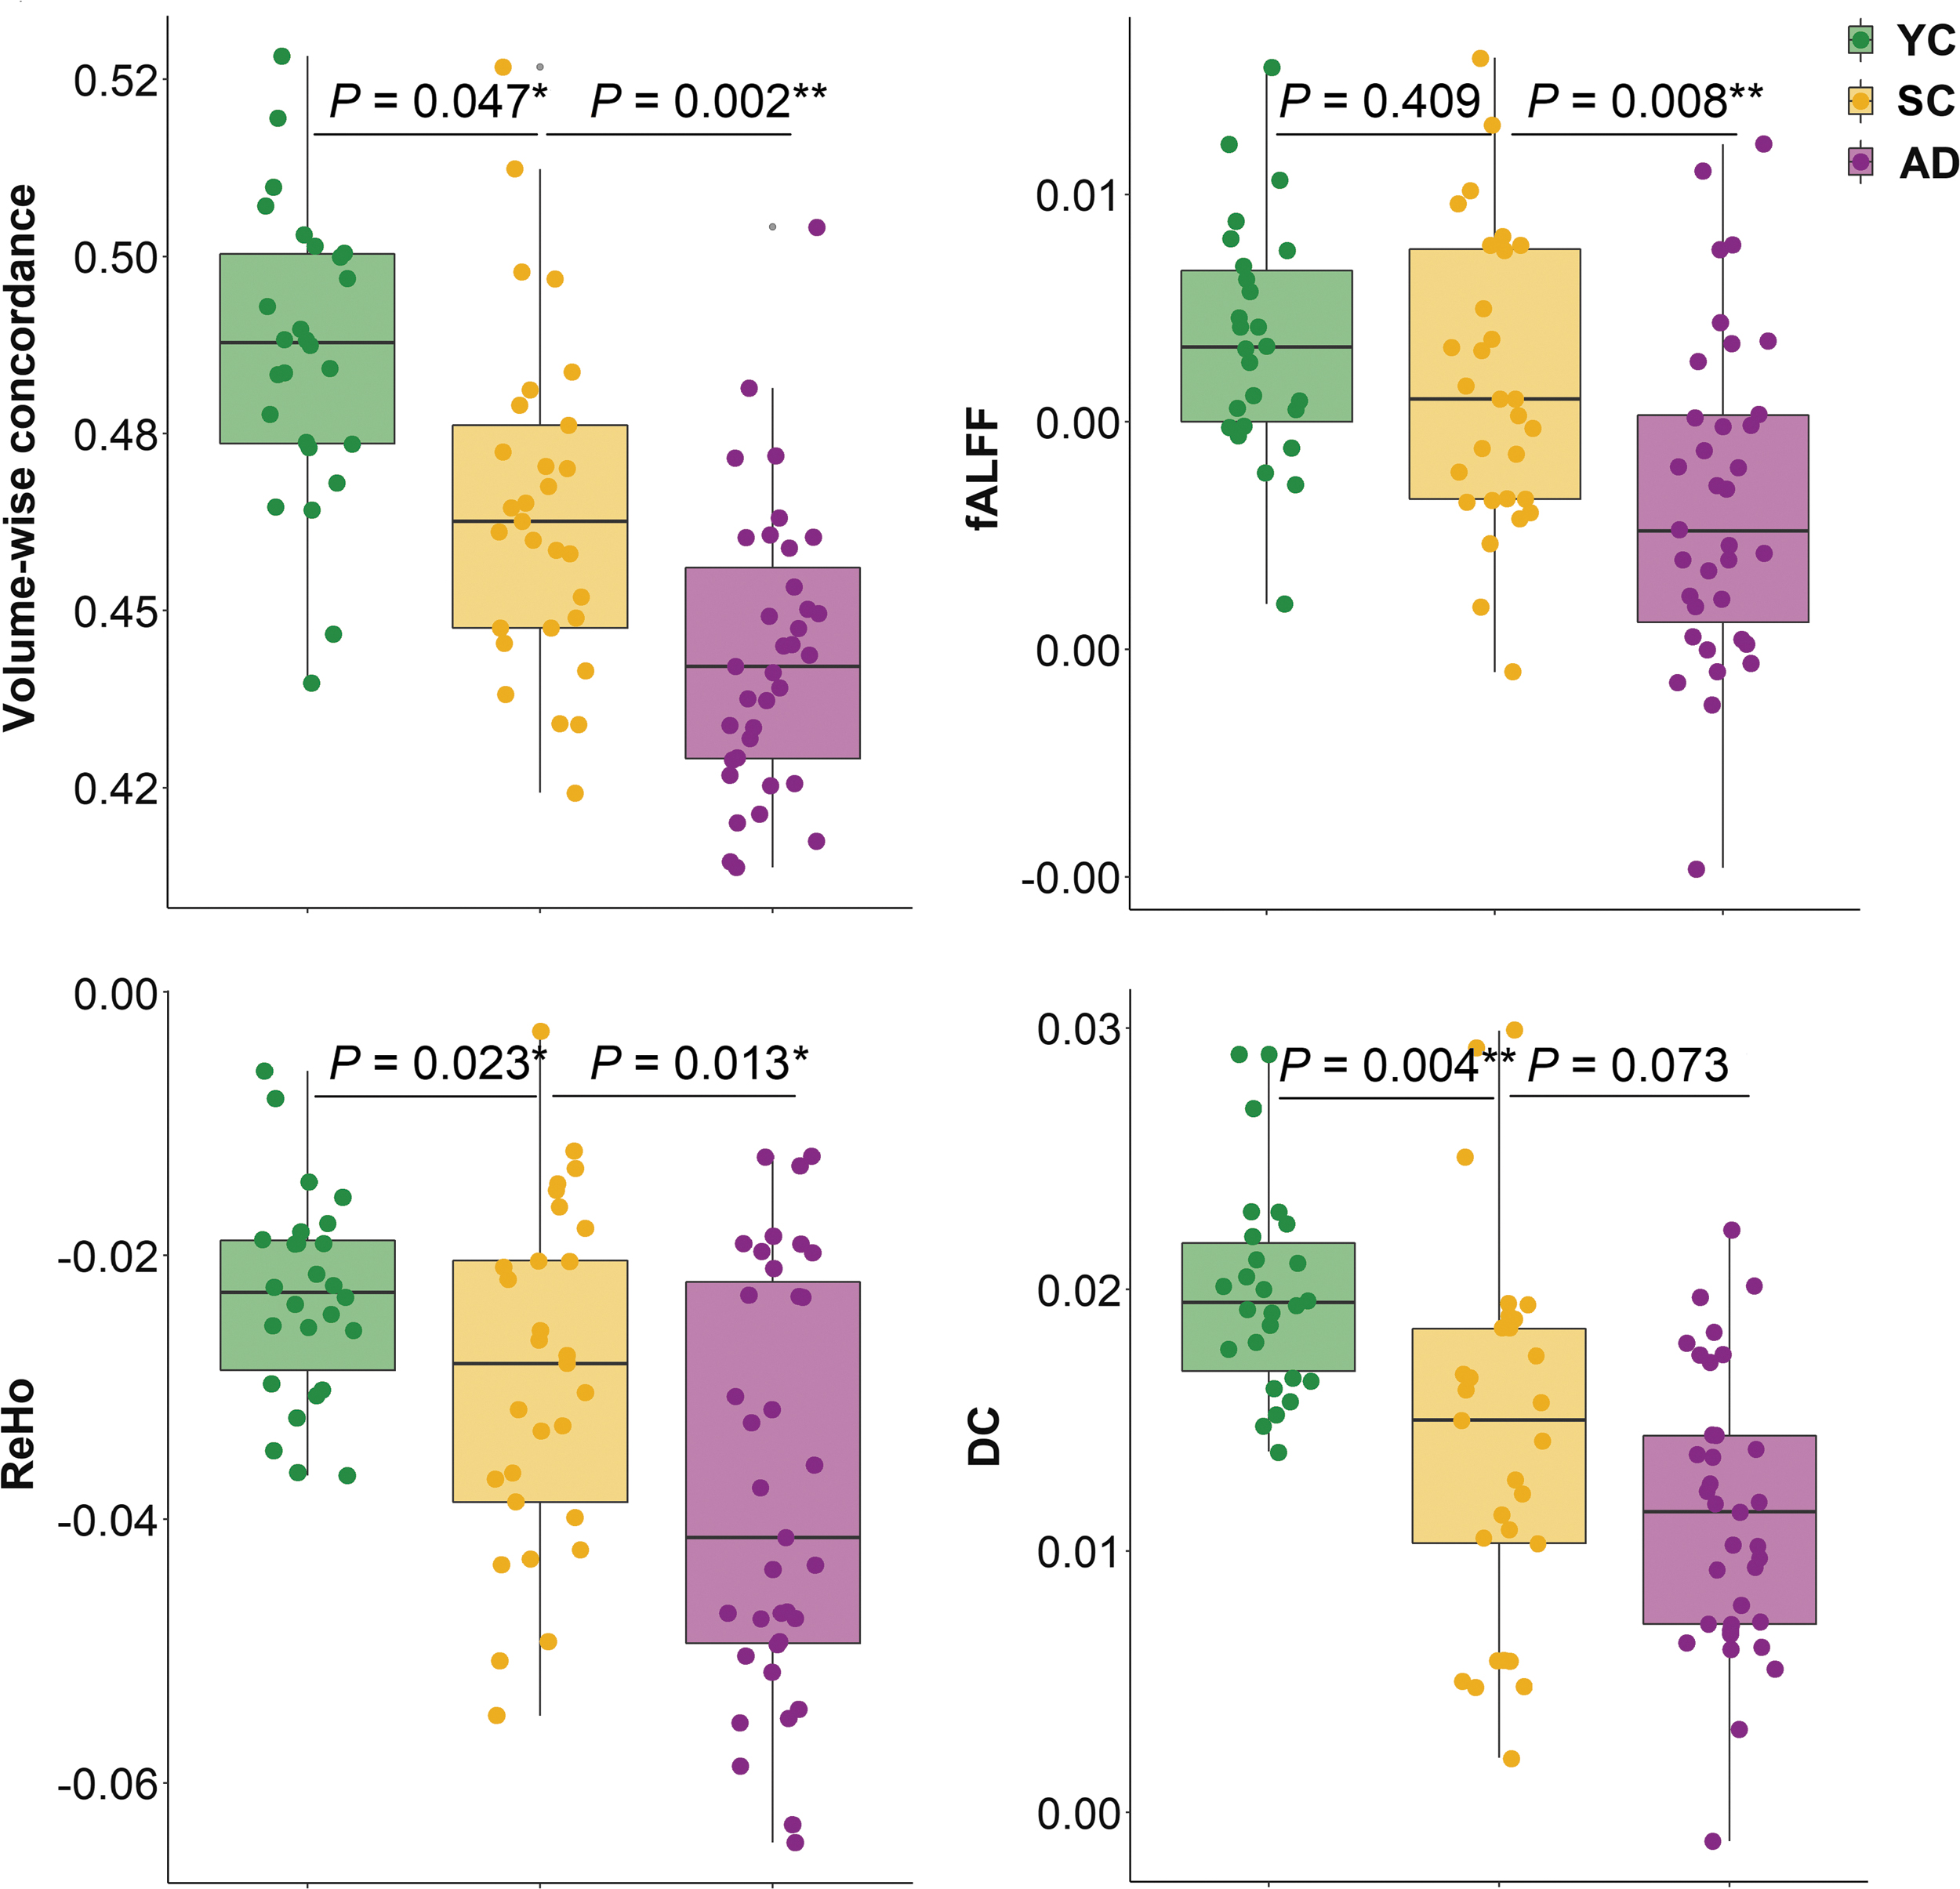
Whole brain volume-based analyses. Group comparisons were adjusted for age, sex, and FD by ANCOVA. Comparisons of YC versus SC were adjusted for sex and FD by ANCOVA. Comparisons of SC versus AD were adjusted for age and FD by ANCOVA. *p < 0.05, **p < 0.01. AD, Alzheimer's disease; ANCOVA, analyzing covariance; DC, degree centrality; fALFF, fractional amplitude of low-frequency fluctuations; FD, frame-wise displacement; ReHo, regional homogeneity; rs-fMRI, resting-state functional magnetic resonance imaging; SC, healthy senior controls; YC, healthy young controls; the abbreviations for subjects and rs-fMRI indices will be used in the same way in all following figures.
Network-based analyses
Network-based comparisons by MANCOVA exhibited significant group differences of volume-wise concordance in six of the seven neural networks defined by Yeo et al. (2011), with the limbic network as an exception. A comparison of the estimated marginal means showed that the least concordance was in the AD group for each of the seven networks. Post hoc tests showed significantly lower concordance in AD patients compared to SC (p range <0.001–0.063). In contrast, no differences were found between YC and SC in any of the seven networks when comparing the volume-wise concordance (p range: 0.192–1.000) (Table 2 and Fig. 2).
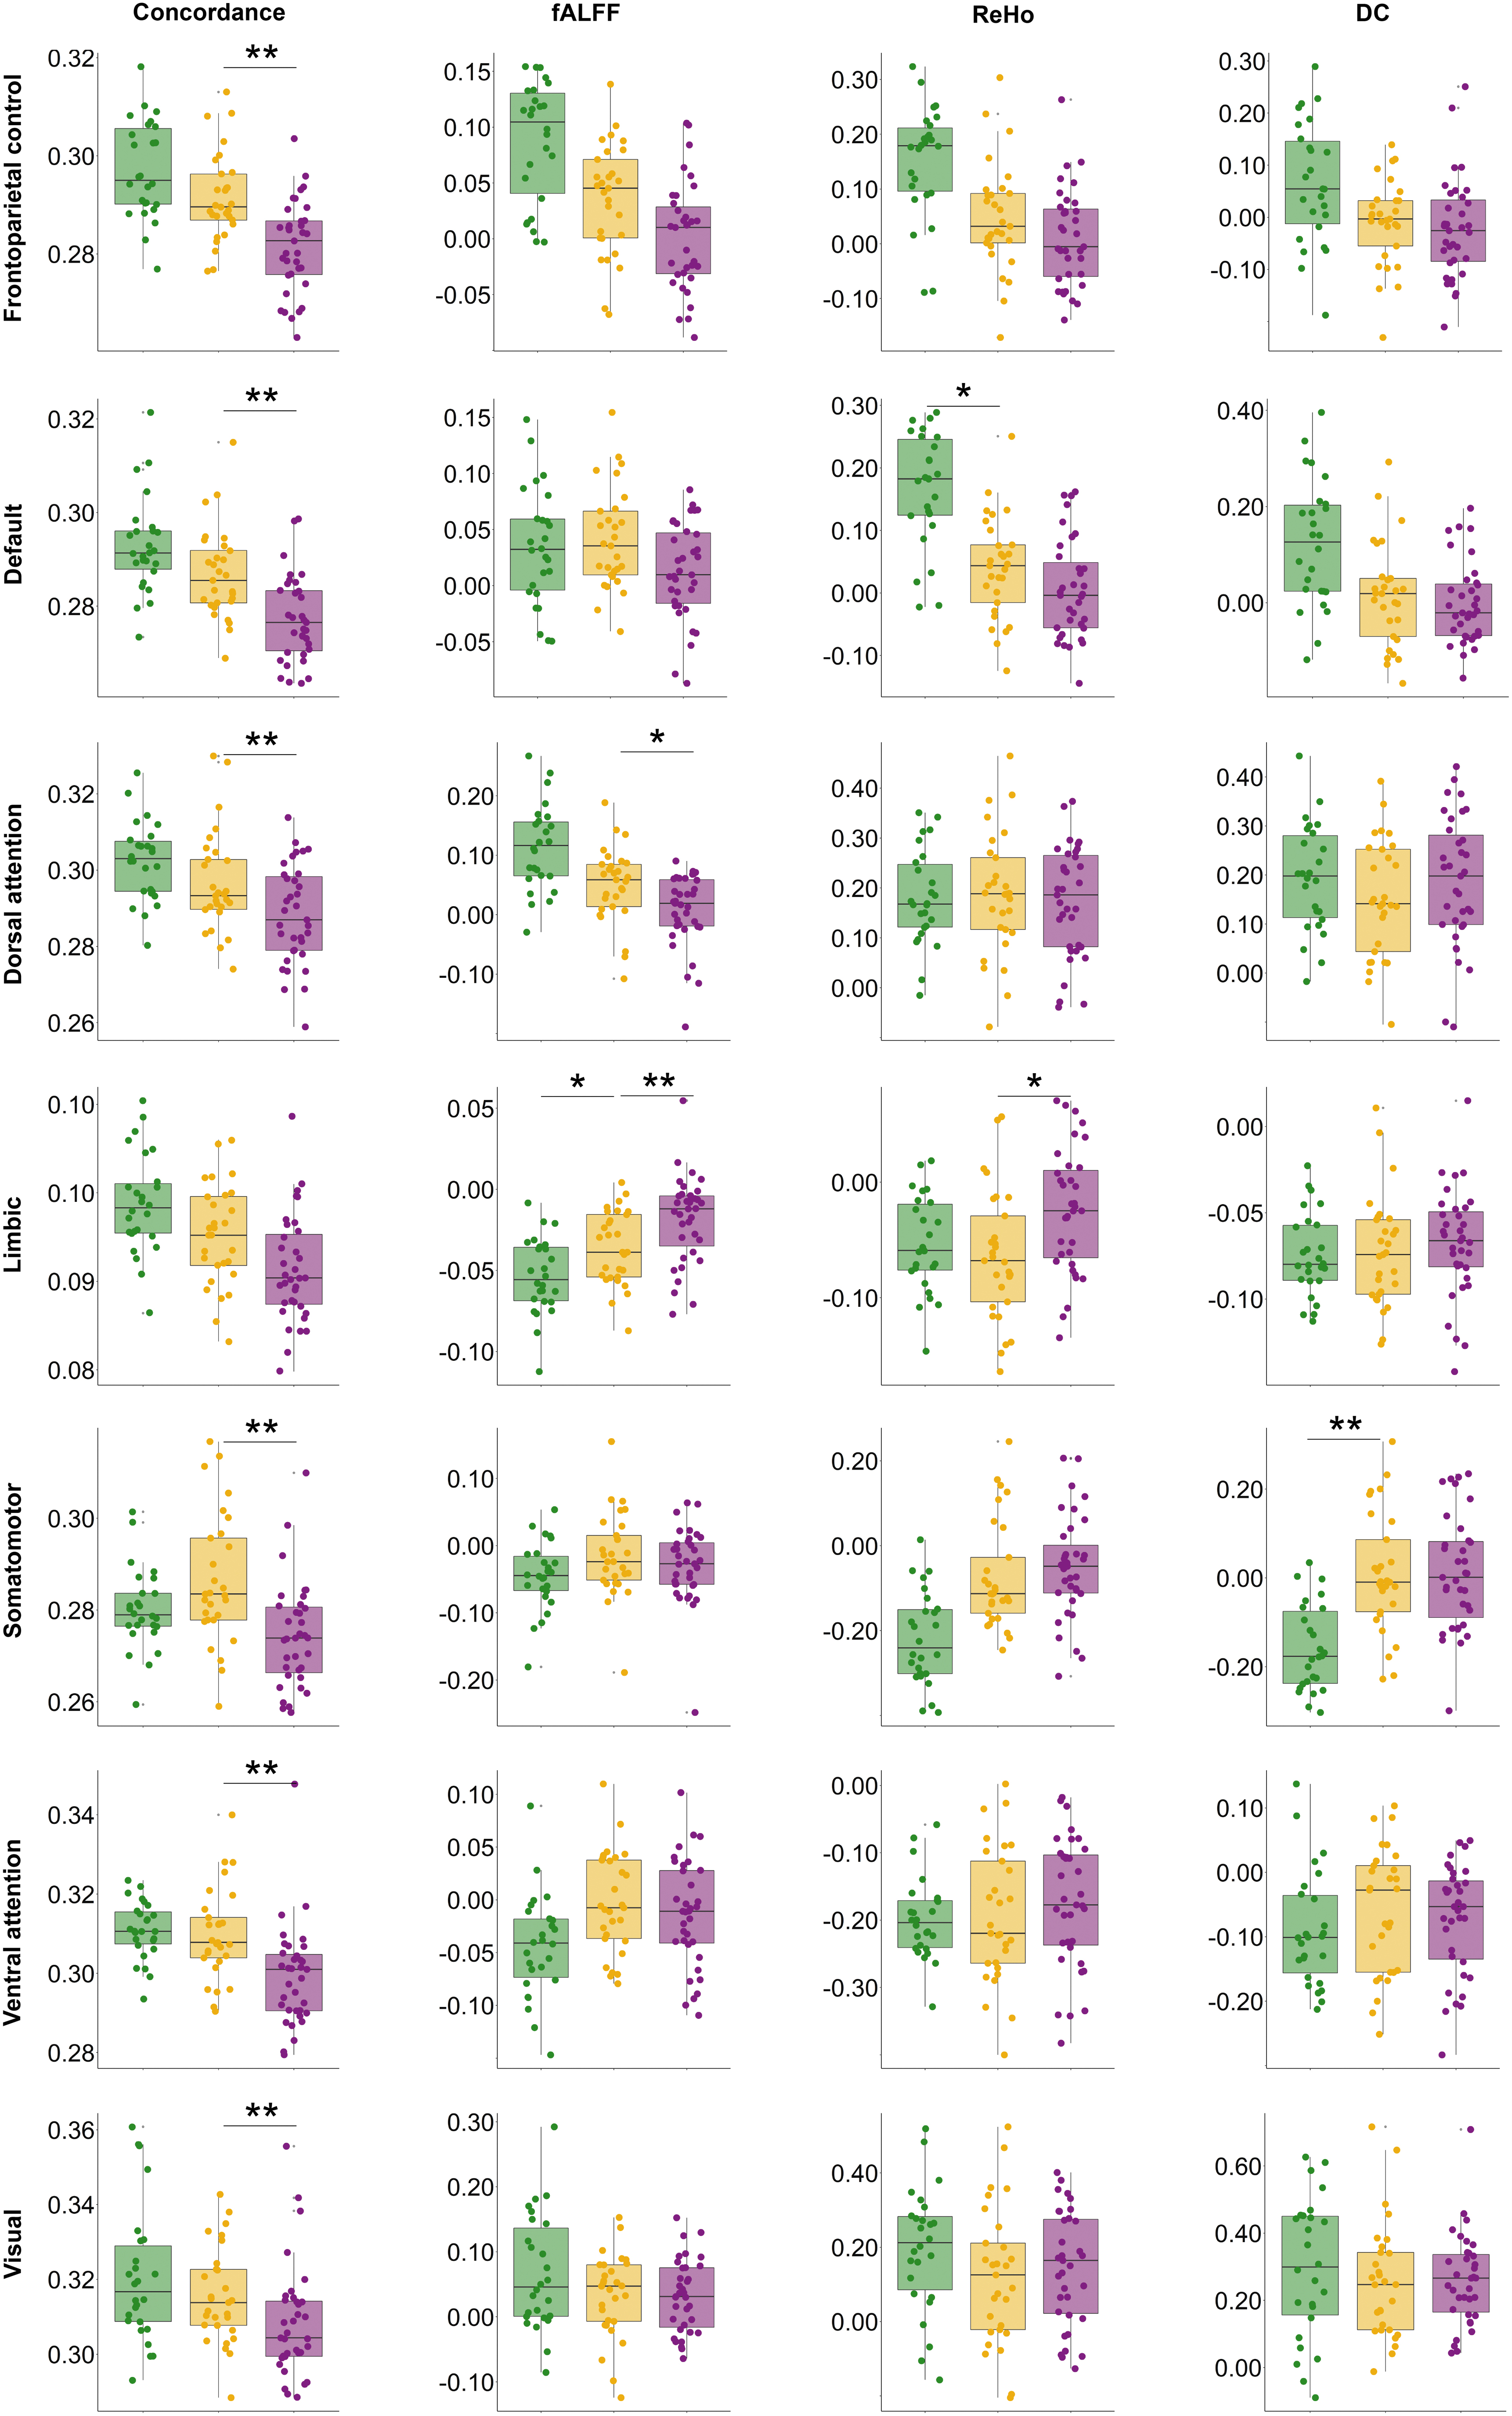
Network-based analyses for concordance and single metrics of fALFF, ReHo, and DC in YC (green), SC (yellow), and AD (purple). Group comparisons were adjusted for age, sex, and FD by MANCOVA. Post hoc tests of YC versus SC and SC versus AD were adjusted for age (SC vs. AD), sex, and FD. *p < 0.05, **p < 0.01. MANCOVA, multivariate analyzing covariance.
Network-Level Group Differences Based on Different Measurements
p Values were obtained by Bonferroni-corrected post hoc tests of multivariate ANCOVA adjusting for sex and FD.
p Values were obtained by Bonferroni-corrected post hoc tests of multivariate ANCOVA adjusting for age, sex, and FD.
p Values were obtained by multivariate ANCOVA adjusting for age, sex, and FD. η2 p indicated the effect size as small 0.01, medium 0.06, and large 0.14.
ANCOVA, analyzing covariance; DC, degree centrality; fALFF, fractional amplitude of low-frequency fluctuations; ReHo, regional homogeneity.
In contrast, concerning the network comparisons by MANCOVA for single measures, except for the dorsal attention network in fALFF, limbic network in fALFF and ReHo, and the somatomotor network in DC, the three groups were generally comparable in the mean activity of each network (Table 2 and Fig. 2). The superiority of the volume-wise concordance over the single measurements in differentiating groups at the network level was confirmed by the repeated measures ANCOVA. There was a statistically significant interaction [F (2.9, 84) = 7.926, p < 0.001, η2 p = 0.159] between the within-subjects factor measurement (volume-wise concordance, fALFF, ReHo, and DC) and the between-subject factor group (YC, SC, and AD). Further contrast analyses showed that volume-wise concordance better differentiated between the groups compared to the single measures [concordance vs. fALFF: F (2, 84) = 6.767, p = 0.002, η2 p = 0.139; concordance vs. ReHo: F (2, 84) = 8.352, p < 0.001, η2 p = 0.166; concordance vs. DC: F (2, 84) = 10.337, p < 0.001, η2 p = 0.198].
Global distribution of voxel-wise concordance
The distribution patterns of voxel-wise concordance maps indicated high similarity among groups. Generally, cortical and subcortical gray matter regions exhibited high concordance, and the posterior areas showed higher concordance than the anterior part of the brain, as shown in Figure 3.
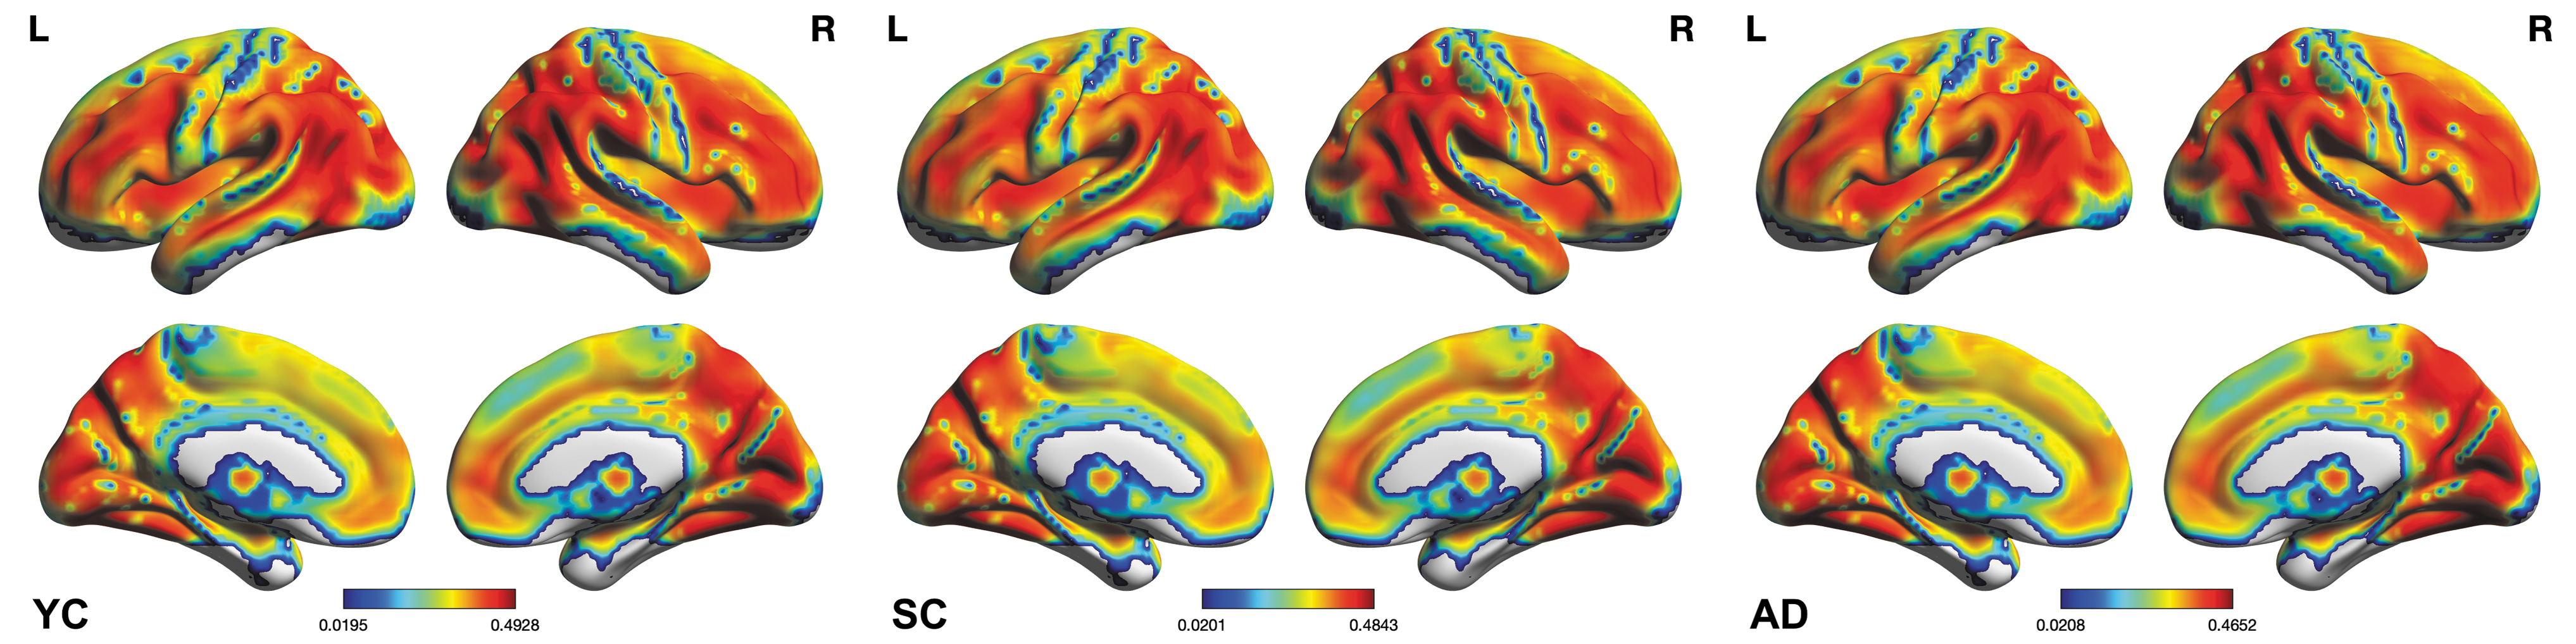
Group averages of voxel-wise concordance, expressed as Kendall's W and overlayed on a group-specific customized template.
Voxel-wise analyses of group differences
Voxel-wise concordance analyses (Table 3 and Fig. 4) revealed significant between-group differences in two brain regions: the right middle temporal gyrus (rMTG) and the left precentral gyrus. Further post hoc comparisons showed a concordance reduction in the rMTG in AD patients compared with SC and a reduced concordance in the left middle frontal gyrus (lMFG) for SC compared to YC (pFWE <0.05).
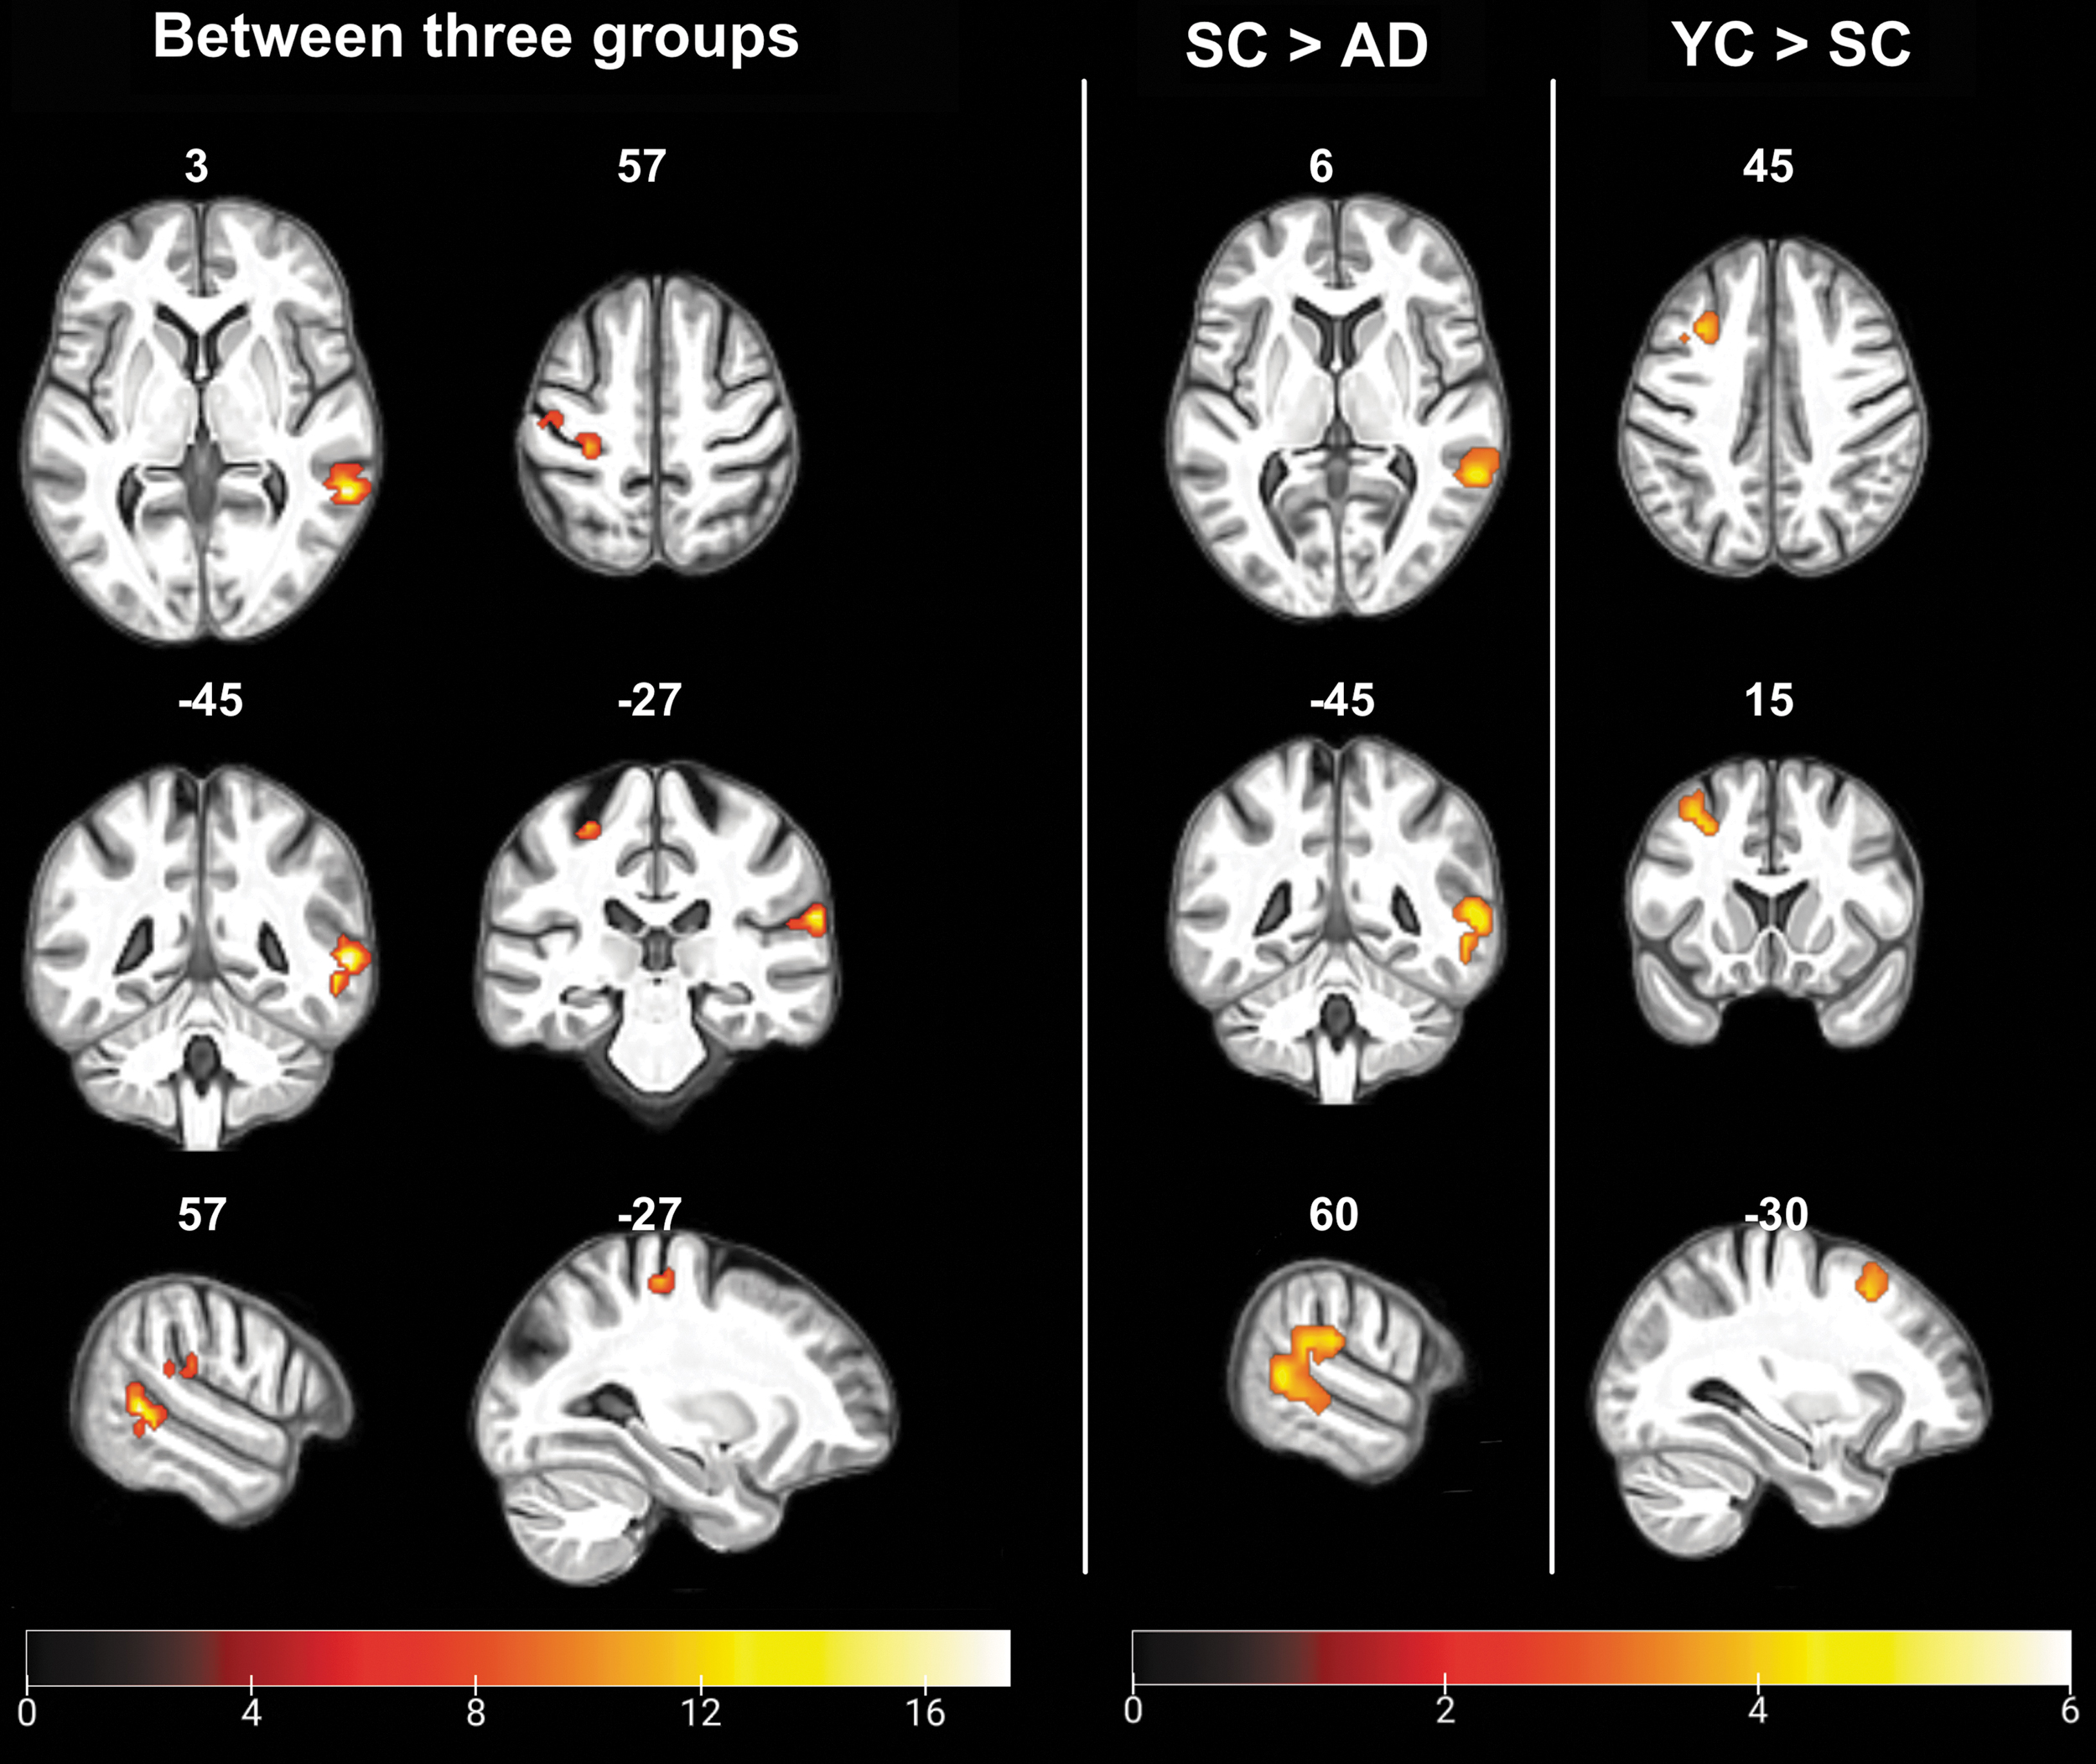
Group differences in the concordance of rs-fMRI metrics. The ANCOVA across all three groups was adjusted for gray matter, age, sex, and FD, pFWE <0.05. Comparisons between SC and AD and YC and SC were Bonferroni-corrected post hoc tests of the ANCOVA, adjusted for gray matter, age (SC vs. AD), sex, and FD, pFWE <0.05. Clusters with significant differences between three groups: the right middle temporal gyrus and the left precentral gyrus; SC > AD: the right middle temporal gyrus; YC > SC: the left middle frontal gyrus. Illustrations were based on a group-specific template generated by averaging skull-stripped and spatially normalized brain templates of all subjects. FWE, family-wise error.
Differences in Voxel-Wise Concordance Between Groups
ANCOVA adjusted for gray matter, age, sex, and FD, pFWE <0.05.
Post hoc tests of ANCOVA adjusted for gray matter, age, sex, and FD.
Post hoc tests of ANCOVA adjusted for gray matter, sex, and FD.
FWE, family-wise error; MNI, Montreal Neurological Institute.
Voxel-wise differences of single measures
Correcting for voxel-wise gray matter volume, age, sex, and FD, we found significant group differences for fALFF and DC, but not ReHo (Table 4 and Fig. 5). fALFF of the right temporal pole and the right angular gyrus were significantly different across the three groups. Pairwise post hoc analyses indicated decreased fALFF of the right angular gyrus for AD patients compared to SC. For SC, fALFF were decreased in the right superior parietal gyrus and the left superior parietal gyrus and increased in the right hippocampus, the left amygdala, and the right supplemental motor area compared to the YC. Analysis of DC exhibited a significant between-group difference in the left postcentral gyrus. However, a post hoc comparison between SC and AD did not show significant DC differences. Compared to YC, SC demonstrated a decrease in the left precentral gyrus and right frontal pole and an increase in the left postcentral gyrus and the vermis.
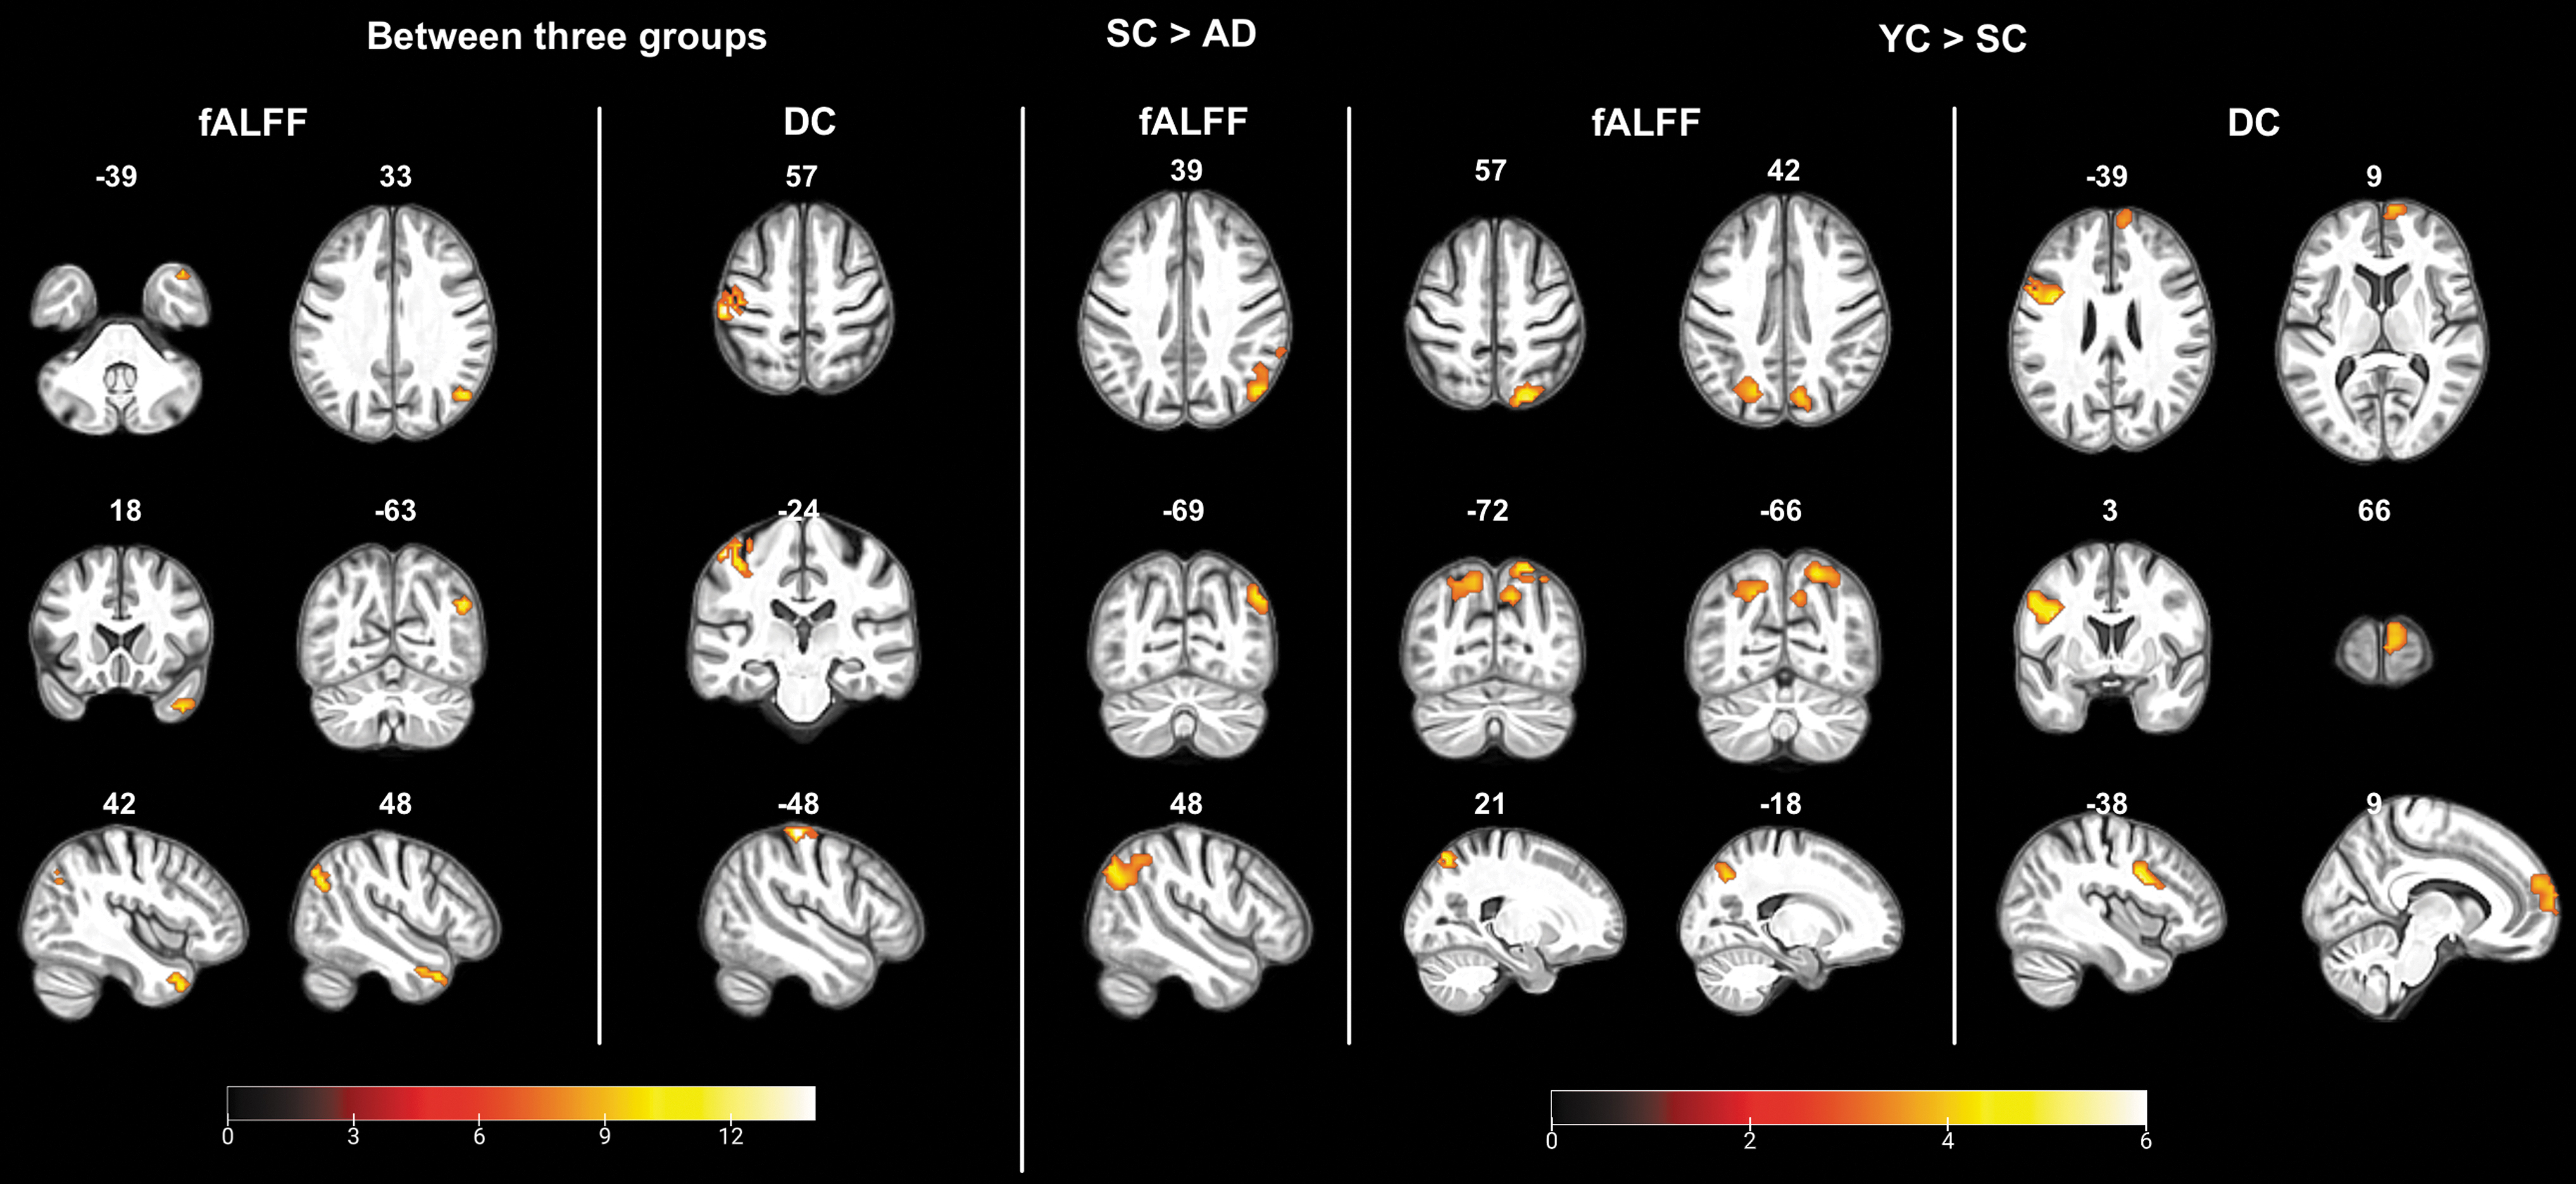
Group differences in fALFF and DC. The ANCOVA across all three groups was adjusted for gray matter, age, sex, and FD, pFWE <0.05. Comparisons between SC and AD and YC and SC were Bonferroni-corrected post hoc tests of the ANCOVA adjusted for gray matter, age (SC vs. AD), sex, and FD, pFWE <0.05. Illustrations were based on a group-specific template generated by averaging skull-stripped and spatially normalized brain templates of all subjects.
Voxel-Wise Comparisons of Group Differences by Single Measures
ANCOVA adjusted for gray matter, age, sex, and FD, pFWE <0.05.
Bonferroni-corrected post hoc tests of ANCOVA adjusted for gray matter, age, sex, and FD, pFWE <0.05.
Bonferroni-corrected post hoc tests of ANCOVA adjusted for gray matter, sex, and FD, pFWE <0.05.
NA, not applicable.
Discussion
In this study, we investigated the applicability of a recently proposed index of resting brain activity, assessing the concordance of the most frequently used voxel-wise metrics of fALFF, ReHo, and DC in cohorts of YC, SC, and AD patients. Our findings indicate that the concordance was decreased on the global, network, and voxel-wise levels in AD patients. Besides, there was also a globally lower concordance in healthy aging compared to the young controls. This effect was distinct from the AD group showing no concordance differences on the network level and a different spatial pattern of lower concordance in mainly frontal instead of temporal regions. Furthermore, the concordance index was more sensitive in differentiating age-related from AD-related functional brain changes. Although whole-brain functional decreases were observed across the individual metrics on the global level (i.e., fALFF, ReHo, and DC), network-based and voxel-wise analyses were less sensitive to group differences.
The whole-brain volume-wise concordance showed a downward trend from YC, SC to AD. This suggests that the concordance reflects brain vulnerability due to aging and AD, an age-related neurodegenerative disease. Specifically, by comparing YC with SC, the lower concordance observed in the aging population was in accordance with the previous observation that this index is negatively correlated with age (Yan et al., 2017). The decrease in global concordance was even more pronounced in AD patients, in line with the observation of globally disrupted functional connectivity when assessing the three metrics individually.
A reduction of concordance in AD patients compared to healthy seniors was observed in six out of seven investigated networks. Network abnormalities have been proposed as a potential mechanism underlying AD-related cognitive decline (Palop and Mucke, 2016). In a longitudinal cohort, lower connectivity in the default, control, and salience networks at baseline, both alone and interacting with the amyloid burden, predicted the decline in pre-clinical AD cognitive composite performance (Buckley et al., 2017). Besides, it has been suggested that even healthy aging impacts the brain networks, most remarkably the default mode network (Sala-Llonch et al., 2015). In our study, in SC compared to YC, no network-level concordance differences were detected, as opposed to a significant group difference in the global whole-brain analysis. One might speculate that globally, that is, across the entire brain, even smaller effects—undetected by the analysis of single networks—add up and reach significance. The most parsimonious explanation for the absence of a difference between SC and YC, and the striking difference between AD and SC, is that the concordance between measures of resting-state activity changes more diffusely with age and more network specific with AD.
Distinct temporal properties accompanied these spatial differences. Recent evidence suggests a dynamic spatial pattern of functional connectivity during fMRI acquisition (Filippi et al., 2019). Accounting for these spatiotemporal dynamics, voxel-wise concordance detects coupling fluctuations within subportions of time series (Yan et al., 2017). Either by comparison across the three groups or between AD and SC, the rMTG was consistently revealed as affected in AD. Decreased fALFF and ReHo in the rMTG have previously been reported in patients with AD and amnestic mild cognitive impairment (Cha et al., 2015; Zhen et al., 2018). Likewise, this region was detected as a crucial hub disrupted in AD (Gupta et al., 2020), along with a regional irregularity indicated by higher entropy (Xue et al., 2018). Reduced regional cerebral blood flow (Zheng et al., 2019) and deposition of amyloid β (Kang et al., 2017) and tau (Hansson et al., 2017) in the rMTG may constitute the underlying pathophysiological mechanism(s). In comparison between SC and YC, there was a lower voxel-wise concordance in the lMFG. This area plays an essential role in age-related changes in attentional processing, with higher activity in younger subjects (Thomsen et al., 2004). Furthermore, previous findings indicated attenuated functional connectivity of the lMFG with healthy aging (Hafkemeijer et al., 2012; Hu et al., 2014; Yang et al., 2013). According to a recent longitudinal study in cognitively normal older adults, the lMFG's functional connectivity plays a compensatory role for the amyloid load but could lead to a more rapid accumulation of amyloid in the long term (Lin et al., 2020). The regional specificity of this concordance difference between AD and aging warrants further exploration.
In contrast to the overall similarities of the global-level comparisons, our analyses demonstrated substantial differences at the network and voxel level. The significant differences in concordance were widespread, affecting six out of seven networks. In addition, an interaction analysis suggested that network-based concordance differentiates the groups better than any individual static measures with medium to large effect sizes (η2 p range: 0.133–0.175). Thus, concordance was a more sensitive marker of between-network differences, possibly because of the combined assessment of local and distant effects with concordance, which reflected network-based spatial decoupling in AD. Similar functional isolation has previously been described in the aging hippocampus in the presence of tau pathology (Harrison et al., 2019). Further work may shed light on the pathological drivers of the interrupted concordance in AD. Of note, when analyzing the difference in each of the seven networks between groups, the limbic network was exclusively significant for fALFF and ReHo, but its significance was absent when using the concordance index. Despite previous findings of heightened connectivity in this network for mild cognitive impairment (Badhwar et al., 2017), it should be pointed out that the reliability of detected signals in the limbic network is limited. The temporo-polar and orbital frontal regions composing the limbic network are affected by MR susceptibility effects, leading to spatial distortion and reduced signal-to-noise ratio.
On a voxel-by-voxel basis, both concordance and fALFF were able to differentiate AD from SC. The identified clusters, although spatially heterogeneous at the anatomical level, were within the default mode network. This finding aligns with the literature reporting consistent hypoconnectivity in the default mode network of AD (Badhwar et al., 2017). It is worth mentioning that the single metrics varied in their power to detect voxel-wise functional alterations in the AD group. Unlike the previous finding that different rs-fMRI approaches (ALFF, fALFF, ReHo, and global brain connectivity) were just slightly different in the spatial patterns in AD patients compared with healthy subjects (Cha et al., 2015), our cohort exhibited no significant group difference between AD and SC in ReHo or DC. Using fALFF, we observed a lower strength of intrinsic brain activity in the right angular gyrus in AD. This region also showed a decrease in the prodromal stage of AD in a meta-analysis (Lau et al., 2016), yet abnormal fALFF were also reported in other regions of, for example, posterior cingulate cortex/precuneus, the middle temporal gyrus, and the parahippocampal gyrus (Cha et al., 2015; Lau et al., 2016; Marchitelli et al., 2018; Yang et al., 2018). The present results imply that caution is warranted when selecting an individual metric or comparing different metrics across studies.
Several limitations should be considered in terms of interpreting the findings. First, there were imbalances across groups in age (Yan et al., 2017), sex (Cavedo et al., 2018), and head motion (Satterthwaite et al., 2019), factors previously reported to affect rs-fMRI measures. To account for these potential biases, we rigorously included these covariates in each analysis. Second, the AD group was heterogeneous concerning disease severity and staging. To account for this putative confound, we represented the pathophysiological processes by thoroughly incorporating AD biomarkers in the diagnostic and inclusion criteria. The decrease of the concordance index associated with disease progression and healthy aging warrants further investigation (Oschmann and Gawryluk, 2020). Third, only three rs-fMRI metrics were selected in our approach as our main goal was to explore the new index of brain activity in AD and compare it to more well-established metrics representative of single-voxel activity and regional and global connectivity. In addition, the combination of fALFF, ReHo, and DC has been previously used by several groups to encompass different aspects of brain connectivity (Aiello et al., 2015; Al-Zubaidi et al., 2018; Takeuchi et al., 2017). However, which combination of measures offers the most significant benefit remains to be elucidated.
Further research may contribute toward a better understanding of the pathophysiological mechanisms affecting the concordance. Finally, although lower functional concordance was observed in our AD group, and in patients with ASD (Lu et al., 2018), schizophrenia (Zhu et al., 2018), and MDD (Zhu et al., 2019), the sensitivity and specificity of this candidate biomarker and whether it is a shared feature across a range of neuropsychiatric disorders remain unclear and warrant further investigation.
Conclusions
In this study, we observed that a decrease of concordance among commonly used rs-fMRI metrics was consistently observed in AD rather than in aging. Data suggest that a decreased concordance represents an AD-specific aberration of intrinsic connectivity. By comparison, the rs-fMRI metrics of fALFF, ReHo, and DC varied in their capacity to identify disturbed functional connectivity at both network and voxel levels. Therefore, the newly proposed concordance may constitute a more sensitive imaging marker than individual rs-fMRI metrics, and studies based on multiple metrics may benefit from the inclusion of concordance.
Footnotes
Acknowledgments
The authors thank all participants of this study. X.C. gratefully acknowledges the support from the China Scholarship Council to pursue this study in Germany.
Authors' Contributions
Study conception and design: all. Acquisition, analysis, and interpretation of data: all. Article drafting: X.C., J.D., O.A.O. Critical revision of the article for important intellectual content: all.
Author Disclosure Statement
No competing financial interests exist.
Funding Information
G.R.F., J.K., and O.A.O. were supported by the Marga and Walter Boll-Foundation.