
Abstract
Introduction:
Dynamic functional connectivity (dFC) allows capturing recurring patterns (states) of interaction among functional networks. In this study, we investigated resting state (RS) dFC abnormalities across the different clinical phenotypes of multiple sclerosis (MS) and assessed their correlation with motor and cognitive performances.
Methods:
RS functional magnetic resonance imaging (fMRI) and 3D T1-weighted MRI data were acquired from 128 MS patients (69 relapsing-remitting [RR] MS, 34 secondary progressive [SP] MS, and 25 primary progressive [PP] MS) and 40 healthy controls (HC). RS fMRI data underwent independent component analysis and sliding-window correlations, to identify recurring dFC states and between-group dFC differences in the main networks.
Results:
dFC identified three recurring connectivity states: State 1 (frequency of appearance during fMRI acquisition = 57%, low dFC strength), State 2 (frequency = 19%, middle-high dFC strength), and State 3 (frequency = 24%, high sensorimotor and visual dFC strength). Compared to HC, MS (as a whole), RRMS, and PPMS patients exhibited lower State1/State 3 dFC (p = 0.0001, corrected) between sensorimotor, cerebellar, and cognitive networks, and some dFC increments (p = 0.001–0.05, uncorrected) in sensorimotor, visual, default-mode, and frontal/attention networks in States 2 and 3. Similar results were observed in SPMS versus RRMS patients. In MS, dFC decrease in sensorimotor, default-mode, and frontal/attention networks was correlated with worse motor and cognitive performances.
Conclusions:
MS patients exhibited overall lower dFC, and marginally higher dFC in sensorimotor/cognitive networks in the less-frequent middle/high-connected States. dFC abnormalities became more severe in progressive MS and correlated with motor and cognitive impairment, suggesting the presence of maladaptive mechanisms concomitant with accumulation of damage.
Impact statement
This is the first study exploring reorganization of dynamic functional connectivity in patients with multiple sclerosis (MS) across the main clinical phenotypes of the disease. Here, we demonstrated abnormalities of connectivity dynamism, which were present at all disease stages, but became more severe in progressive MS and correlated with worse motor and cognitive performances. These findings suggested that progressive MS patients might experience a maladaptive neuronal response to transient loss of dynamic coordination and flexibility among sensory and cognitive brain regions, leading to the progression of clinical impairment.
Introduction
Multiple sclerosis (MS) is an inflammatory and neurodegenerative condition of the central nervous system. MS patients are characterized by a high heterogeneity of clinical disability and cognitive impairment, according to their disease clinical phenotype (Filippi et al., 2018). Resting state (RS) functional magnetic resonance imaging (fMRI) studies described functional connectivity (FC) abnormalities in motor and cognitive networks in the main MS clinical phenotypes (Fuchs et al., 2019; Rocca et al., 2018; Sbardella et al., 2015). However, functional plasticity mechanisms occurring in MS are still largely debated, and different trajectories have been described across patients with similar clinical phenotypes (Fuchs et al., 2019; Rocca et al., 2018; Sbardella et al., 2015).
Classically, the wide spectrum of clinical characteristics of MS patients has been hypothesized as one of the principal contributors to the described discrepancies. However, novel RS FC methodologies may also contribute to capture aspects of MS-related functional reorganization not detected by traditional approaches.
A novel method called dynamic functional connectivity (dFC) (Allen et al., 2014; Calhoun et al., 2014) has been developed, allowing to investigate changes in brain functional connections that occur within seconds. Within this framework, RS FC is usually quantified on different portions of RS fMRI data by shifting a window of fixed length over RS fMRI time series. RS FC within all windows is then used to quantify global variability over time, and to identify recurring FC patterns between the main networks of the brain (Calhoun et al., 2014). dFC contributed to provide information on intrinsic brain functional organization that complements data from traditional, static FC (sFC) analysis, both in healthy subjects and diseased conditions (Valsasina et al., 2019).
To date, a couple of studies have already applied this approach in MS (Bosma et al., 2018; d'Ambrosio et al., 2020; Huang et al., 2019; Leonardi et al., 2013; Lin et al., 2018; Rocca et al., 2020; van Geest et al., 2018a,b; Zhou et al., 2016). In clinically isolated syndrome patients, dFC dysfunctions showed a significant correspondence with clinical symptoms at disease onset (Rocca et al., 2020). Also, lower global dynamism and abnormal dFC properties in sensorimotor and default-mode network (DMN), cognitive, and relay brain areas were associated with higher tissue damage (d'Ambrosio et al., 2020; Huang et al., 2019; Rocca et al., 2020; Zhou et al., 2016), more severe clinical disability (Zhou et al., 2016), worse cognitive performance (van Geest et al., 2018a), and pain (Bosma et al., 2018). In addition, after action-observation training, higher dFC within sensorimotor and cognitive networks in relapsing-remitting (RR) MS correlated with significant improvement of motor performance (Cordani et al., 2021). Changes of dFC in progressive MS patients and their association with clinical and cognitive performances have been rarely investigated (van Geest et al., 2018b).
In this work, we hypothesized that tracking abnormalities of the main dFC states in distinct MS phenotypes may help to better characterize the evolving pattern of functional changes occurring in the brain across different MS stages. dFC analysis might be particularly suitable for this purpose, since the accumulation of motor and cognitive disability in MS is likely to be related to an impaired functional integration due to delayed communication between brain regions (Rocca et al., 2016). Moreover, we suppose that associating dFC abnormalities with clinical disability and cognitive impairment may help to better interpret the adaptive/maladaptive nature of brain functional reorganization. Against these hypotheses, the aim of this study was to investigate cross-sectional RS dFC abnormalities occurring across the different clinical phenotypes of MS and assess their correlation with motor and cognitive performances.
Materials and Methods
Standard protocol approvals, registrations, and patient consents
Approval was received from the local ethical standards committee on human experimentation (IRCCS Ospedale San Raffaele, Milan, Italy, protocol ID FISM2013/S/1) and written informed consent was obtained from all participants before study enrolment.
Participants, neurological and neuropsychological assessment
In this cross-sectional study, 128 MS patients and 40 healthy controls (HC) were enrolled between 2014 and 2016. Inclusion criteria were (i) to be relapse and steroid free for at least 3 months before MRI acquisition; (ii) have no other major systemic, psychiatric, or neurological disorders, including mood disorders; and (iii) have no significant medical illnesses or substance abuse that could interfere with MRI, motor or cognitive assessment. The final cohort included 69 RRMS, 34 secondary progressive (SP) MS, and 25 primary progressive (PP) MS (Polman et al., 2011). Forty sex-matched right-handed HC, with no previous history of neurological, psychiatric, or cardiovascular disorders, nor substance abuse, and a normal neurological examination were also enrolled.
In MS patients, a complete neurologic evaluation was performed, with the rating of the Expanded Disability Status Scale (EDSS) score (Kurtzke, 1983), the right 9-hole peg test (Cutter et al., 1999), and the timed 25-foot walk test (Kaufman et al., 2000). In HC, 9-hole peg and timed 25-foot walk tests were also assessed. Means and standard deviations (SDs) of such measures in HC were used to produce normalized z-scores of the 9-hole peg test and the timed 25-foot walk test for all study participants. Such scores were age adjusted by regressing out the independent effect of age, estimated by linear regression models in HC.
In MS patients, an expert neuropsychologist administered the Brief Repeatable Battery of Neuropsychological Tests (Rao et al., 1989) to assess verbal and visual memory (Selective Reminding Test and 10/36 Spatial Recall Test), speed of information processing (Symbol Digit Modalities Test), attention and concentration (Paced Auditory Serial Addition Test), and verbal fluency (Word List Generation) (Amato et al., 2006). Normalized z-scores for each test, and a global normalized z-score of cognitive function were calculated (Amato et al., 2006). Patients with at least two abnormal tests (defined as a z-score below 2 SDs of the age-, sex-, and education-adjusted Italian normative values) (Amato et al., 2006) were considered cognitively impaired.
MRI acquisition
Within 48 h from the clinical assessment, the following sequences of the brain were acquired from all study participants using a 3.0 Tesla Philips Achieva scanner (Philips Medical Systems, Eindhoven, The Netherlands): (i) T2*-weighted echo-planar imaging sequence for RS fMRI, used for sFC and dFC assessment (repetition time/echo time = 3000/35 ms; flip angle = 90°, 200 sets of 30 axial 4-mm-thick slices; matrix size = 128 × 128; and voxel size = 1.0 × 1.0 × 1.0 mm). Total acquisition time of the RS fMRI sequence was 10 min 3 sec. All participants were instructed to keep their eyes closed and remain motionless, without thinking anything in particular during scanning. No participant reported to have fallen asleep during scanning, according with a questionnaire delivered immediately after the MRI session; (ii) dual-echo turbo spin-echo sequence for T2-hyperintense lesion assessment (repetition time/echo time = 2599/16–80 ms, echo train length = 6; flip angle = 90°; matrix size = 256 × 256; field of view = 240 × 240 mm2; and 44 axial 3-mm-thick slices); and (iii) 3D T1-weighted fast field echo sequence for T1-hypointense lesion and atrophy assessment (repetition time/echo time = 25/4.6 ms; flip angle = 30°; matrix size = 256 × 256; field of view = 230 × 230 mm2; and 220 contiguous, axial slices with voxel size = 0.89 × 0.89 × 0.8 mm). For axial scans, the slices were positioned to run parallel to a line that joins the most inferoanterior and inferoposterior parts of the corpus callosum.
Structural MRI analysis
T2-hyperintense and T1-hypointense lesions were identified by an experienced observer, blinded to patients' identity, and lesion volumes were calculated using a local thresholding segmentation technique (Jim software version 7; Xinapse Systems, Colchester, United Kingdom). After T1-hypointense lesion refilling (Chard et al., 2010), normalized brain volume was assessed using the SIENAx software (Smith et al., 2002).
RS fMRI data pre-processing
Data processing was performed using a combination of toolboxes, as previously suggested (Allen et al., 2012). We performed rigid head motion correction using the appropriate tool of the SPM12 software and measured temporal signal-to-noise ratio (tSNR) on realigned scans to obtain a summary measure of image quality (Welvaert and Rosseel, 2013). Framewise displacement (FD) was also calculated for each study subject (Power et al., 2012). Then, RS fMRI data were despiked using AFNI3s 3dDespike algorithm to mitigate the impact of outliers and co-registered to the corresponding 3D T1-weighted scan. Using SPM12, data were subsequently warped to the Montreal Neurological Institute template, resampled to 2 mm3 isotropic voxels and smoothed to 6 mm full width at half maximum using AFNI3s BlurToFWHM algorithm (Friedman et al., 2008).
Group independent component analysis and selection of networks of interest
Pre-processed data from HC and patients were analyzed using spatial group independent component analysis (ICA), as implemented in the GIFT software (Calhoun et al., 2001; Erhardt et al., 2011), following three main steps: (i) data reduction, (ii) group ICA (repeated 20 times in ICASSO to ensure stability), and (iii) back reconstruction. The number of group independent components was set to 100, to ensure comparability of dFC analysis with previous studies (Allen et al., 2014; Damaraju et al., 2014; Nomi et al., 2016; Rashid et al., 2016).
Subject-specific spatial maps and time courses were back-reconstructed using the spatiotemporal regression approach (Calhoun et al., 2001; Erhardt et al., 2011). Visual inspection of the spatial patterns, a frequency analysis of the spectra of the estimated independent components, and a template-matching procedure [using the component provided by Allen and colleagues (2012) as reference templates] allowed the removal of components clearly related to artifacts, and the selection of 42 relevant independent components (rICs) of interest, which were assigned to the sensorimotor, DMN, frontal/attention, salience, executive, visual, temporal/auditory, and cerebellar networks (Fig. 1).
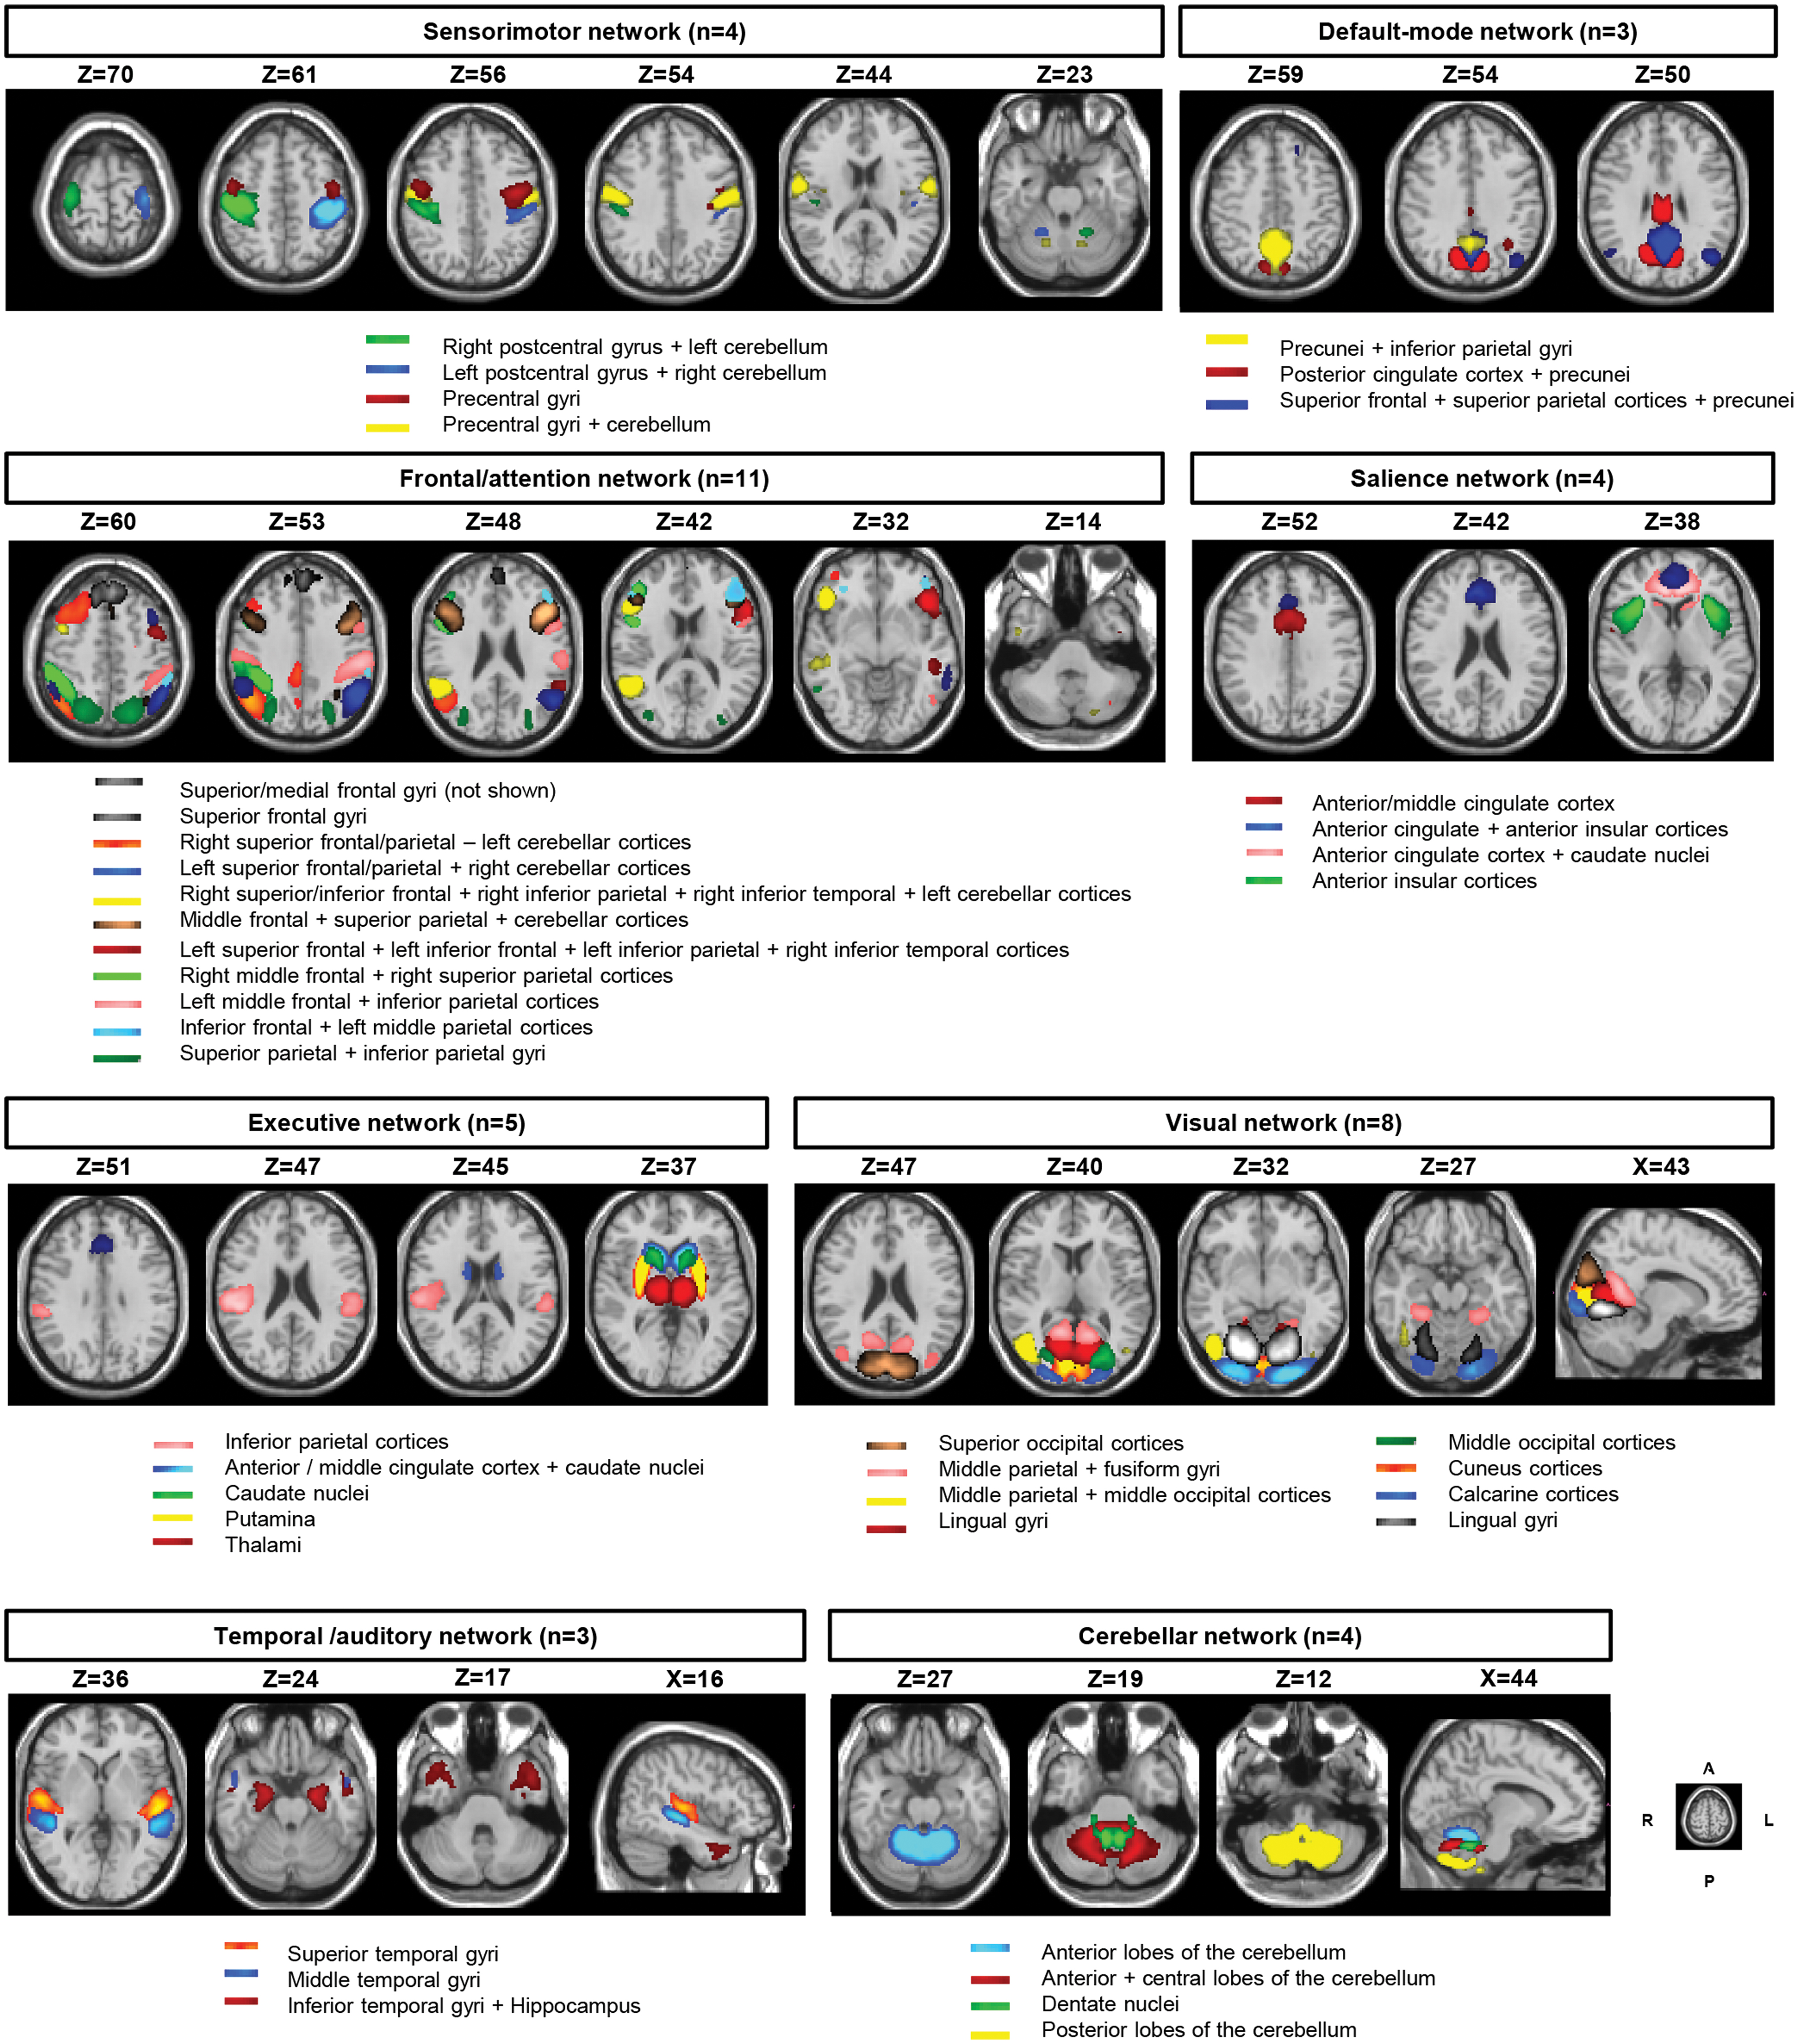
Composite map of the 42 rICs after the selection procedure (see text for further details), sorted into 8 subcategories: sensorimotor (4 components), default-mode (3), frontal/attention (11), salience (4), executive (5), visual (8), temporal/auditory (3), and cerebellar (4) networks. Each color in the composite map corresponds to a different rIC within a given subcategory. Each rIC was associated with a brain region according to the reference templates provided by Allen and colleagues (2012) as shown below each network. Images are presented in neurological convention. A, anterior; L, left; P, posterior; R, right. rICs, relevant independent components. Color images are available online.
Since correlation between brain networks is driven primarily by low-frequency fluctuations in blood-oxygen level-dependent fMRI data, we detrended (linear, quadratic, and cubic) (Allen et al., 2014) and band-pass filtered (0.01–0.15 Hz) (Cordes et al., 2001) the processed rIC time courses before computing sFC and dFC.
sFC analysis
We computed sFC, defined as the pairwise correlation between the whole rIC time courses, as a measure of average connectivity among different rICs during the entire duration of the scan. FD was included as a confounding covariate to mitigate the effect of micro-head movements (Satterthwaite et al., 2013). sFC correlation matrices computed for each participant were r-to-z Fisher transformed.
dFC analysis
As suggested by Allen and colleagues (2014), dFC between 2 rIC time courses was computed using a sliding window approach with a window size of 22 repetition times (66 sec) in steps of 1 repetition time. A rectangular window of 22 time-points convolved with a Gaussian of σ = 3 × repetition times was used for tapering along the edges. Covariance was estimated from the regularized inverse covariance matrix using the graphical LASSO framework. We imposed an additional L1 norm constraint on the inverse covariance matrix to enforce sparsity, as described elsewhere (Damaraju et al., 2014). dFC correlation matrices computed for each participant were r-to-z Fisher transformed.
Once sliding-window dFC matrices were obtained, dynamic connectivity properties were assessed using two approaches: the first was based on hard-clustering analysis (Allen et al., 2014), aimed at identifying the main recurring dFC states, and the second on the calculation of fuzzy meta-states, aimed at assessing global FC variability (Abrol et al., 2017): Hard-clustering analysis. This is a technique based on clustering of sliding-window connectivity matrices, which allows to identify dFC recurring states. dFC recurring states can be defined as patterns of average connectivity that are present with a certain temporal periodicity (recurrence) during the experiment. Clustering was performed using a k-means algorithm, which partitions the data into a set of separate clusters to maximize the correlation within a cluster to the cluster centroid (Allen et al., 2014). The selected optimal number of centroid states was 3, a number estimated using the gap and Silhouette methods, as implemented in GIFT. The frequency of recurrence of each dFC recurring state during the fMRI acquisition was also computed for each study participant (Allen et al., 2014). Fuzzy meta-state analysis. The hard-clustering analysis assumes that study participants are in a single connectivity state at a given time-point. A more flexible approach is to consider the possibility that multiple states (estimated using group temporal ICA) might be represented to varying extents in the same RS fMRI time-point. The contribution of each state for a specific time is characterized by a vector that is called a “meta-state” (Miller et al., 2016). Four global measures can be associated with these meta-states, and give an overall description of global connectivity dynamism: (i) the number of times that study participants switch from one meta-state to another; (ii) the number of distinct meta-states that participants occupy during their scans; (iii) the range of meta-states participants occupy; and (iv) the overall distance travelled by each participant through the state space (Miller et al., 2016).
Statistical analysis
Between-group comparisons of demographic, clinical, and structural MRI variables were performed using Pearson chi-square and Mann–Whitney U tests as appropriate (SPSS software, version 22.0). Normal distribution assumption was checked by means of Kolmogorov–Smirnov and Shapiro–Wilk tests. Skewed distributed variables were log-transformed before analyses.
Between-group comparisons of element-wise sFC and dFC strengths were assessed using SPSS and ANOVA models, including age and FD as nuisance covariates. Results were imported in Matlab and represented using color-coded scales (red-yellow and blue-light-blue, respectively) according to the direction of detected difference (Allen et al., 2012, 2014). Connectivity strength was compared between (i) MS patients and HC and (ii) patients with different clinical phenotypes. For this latter comparison, after F-testing of global heterogeneity, three post hoc contrasts were defined basing on the clinical evolution of the disease: (i) RRMS versus HC, (ii) PPMS versus HC, and (iii) SPMS versus RRMS. The main study results were assessed by correcting for the number of tested rICs (n = 42) using the false discovery rate approach (Benjamini, 1995). Post hoc phenotype comparisons of ANOVA models were also Bonferroni corrected for the number of subgroup comparisons (n = 3).
However, considering that a rigorous correction for multiple comparisons of mass-univariate dFC results is likely to be too conservative and may lead to the systematic suppression of any significant result (Zalesky et al., 2010), in line with several previous studies using the same technique (Allen et al., 2014; Bosma et al., 2018; Calhoun et al., 2014; d'Ambrosio et al., 2020; Huang et al., 2019; Leonardi et al., 2013; Lin et al., 2018; Rocca et al., 2020; van Geest et al., 2018a,b; Zhou et al., 2016), the main dFC results obtained at the uncorrected threshold were also presented.
Connectivity differences between groups were interpreted considering both the absolute strength and directionality of correlations between networks (Rocca et al., 2020). In other words, even if encoded by the same color from the two-sample t-test, increments of positive correlations (e.g., a change from 0.6 to 0.8) were considered connectivity increases, while reductions of negative correlations (e.g., a change from −0.8 to −0.6) were considered connectivity decreases. The same strategy was applied for interpreting increments of negative correlations and decrements of positive correlations.
Mann–Whitney U tests and two-sample t-tests were also applied to evaluate between-group differences of probability of transition between dFC recurring states and the four measures of global dynamism estimated by the meta-state analysis. Linear regression models were used to assess correlations (SPSS software, version 22.0), between (i) hard-clustering dFC strength abnormalities and clinical, neuropsychological, and MRI variables and (ii) fuzzy meta-state measures of global dynamism and clinical, neuropsychological, and MRI variables. FD was always included as confounding covariate in linear regressions. Age correction was also added to correlations with variables that were not adjusted for age (i.e., EDSS score, T2 and T1 lesion volumes, and normalized brain volume).
Sample size was determined to match previous studies, which have investigated cross-sectional fMRI changes in the different MS clinical phenotypes (Rocca et al., 2018).
Data generated or analyzed during the study are available from the corresponding author by request.
Results
Clinical and structural MRI measures
Table 1 summarizes the main demographic, clinical, neuropsychological, and MRI characteristics of study participants.
Main Demographic, Clinical, and Structural Magnetic Resonance Imaging Characteristics in Healthy Controls and Multiple Sclerosis Patients
Pearson chi-square test (gender and DMT variables) and Mann–Whitney U test (age, neurological, neuropsychological, and structural MRI variables) in MS patients versus HC and across the different MS clinical phenotypes (comparisons defined a priori, p < 0.05).
Cognitive z scores are corrected by education (SRT, SPART, SDMT, and PASAT) or sex (WLG) (Amato et al., 2006). Significant between-group differences are highlighted in bold.
9HPT, 9-hole peg test; 25FWT, timed 25-foot walk test; BRB-N, brief repeatable battery of neuropsychological tests; CI, cognitive impaired; CLTR, consistent long-term retrieval; CP, cognitive preserved; CYC, cyclophosphamide; DD, disease duration; DMF, dimethyl fumarate; DMT, disease-modifying treatment; EDSS, Expanded Disability Status Scale; FTY, fingolimod; GA, glatiramer acetate; HC, healthy controls; IFN, interferon; LTS, long-term storage; LV, lesion volume; MRI, magnetic resonance imaging; MS, multiple sclerosis; NBV, normalized brain volume; NTZ, natalizumab; PASAT, paced auditory serial addition test; PPMS, primary progressive MS patients; RRMS, relapsing-remitting MS patients; SD, standard deviation; SDMT, symbol digit modalities test; SPART, spatial recall test; SPMS, secondary progressive MS patients; SRT, selective reminding test; TFM, teriflunomide; WLG, word list generation test; z, normalized score.
Worse performances in motor tests and lower normalized brain volume were detected in MS patients, considered a whole, and in RRMS and PPMS patients versus HC. Compared to RRMS, SPMS had longer disease duration, worse performances in motor and cognitive tests, higher T2-hyperintense and T1-hypointense lesion volume, and lower normalized brain volume. Concerning RS fMRI data quality, average tSNR was 20.2 (SD = 5.6) in HC and 21.5 (SD = 6.2) in MS patients (p = 0.2). tSNR was not significantly different among MS phenotypes (p = 0.5) nor correlated with subjects' age (p = 0.1). Conversely, FD was higher (p = 0.003) in MS patients (mean FD: 0.18, SD = 0.10) than in HC (mean FD: 0.12, SD = 0.04).
sFC analysis
Average sFC correlation matrices from HC and MS patients and between-group differences in sFC strength are shown in Figure 2.

Intra- and inter-network sFC hard-clustering analysis:
At the corrected threshold, lower strength of inter-network sFC (p = 0.0001) was observed in MS patients versus HC between regions of the sensorimotor, DMN, frontal/attention, and salience, visual, temporal/auditory, and cerebellar networks. At the uncorrected threshold, higher inter-network sFC within the DMN, frontal/attention, temporal/auditory, as well as between the frontal/attention and executive, salience, and temporal/auditory networks (p = 0.01–0.03) was also detected. Decreased sFC in cerebellar, DMN, frontal/attention, and visual networks was also seen in RRMS and PPMS patients versus HC. SPMS patients had lower sFC strength (p = 0.003–0.04) in executive, DMN, and cerebellar networks and higher sFC (p < 0.001, corrected) mainly among frontal/attention, DMN, and salience networks versus RRMS.
dFC analysis
Hard-clustering analysis
Three dFC recurring states were identified in our study participants (Fig. 3): State 1 (frequency or appearance during the fMRI acquisition = 57%) was characterized by overall low strengths of inter-network dFC, State 2 (frequency = 19%) by middle-high strengths of inter-network dFC, and State 3 (frequency = 24%) by low strengths of inter-networks dFC, except within sensorimotor and visual networks (State 3).
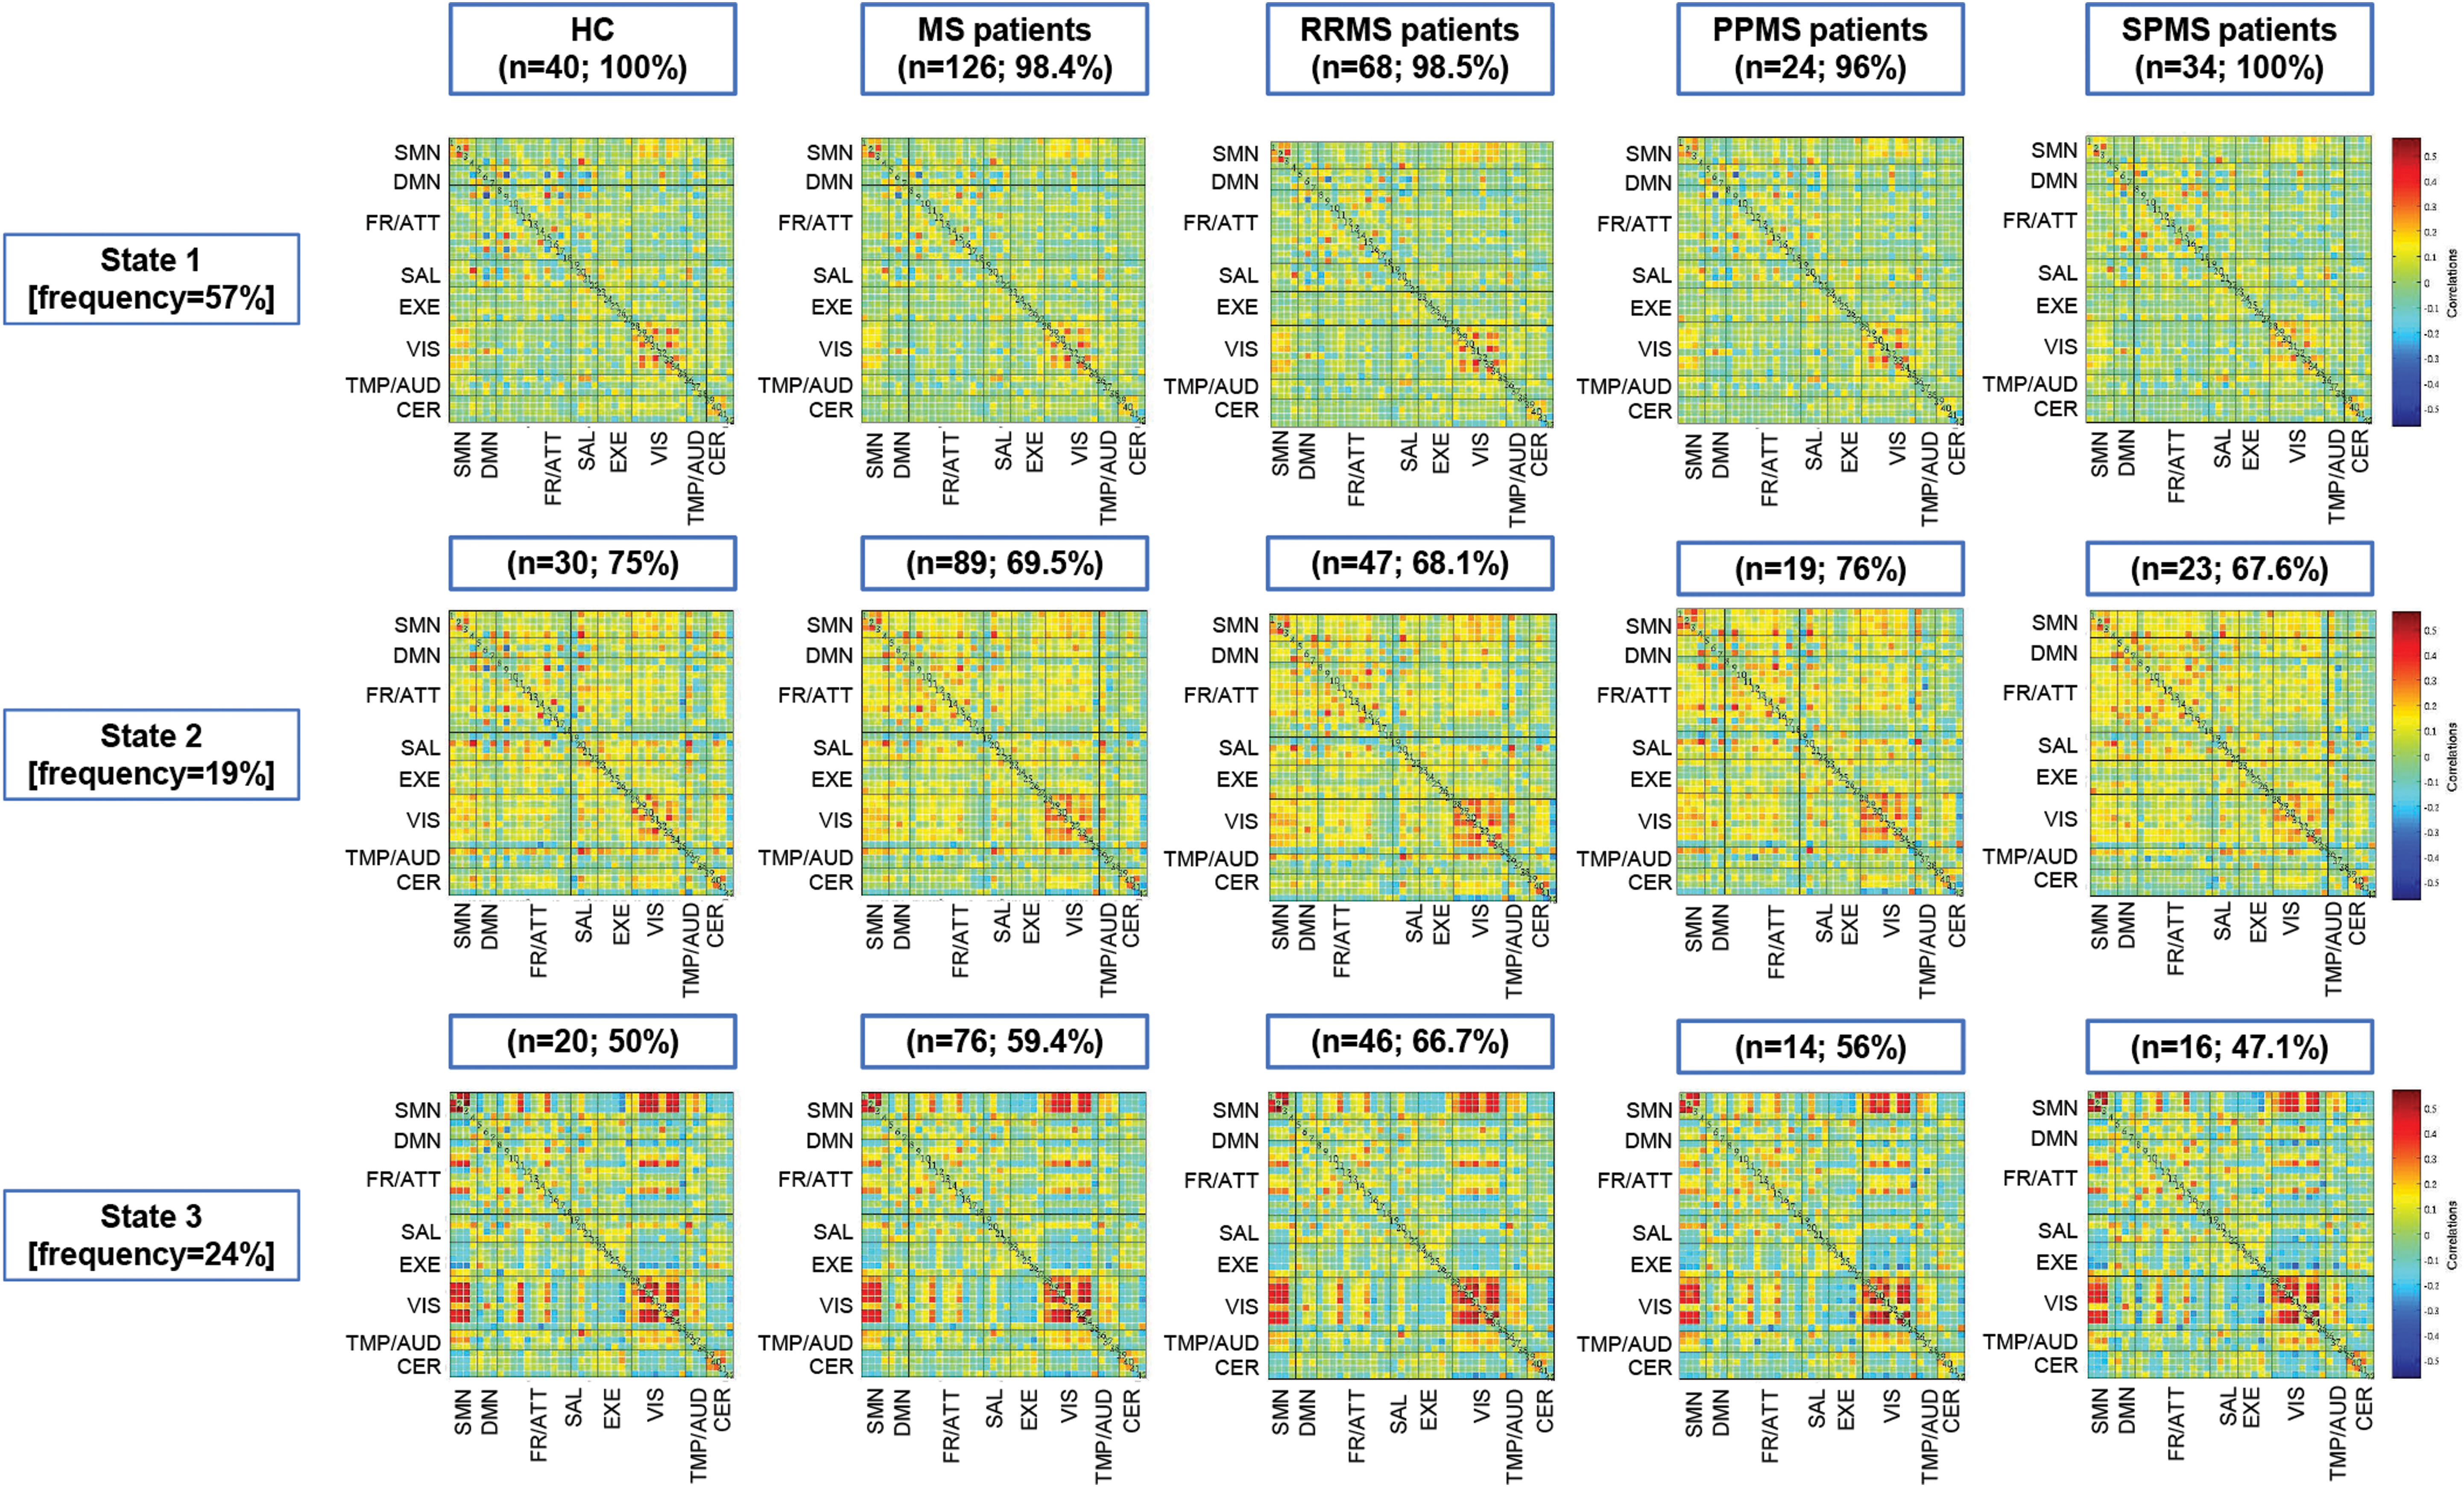
Intra- and inter-network dFC hard-clustering analysis: dFC recurring states (States 1, 2, and 3) in HC and MS patients as a whole, as well as in patients according to the disease clinical phenotype: RRMS, PPMS and SPMS patients. Average dFC strength between each pair of rICs is color coded according to the intensity bar shown on the right (red: positive associations between rICs, blue: negative associations between rICs). State n, % = state number and percentages of recurrence for each state; n, % = number and percentage of participants (within the referred group of participants) presenting the indicated dFC recurring state at least once during the RS fMRI acquisition. dFC, dynamic functional connectivity; fMRI, functional magnetic resonance imaging; RS, resting state. Color images are available online.
Figure 4 summarizes the observed differences of inter- and intra-network dFC in MS patients versus HC, and across the different clinical phenotypes. At the corrected threshold (p = 0.0001, n = 10 abnormal connections), compared to HC, MS patients showed lower State 1/State 3 inter-network dFC among the sensorimotor, salience, frontal/attention, cerebellar and executive networks.

Intra- and inter-network dFC abnormalities in MS patients as a whole, as well as in the RR and progressive clinical phenotypes. Comparison of dFC strength across the three dFC recurring states (States 1, 2, and 3) between MS patients and HC, in RRMS patients compared to HC and PPMS patients, and HC and SPMS patients compared to RRMS patients (comparisons defined a priori, p < 0.05, uncorrected for illustrative purposes). Between-group differences are color coded according to their p value (color intensity) and dFC strength (red-yellow: higher positive dFC strength [or lower negative dFC strength] in MS patients than in HC; blue: lower positive dFC strength [or higher negative dFC strength] in MS patients than in HC). Red and blue boxes indicate higher and lower dFC strengths, respectively, discussed in detail in the text. Color images are available online.
At the uncorrected threshold, MS patients also exhibited lower State 1/State 3 dFC versus HC in DMN, salience, executive, and cerebellar networks, as well as higher inter-network dFC among visual, sensorimotor, frontal/attention, temporal, and cerebellar networks in State 2, and between the visual and executive frontal/attention networks in State 3 (p = 0.002–0.05, n = 213 abnormal connections). State 1/State 3 dFC decrease involving the sensorimotor, DMN, frontal/attention, temporal/auditory, and cerebellar networks, as well as State 2 dFC increase in frontal/attention and visual networks were detected when comparing RRMS and PPMS patients versus HC (p = 0.001–0.05, uncorrected, n = 39 abnormal connections in RRMS and n = 62 in PPMS patients, respectively).
SPMS patients showed, at the corrected threshold (p = 0.0001, n = 11 abnormal connections), lower inter- and intra-network State 1 dFC among sensorimotor, DMN, and visual networks and higher State 3 dFC between executive and frontal/attention networks versus RRMS. In addition, at the uncorrected threshold, SPMS patients exhibited lower dFC for the cerebellar and executive networks in all States versus RRMS patients, together with higher inter- and intra-network dFC for the visual network and DMN in State 2, and between areas of the frontal/attention, visual, and the remaining networks in State 3 (p = 0.001–0.049, n = 78 abnormal connections).
Fuzzy meta-state analysis
Global dynamic properties did not differ between MS patients and HC, or in RRMS and PPMS patients versus HC (Table 2). In SPMS patients, lower number of meta-states was detected versus RRMS patients (p = 0.05, Table 2).
Mean Values and Standard Deviations of Connectivity Global Dynamism Measures (Derived from the Fuzzy Meta-State Analysis) in Healthy Controls and Multiple Sclerosis Patients
Two-sample t-test (measures of global dynamism) in MS patients versus HC and across the different MS clinical phenotypes (comparisons defined a priori, p < 0.05, false discovery rate corrected). Significant between-group differences are highlighted in bold.
Correlation analysis
Significant correlations (n = 96 in total) were found in MS patients between lower inter-network State 1 dFC in sensorimotor, salience, executive, cerebellar, and frontal/attention networks and worse EDSS score (β = −0.17 to −0.25, p = 0.005–0.05), and motor (β = 0.23 to 0.27; p = 0.01–0.03) and cognitive (all domains except verbal fluency, β = 0.22 to 0.33; p = 0.004–0.04) performances; as well as between lower inter-network State 2 dFC in the frontal/attention network and more severe clinical disability (β = −0.24 to −0.27; p = 0.01–0.02) and worse cognitive performance in all domains (β = 0.28 to 0.35; p = 0.004–0.02).
Moreover, a higher inter-network State 2 dFC in the sensorimotor network was associated with worse cognitive performance (all domains, β = 0.28 to 0.37; p = 0.008–0.04); and a higher inter-network State 3 dFC between the frontal/attention and visual networks was associated with worse performance in attention and verbal fluency domains (β = 0.29 to 0.40; p = 0.004–0.03).
With regard to dFC associations with structural brain damage, a higher State 2 dFC between areas of the frontal/attention, cerebellar, and visual networks was correlated with higher T2-hyperintense and T1-hypointense lesion volume (β = 0.23 to 0.28, p = 0.003–0.009), while a lower dFC within areas of the frontal/attention network in State 1 and a lower dFC between areas of the frontal/attention and executive networks in State 2 were correlated with a lower normalized brain volume (β = 0.20 to 0.24; p = 0.02–0.03).
Discussion
By selecting a group of MS patients with different clinical phenotypes and using a novel dFC approach, we were able to characterize dFC strengths and global dynamic properties from small RS fMRI temporal segments across different MS disease stages. The most salient results of this study were those highlighting the behavior of progressive MS patients, who exhibited overall lower dFC strength and dynamism, as well as transient increases of dFC within selected sensory and cognitive circuits in less frequent States (States 2 and 3, detected in <20–25% of the fMRI acquisition and characterized by mid/high dFC strength). These latter dFC abnormalities were associated with worse motor and cognitive performances, possibly mirroring the presence of maladaptive exhaustion of inter-network compensatory mechanisms.
One of the main technical advances of dFC analysis is the possibility to extract recurring states of FC from small RS fMRI temporal segments. Using such analysis, we detected three different states in HC and MS, each characterized by a specific frequency of appearance and by a specific pattern of connectivity among networks. In particular, the most recurrent dFC state (State 1, observed in almost 60% of the fMRI acquisition) presented overall low strengths of inter- and intra-network dFC, possibly mirroring the minimum neuronal interactions that are required in the brain at rest, while in State 2 and 3, which were the less recurrent states, brain areas related to cognitive or relay functions (e.g., DMN, frontal/attentional areas) (Rocca et al., 2010, 2018) showed higher dFC strength. This may indicate that arousals of connectivity might be required at specific intervals to ensure a proper functioning of cognitive brain systems (Bassett et al., 2011; van Geest et al., 2018a).
It is worth noting that these latter findings cannot be detected using sFC approaches. All the three states showed middle-high strengths of intra-network dFC in the sensorimotor and visual networks, suggesting that sensory networks may require more “static” connectivity configurations in the brain at rest, to be prepared for subsequent sensory stimuli.
Compared to HC, MS patients (as a whole), as well as RRMS patients, showed lower dFC strength, especially in States 1 and 2, together with higher dFC strength in selected sensory (sensorimotor and visual) and cognitive (frontal/attention and executive) networks in the less frequent states. Interestingly, progressive MS patients (both SPMS and PPMS) showed a State 1 dFC decrease and State 2 dFC increase involving the same networks, suggesting that MS-related damage generates dFC alterations, which are progressively accumulated throughout the course of the disease.
The fuzzy meta-state approach showed that lower global dynamism characterized SPMS. The involvement of global dynamism in neuronal compensatory and maladaptive mechanisms is supported by previous studies, which described lower global dynamism in cognitively impaired MS patients and correlated it to higher brain atrophy (d'Ambrosio et al., 2020). Such reduction in global dynamism might reflect an impairment of global functional interactions, leading to reduced efficiency in information exchange between distant brain areas (Rocca et al., 2016).
Correlation analyses showed that lower dFC of cognitive networks in State 1 were associated with higher brain atrophy and worse motor and cognitive performances, suggesting a direct effect of MS-related structural damage to such circuits. Higher State 2 dFC within the frontal/attention network was associated with higher T2 and T1 lesion volumes, suggesting the presence of maladaptive phenomena within association areas, probably directed to counteract the effect of widespread damage. The less frequent dFC recurring states (States 2 and 3) revealed different maladaptive mechanisms in clinical phenotypes characterized by a worse clinical prognosis (progressive forms of the disease). In particular, higher State 3 dFC in the frontal/attention circuit correlated with worse cognitive performance.
Also, cross-modal correlations were found between transient increases of sensorimotor dFC in State 2 and worse cognitive performance, suggesting that complex compensatory/maladaptive mechanisms may constantly interrelate the main sensory and cognitive networks (Rocca et al., 2019). Besides, previous studies assessing dFC in RRMS patients found associations between abnormal dFC of the sensorimotor and DMN with higher tissue damage (Rocca et al., 2020; Zhou et al., 2016), more severe clinical disability (Zhou et al., 2016), and worse cognitive profiles (van Geest et al., 2018a), indicating a maladaptive neuronal response to transient loss of dynamic coordination and flexibility among different brain regions (Leonardi et al., 2013; Lin et al., 2018; van Geest et al., 2018a,b; Zhou et al., 2016).
Our study is not without limitations. First, the connected networks are dependent on the number independent components (McKeown et al., 1998). In this study, we chose to estimate 100 components to ensure network compatibility with previous studies (Allen et al., 2014; Damaraju et al., 2014; Nomi et al., 2016; Rashid et al., 2016), which demonstrated a good network parcellation and replicability. Second, the use of a relatively long TR for RS fMRI acquisition (not optimal to closely follow changes of connectivity configurations from scan to scan) may have prevented the detection of more dynamic states using hard-clustering techniques. Third, although we did not perform the test-retest validity of our results, we used a widely validated dFC toolbox (Allen et al., 2014), rigorously assessing the required assumptions, and followed the methodology we have widely tested in previous work (d'Ambrosio et al., 2020; Rocca et al., 2020), thus obtaining reproducible and stable results (Zalesky et al., 2010). Fourth, despite being informative about the cross-modal inter-network modulation that occurs in different clinical phenotypes, and enlightening the processes related to worse motor and cognitive performances, our results do not provide any evidence that would predict subsequent worsening of disability and/or cognitive impairment. To overcome such limitations, validate our results, and characterize the trajectory of dFC changes over time in MS patients, further studies may be performed, with shorter fMRI repetition time and longitudinal designs.
Conclusions
Summarizing, progressive MS patients were characterized by (i) lower global dynamism, (ii) overall lower dFC throughout the entire fMRI acquisition (in all States), and (iii) transient increases of dFC within sensory and cognitive networks in the less-frequent and middle-high-strength connected states (States 2 and 3). Contrary to sFC, dFC abnormalities were associated with higher lesion volume, more severe clinical disability, and worse motor and cognitive performances. These findings suggested that progressive MS patients might experience a maladaptive neuronal response to transient loss of dynamic coordination and flexibility among sensory and cognitive brain regions, leading to the progression of clinical impairment.
Footnotes
Authors' Contributions
M.H.C., M.A.R., and M.F. contributed to study concept, analysis and interpretation of the data, and drafting/revising the article.
P.V. contributed to the analysis and interpretation of data and drafting/revising the article.
F.S. and F.E. contributed to patients' recruitment and clinical assessment.
Author Disclosure Statement
M.H.C. has nothing to disclose.
P.V. received speakers honoraria from Biogen Idec.
F.S. has nothing to disclose.
F.E. has nothing to disclose.
M.A.R. received speakers honoraria from Bayer, Biogen, Bristol Myers Squibb, Celgene, Genzyme, Merck Serono, Novartis, Roche, and Teva and receives research support from the Canadian MS Society and Fondazione Italiana Sclerosi Multipla.
M.F. is Editor-in-Chief of the Journal of Neurology and Associate Editor of Human Brain Mapping; received compensation for consulting services and/or speaking activities from Almiral, Alexion, Bayer, Biogen, Celgene, Eli Lilly, Genzyme, Merck-Serono, Novartis, Roche, Sanofi, Takeda, and Teva Pharmaceutical Industries; and receives research support from Biogen Idec, Merck-Serono, Novartis, Roche, Teva Pharmaceutical Industries, Italian Ministry of Health, Fondazione Italiana Sclerosi Multipla, and ARiSLA (Fondazione Italiana di Ricerca per la SLA).
Funding Information
This study has been partially supported by grants from Fondazione Italiana Sclerosi Multipla (FISM 2018/R/5 and FISM2018/S/3), and financed or co-financed with the “5 per mille” public funding.