
Abstract
Background:
Emerging evidence suggests distinct abnormal activity patterns during resting state in intrinsic functional brain networks in patients with neurodegenerative diseases, including Alzheimer's disease (AD) and mild cognitive impairment (MCI). This study aimed to identify the changes in the resting-state intracortical lagged phase synchronization derived from dense array electroencephalography (EEG) in AD and MCI.
Methods:
Resting-state current source density (CSD) and lagged phase synchronization between 84 regions of interest defined by Brodmann areas (BAs) for seven EEG frequency bands were investigated between the study groups (AD, MCI, and age-matched controls) using 128-channel EEG.
Results:
Reduced CSD and connectivity (large effect size, Cohen's d > 0.8) were found in AD and MCI compared with controls at alpha frequency. However, a positive correlation (r = 0.433; p = 0.044) of mini-mental state examination scores was found with BA 32-33 connectivity values in AD only.
Conclusion:
Reduced resting-state alpha 1 source connectivity in patient groups and correlation between attenuation of resting-state alpha 1 connectivity with cognitive decline in AD could indicate the disruption of inhibitory function of alpha rhythm leading to tonic unselective cortical excitation that affects attention and controlled access to stored information.
Impact statement
Lower cortical source density and connectivity in Alzheimer's disease (AD) and mild cognitive impairment (MCI) compared with controls were found only at alpha frequency, highlighting the strong association between cholinergic dysfunction and alpha frequency. Reduced functional connectivity in AD and MCI affected distinct key hubs of large-scale networks such as default mode network. Reduced alpha connectivity and its association with cognitive decline in patients could indicate the disruption of inhibitory function of alpha rhythm due to the disease pathology. Therefore, the distinct functional connectivity pattern of AD and MCI identified in this study could be used as the topographical and pathophysiological biomarkers of these disease states.
Introduction
Alzheimer's disease (AD) is characterized by the pathological accumulation of amyloid-beta (Aβ) and hyperphosphorylated tau peptides, which affects the synaptic transmission of neural networks. The pathological accumulation of these peptides initiates progressive degeneration and aberrant patterns of activity in the distributed neural networks to induce a functional brain disconnection syndrome (Pievani et al., 2011). Mild cognitive impairment (MCI) of amnestic type is a transitional stage between normal cognition and AD, which is reflected in its clinical features. Due to the high risk associated with prodromal MCI to progress to AD, early and reliable diagnosis of MCI is crucial. Early diagnosis could reduce the economic and social costs of AD management.
The prediction of prodromal MCI to AD conversion has been found to have a high degree of sensitivity and specificity by combining various tests such as magnetic resonance imaging (MRI)-based hippocampal volume, fluorodeoxyglucose-positron emission tomography, and cerebrospinal fluid (CSF) Aβ and tau proteins (Ottoy et al., 2019). However, these CSF and neuroimaging biomarkers for AD and prodromal MCI are derived using techniques, which are expensive, scarcely available in clinical environments, and a few are invasive and pose radiation hazard. To address this crucial issue, the quest for the alternative neurophysiological biomarkers for early diagnosis and prognosis of AD and MCI has become one of the topics of interest. Electroencephalography (EEG) is considered to be the ideal technique for the early diagnosis and treatment monitoring of AD and MCI due to the low-cost, noninvasive, suitability for repeated recordings over time, wide availability in clinical settings, and superior temporal resolution to capture dynamic postsynaptic activity in the cerebral cortex.
Previous reports suggest shifting of EEG power spectrum to lower frequencies, reduced complexity of EEG signals, decrease in the coherence of fast EEG rhythms, and perturbations in EEG synchrony as the key features of EEG in AD (Dauwels et al., 2010). Studies have demonstrated the potential of EEG spectral indices for the diagnosis of AD, classification of disease severity, and discrimination of AD and MCI (Buscema et al., 2007). However, the power density of the EEG rhythms might not capture the core neurophysiological characteristic of AD; that is, the disruption of functional connectivity within brain networks underlying the cognitive functions (Canuet et al., 2012). Human cognition emerges from the highly distributed and dynamic interactions between functionally specialized neural populations in the brain. It is highly plausible that the functionally connected brain networks become abnormal with the progression of neurodegeneration in prodromal MCI and AD.
Functional brain connectivity refers to temporal synchrony between the signals originating from segregated neural systems, either at a synaptic or population level, which is reflected by a statistical dependence of a variable describing the functional integration among them. Coherence, a measure of linear functional connectivity, was found to be markedly lower at alpha frequency in AD than in age-matched controls (Almkvist et al., 2001). On the contrary, a few other studies have observed variable changes; that is, either lower or higher EEG coherence at delta and theta rhythms in AD (Brunovsky et al., 2003). Further, the problem of volume conduction produces nonphysiological zero phase lag coherence between time series. The omission of zero phase lag coherence addresses this limitation. Lagged phase synchronization is a nonlinear functional connectivity measure implemented in LORETA-KEY software (Pascual-Marqui et al., 2011). Only a few studies have used EEG nonlinear connectivity for investigating the pathophysiology of AD and MCI. A majority of these studies have computed nonlinear connectivity between the EEG electrodes rather than the intracortical sources (Blinowska et al., 2017; Briels et al., 2020).
In the recent years, more attention has been paid to the intrinsic functional networks operating in the brain during the resting state in patients with AD (Pievani et al., 2011). Investigating the functional connectivity during the resting state could plausibly reveal an intrinsic functional disintegration of brain networks in patients with AD and MCI. Therefore, this study aimed to investigate the changes in the resting-state intracortical lagged phase synchronization derived from 128-channel dense array EEG between the study groups; that is, AD, MCI, and age-matched controls.
Materials and Methods
Participants
Twenty-two AD patients and 23 MCI patients and 22 age-matched healthy volunteers as controls were recruited into the study. Diagnosis of AD and MCI was done based on NINCDS-ADRDA criteria and Peterson criteria, respectively, by the Neurologist in the Dementia Clinic, Department of Neurology, AIIMS, New Delhi.
All the procedures performed in this study were according to the latest revision of the Declaration of Helsinki for medical research involving human subjects. The study was approved by the Institutional Ethics Committee, All India Institute of Medical Sciences, New Delhi (IESC/T-165/04.05.2012). All the patients and controls were informed about the aims and objectives of the study, and the written consent form was filled by each subject. All participants were right-handed as assessed by the Edinburgh handedness inventory and had a normal or corrected-to-normal vision. After evaluating each participant using the Mini-Mental State Examination (MMSE) and Clinical Dementia Rating (CDR), EEG data acquisition was performed.
EEG data acquisition
The EEG signal was acquired using 128-electrode HydroCel Geodesic Sensor Net (HCGSN) system (Philips Neuro, EGI, USA) at a sampling rate of 500 Hz (16-bit precision; bandwidth: 0.05–100 Hz). According to the manufacturer's recommendation, each sensor's impedance was checked and kept <50 kΩ. The vertex electrode (Cz) served as the recording reference. EEG acquisition was performed in a silent, electrical noise-free room. EEG data were recorded during the resting state, while the participants were sitting comfortably with their eyes closed for a minimum of 5 min.
EEG data preprocessing
Raw EEG data were processed offline using NetStation (Version 4.5.4). EEG signal was bandpass filtered at 1–100 Hz. For each subject, 15 artifact-minimal EEG epochs of 1 sec each were extracted. A semiautomated artifact detection algorithm of NetStation was used for identifying artifacts such as eye movement, eye blinks, and bad channels. Bad channels were interpolated using spherical spline interpolation in the NetStation software.
EEG data were then exported to EEGLAB toolbox (Delorme and Makeig, 2004) operating in MATLAB (Mathworks, Natick, MA, USA). Runica function in EEGLAB software that performs independent component analysis (ICA) decomposition of psychophysiological data using the infomax ICA algorithm was used to separate independent sources linearly mixed in several EEG sensors. Independent components (ICs) representing eye movements, eye blinks, muscle artifacts, and cardiac artifacts were rejected. IC's scalp map, time course, and activity power spectrum were used to identify and remove artifactual components. A total of 31 artifactual components were removed: 6 components of 6 patients in AD group, 10 components of 10 patients in MCI group, and 15 components of 14 subjects in controls. Data were then rereferenced to a common average reference to minimize the effects due to reference-site activity.
EEG cortical source analysis of frequency domain generators
Three-dimensional current source density (CSD) of the cortical oscillators was computed from the preprocessed EEG data using exact low-resolution electromagnetic tomography (eLORETA) implemented in LORETA-KEY software. In the first step, EEG cross-spectra were computed from EEG data for each subject using “EEG to cross spectrum” in LORETA-KEY software for seven EEG frequency bands: delta (2–4 Hz), theta (4–8 Hz), alpha 1 (8–10.5 Hz), alpha 2 (10.5–13 Hz), beta 1 (13–20 Hz), beta 2 (20–30 Hz), and gamma (30–45 Hz).
In the second step, eLORETA images of cortical generators were computed for each of the seven EEG frequency bands from EEG cross-spectra computed in the first step using “Cross spectra to LORETA” in LORETA-KEY software. eLORETA is an algorithm that solves the inverse source problem by computing the smoothest of all possible distributions of CSD (Pascual-Marqui et al., 2011). Computations were carried out using the 3-shell spherical head model (brain, scalp, skull), which is based on the Montreal Neurological Institute (MNI152 template; Montreal, Quebec, Canada) brain MRI average. The solution space was limited to the cortical gray matter and hippocampus, comprising 6239 voxels of 5 mm3 spatial resolution.
EEG functional connectivity analysis
Lagged phase synchronization was computed with LORETA-KEY software in the 84 regions of interest (ROIs) defined according to the available Brodmann areas (BAs: 1, 2, 3, 4, 5, 6, 7, 8, 9, 10, 11, 13, 17, 18, 19, 20, 21, 22, 23, 24, 25, 27, 28, 29, 30, 31, 32, 33, 34, 35, 36, 37, 38, 39, 40, 41, 42, 43, 44, 45, 46, 47) for left and right hemispheres. ROIs were defined using “ROI Maker 2” in the LORETA-KEY software. The signal at each cortical ROI consisted of the average CSD of all voxels belonging to that ROI, as computed with eLORETA. eLORETA CSD time series of ROIs were used to estimate the lagged phase synchronization.
The lagged phase synchronization (φ) between X and Y signals at frequency ω can be computed by the formula:
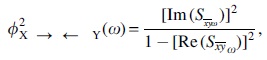
where Im and Re denote the real and imaginary parts of cross-spectrum S between the normalized (unit modulus) Fourier transforms of X and Y signals. LORETA-KEY software computes lagged phase synchronization using this formula (Pascual-Marqui et al., 2011).
Lagged phase synchronization was computed using “Connectivity 1” in the software. Intracortical lagged phase synchronization was computed between all possible pairs of ROIs for each of the seven EEG frequency bands.
Statistical analysis
Statistical program available in LORETA-KEY software was used for statistical analyses. The differences in cortical source activity and lagged phase synchronization between the study groups were assessed by independent t-tests. To correct for multiple comparisons, statistical nonparametric mapping randomization in LORETA-KEY software was used. This randomization method is based on estimating the critical threshold, through randomization, the empirical probability distribution for the max-statistic (e.g., maximum of t-statistic), under the null hypothesis (Nichols and Holmes, 2002). The null hypothesis of no activation (cortical source activity/functional connectivity) anywhere in the brain was rejected if the t-value was above the critical threshold for p = 0.05, determined by 5000 randomizations. Effect sizes were computed by taking the difference in mean connectivity values divided by the average of standard deviations (Cohen's d) wherever significant difference between the study groups was found. Specificity, sensitivity, accuracy, and area under the receiver operating characteristic curve (AUROC) of the functional connections, which were significantly different between the study groups, were analyzed using receiver's operating characteristics curves. Sensitivity, specificity, and accuracy were identified by the cut-point defined by Youden Index (J) as it optimizes the classification ability of a test by allocating equal weightage for sensitivity and specificity.
Statistical analyses of demographics and clinical characteristics were carried out using Statistical Package for Social Sciences version 20.0 (SPSS, Inc., Chicago, IL, USA). CDR, disease, and drug duration of AD and MCI were compared using independent t-test. Rest of the parameters were analyzed using analysis of variance with Bonferroni post hoc analysis. Pearson's correlation coefficient was used to assess the relationship of the cortical connections, which showed significant change between the study groups with the demographics and clinical characteristics.
Results
Demographics and clinical characteristics
Participants in the study groups were matched for age, gender, and education. There were no significant differences in the disease duration and drug duration between the AD and MCI (Table 1).
Mean (±Standard Deviation) of the Demographics and Clinical Characteristics of the Study Groups
AD, Alzheimer's disease; CDR, Clinical Dementia Rating; MCI, mild cognitive impairment; MMSE, Mini-Mental State Examination.
MMSE scores were significantly different between the groups [F (2, 64) = 135.73; p < 0.001; mean (standard deviation; SD) of MMSE in AD, MCI, controls = 17.18 (3.66), 28.13 (2.87), 29.55 (0.86)]. Post hoc tests revealed that AD patients had significantly lower MMSE score compared with controls as well as MCI. MMSE scores between MCI and control group did not differ significantly.
CDR score was significantly high in AD than in MCI [t (43) = 6.86; p < 0.001; mean (SD) of CDR in AD, MCI = 1.20 (0.53), 0.35 (0.28)].
CSD in frequency domain
The CSD was significantly lower for alpha 1 and alpha 2 bands in AD compared with control (critical threshold: t = ± 3.983, p < 0.05) (Fig. 1A). In alpha 1 band, a total of 934 of 6239 voxels had significantly lower CSD in AD group compared with control distributed among 44 of 84 ROIs. Distribution of significantly different voxels was bilateral: 564 voxels and 370 voxels in the right and left hemisphere, respectively (Table 2). Maximum distribution of significant voxels was found in bilateral BA 11 (186 voxels), BA 10 (147 voxels), BA 47 (107 voxels), BA 32 (76 voxels), and BA 40 (67 voxels).

LORETA statistical maps showing cortical source density differences between the study groups. Significant results are projected onto a fiducial cortical surface. Colored areas represent the spatial extent of voxels with significant difference.
Brain Regions That Showed Significantly Lower Current Source Density (Critical Threshold: t = ± 3.983, p < 0.05) in Alzheimer's Disease Compared with Control in Alpha 1 Frequency Band
BA, Brodmann area; G, gyrus; L, left hemisphere; R, right hemisphere.
In alpha 2 band, a total of 175 voxels had significantly lower CSD in AD group compared with control, which were distributed among 19 of 84 ROIs (Table 3). Distribution of significantly different voxels was bilateral: 144 voxels in left hemisphere and 31 voxels in the right hemisphere. Maximum distribution of significant voxels was found in BA 47 (53 voxels), BA 11 (32 voxels), BA 10 (23 voxels), and BA 9 (19 voxels) predominantly with left hemispheric distribution.
Brain Regions That Showed Significantly Lower Current Source Density (Critical Threshold: t = ± 3.983, p < 0.05) in Alzheimer's Disease Compared with Control in Alpha 2 Frequency Band
BA, Brodmann area; G, gyrus; L, left hemisphere; R, right hemisphere.
The CSD of alpha 1 band had significantly lower CSD in MCI group compared with control in 153 voxels distributed in 22 ROIs (critical threshold: t = ± 4.149, p < 0.05) (Fig. 1B). Distribution of significantly different voxels was bilateral: 127 voxels in the right hemisphere and 26 voxels in left hemisphere (Table 4). Maximum distribution of significant voxels was found in right BA 13 (17 voxels), right BA 20 (13 voxels), right BA 21 (13 voxels), right BA 41 (13 voxels), right BA 22 (12 voxels), and left BA 24 (11 voxels).
Brain Regions That Showed Significantly Lower Current Source Density (Critical Threshold: t = ± 4.149, p < 0.05) in Mild Cognitive Impairment Compared with Control in Alpha 1 Frequency Band
BA, Brodmann area; G, gyrus; L, left hemisphere; R, right hemisphere.
No significant difference was observed in the CSD in any of the seven EEG frequency bands between AD and MCI. No significant change was observed in the CSD in delta, theta, beta 1, beta 2, and gamma bands between any of the study groups.
Functional connectivity
Lagged phase synchronization between 84 ROIs in 7 frequency bands was analyzed between study groups. Significantly lower lagged phase synchronization was found in AD compared with control in alpha 1 frequency between 4 pairs of ROIs (critical threshold: t = ± 5.376, p < 0.05) (Fig. 2A). Intrahemispheric alpha 1 lagged phase synchronization of AD group was found to be lower compared with controls between Right BA 32–Right BA 33 and Right BA 33–Right BA 43. Interhemispheric alpha 1 lagged phase synchronization in AD group was found to be lower than controls between Right BA 40–Left BA 31 and Right BA 43–Left BA 33. According to Cohen, large effect size (Cohen's d > 0.8) was observed in all the four intracortical connections that differed significantly between AD and controls. Based on AUROC (Mandrekar, 2010), the discriminative ability of three intracortical connections was found to be excellent (0.8–0.9) and acceptable (0.7–0.8) for one connection. t-statistic, effect size, AUROC, specificity, sensitivity, and accuracy of the four intracortical connections that differed significantly between AD and controls are given in Table 5.

LORETA wire diagram indicating cortical connections that showed significantly lower lagged phase synchronization in alpha 1 frequency band in the patient groups (AD, MCI) compared with control group.
Brain Connections That Showed Significantly Lower Lagged Phase Synchronization in Alzheimer's Disease Compared with Age-Matched Controls in Alpha 1 Frequency Band (Critical Threshold for Significance: t = ± 5.376, p < 0.05)
AUROC, area under the receiver operating characteristic curve; BA, Brodmann area; G, gyrus; L, left hemisphere; R, right hemisphere; ROI, region of interest.
Significantly lower lagged phase synchronization with large effect size (Cohen's d = −1.62) and excellent discriminative ability (AUROC = 0.8676) was found in MCI compared with control in alpha 1 frequency between Right BA 11–Left BA 13 (critical threshold: t = ± 5.392, p < 0.05) (Fig. 2B). Specificity, sensitivity, and accuracy of the intracortical connection that differed significantly between MCI and controls are given in Table 6.
Brain Connections That Showed Significantly Lower Lagged Phase Synchronization in Mild Cognitive Impairment Compared with Age-Matched Controls in Alpha 1 Frequency Band (Critical Threshold for Significance: t = ± 5.392, p < 0.05)
AUROC, area under the receiver operating characteristic curve; BA, Brodmann area; G, gyrus; L, left hemisphere; R, right hemisphere; ROI, region of interest.
No significant difference was observed in the lagged phase synchronization between the cortical connections in any of the seven EEG frequency bands between AD and MCI. No significant change was observed in the lagged phase synchronization between the cortical connections in delta, theta, alpha 2, beta 1, beta 2, and gamma bands between any of the study groups.
Correlation between connectivity and participants' (demography, clinical) characteristics
Correlation analysis was performed to assess the bivariate relationship between the cortical connections, which were significantly different in the study groups with the demographics and clinical characteristics. Of the five cortical connections, which were significantly different in the patient groups compared with age-matched controls (four connections in AD, one connection in MCI), a positive correlation (r = 0.433; p = 0.044) was observed between the lagged phase synchronization of BA 32–BA 33 in right hemisphere with the MMSE scores in AD.
Discussion
This study aimed to investigate the functional connectivity during the resting state using intracortical lagged phase synchronization derived from 128-channel dense array EEG between the study groups; that is, AD, MCI, and age-matched controls. There are three major findings in this study. First, lower CSD at alpha 1 and alpha 2 frequencies in AD, and alpha 1 frequency in MCI. Second, lower intracortical lagged phase synchronization in alpha 1 frequency in AD and MCI compared with controls. Third, the positive correlation between the lagged phase synchronization of BA 32–BA 33 in right hemisphere with the MMSE scores in AD.
This study did not find any difference in CSD and functional connectivity between MCI and AD. This finding could be due to subtle compensatory changes in MCI during resting state, which attribute to lack of observed differences despite differences in the cognitive decline in MCI compared with AD. Evidence also indicates that the differences in the EEG coherence between AD and MCI are more apparent during cognitive state than in resting state (Tao and Tian, 2005). Hence, investigating EEG cortical connectivity during cognitive state in future studies could potentially unravel the biomarker to distinguish AD and MCI. Further, the biological, etiological, and clinical heterogeneity of MCI and AD could be addressed in future by multiomics approach, that is, by using the combination of three tools such as neuroimaging, metabolomics, and genomics (Badhwar et al., 2020).
Reduced alpha 1 CSD in AD
The CSD of alpha 1 frequency in AD was significantly lower than control in this study.
This is in line with a previous study reporting decrease in alpha cortical sources (Lizio et al., 2015). Previous EEG cortical sources have also reported altered CSD in other frequency such as delta (Babiloni et al., 2017) and theta (Wu et al., 2014). Most of these studies have used low-density EEG, different ways of frequency categorization such as individual alpha frequency based and have used broader labeling of cortical sources such as posterior or occipital sources, and mostly reported as a widespread alteration. AD group in this study had mild dementia (mean [SD] CDR, 1.2 [±0.53]), and the use of high-density EEG could be the reason for the cortical source density changes restricted only to alpha range (alpha 1 and 2). To the best of our knowledge, this is the first study to report significant changes voxel-wise and their specific macroanatomical distribution. In this study, significant voxel changes were found predominantly in bilateral orbitofrontal cortex (OFC), prefrontal cortex (PFC), anterior cingulate cortex (ACC), posterior parietal cortex, dorsolateral prefrontal cortex (DLPFC), left visual association cortex, and right inferior temporal, premotor, and insular cortex, which are parts of multiple intrinsic networks. Many of these regions are key hubs/nodes of the large-scale networks involved in various cognitive and behavioral responses (Menon, 2015).
Reduced alpha 2 CSD in AD
The CSD of alpha 2 frequency in AD was significantly lower than control in this study. These findings are in correspondence with the previous study although with varying degrees of distribution (Lizio et al., 2015). The pattern of significant voxels spread was found predominantly in left ventrolateral prefrontal cortex (VLPFC), OFC, DLPFC, PFC, and insula, whereas in the right hemisphere distribution was found in OFC and VLPFC. These are parts of language and frontoparietal networks implied in language processes, semantic retrieval, cognitive functions such as episodic, working memory, and executive control (Baker et al., 2018). The number of significant voxels was relatively less in alpha 2 compared with alpha 1 frequency in AD.
Reduced alpha 1 CSD in MCI
Alpha 1 CSD in MCI was found to be significantly lower compared with control in this study. This result corroborates with the previous studies in MCI patients (Babiloni et al., 2009). Interestingly, significant alpha 1 sources were very less in MCI versus control (153 voxels) compared with AD versus control (934 voxels), which is in correspondence with the literature, suggesting that MCI is middle of the continuum from the normal aging to AD (Varatharajah et al., 2019). Similar to the alpha 1 sources in AD, right-side predominance was also observed in MCI with the involvement of right temporal cortex, including primary auditory regions, parahippocampal cortex, and insula, whereas in the left side it mainly involved ACC and posterior cingulate cortex (PCC), which are key hubs in default mode network (DMN) functions (Raichle, 2015).
Reduced alpha CSD in AD and MCI
Alpha rhythm is considered to indicate cortical inhibition and is inversely proportional to hemodynamic measures of neural activity (Kounios et al., 2006). Alpha 1 rhythm has been observed in widely distributed brain networks, and thought to be involved in regulating general brain arousal and global attentional readiness (Klimesch, 2012). Alpha 2 rhythm could reflect an inhibitory gating mechanism, regulating the intake of visual information (Worden et al., 2000). In this study, lower CSD in alpha frequency in AD and MCI during resting state could indicate reduced cortical inhibition and therefore more sensitivity to environmental novelty, that is, higher global brain arousal, which could be seen as a compensatory mechanism deployed by the brain in these disease states.
Functional connectivity in AD
This study found reduced alpha 1 lagged phase synchronization between two intrahemispheric (right BA 32–right BA 33, right BA 33–right BA 43) and two interhemispheric connections (right BA 40–left BA 31 and right 43 and right BA 33). These findings are in line with the previous studies although with methodological differences. Lower functional connectivity was reported previously in widespread intra- and interhemispheric regions at alpha frequency (Babiloni et al., 2018). Reduced alpha connectivity was observed previously between medial frontal cortex, precuneus with left posterior temporal cortex and bilateral inferior parietal cortex (Canuet et al., 2012), and within DMN (Hsiao et al., 2013).
Reduced alpha 1 intrahemispheric lagged phase synchronization in AD: Right BA 32–Right BA 33
Cytoreceptor architectonic mapping and meta-analytical connectivity modeling revealed that BA 32 and 33 belong to the primitive cytoarchitectonic organization of ACC. Diverse functional domains were assigned to ACC such as emotion processing, attention regulation, and cognitive control (Palomero-Gallagher et al., 2019). BA 32 is one of the core components of theory of mind network and found to be coactivated with other core components of this network (Spunt and Adolphs, 2019). In turn, this network was part of a large intrinsic network of DMN (Fransson and Marrelec, 2008). BA 32 is also associated with domains emotional behavior of fear and anxiety, more importantly, a crucial role in the cognitive regulation of emotion rather than the actual emotional experience (Palomero-Gallagher et al., 2019). In a recent study based on diffusion tensor imaging tractography, BA 32 and 33 were parceled together into one of the six subregions, and was associated with the affective network (OFC; medial PFC [MPFC]) and DMN (MPFC; superior frontal gyrus, SFG; PCC; precuneus; temporal pole of DMN), which is in line with the notion that ACC is a key node of DMN (Jin et al., 2018). Lower functional connectivity between BA 32 and BA 33 in AD in this study could indicate the disconnection within ACC, which could plausibly affect their affective and default mode networks.
The positive correlation of BA 32–BA 33 alpha 1 connectivity values with the MMSE scores in AD in this study is in agreement with the previous reports that suggest ACC as a key node in various intrinsic brain networks involved in cognitive control (Jin et al., 2018; Palomero-Gallagher et al., 2019). This finding reveals the potential significance of alpha 1 connectivity between BA 32 and BA 33 for monitoring the cognitive decline in AD. In line with this finding, previous study has reported that attenuation of resting alpha rhythms to correlate with cognitive decline in AD (Coben et al., 1990). Resting EEG alpha rhythm has also been found to predict cognitive performance in healthy adults (MacLean et al., 2012), and has been proposed to have an inhibitory function on the cortical activity, which is considered to be essential for selective activation of brain networks whenever required (Klimesch, 2012). Therefore, reduced resting-state alpha 1 connectivity in AD within the ACC (BA 32–33) could have disrupted the inhibitory function of alpha rhythm at rest, thereby leading to irrelevant cortical excitation when switching from the resting state to cognitive states requiring attention, and controlled access to stored information (Klimesch, 2012; MacLean et al., 2012).
Reduced alpha 1 lagged phase synchronization in AD: Intrahemispheric Right BA 33–Right BA 43, interhemispheric Left BA 33–Right BA 43
Voxels of ROI BA 43 that showed significantly reduced alpha 1 activity in AD were located in pre- and postcentral gyrus (Table 5). A connectomic work built on Human Connectome Project highlighted the functional connectivity of BA 43 to primary sensory cortex, motor cortex, premotor regions, middle cingulate regions, lateral frontal lobe, temporal lobe, dorsal and ventral visual stream (Baker et al., 2018). BA 33 has been found to have extensive connections with the sensorimotor network (SMN) and the brain regions of perception-motor planning and processing system (Jin et al., 2018). Lower interhemispheric and intrahemispheric alpha 1 phase synchronization between BA 43 and BA 33 at resting state in AD could implicate reduced preparedness for motor activity (perception, planning, and processing).
Reduced alpha 1 interhemispheric lagged phase synchronization in AD: Left BA 31–Right BA 40
Voxels of left BA 31 were predominantly located in cingulate gyrus, precuneus, and PCC (Table 5). PCC and precuneus are considered to be the key hubs of DMN. PCC with its rich structural connection with rest of the DMN and other intrinsic networks has been proposed to be involved in internally directed cognition (Leech and Sharp, 2014). PCC appears to facilitate the transfer and integration of information between intrinsic brain networks such as DMN, central executive network (CEN), and dorsal attention network (DAN) (Andrews-Hanna et al., 2010). Further, tau retention in AD has been found predominantly in precuneus and PCC as they are the key hubs of the large-scale networks rendering them more vulnerable to AD pathology. Indeed, PCC and precuneus have a high metabolic rate than the rest of the brain, and reduced metabolism in PCC was found to be an early feature of AD (Buckner et al., 2005). Overloading of hubs leading to network failure could be a conceivable final common pathway in neurodegenerative disorders such as AD.
Voxels of right BA 40 were predominantly located at inferior parietal lobule (IPL), supramarginal gyrus, and postcentral gyrus (Table 5), which are in turn a part of the temporoparietal junction (TPJ), one of the major network hubs involved in diverse and complex heteromodal behavioral and cognitive repertoire. TPJ has been found to be functionally connected with cingulo-opercular network, SMN, salience network (SN), ventral attention network (VAN), and DMN (Igelström et al., 2017). TPJ was found to be strongly activated along with other areas of the DMN subsystem when the subjects made judgments concerning their present situation (Andrews-Hanna et al., 2010). Decreased functional connectivity of TPJ with SMN, SN, CEN, and DMN has been found in AD patients (Wang et al., 2015). Therefore, reduced alpha 1 connectivity in AD between left BA 31 and right BA 40 could implicate the dysfunction of these key hubs of several intrinsic large-scale networks such as DMN, CEN, DAN, and VAN, and could plausibly explain the lower cortical alpha 1 CSD in AD registered from widespread cortical areas (934 cortical voxels).
Reduced alpha 1 interhemispheric lagged phase synchronization in MCI: Right BA 11–Left BA 13
In line with this study, a previous study has reported reduced alpha lagged linear connectivity between interhemispheric cortical regions in MCI patients (Babiloni et al., 2019). In this study, voxels of right BA 11 were predominantly distributed in middle frontal gyrus, superior frontal gyrus, rectal gyrus, and medial frontal gyrus (Table 6), which are the part of medial orbitofrontal cortex (mOFC) and ventromedial prefrontal cortex (vmPFC). OFC is a key processing region for emotions (Rolls, 2014), and vmPFC is considered to be one of the core nodes of DMN. vmPFC was found to receive sensory information of the external world and body through OFC and relay to hypothalamus, amygdala, and periaqueductal gray matter (Ongur, 2000). Through this sensory–visceral link, this circuit has a potential role in core functions of DMN (Raichle, 2015).
Voxels of left BA 13 were predominantly distributed in insula (107 voxels among 125 voxels). The primary role of insula is believed to be multimodal integration involving various networks of higher order cognitive, emotional, and social behavior (Uddin et al., 2017). Insula could have a key role in dynamic switching between externally oriented attention such as CEN and internally oriented mental processes such as DMN (Goulden et al., 2014). MRI functional connectivity showed mixed results of enhanced connectivity within SN in amnestic MCI (Brier et al., 2012), and reduced connectivity of SN with CEN and DMN (He et al., 2014). This study found lower functional connectivity between interhemispheric right BA 11 and left BA 13 could indicate the disruption of multimodal integration subserved by these two regions in MCI.
Conclusion
This study has used a novel combinatorial approach by combining high-density EEG, ROIs based on the cortical voxels in BAs, and lagged phase synchronization for investigating the resting-state brain activity in AD and MCI. We found lower cortical source density and connectivity in AD and MCI compared with controls, only at alpha frequency. This is in line with the strong link established between cholinergic dysfunction and alpha frequency by the previous reports, which found an increase in alpha power density with the enhancement of cholinergic tone using acetylcholinesterase inhibitor drugs (Agnoli et al., 1983) and opposite effects with scopolamine (Neufeld et al., 1994).
The disconnection hypothesis suggests that the major symptoms of AD are related to aberrant, or “dys-,” connectivity between distinct brain areas (Pievani et al., 2011). Dysconnectivity refers to either a hypo- or hyperconnectivity pattern in the target group compared with age-matched healthy control. Lower functional connectivity (BA 32–BA 33, BA 31–BA 40) in AD in this study indicates the dysfunction of key hubs such as ACC, PCC, precuneus, IPL, and TPJ, which could affect various large-scale networks such as default mode network, attention networks, CEN, SN, and affective network. Lower functional connectivity between BA 11 and BA 13 in MCI was found to involve mOFC, vmPFC, and insula, which supposedly integrate multimodal inputs. In agreement with this study results, meta-analytical report also found hypoconnectivity of default mode, salience, and limbic networks in AD (Badhwar et al., 2017). Interestingly, this study also observed reduced connectivity in between BA 43 and BA 33 (pre- and postcentral gyrus) at resting state in AD could implicate reduced preparedness for motor activity. Reduced alpha 1 source connectivity in the patient groups and correlation between attenuation of alpha 1 connectivity with cognitive decline in AD could indicate the disruption of inhibitory function of alpha rhythm leading to tonic unselective cortical excitation that affects attention and controlled access to stored information (Klimesch, 2012).
Footnotes
Acknowledgments
The authors are highly grateful to all the patients and healthy volunteers who participated in the study.
Author Disclosure Statement
No competing financial interests exist.
Funding Information
This study was funded by Cognitive Science Research Initiative, Department of Science and Technology (Project No. SR/CSI/03/2009), Ministry of Science and Technology, Government of India.