
Abstract
Introduction:
Transcranial pulsed current stimulation (tPCS) could be used to deliver electrical pulses at different frequencies to entrain the cortical neurons of the brain. Frequency dependence of these pulses in the induction of changes in corticospinal excitability (CSE) has not been reported.
Objective:
We aimed to assess the effect of anodal tPCS (a-tPCS) at theta (4 Hz), and gamma (75 Hz) frequencies on CSE as assessed by the peak-to-peak amplitude of transcranial magnetic stimulation (TMS)-induced motor-evoked potentials (MEPs) and motor performance.
Method:
In a randomized, double-blinded, sham-controlled, crossover design study, 17 healthy participants attended 3 experimental sessions and received either a-tPCS at 4 and 75 Hz, or sham a-tPCS with 1.5 mA for 15 min. The amplitude of TMS-induced resting MEPs and time for completion of the grooved pegboard test were recorded at baseline, immediately after, and 30 min after a-tPCS.
Results:
Both a-tPCS at 75 and 4 Hz showed significantly increased CSE compared with sham. The a-tPCS at 75 Hz induced significantly higher CSE changes compared with 4 Hz. There was a significant increase in intracortical facilitation and a significant reduction in short-interval intracortical inhibition with both 4 and 75 Hz stimulations. However, the inhibition and facilitation did not correlate with CSE. Motor performance was unaffected by the interventions.
Conclusion:
The high CSE changes in M1 in a-tPCS at 75 Hz provide an initial understanding of the frequency-specific effect of a-tPCS. More research is needed to establish this concept and to assess its behavioral relevance.
Impact statement
Transcranial pulsed current stimulation (tPCS) is a novel brain stimulation technique that can modulate neural oscillation via the pulsatile current induced by the stimulation. Using anodal tPCS, we demonstrate the neuromodulatory effect induced by the stimulation at theta and gamma frequencies. Our findings recommend anodal tPCS as a potential therapeutic tool for treating many neurological conditions with altered theta and gamma neural oscillatory activity.
Introduction
Over the past decades, a significant number of studies have determined the importance of oscillatory neural activity in the human brain. Electroencephalography (EEG) oscillations at the gamma frequency band (30–100 Hz) have been categorized as prokinetic or motor rhythms, which facilitate movements. For instance, EEG studies have found that gamma oscillation increases before and during motor performance and has an effect on reaction time (Brown, 2003; Hamada et al., 1999; Joundi et al., 2012; Muthukumaraswamy, 2011; Santarnecchi et al., 2017; Shibata et al., 1999). In contrast, theta band oscillation (4–8 Hz), another form of brain rhythm, is considered a nonmotor rhythm (Tomassini et al., 2017).
Several studies have observed theta band activity during attentional and cognitive-related tasks rather than during “pure” motor functions (Kahana, 2006; Klimesch et al., 2008; Klimesch, 1996, 1999). It should be noted that the low-frequency theta band is predominantly activated during rapid eye movement sleep (Colgin, 2013; Xu et al., 2019), wakefulness, drowsiness, and working memory processes (Colgin, 2013; Herrmann et al., 2016; Huber et al., 2004; Huster et al., 2013; Rogante et al., 2015; Roohi-Azizi et al., 2017; Swaiman et al., 2011; Thut and Miniussi, 2009).
Given the importance of the synchronization of neural oscillation via external driving forces in motor control, “entrainment” has become an accepted concept in the noninvasive brain stimulation (NIBS) literature (Thut et al., 2011). Among the various NIBS techniques, transcranial pulsed current stimulation (tPCS) is advocated as having the ability to modulate brain oscillations through entrainment (Castillo Saavedra et al., 2014; Vasquez et al., 2016). tPCS involves the application of monophasic or biphasic pulses via electrodes placed over the target brain regions (Jaberzadeh et al., 2014, 2015) (Fig. 1). It is purported that polarity-dependent effect is induced by the net direct current component (NDCC) and a frequency-dependent effect is produced by the pulsatile (on/off) nature of the current (Jaberzadeh et al., 2014).
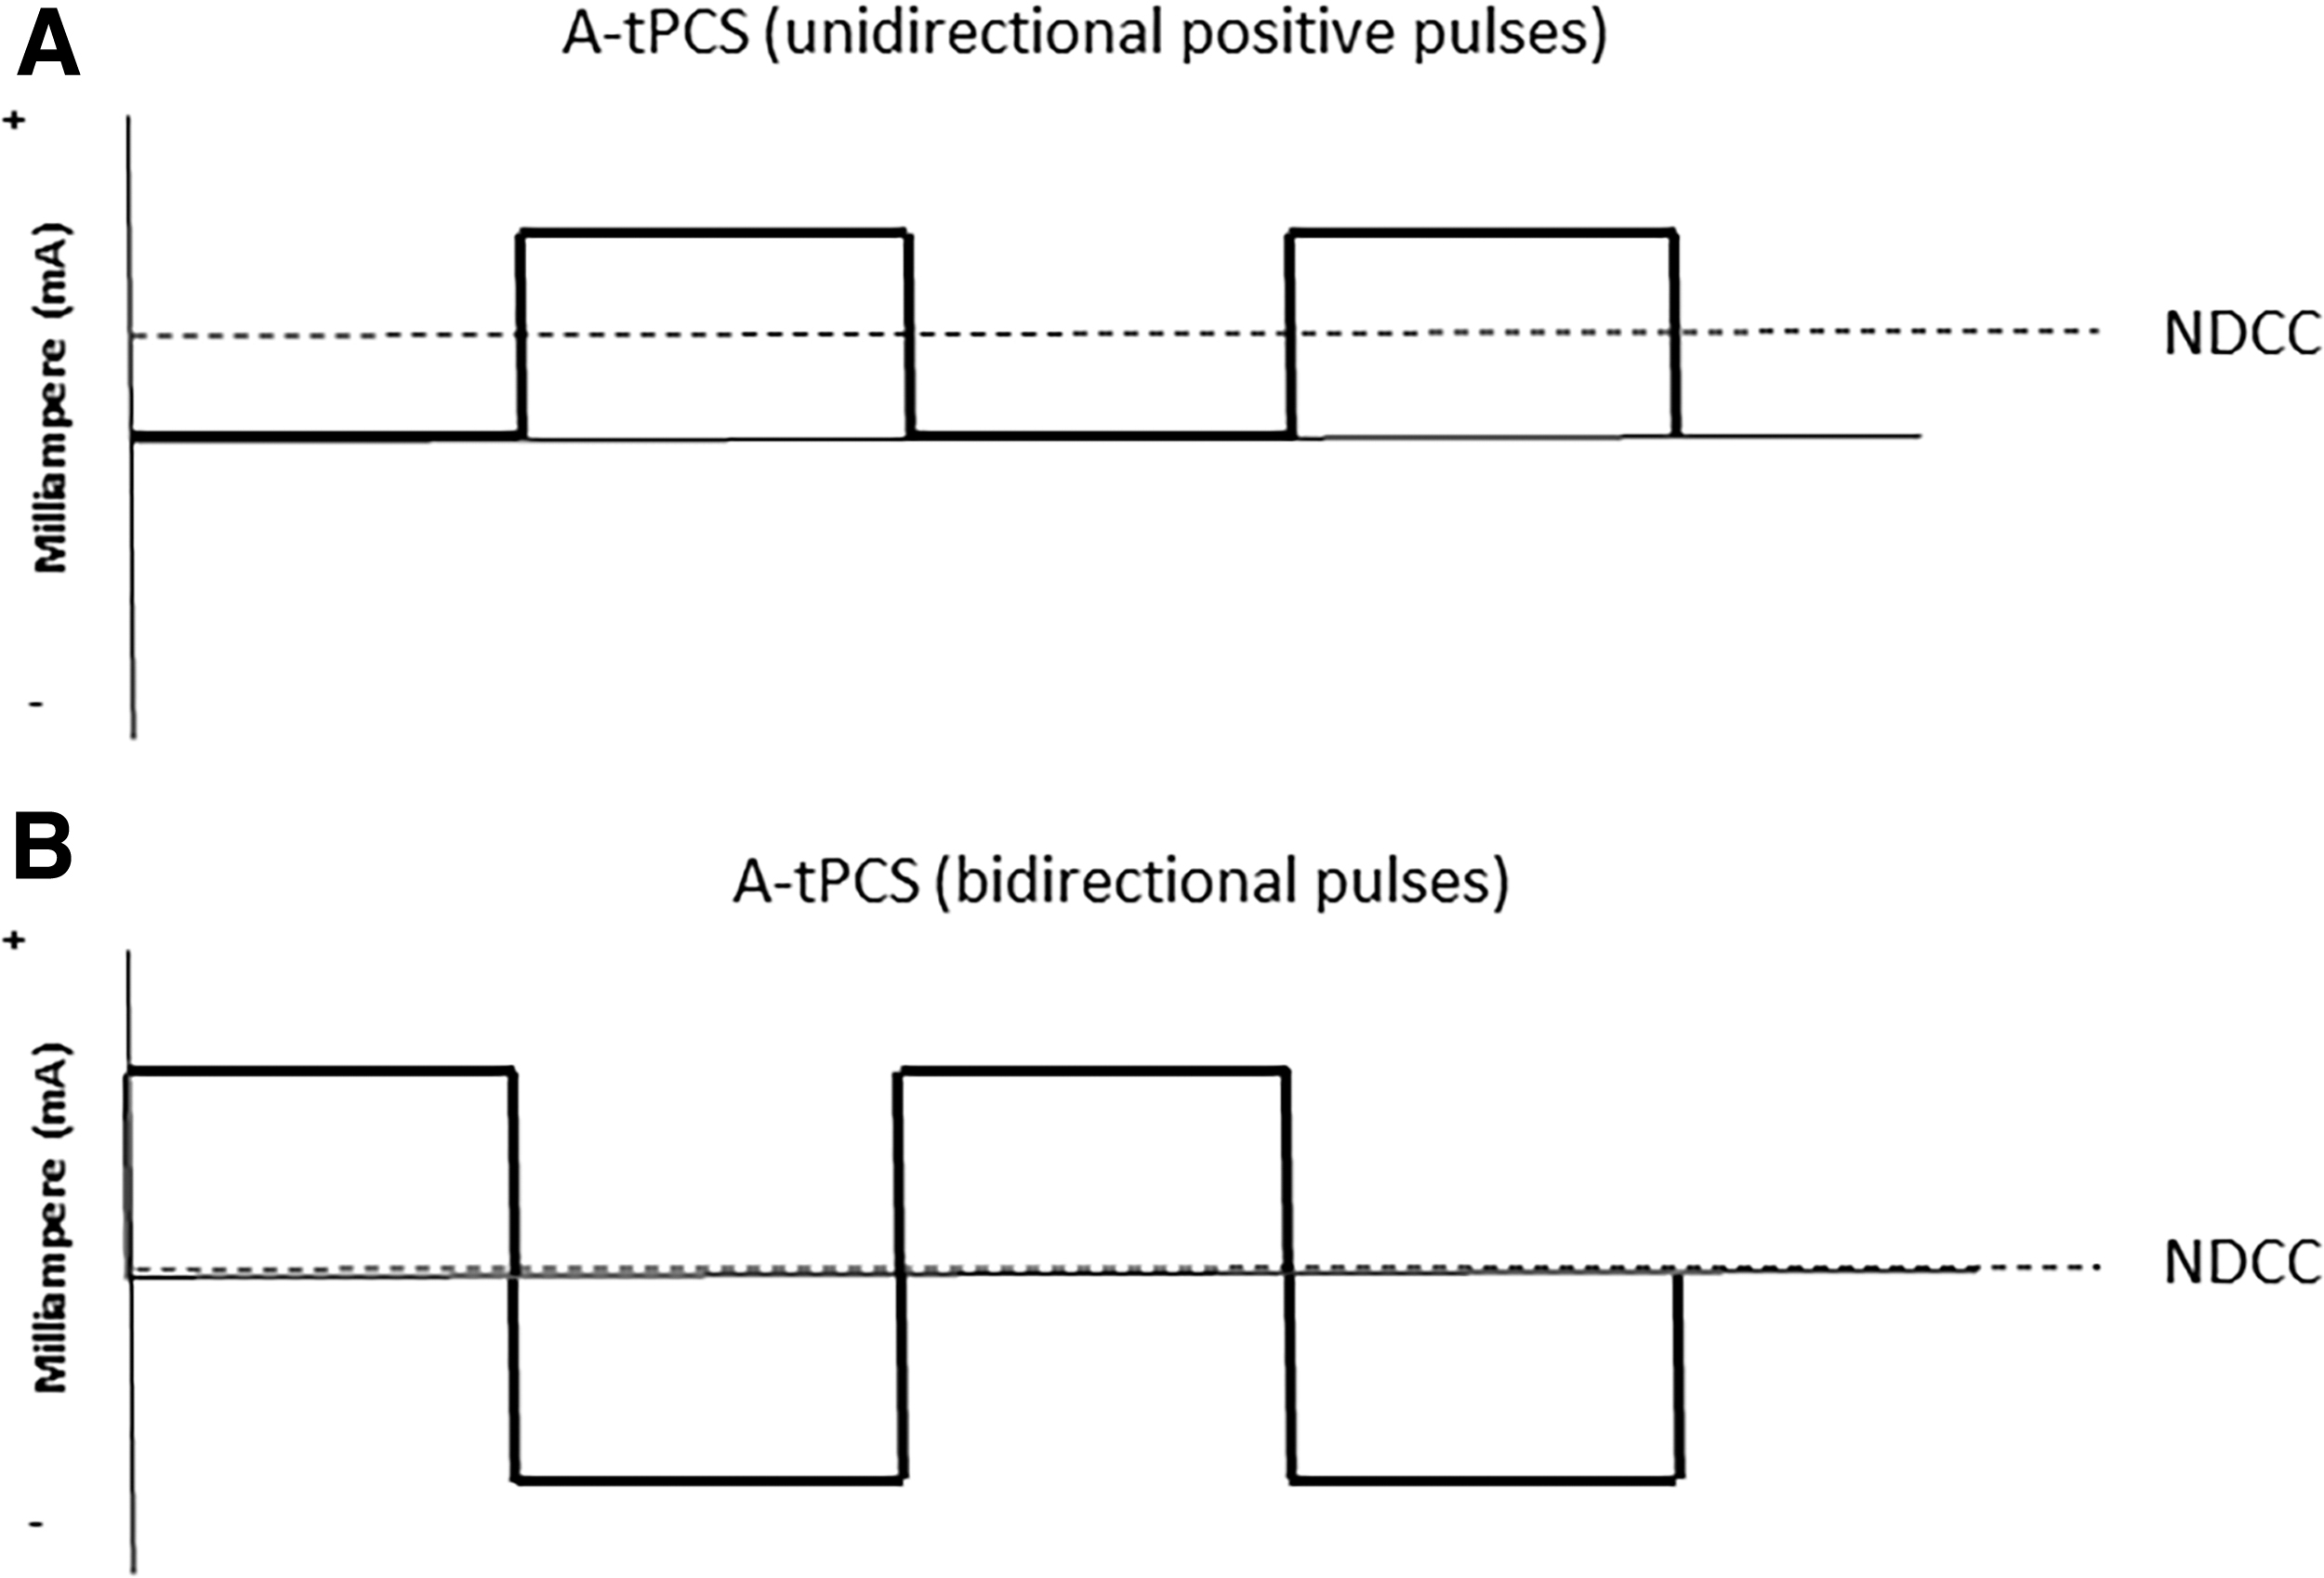
Types of tPCS techniques,
In the motor domain, a previous study has demonstrated that the application of monophasic anodal-tPCS (a-tPCS) at theta-band frequency (5.7 Hz) over the primary motor cortex (M1) resulted in no significant changes in the corticospinal excitability (CSE) of the M1 (Jaberzadeh et al., 2015). There are no other reports in the literature in this regard. Thus, there is a lack of literature addressing the effects of different frequencies on CSE. However, several studies have investigated the oscillatory effects of transcranial alternating current stimulation (tACS) on CSE (Antal et al., 2008; Feurra et al., 2013; Nowak et al., 2017). It should be noted that there are some similarities between the stimulation characteristics of tACS and tPCS (i.e., both use frequency-based pulses); consequently, the tACS literature may have implications for the investigation of tPCS.
For example, Feurra et al. (2013, 2019) have reported the failure of tACS at 5 Hz over M1 at rest to produce changes in CSE compared with no stimulation. Another study has also shown no effect on CSE during tACS at 7 Hz (Guerra et al., 2016). These findings are consistent with the nonmotor nature of theta oscillation, thereby indicating that the stimulation at theta frequency may not induce changes in CSE.
In contrast to stimulation in the theta frequency band, gamma oscillations are closely associated with the excitatory activity of interneurons in M1 (Buzsaki, 1996, 1998; Wang and Buzsaki, 1996). In this regard, a substantial body of research has reported that the application of tACS at gamma frequencies may modulate M1 activity via entrainment (Feurra et al., 2013, 2019; Guerra et al., 2018, 2019; Nowak et al., 2017; Zaehle et al., 2010). It has been suggested that neural populations gradually respond to entrainment stimuli, through which the fully entrained state has zero phase-lag between neural populations and the entraining stimulus (Hanslmayr et al., 2019).
Furthermore, the literature indicates an association between oscillatory activity in the gamma band and the balance between excitation and inhibition within reciprocally connected networks of inhibitory GABA-ergic interneurons and excitatory glutamatergic pyramidal cells within the M1 area, which relates to the CSE level (Atallah and Scanziani 2009; Gaetz et al., 2013; Sugata et al., 2018). It is worth noting that changes in movement performance have been associated with gamma oscillation in humans (Bologna et al., 2019; Guerra et al., 2018; Heinrichs-Graham et al., 2018; Joundi et al., 2012; Moisa et al., 2016). Specifically, tACS of M1 at 70 Hz improves visuomotor performance by increasing the synchronization of M1 circuits with the gamma frequency bands (Joundi et al., 2012; Moisa et al., 2016).
Accordingly, it is evident that gamma oscillations in the motor cortex play a vital role in shaping movement. However, this premise is based on studies involving tACS, and there is a lack of empirical support for the frequency-dependent effects of tPCS on CSE.
To date, no study has compared the effects of nonmotor and motor-related tPCS frequency bands on M1. Moreover, the effect of a-tPCS at gamma oscillation on CSE has not yet been investigated. According to a study by Jaberzadeh et al. (2015), a-tPCS at theta oscillation produces no change in CSE (Jaberzadeh et al., 2015), however, the behavioral relevance of this outcome is not known. Therefore, it is yet to be determined whether the application of monophasic a-tPCS at the motor-related gamma frequency and nonmotor theta frequency produces changes in CSE in the M1 area.
It also remains undetermined if changes in CSE lead to changes in motor performance. Investigating the frequency-specific effects of a-tPCS on CSE can aid in identifying the optimal parameters for stimulus-related effects on motor processes. Specifically, these two frequencies have clinical implications.
Altered theta and gamma neural oscillations have been reported in many neurological conditions, including autism spectrum disorder, major depressive disorder, Alzheimer's disease, and post-traumatic stress disorder (Hornung et al., 2019; Jeong, 2004; Jia and Kohn, 2011; Newson and Thiagarajan, 2019; Rubenstein and Merzenich, 2003; Uhlhaas and Singer, 2006). Thus, the main aim of this study was to examine whether there are differences in the effects of monophasic a-tPCS at nonmotor low-frequency theta (4 Hz) and motor-related high-frequency gamma (75 Hz) frequencies applied to the left M1 on CSE and motor performance.
Materials and Methods
Participants
Seventeen healthy volunteers (age 21.8 ± 3.2 years, range 19–30 years; 14 female) were recruited in accordance with procedures approved by the Human Research Ethics Committee at Monash University, Australia. The sample size was calculated (with a power of 80%) based on the data gathered from a pilot study (n = 8). Before enrollment, all participants completed the Adult Safety Screening Questionnaire (Keel et al., 2001) to determine their suitability for transcranial magnetic stimulation (TMS) assessment, and written informed consent was obtained according to the Declaration of Helsinki. All participants were right-handed and reported no contraindications to tPCS or TMS. None of the participants had a history of any neurological disease and was not using any medications at the time of the experiment.
Experimental design and procedure
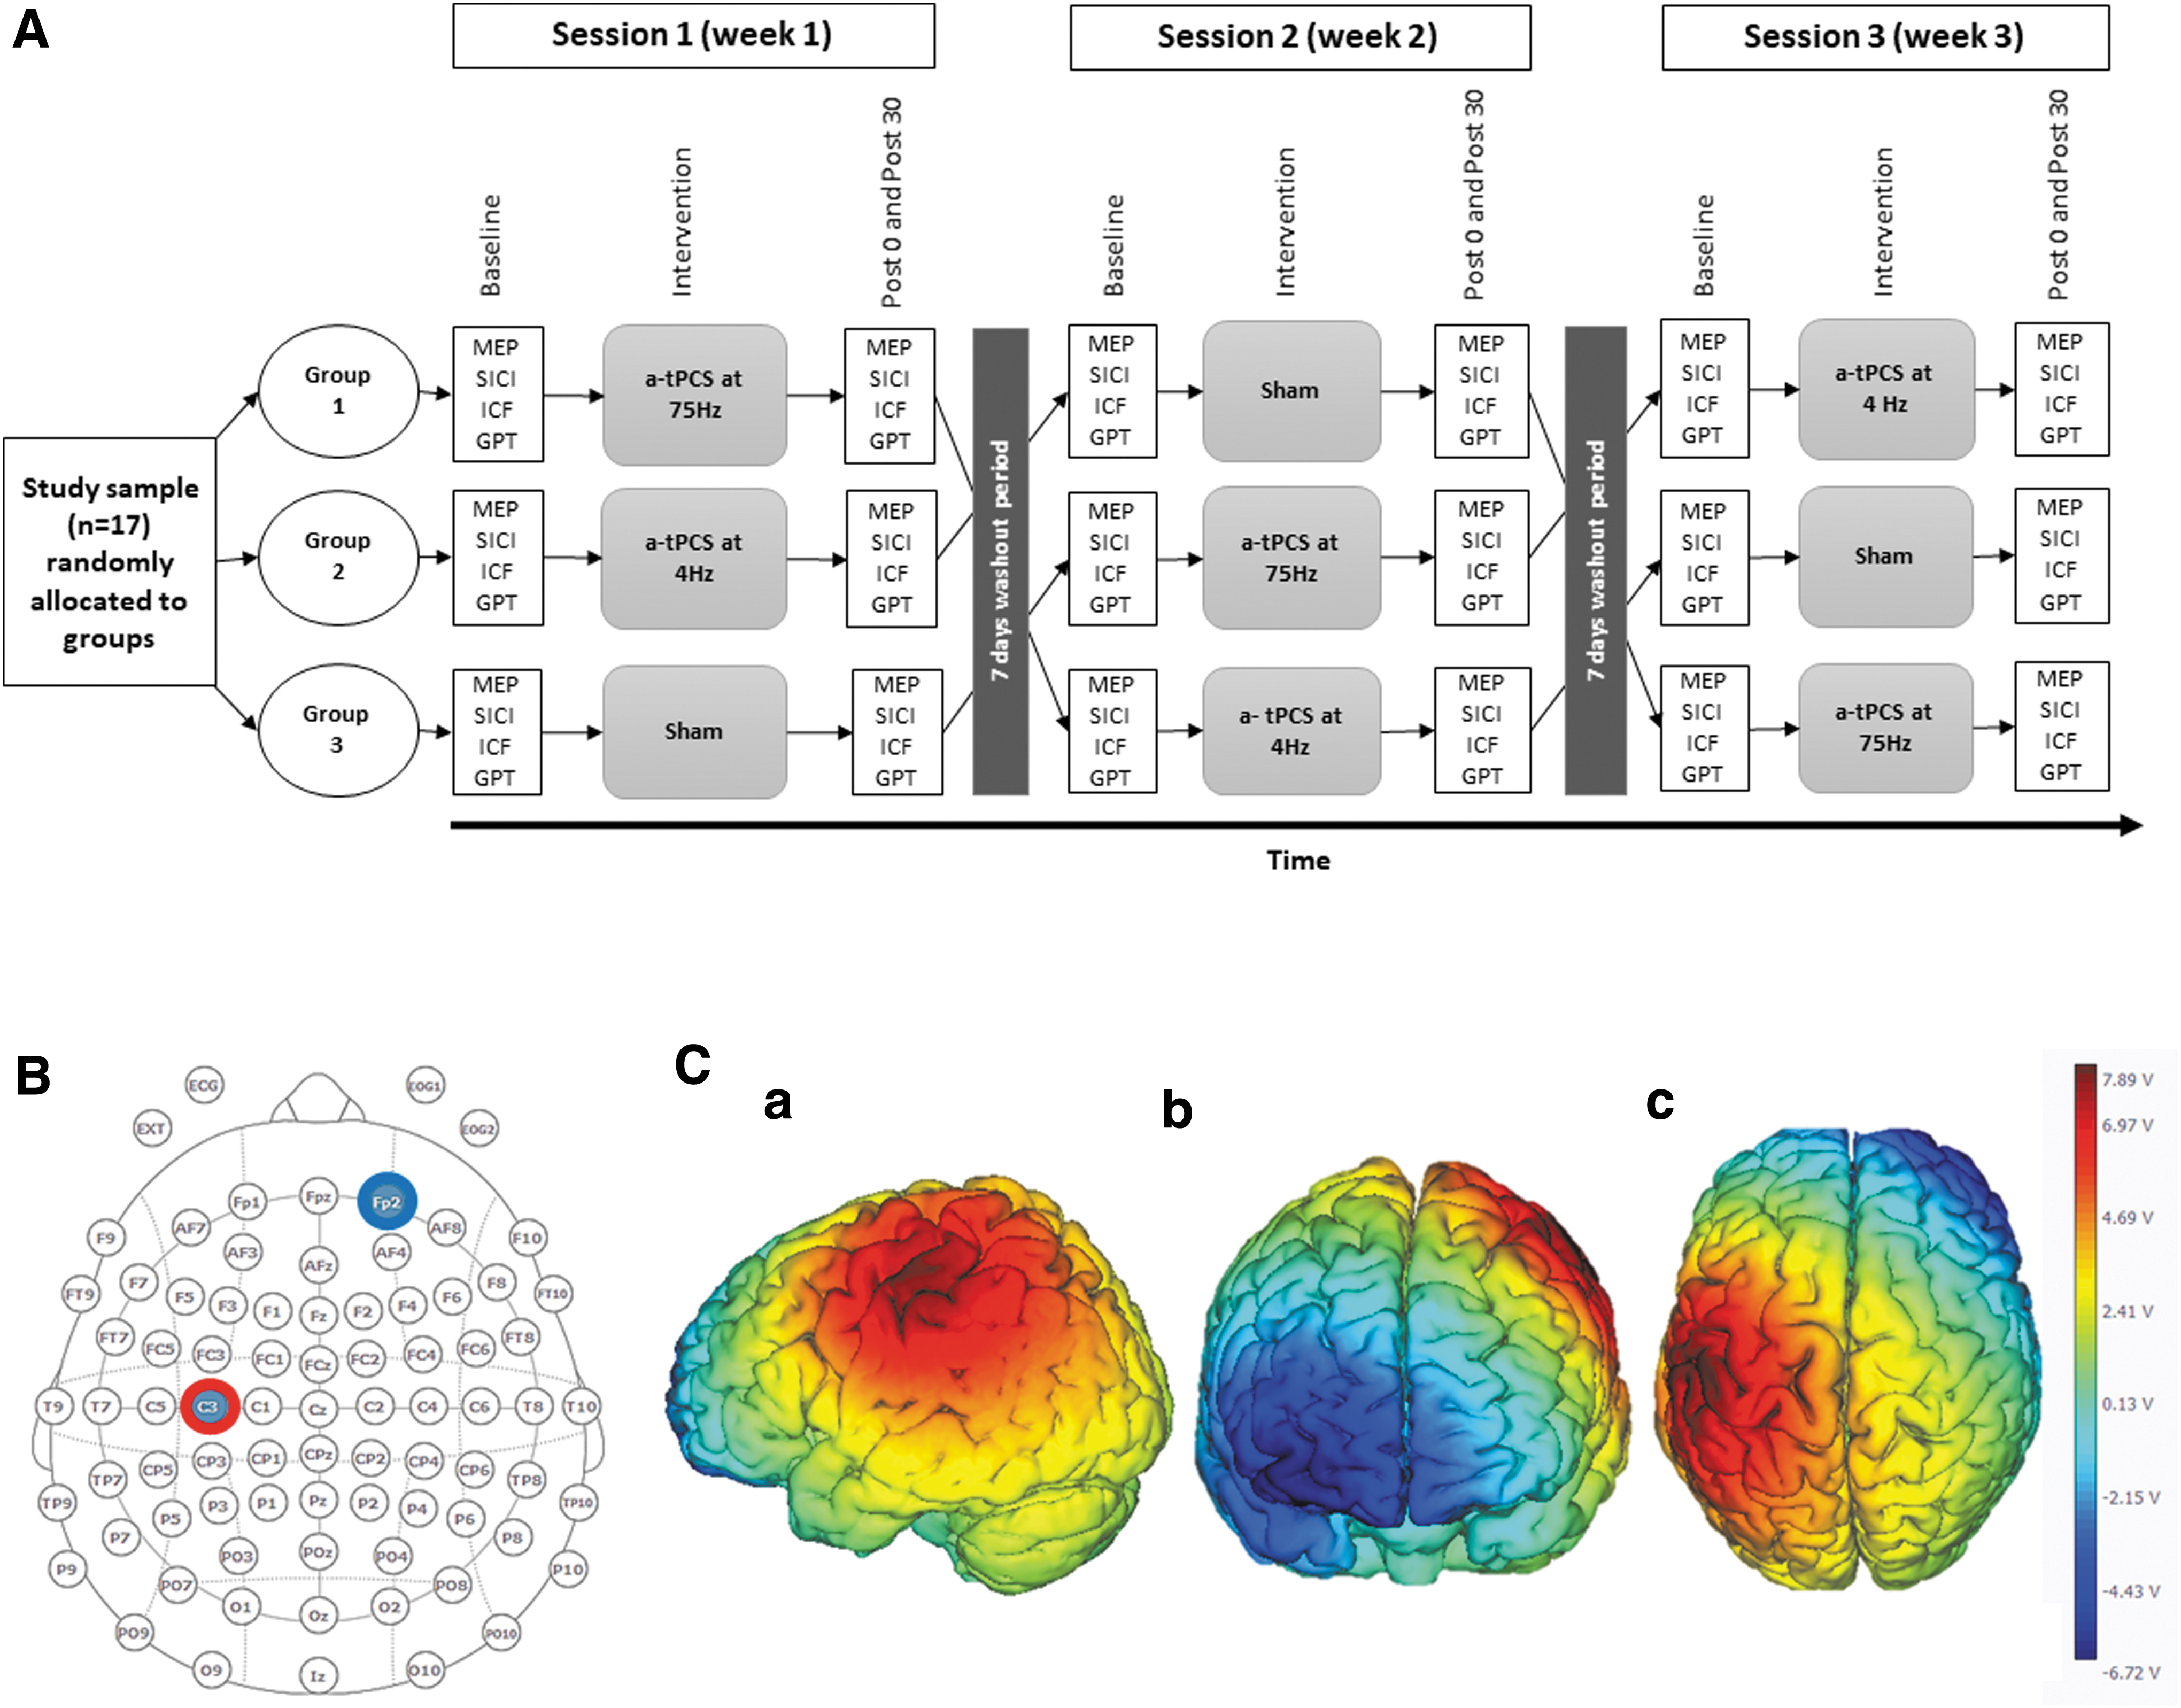
A randomized, sham-controlled crossover design was implemented to assess the effects of a single session of monophasic a-tPCS of left M1 at 4 and 75 Hz on CSE and motor performance. All participants attended three experimental sessions separated by at least 1 week to avoid carryover effects. All experiments were conducted at approximately the same time of the day (between 8.00 am and 12.00 pm) to avoid diurnal variation (Fig. 2). The experimental conditions were as follows: (1) a-tPCS of the left M1 at 4 Hz, (2) a-tPCS of the left M1 at 75 Hz, and (3) sham a-tPCS of left M1. The order of these interventions was randomized and partially counterbalanced across the participants.
Measurements of resting motor-evoked potentials (MEPs), intracortical facilitation (ICF), and inhibition in left M1 using TMS and motor performance using the grooved pegboard test (GPT) were acquired before (baseline), immediately after (post 0), and 30 min after completion of stimulation (post 30).
Anodal tPCS
Active stimulation
A-tPCS was delivered via a Starstim (Neuroelectrics, Barcelona, Spain) through a pair of circular-shaped, saline-soaked, surface sponge electrodes (25 cm2). The active electrode was placed over the TMS-derived first dorsal interosseous (FDI) hot spot over the left M1, and the return electrode was positioned on the contralateral supraorbital area (FP2, international 10–20 EEG system) (Jaberzadeh et al., 2014, 2015). The electrodes were fixed into a head cap (Neuroelectrics® Neoprene Head cap) and the cap was tightened up using two pieces of elastic straps. Two pregelled self-adhesive reference electrodes (driven right leg and common mode sense) were placed over the left mastoid to check the skin impedance. The skin impedance was kept at <5 kΩ via the automatic impedance monitoring of the device.
a-tPCS consists of unidirectional rectangular monophasic pulses. The stimulation parameters were set through NIC software (v1.4 Windows), which was connected to the electrodes through a cable. Two text files were created using MATLAB (version R2018a; MathWorks) and run in the system software to generate a-tPCS at 4 and 75 Hz. The stimulation parameters are listed in Table 1. The total charge was kept constant during both the active stimulation sessions (total charge 30 mC/cm2). The total charge for a-tPCS was calculated using the following formula:
Stimulation Parameters
where TC is the total charge (milli-Coulomb per centimeter squared, mC/cm2), SI is the stimulus intensity (milliampere, mA), ES is the electrode size (cm2), PD is the pulse duration (msec), and NP is the number of pulses.
Sham stimulation
The sham condition involved electrodes placed in the same positions as in the active stimulation. Brief periods of a-tPCS at 75 and 4 Hz were used randomly as sham stimulation. The stimulation was initially held constant for 30 sec between 10 sec of ramp up and ramp down, and the current turned to zero mA for the remainder of the stimulation period (14 min 10 sec) (Jaberzadeh et al., 2014, 2015).
Double blinding
The participants and one investigator were blinded to the stimulation conditions. Two investigators were involved in the testing. The first investigator (assessor) recorded all outcome measures but was blinded to the stimulation conditions. The second investigator applied the stimulation conditions (4 Hz, 75 Hz, or sham). Importantly, the participants were not informed of the stimulation conditions that they were receiving. However, one challenge for blinding participants is the induction of phosphenes or light flashing sensations in the visual field during the application of low-frequency pulsed currents. Monophasic a-tPCS produces phosphenes on the retina (Jaberzadeh et al., 2014, 2015). Phosphene production is frequency dependent, and visual flashing occurs mainly at lower frequencies (Turi et al., 2013).
It should be noted that a-tPCS at 75 Hz does not produce light flashing sensations compared with 4 Hz, which has the potential to confound blinding of the participants. Therefore, to induce the illusion of low-frequency light flashing during all stimulation conditions, a flashing light source with a low frequency of 4 Hz was set to operate behind the participants while they were receiving different stimulation conditions.
Measurement of the side effects
All participants completed a questionnaire to rate the side effects of stimulation, such as paraesthesia, pain, and intensity of flashing light perceptions during all the experimental conditions. Side effects were assessed at the beginning, during, and at the end of the interventions. All participants ranked the unpleasantness of any scalp sensation using a numeric analog scale (e.g., 0: “no paraesthesia,” “no pain,” “no phosphenes,” 10: “worst paraesthesia,” “worst pain,” “strong phosphenes”). In addition, the participants were asked to indicate if they thought the stimulation was either active or sham at the end of their participation in all the testing conditions.
Tools for assessment of CSE
In each assessment session, participants were seated comfortably in a fully adjustable chair (treatment chair; MagVenture, Denmark) with their head and neck supported by a headrest, with their right forearm pronated and the wrist joint in a neutral position on an armrest. A standard skin preparation of cleaning and abrading was performed for each electrode site to achieve low skin impedance of ≤10 kΩ (Gilmore and Meyers, 1983; Groppa et al., 2012). Pregelled self-adhesive bipolar Ag/AgCl disposable surface electromyography (EMG) electrodes (Kendall™) were placed in the belly-tendon montage of the right FDI muscle.
The ground electrode was placed over the ipsilateral styloid process of ulnar bone (Oh, 2003). EMG signals were amplified ( × 1000) and bandpass filtered (10–500 Hz) via a laboratory analog/digital interface (The PowerLab 4/35; AD Instruments, Australia), and recorded for offline processing using commercially available software (LabChart™ software; AD Instruments, Australia).
Participants remained seated during the TMS measurements with eyes open looking forward. The vertex (Cz, international 10–20 system) was identified and marked as a reference point for locating the hand representation area in the left M1. Single-pulse TMS was applied over M1 using a MagPro R30 (MagOption) stimulator (MagVenture, Denmark) with a figure-of-eight coil (max. initial dB/dt 28 KT/s near the coil surface). The coil was placed tangentially over the left hemisphere, with the handle pointing backward at 45° from the midline sagittal plane of the skull (Vaseghi et al., 2015). The area of stimulation with the largest and most stable MEPs was identified as the hotspot and marked on the scalp to be used throughout the tests to ensure the consistency of the coil placement.
The resting motor threshold (RMT) and minimum stimulus intensity that can evoke 1 mV peak-to-peak MEP amplitude (I 1mV) were determined using the adaptive threshold hunting method based on the parametric estimation of sequential testing (PEST) (Awiszus, 2003) before application of tPCS. A freeware program called Motor Threshold Assessment Tool (MTAT 2.0), which uses a maximum-likelihood PEST strategy without prior information, was used to assess RMT based on TMS intensities derived by the program (Awiszuz and Borckardt, 2011).
For RMT, an MEP amplitude of >50 μV was considered a successful trial, and an MEP amplitude >1 mV was used as a successful trial for I 1mV (Silbert et al., 2013). When this intensity was not observed, a new intensity displayed by the program was used until the success point was reached. The target RMT and I 1mV were found when it was mathematically valid, and 95% confidence intervals were within accuracy limits imposed by safety guidelines (Awiszus, 2011, 2012).
It has been identified that the short-intertrial interval of TMS pulses can produce a hysteresis, which relates to the possibility that an MEP amplitude elicited by one TMS pulse influences the MEP of the subsequent TMS pulse (Moller et al., 2009). Therefore, an interstimulus interval of 6 sec was used during threshold estimation and recording of MEPs to avoid hysteresis effects (Julkunen et al., 2012; Moller et al., 2009).
The single-pulse protocol was used to obtain 20 MEPs for the relaxed right FDI muscle. The baseline TMS intensity was adjusted to elicit 1 mV peak-to-peak MEP amplitude, and this intensity was kept constant during postintervention assessments.
Paired-pulse protocols were used to assess short-interval intracortical inhibition (SICI) and ICF in the M1 area. In this method, a subthreshold TMS pulse for a motor response (conditioning stimulus) activates intracortical inhibitory circuits in the M1 area and changes the size of the MEP elicited by a suprathreshold TMS pulse (test stimulus) that was delivered (3 ms) or (10 ms) later to probe GABAergic or glutamatergic functions, respectively. These interpulse intervals were chosen based on the previous studies (Ferreri et al., 2011; Kujirai et al., 1993; Rossini et al., 2015; Tokimura et al., 2000).
The conditioning stimulus intensity was set at 80% RMT (0.8 × RMT), and the test stimulus intensity was set to be able to produce 1 mV MEPs at baseline and readjusted after the stimulation to compensate for the effects of the intervention on the MEP amplitude if required (Byblow and Stinear, 2006; Di Lazzaro et al., 2012; Rosenkranz and Rothwell, 2004; Sinclair and Hammond, 2008) for both SICI and ICF protocols. Resting-state MEPs, SICI, and ICF were measured at baseline, immediately after a-tPCS (post 0), and 30 min after a-tPCS (post 30). Twenty trials per condition were applied in three blocks (Goldsworthy et al., 2016). These blocks were designed to deliver single- or paired-pulse TMS randomly, and each block contained 20 single (≅5 min)- and 40 paired-pulse stimuli (20 interstimulus intervals of 3 ms [≅3 min] and 20 interstimulus intervals of 10 ms [≅7 min]).
MEP data management
The areas under the curves of MEPs were quantified off-line from digitized averages of rectified EMG for conditioned and test stimuli in each trial via a custom-designed macro using Power Lab 4/35 software. SICI and ICF were expressed as the percentage of conditioned MEPs to the test MEPs (Hashemirad et al., 2017; Vaseghi et al., 2015).
Measurement of motor performance
The GPT was used to test motor performance (Lafayeyye instrument company, Model 32025). The test consists of a board with 25 keyholes. Keys must be rotated into the correct orientation to be inserted into the keyholes. The keys were placed on a tray above the keyholes, and participants were asked to match holes with keys as fast as they could. The time required to complete all 25 keyholes was evaluated in seconds, and this value was recorded as the outcome measure for motor performance. The test was administered for the dominant hand (GPT-R) and nondominant hand (GPT-L) for three trials (≅6 min) at all three time points, with the average time recorded.
Statistical analyses
Statistical analyses were performed using SPSS software version 25.0 (IBM). Normality of data distribution was tested by the Shapiro–Wilk test. The log transformation was performed on non-normally distributed data to achieve normal distribution. Parametric tests were conducted on normally distributed data. If a distribution was not normal and the skewness of the log data was more than one after transformation, then nonparametric tests were carried out.
The parametric test of one-way analysis of variance (ANOVA) was used to test for differences between the baseline values for outcome measures (RMT, I 1mV, MEP amplitudes of I 1mV, SICI, ICF, and time for completion of GPT [GPT-R and GPT-L]) at different experimental sessions. The parametric test of two-way repeated-measures ANOVA (RM-ANOVA) was performed to assess the effects of a single session of a-tPCS on MEPs, SICI, ICF, and GPT (GPT-R and GPT-L), with the factor of group (4 Hz, 75 Hz, sham) and the factor of time (baseline, post 0, post 30) as within-subject factors. Mauchly's test was used to test for assumption of sphericity, and Greenhouse–Geisser corrections were applied when specificity was lacking.
In case of significant main effects, post hoc analyses were performed using paired sample t-test with Bonferroni correction. Pearson's correlation test was used to assess any correlation between the SICI/ICF and the CSE following a-tPCS.
The nonparametric test of Friedman test was carried out on the mean values of paraesthesia, pain, and phosphenes perception under the active and the return electrodes to assess any significant difference between the groups. In addition, Pearson's chi-square test was used to assess whether participants were successfully blinded to the stimulation conditions (active or sham). The significant level for all tests was set at p < 0.05. All data are presented as means and standard deviations unless otherwise indicated.
Results
Comparison of baseline values
One-way ANOVA on baseline data for all the different experimental conditions was performed to ensure lack of carryover effects between the conditions at baseline. There was no significant difference in baseline values for RMT and I 1mV between the stimulation groups [RMT: F (2, 48) = 0.020, p = 0.980; I 1mV: F (2, 48) = 0.282, p = 0.756], respectively.
Similarly, there were no differences between the baseline values of different groups in MEP amplitude resulting from any of the protocols performed at rest [MEP: F (2, 48) = 0.697, p = 0.503; SICI: F (2, 48) = 0.053, p = 0.948; ICF: F (2, 48) = 0.014, p = 0.986; GPT-R: F (2, 48) = 0.528, p = 0.593; GPT-L: F (2, 48) = 0.468, p = 0.629]. RM-ANOVA showed that there was no difference between the amplitude of MEP at baseline and the amplitude of MEP adjusted after stimulation. There was no main effect of group [F (2, 32) = 1.547, p = 0.228, ηp 2 = 0.088] or time [F (2, 32) = 1.704, p = 0.204, ηp 2 = 0.096] and no group × time interaction [F (4,64) = 0.783, p = 0.540, ηp 2 = 0.047].
Effect of a-tPCS on CSE
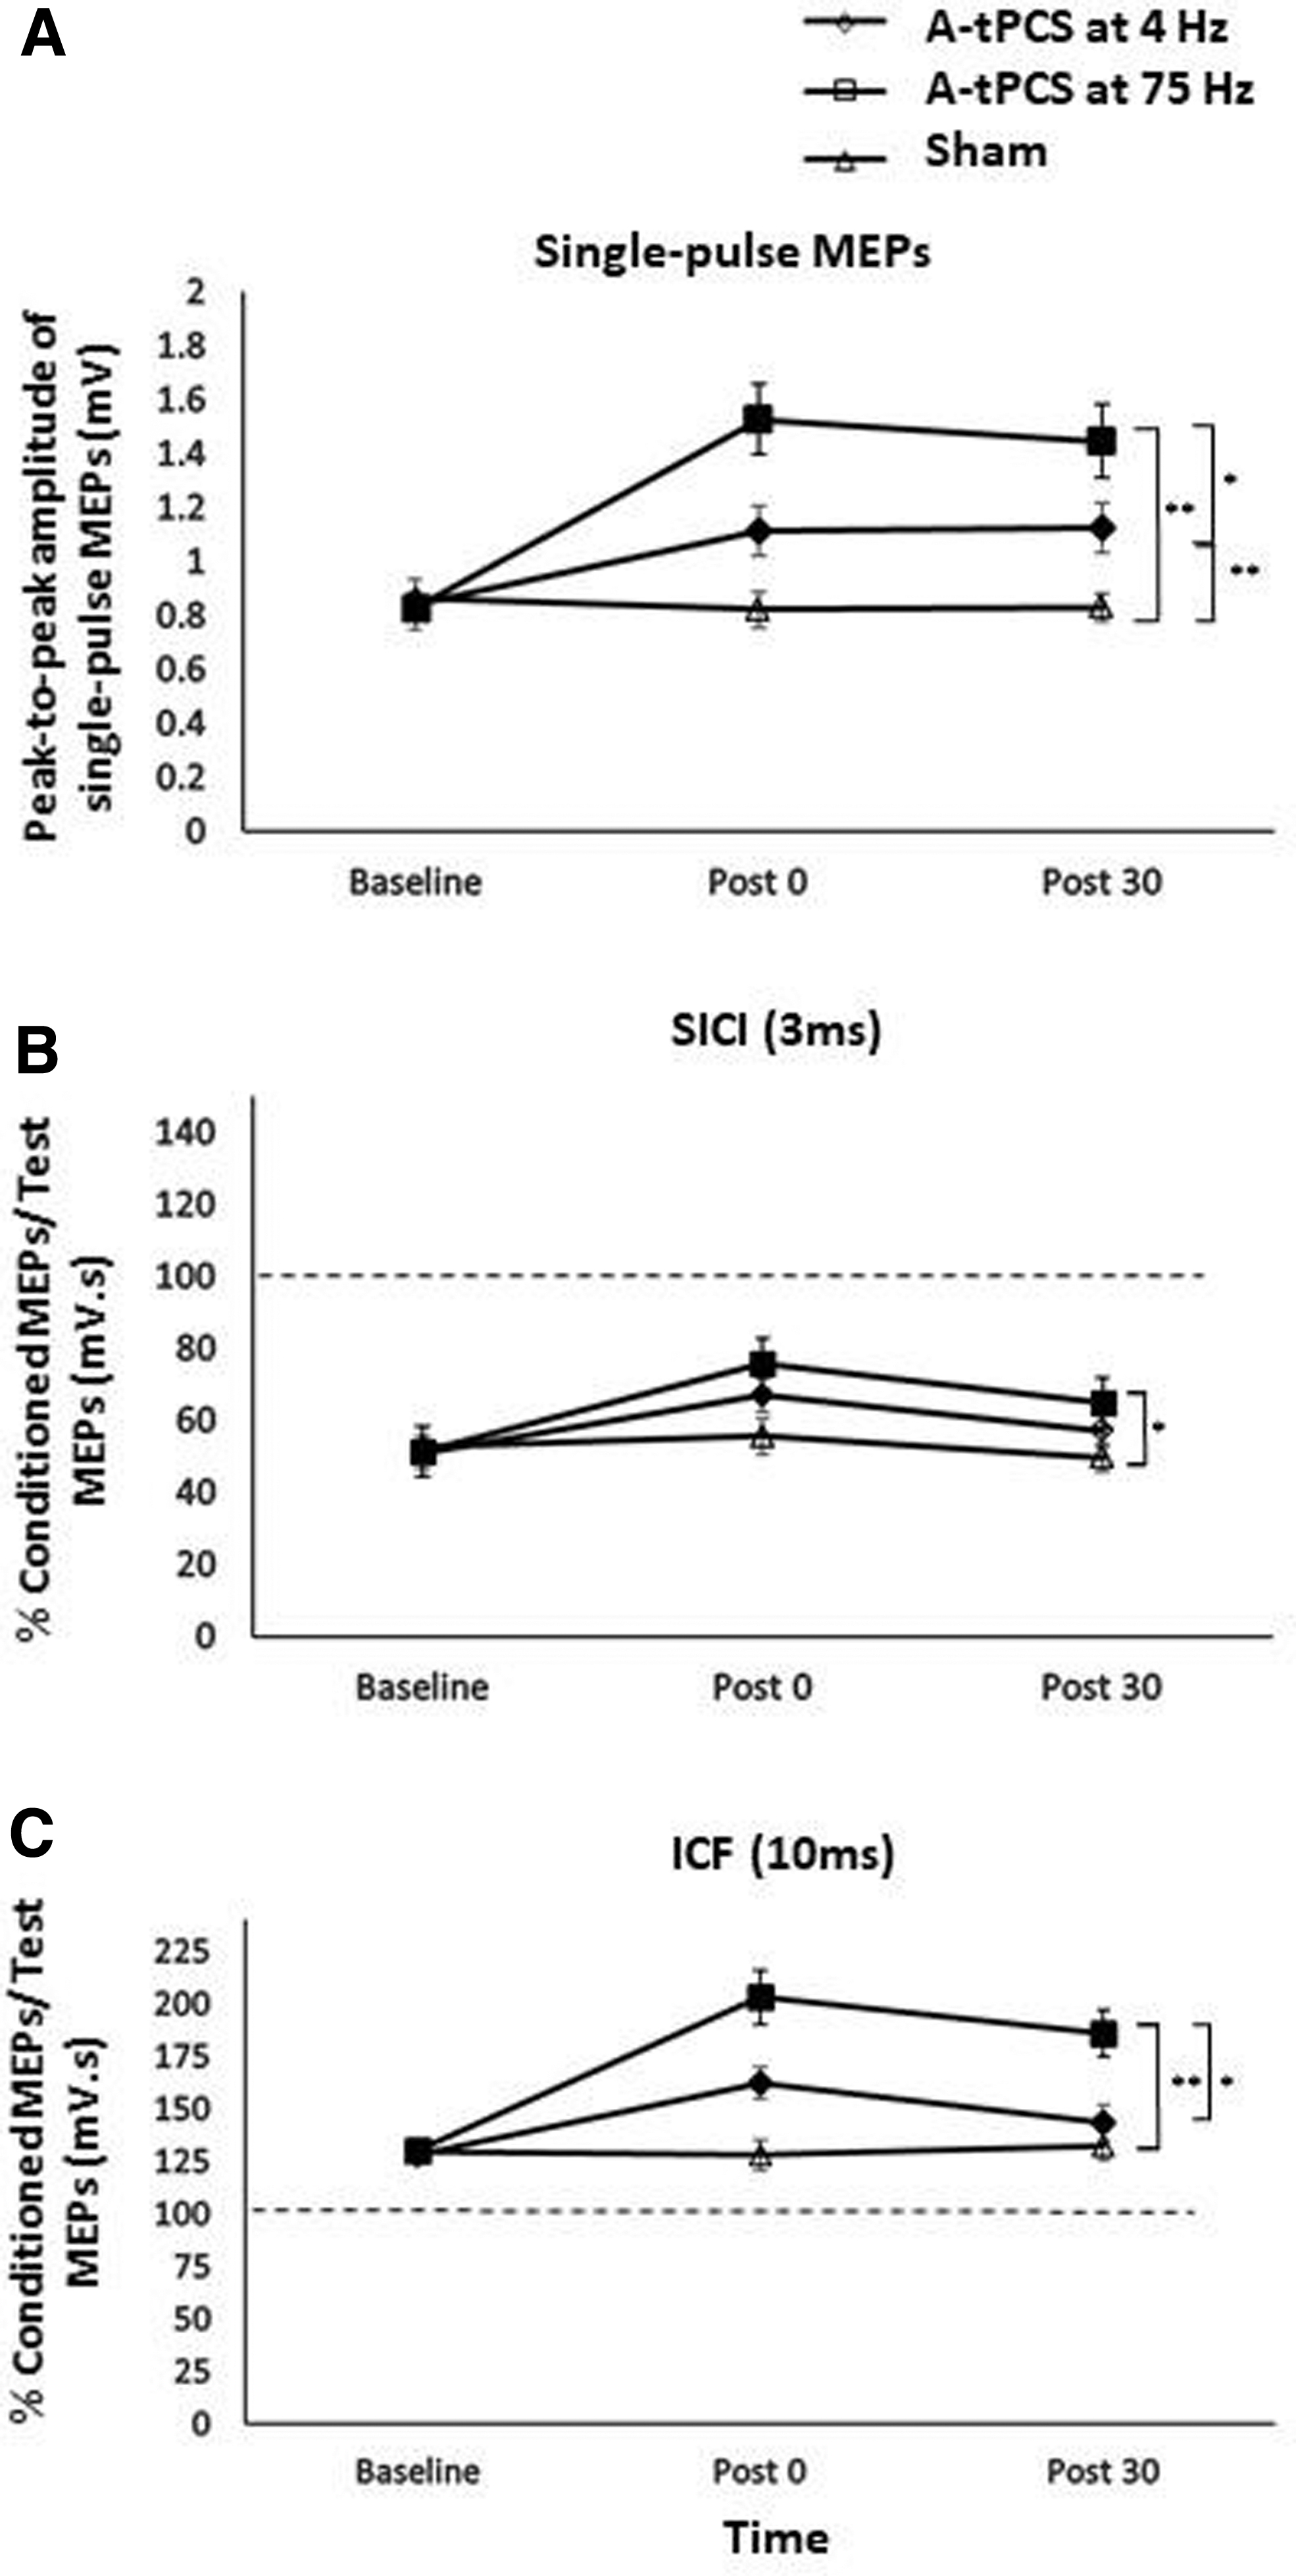
The effect of a-tPCS frequency on CSE, as reflected by peak-to-peak amplitude of single-pulse TMS-induced MEPs, was calculated. RM-ANOVA showed significant main effects of a-tPCS group [F (2, 32) = 19.058, p < 0.001, ηp 2 = 0.544], time [F (2, 32) = 11.428, p = 0.001, ηp 2 = 0.417], and the interaction between group and time [F (4, 64) = 14.108, p < 0.001, ηp 2 = 0.469] (Figs. 3A and 5A–C).
The effect of a-tPCS on CSE. Average MEP amplitude (±SEM) values for I
1mV
Post hoc comparisons demonstrated a significant increase of CSE with a-tPCS at 75 Hz compared with sham at post 0 [t (16) = 6.229, p < 0.001] and post 30 [t (16) = 5.506, p < 0.001]. The results also showed a significantly higher CSE with a-tPCS at 75 Hz compared with 4 Hz at post 0 [t (16) = −2.769, p = 0.014] and post 30 [t (16) = −2.493, p = 0.024]. CSE with a-tPCS at 4 Hz was also significantly higher than sham at post 0 [t (16) = 3.462, p = 0.003] and post 30 [t (16) = 3.625, p = 0.002].
Within-group analyses revealed that CSE with a-tPCS at 75 Hz at post 0 was not significantly different compared with post 30 [t (16) = 0.832, p = 0.417] although it was significantly higher than baseline [t (16) = −6.578, p < 0.001]. CSE at post 0 in a-tPCS at 4 Hz was also significantly higher than baseline [t (16) = −2.486, p = 0.024], whereas no difference was observed between CSE at post 0 and post 30 with a-tPCS at 4 Hz [t (16) = −0.078, p = 0.939]. There was no difference between sham stimulation at baseline and post 0 [t (16) = 1.208, p = 0.244], and post 0 and post 30 [t (16) = −0.836, p = 0.415].
Effect of a-tPCS on SICI
The effect of tPCS on local GABAA inhibition reflected by SICI was investigated in this study. There was a significant time effect [F (2, 32) = 9.654, p = 0.001, ηp 2 = 0.376] and a significant group by time interaction [F (4, 64) = 2.960, p = 0.037, ηp 2 = 0.156] (Figs. 3B and 5D–F). The group effect did not reach significance [F (2, 32) = 3.298, p = 0.052, ηp 2 = 0.171], and post hoc analysis showed that SICI at post 0 [t( 16) = 2.773, p = 0.014] and post 30 [t (16) = 2.706, p = 0.016] for a-tPCS at 75 Hz was significantly decreased compared with sham.
SICI at post 0 did not differ significantly between the a-tPCS at 4 and 75 Hz [t (16) = −1.279, p = 0.219]. Also, SICI for a-tPCS at 4 Hz was not significantly different compared with sham at post 0 [t (16) = 1.777, p = 0.095] and post 30 [t (16) = 1.492, p = 0.155]. No difference was observed between SICI at baseline and post 0 in the sham session [t (16) = −0.637, p = 0.533]. Within-group analysis showed that SICI at post 0 for a-tPCS at 75 Hz was significantly different to post 30 [t (16) = 2.249, p = 0.039]. Similarly, a significant difference was also observed between SICI at post 0 and post 30 for a-tPCS at 4 Hz [t (16) = 2.352, p = 0.032]. SICI at post 0 for a-tPCS at 4 and 75 Hz was also significantly smaller than at baseline [t (16)4Hz = −3.619, p = 0.002; t (16)75Hz = −4.010, p = 0.001).
The effect of a-tPCS on ICF
The effect of a-tPCS on glutamate activity, as reflected by ICF, was tested. Consistent with the significant effect on single-pulse MEPs, the results of RM-ANOVA revealed a significant main effect of group [F (2, 32) = 16.903, p < 0.001, ηp 2 = 0.514], time [F (2, 32) = 21.393, p < 0.001, ηp 2 = 0.572], and a significant group by time interaction [F (4, 64) = 15.059, p < 0.001, ηp 2 = 0.485] (Figs. 3C and 5G–I).
Post hoc analysis showed a significant increase in ICF following a-tPCS at 75 Hz compared with sham at post 0 [t (16) = 6.129, p < 0.001] and at post 30 [t (16) = 4.644, p < 0.001]. ICF at post 0 for a-tPCS at 75 Hz was significantly higher than at post 0 for a-tPCS at 4 Hz [t (16) = −3.335, p = 0.004]. ICF for a-tPCS at 4 Hz was also significantly higher than sham at post 0 [t (16) = 4.874, p < 0.001], but not post 30 [t (16) = 0.970, p = 0.346].
No difference was observed between ICF at baseline and post 0 in the sham session [t (16) = 0.348, p = 0.7322]. Within-group analysis showed that ICF at post 0 for a-tPCS at 75 Hz was significantly different from post 30 [t (16) = 3.655, p = 0.002]. Similarly, a significant difference was also observed between ICF at post 0 and post 30 for a-tPCS at 4 Hz [t (16) = 3.082, p = 0.007]. ICF at post 0 for both a-tPCS at 4 and 75 Hz was significantly higher than at baseline [t (16)4Hz = −4.451, p < 0.001; t (16)75Hz = −5.456, p < 0.001; Fig. 4).
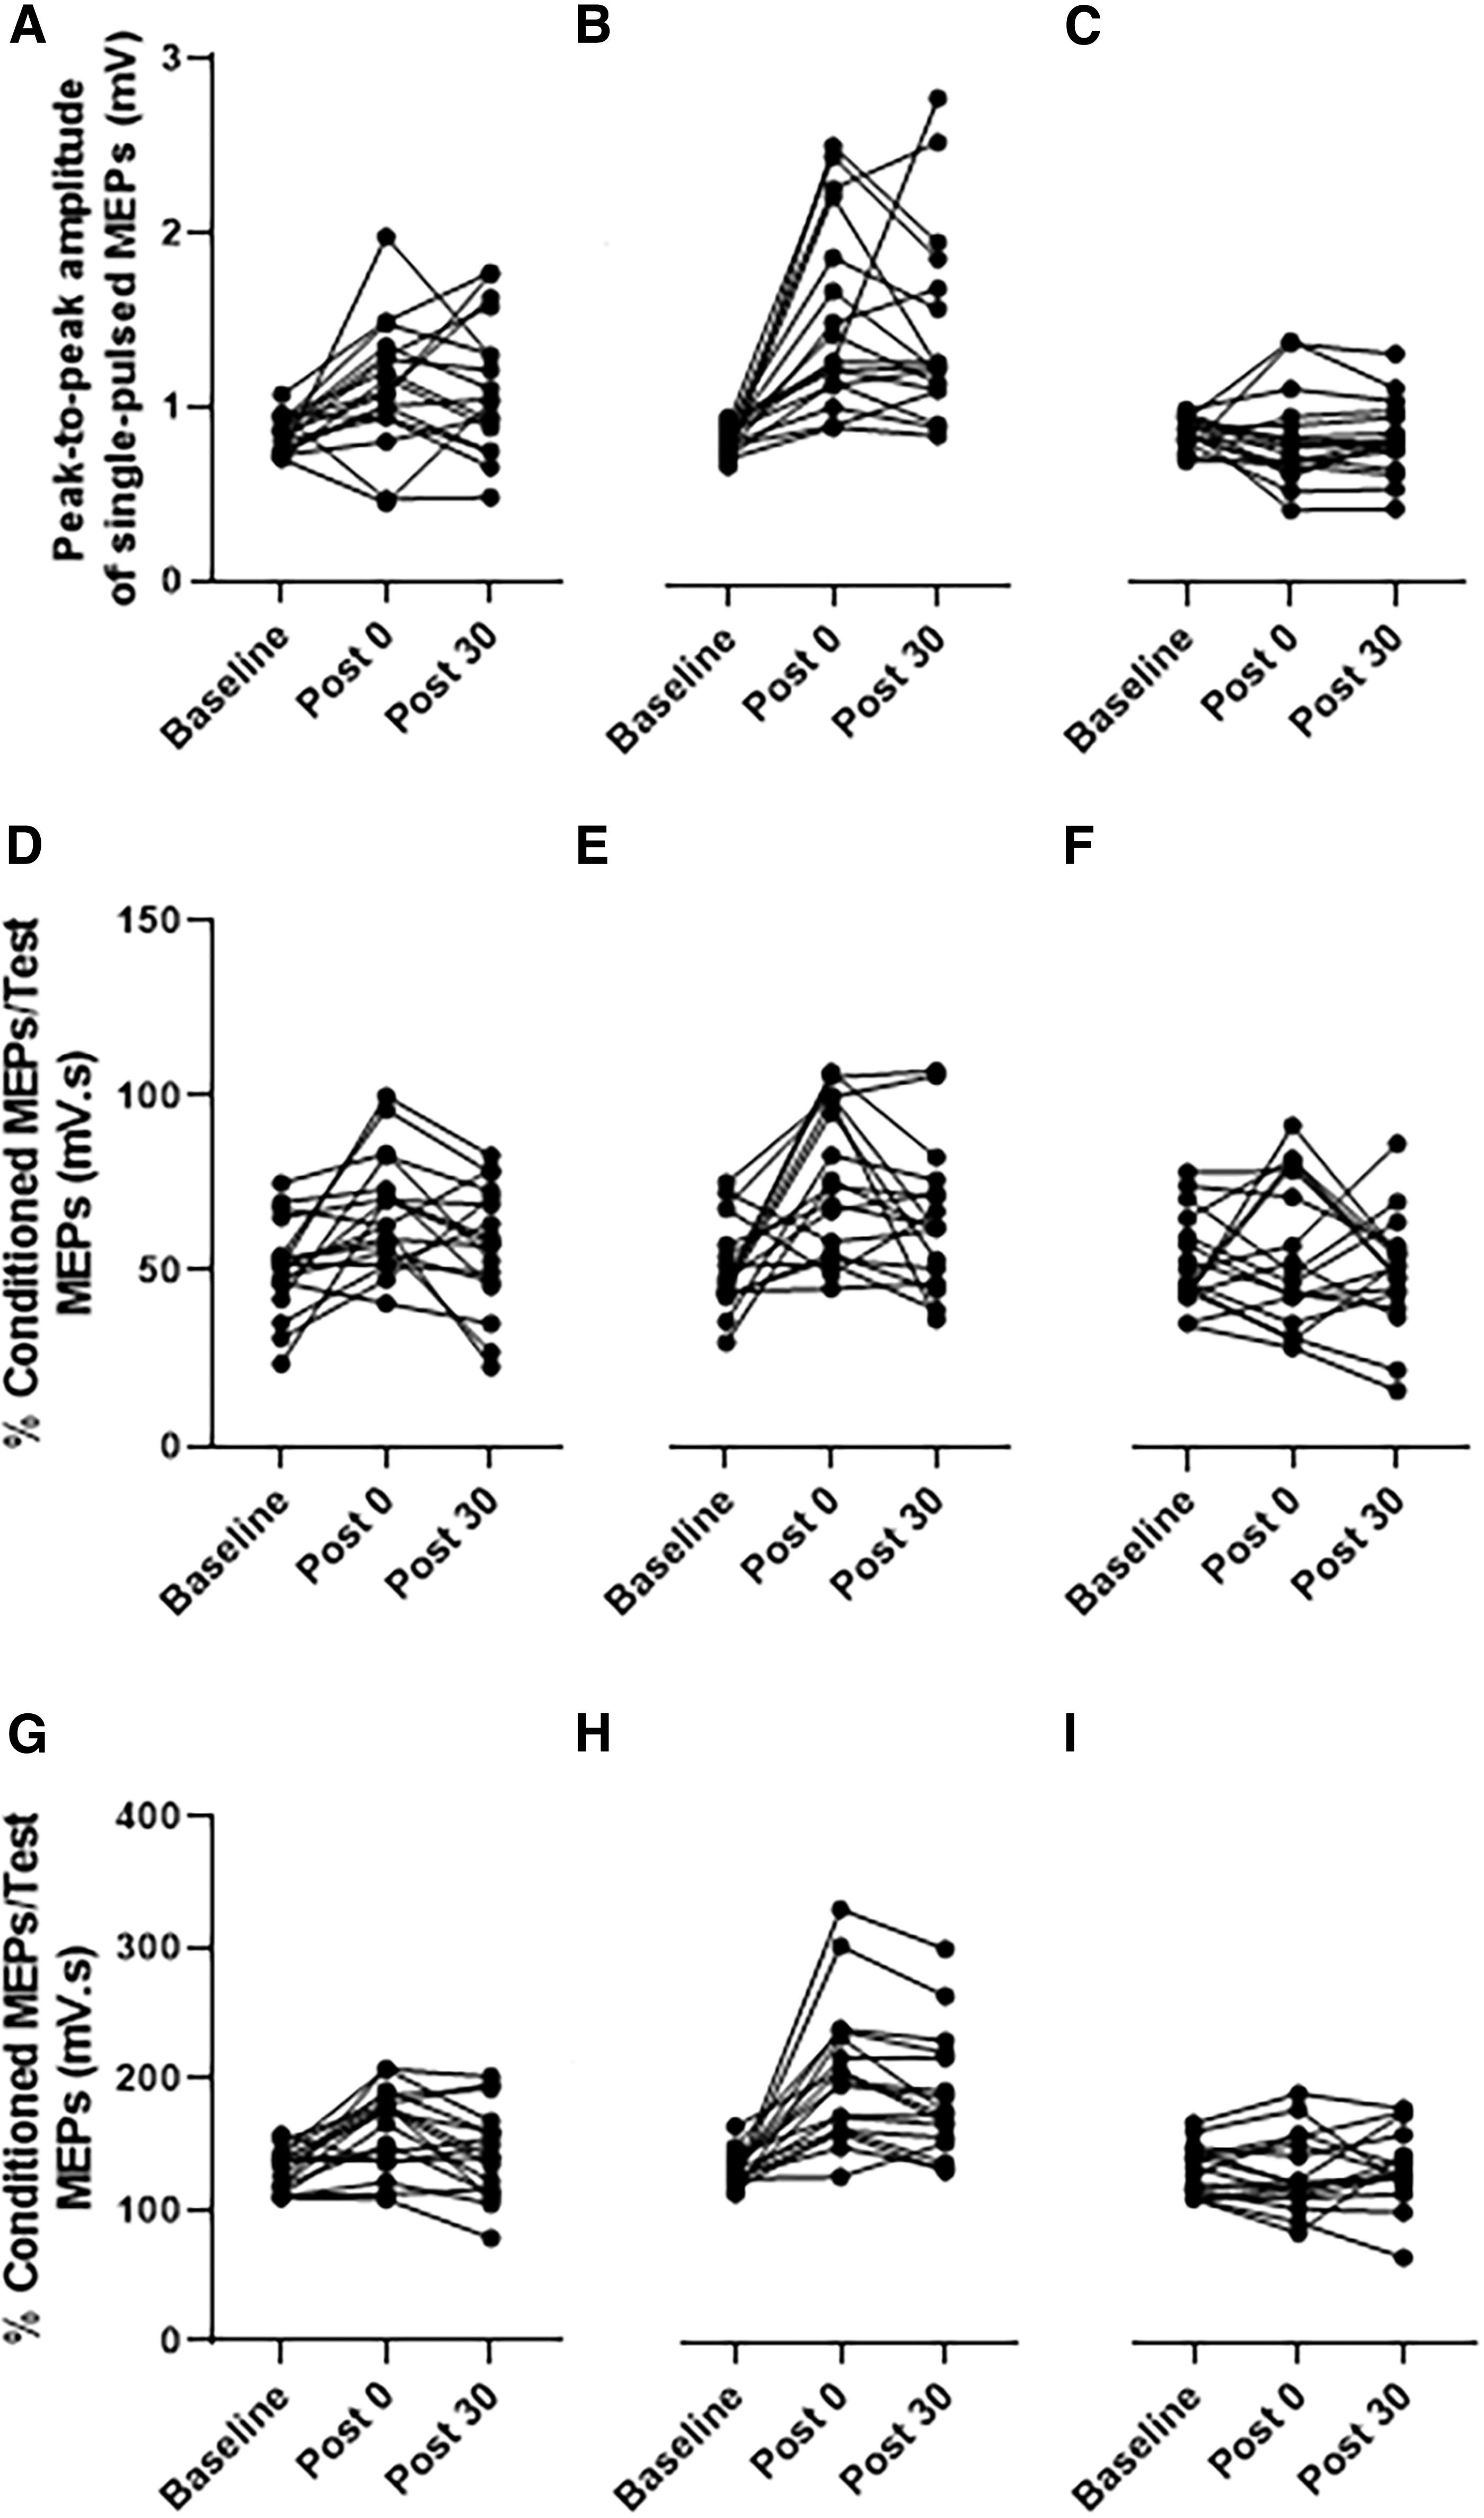
Individual participant data showing CSE
Correlation between a-tPCS-induced changes in CSE, SICI, and ICF
Since the a-tPCS at both 4 and 75 Hz was associated with significant changes in CSE, ICF, and SICI, correlations between the parameters were assessed. The TMS-induced MEP, SICI, and ICF were averaged at post 0 and post 30. The analysis did not show any correlation between CSE with either SICI or ICF at both 4 Hz (r SICI = −0.180, p SICI = 0.48; r ICF = 0.004, p ICF = 0.98) and 75 Hz (r SICI = 0.265, p SICI = 0.30; r ICF = 0.260, p ICF = 0.31).
The effect of a-tPCS on motor performance
The effect of a-tPCS on motor performance on both dominant (GPT-R) and nondominant (GPT-L) was investigated in this study. The RM-ANOVA on GPT-R and GPT-L revealed no significant effect of group [F (2, 32)GPT-R = 2.067, p = 0.155, ηp 2 = 0.114; F (2, 32)GPT-L = 2.502, p = 0.108, ηp 2 = 0.135], a significant effect of time [F (2, 32)GPT-R = 4.036, p = 0.032, ηp 2 = 0.201; F (2, 32)GPT-L = 7.314, p = 0.004, ηp 2 = 0.314), and no significant group by time interaction [F (4, 64)GPT-R = 0.721, p = 0.558, ηp 2 = 0.043; F (4, 64)GPT-L = 0.356, p = 0.800, ηp 2 = 0.022], respectively (Fig. 5A, B).
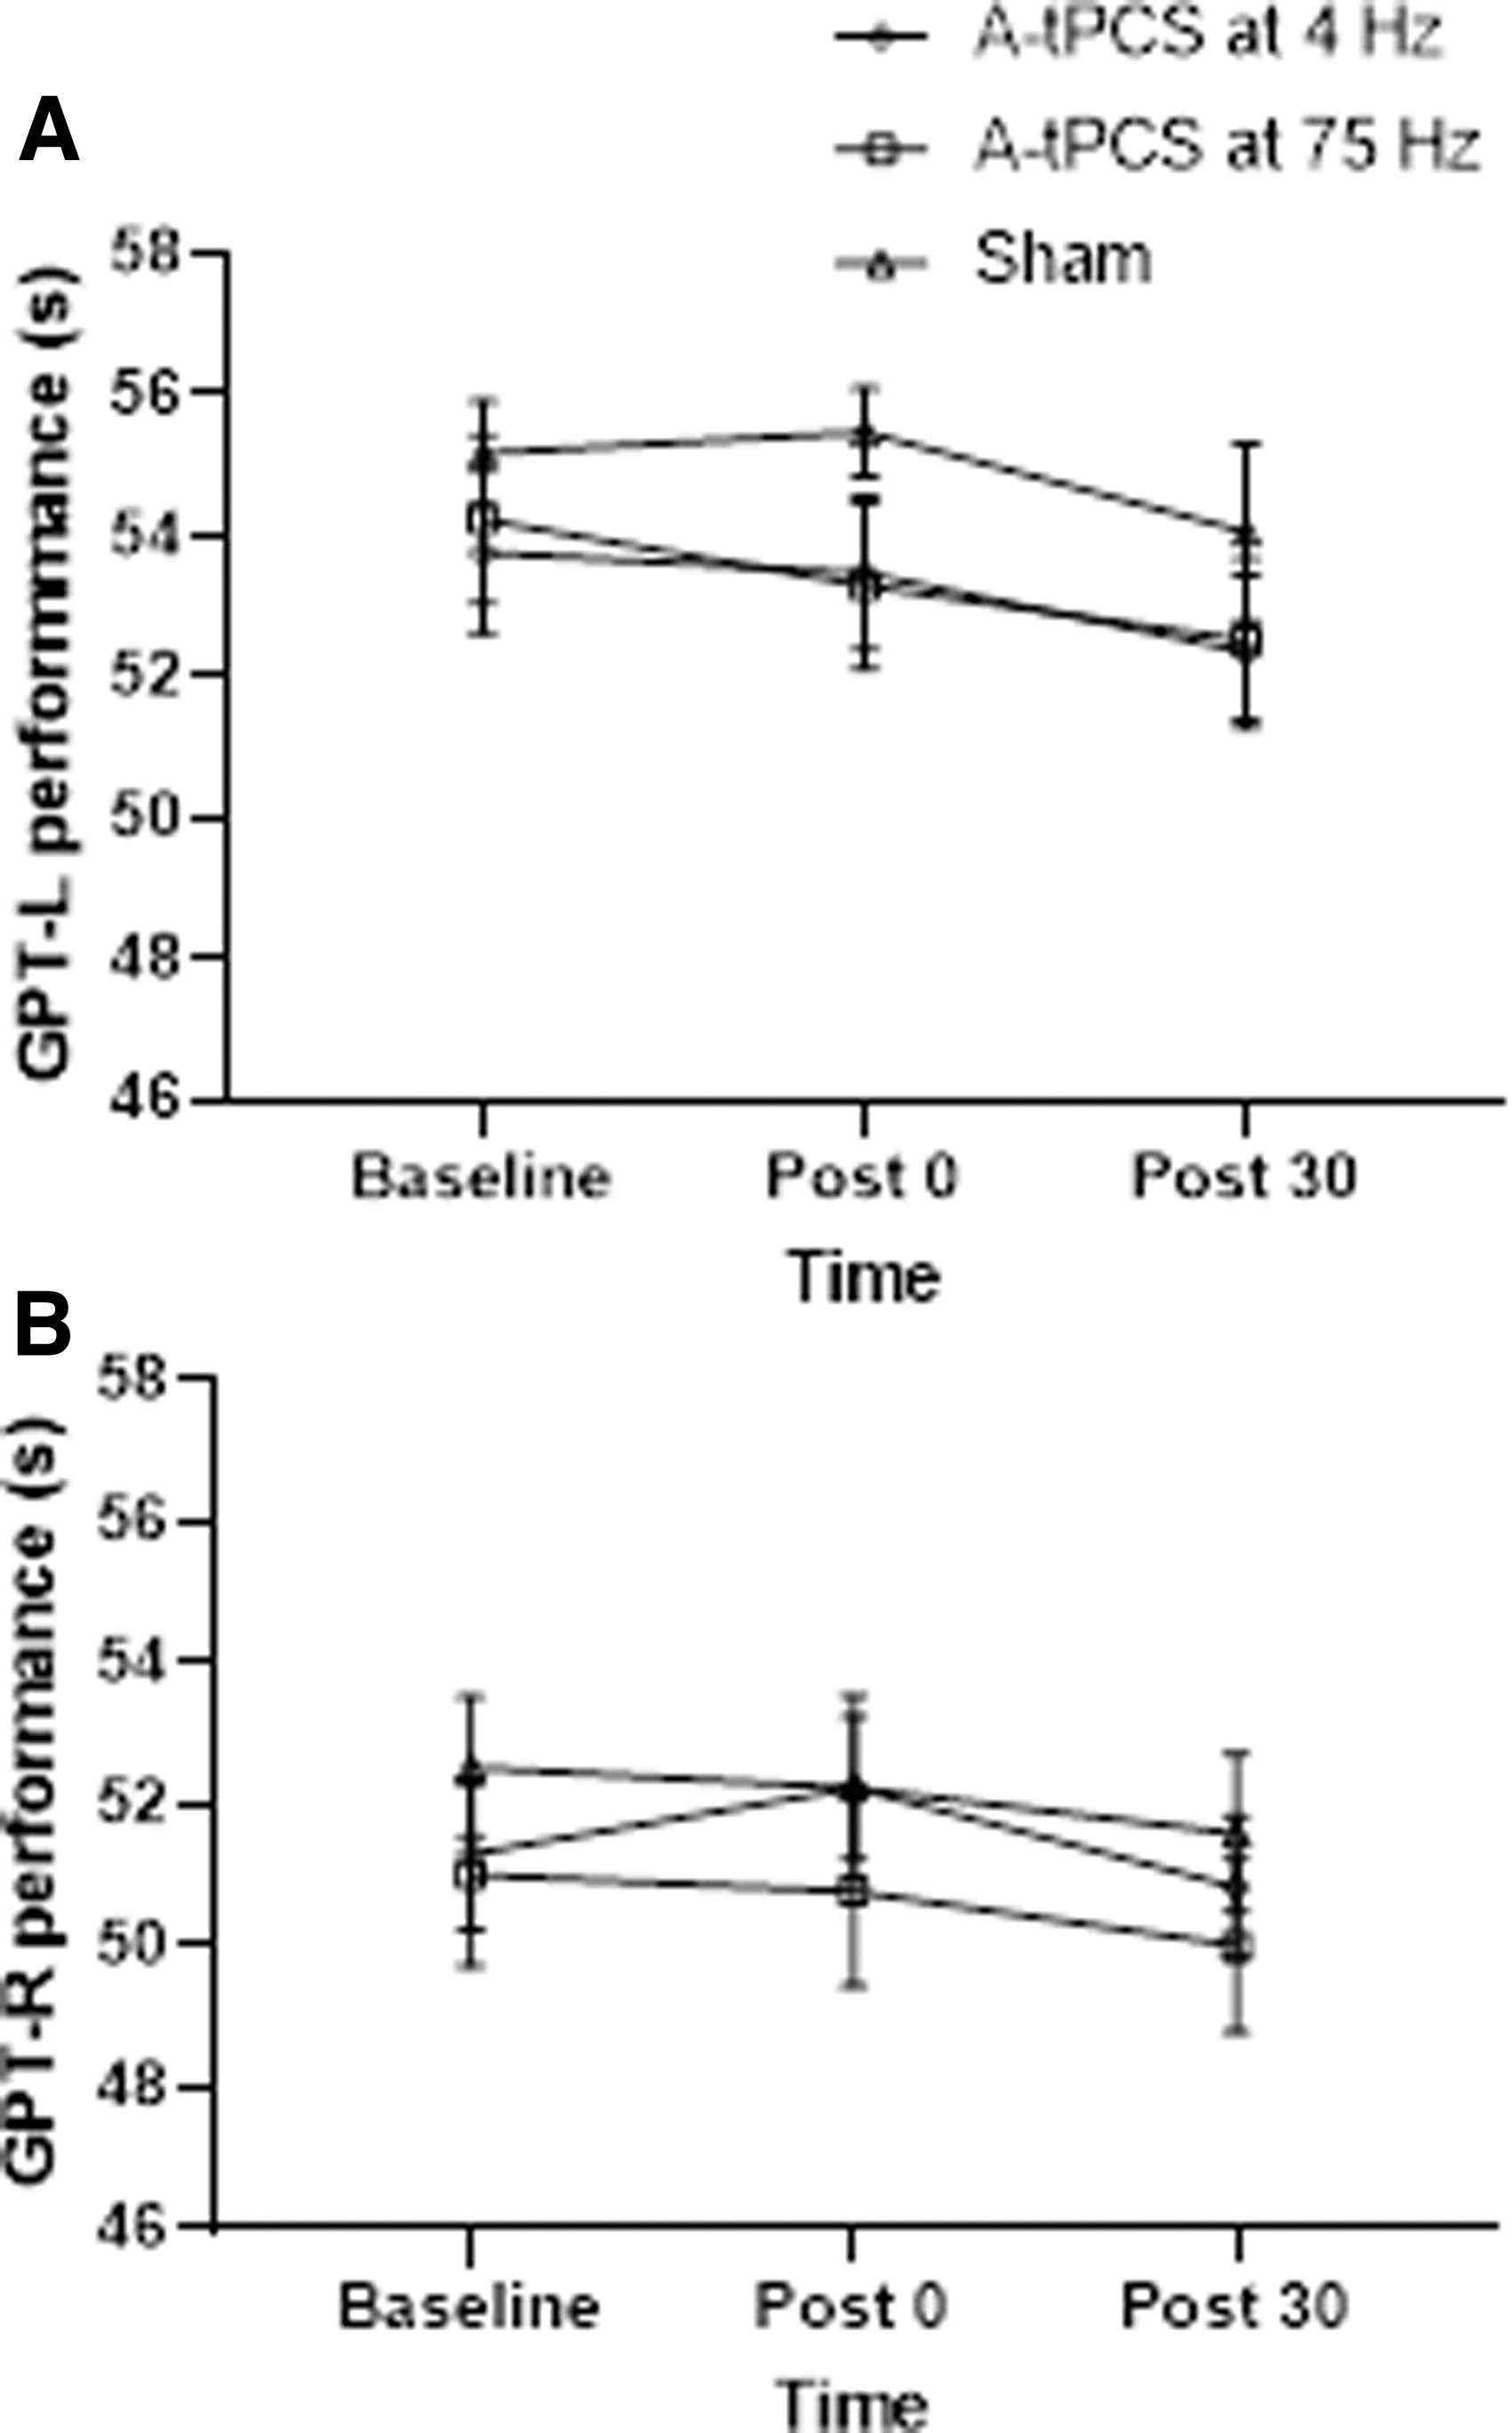
The effect of a-tPCS on motor performance.
The pairwise comparison of within-factor main effect of time for GPT-L showed a significant difference between baseline and post 30 (p = 0.006), but no difference between baseline versus post 0 (p = 0.082) or post 0 versus post 30 (p = 0.997). It showed a significant difference between post 0 and post 30 (p = 0.021), but no difference between baseline versus post 0 (p = 1.000) or post 30 (p = 0.110) for GPT-R.
Participants reported side effects during a-tPCS
Participant reports of adverse effects, such as paraesthesia, pain, and phosphenes, were recorded at the beginning, during, and end of the intervention. There was no difference in the perception of paraesthesia and pain between the three stimulation conditions (4 Hz, 75 Hz, and sham) under both active and return electrodes [paraesthesiaactive: χ 2(2) = 5.930, p = 0.052; painactive: χ 2(2) = 0.500, p = 0.779; paraesthesiareturn: χ 2(2) = 2.651, p = 0.266; painreturn: χ 2(2) = 2.000, p = 0.368]. Moreover, there was no significant difference in the intensity of phosphenes between the three stimulation conditions [χ 2(2) = 1.600, p = 0.449]. Overall, a-tPCS was safe and tolerable with negligible side effects.
The participant's judgment on the stimulation conditions was also recorded. Pearson's chi-square showed no significant differences between active and sham conditions [χ 2(2) = 3.151, p = 0.207], demonstrating that participants were not able to determine the type of stimulation and >90% of participants were properly blinded.
Discussion
This study investigated the frequency dependency of a single session of monophasic a-tPCS over the left M1 on CSE and motor performance of healthy young individuals. While the effect of 75 Hz frequency on M1 has been examined using tACS, the use of monophasic a-tPCS at this frequency is novel. The results showed that compared with a-tPCS at 4 Hz and sham, monophasic a-tPCS at 75 Hz leads to a significant increase in CSE, as measured via TMS-induced MEPs. A significant increase in CSE was found following a-tPCS at 4 Hz compared with sham.
Furthermore, the results showed a significant reduction in SICI, and a significant increase in ICF in response to monophasic a-tPCS at 75 and 4 Hz. However, the effects of stimulation on CSE did not correlate with SICI or ICF for a-tPCS at 4 and 75 Hz. There was also evidence of nonsignificant changes in motor performance across time following monophasic a-tPCS at 4 and 75 Hz. Based on the results, the participants of the study were successfully blinded to the experimental conditions, and no significant differences in the experience of paraesthesia, pain, and phosphenes were observed across the stimulation conditions.
Effects of a-tPCS at 75 Hz
We found that compared with sham, monophasic a-tPCS at 75 Hz significantly increases CSE, and this effect lasted for at least 30 min after the stimulation. We also found that this effect is significantly higher than at 4 Hz. The observed effect would be due to the entrainment and NDCC-induced polarization. However, the identification of the mechanism behind this effect will require further investigation.
Human studies indicate that a high-frequency gamma oscillation (50–100 Hz) typically occurs before and during voluntary movement (Ball et al., 2008; Joundi et al., 2012; Moisa et al., 2016). Outside the human motor system, there is evidence from an animal study to suggest that gamma oscillation activity can also be induced at rest with the involvement of interneuronal activity in M1 (Papazachariadis et al., 2014).
There is also evidence to suggest that gamma frequency induces long-term potentiation (LTP) such as plasticity (Buzsaki, 1996, 2010; Buzsaki and Draguhn, 2004; Diba and Buzsaki, 2007; Girardeau et al., 2009; Guerra et al., 2020; Izaki and Akema, 2008; Papazachariadis et al., 2014). In addition, increased gamma oscillation has been shown as an indicative of increased cortical activity and MEP in the human motor cortex (Zarkowski et al., 2006). Therefore, we posit that a-tPCS at 75 Hz may have acted to entrain a neuronal population in M1 with repeated pulses, which are more susceptible to gamma frequency, thereby strengthening the synapse where LTP-like plasticity occurs.
It should also be noted that compared with baseline, we observed a significant reduction in SICI and an increase in ICF following monophasic a-tPCS at 75 Hz. Previous evidence suggests that GABA-ergic interneuronal activity affects the induction of gamma oscillatory activity (Gaetz et al., 2011). Gamma oscillation is thought to arise via the activation of reciprocally connected excitatory pyramidal neurons and inhibitory interneurons (Buzsaki and Wang, 2012; Gonzalez-Burgos and Lewis, 2008).
Furthermore, it is suggested that gamma frequency enhances the activity of superficial inhibitory interneurons, which can inhibit the functions of GABAA-ergic interneurons in deep layers of M1 to induce greater plasticity (Guerra et al., 2018). As such, a recent study has considered the possibility of an interconnection between gamma activity, intracortical inhibitory activity, and LTP-like plasticity (Guerra et al., 2018). For example, the decrease in SICI during tACS at 70 Hz correlates with increased M1 plasticity (Guerra et al., 2018). We also posit that tPCS at 75 Hz modulates interneuronal GABA-A neurotransmission to result in a decrease in SICI.
Therefore, there may exist a link between gamma oscillation, LTP-like plasticity, and GABA-ergic inhibition within M1, as indicated in a recent study (Guerra et al., 2018). On the contrary, the increase in ICF could be explained by the upregulation of glutamate and N-methyl-D-aspartate (NMDA) receptor function following a-tPCS at 75 Hz (Chen et al., 1998; Ziemann et al., 1996). However, as our study is the first to investigate the effect of monophasic a-tPCS at 75 Hz on M1, the results cannot be directly compared with other studies. Thus, further studies are required to be conducted with larger sample sizes to assess the underlying physiological mechanism of these findings.
The finding of increased CSE following a-tPCS at 75 Hz is inconsistent with studies that demonstrated no after-effect on CSE following the application of tACS at gamma frequency (Antal et al., 2008; Guerra et al., 2018; Nowak et al., 2017). It should be noted that tACS and tPCS share some characteristics and differ in other respects. For instance, tACS uses a continuous balanced biphasic sinusoidal current that only produces a dynamic effect, whereas monophasic a-tPCS uses a unidirectional rectangular pulsatile current, which has both polarity-dependent and frequency-dependent effects (Jaberzadeh et al., 2014, 2015).
The polarity-dependent effect produced by a-tPCS has been ascribed to induce the NDCC, through which neuronal excitability would be modified by tonic depolarization (Jaberzadeh et al., 2014, 2015; Medeiros et al., 2012). While neurons under the anode excite and their resting membrane potentials shifts toward depolarization, reduction in neuronal firing occurs under the cathode with the shift of resting membrane potential toward hyperpolarization (Nitsche and Paulus, 2000). Furthermore, the pulsatile (on/off) nature of the current may accumulate effects that favor larger depolarization and increases CSE.
Similarly, recent evidence using an interrupted transcranial direct current stimulation (tDCS), which is similar to tPCS, has shown that depolarized neurons that are activated during stimulation cause new excitatory synapses with other stimulated neurons that persist even after the stimulation (Lu et al., 2019). It has further suggested that repetitive pulses can boost the induction of structural changes through the formation of new cell assemblies (Lu et al., 2019). The reason behind this discrepancy may lie in the positive NDCC of the applied a-tPCS in the present study.
Effect of a-tPCS at 4 Hz on CSE
Compared with both baseline and sham stimulations, we observed a significant increase in CSE following monophasic a-tPCS at 4 Hz. Pre-clinical studies have shown that stimulating nonmotor areas at the theta frequency causes depolarization, which results in the opening of NMDA channels, causing calcium influx initiating the synaptic modification process, and the induction of LTP. Indeed, the application of a-tPCS at 4 Hz over M1 may have followed a similar process to produce the observed increases in CSE in this study.
Therefore, it is reasonable to suggest that the increase in CSE following a-tPCS at 4 Hz, as seen in the present study, could be due to endogenous theta oscillations, which lead to depolarization and the induction of LTP. On the contrary, the polarity-dependent effect produced by the positive NDCC of a-tPCS may also have contributed to the observed LTP effect.
The findings of the present study also showed a significant increase in ICF and a significant decrease in SICI at post 0 compared with baseline. Hence, the stimulation may have weakened the GABAA receptor-mediated inhibitory function to result in a reduction in SICI, whereas ICF may have increased via the intensified activity of the glutamate and NMDA receptors.
Recently, Jaberzadeh et al. (2015) performed a study similar to the present study. In their study, they used monophasic a-tPCS that was 125 ms PD and 50 ms inter-pulse interval (IPI) (5.7 Hz) for 20 min and reported the absence of a stimulus-related effect on CSE in healthy young individuals (Jaberzadeh et al., 2015). Given that the frequency of the stimulation was in the theta range, a nonsignificant increase in CSE was observed, which is inconsistent with the current findings.
Methodological differences could be used for justification of this discrepancy. First, compared with the use of an unbalanced waveform (PD: 125 ms, IPI: 50 ms) in the previous study, we used a balanced current waveform (PD and IPI: 125 ms). The use of balanced current approximate to the sinusoidal “tACS” component may have played a role in inducing the entrainment effect to produce LTP-like plasticity, and thereby, the significance of CSE changes in the current study. Second, it has also been reported that tPCS at a random frequency of 1–5 Hz increases theta band interhemispheric coherence. The oscillatory brain properties could be induced to enhance the connectivity and synchronization of the underlying networks (Castillo Saavedra et al., 2014). Therefore, the frequency of 5.7 Hz is considered outside the effective range for this effect on CSE.
Third, the use of flashing light in the current study may have induced widespread brain activity to increase CSE. Finally, the study by Jaberzadeh et al. (2015) was carried out on 11 participants (very small sample size) and considering the variability between the number of responders and nonresponders in any brain stimulation study, the lack of significant increases in CSE in the previous a-tPCS study may be caused by a low sample size and the possibility of few more nonresponders in the participants in that study.
Correlation between CSE, SICI, and ICF
The increase in CSE did not correlate with changes either in the SICI or ICF for both 4 and 75 Hz. No association between SICI and CSE can be explained by the fact that GABAA receptors are not the only contributors to the observed inhibition and other inhibitory mechanisms, such as long-interval intracortical inhibition (LICI), which is triggered by GABAB receptors. On the contrary, a lack of correlation between CSE and ICF could be attributed to the observed increase in CSE, which may have been caused by reduced inhibition; furthermore, the increased ICF may have made a minor contribution to the changes in CSE. Therefore, a lack of correlation between CSE and ICF is expected under such a consideration.
Effect of sham stimulation on CSE
The results of the present study showed no effect of sham stimulation on CSE. This finding is in line with the results of previous studies on a-tPCS that demonstrated the absence of the placebo effect of sham stimulation (Jaberzadeh et al., 2014, 2015). This indicates the lack of placebo effects with respect to the induction of changes in CSE.
Does monophasic a-tPCS induce a frequency-specific effect on CSE?
The frequency-specific effect of a-PCS inducing changes in CSE is an important aspect of the present study. Although the application of a-tPCS at both 4 and 75 Hz showed associated increases in CSE, significantly higher CSE changes were seen with the application of a-tPCS at 75 Hz. This has not been reported previously in the context of a-tPCS. However, the frequency-specific effect has been documented frequently with respect to tACS, which shares some similar characteristics with a-tPCS (Antal et al., 2008; Chaieb et al., 2011; Moliadze et al., 2010b, 2012). It has been reported that bidirectional tPCS has the ability to entrain cortical oscillation (Castillo Saavedra et al., 2014; Datta et al., 2013; Morales-Quezada et al., 2015).
The present study used monophasic a-tPCS with positive pulses that produces a positive NDCC (depolarization only). However, a previous study using tACS has shown that the application of positive half-sign waves may also entrain the network, as is the case for full sign waves (Ali et al., 2013). Thus, frequencies of both 4 and 75 Hz may have entrained the neural population in M1 during stimulation, similar to bidirectional tPCS.
The findings of our recent study using EEG that showed a significant increase in theta power following 4 Hz but no significant change in high gamma power following 75 Hz provide some evidence to support this notion (Dissanayaka et al., 2020). Hence, entrainment may have established entrainment echoes following stimulation to produce aftereffect LTP. On the contrary, the NDCC produced by a-tPCS at both stimulation conditions may have also contributed to the observed effect pertaining to the resultant LTP. Importantly, the NDCC produced with a-tPCS at 75 Hz is supposed to be higher than what is produced at 4 Hz. As such, the significant difference in effect seen between these two frequencies relies on the difference in amount.
It should be noted that this study used a “cephalic montage” for the application of active and return electrodes. In the cephalic montage, which is the most widely used montage in tDCS studies, the active electrode (anode) is applied over M1, and the return electrode (cathode) is located over the contralateral “frontal pole” of the brain. Therefore, in the current study, in addition to the a-tPCS of M1, we also had cathodal tPCS of the frontal pole of the brain. This cathodal input may reduce cortical excitability in proximate brain regions. Given the light flashing that occurred during the stimulation that makes the participants involved with some extent of eye activity and that this study did not purely happen at rest, reduction in excitability of the frontal pole might be expected to have some effects on the M1 CSE across all the groups.
Effect of a-tPCS on motor performance
It was hypothesized that cortical changes might lead to changes in motor performance. The findings of the present study, however, do not support this hypothesis. Despite the observed effects of a-tPCS on cortical responses to TMS, improvements in motor performances were found over time regardless of the stimulation condition, which is most consistent with practice effects (Fig. 5), and is in line with previous reports (Bortoletto et al., 2015; Marquez et al., 2015; Rabipour et al., 2018). Although there are no previous tPCS evidence to support the findings, literature around anodal tDCS (a-tDCS) and motor performance can be important due to the NDCC effect produced by the a-tPCS.
A previous study on a-tDCS applied during training improves GPT (Christova et al., 2015) although another study observed no effect (Fagerlund et al., 2015). It is important to emphasize that these results are likely to be specific to the task tested here, which measures motor skills (e.g., GPT). It should be noted that the GPT may not be sensitive enough to capture subtle, putative effects induced by changes in neural oscillations. Furthermore, a single session of a-tPCS might be insufficient to show an effect when applied to healthy participants with intact motor performance.
Moreover, the state-dependent (resting vs. active) effect may also contribute to the observed effect on motor performance. Studies on both tDCS and tACS have shown that the cognitive brain state influences stimulation-induced effects (Antal et al., 2007; Feurra et al., 2013; Gill et al., 2015; Hsu et al., 2016; Neuling et al., 2013; Violante et al., 2017). For instance, Antal et al. (2007) have shown that the increase in MEP observed during a state of rest was reduced during cognitive task performance (Antal et al., 2007). Similarly, the observed increase in MEP following stimulation in the present study may have decreased during the task to produce no change in motor performance.
However, more studies are needed to be conducted with a suitable task and a larger sample size to verify the effectiveness of a-tPCS in the enhancement of motor performance.
Participants reported side effects during a-tPCS
Overall, the use of monophasic a-tPCS showed minimal/no side effects among the healthy participants. This is in line with the findings of two studies on monophasic a-tPCS that have shown the tolerability of a-tPCS compared with conventional a-tDCS (Jaberzadeh et al., 2014, 2015). The reported side effects of paraesthesia would be due to the electrochemical effect of NDCC under the electrodes (Dundas et al., 2007; Durand et al., 2002; Palm et al., 2008).
Moreover, participants were successfully blinded to the stimulation condition, and they were unable to distinguish whether the stimulation was active or sham. It seems that, for the sham group, the procedure that we followed adequately represented common side effects associated with the active a-tPCS group. This finding is in line with the previous studies that used a-tPCS, although the stimulation parameters are noticeably different from the present study (Jaberzadeh et al., 2014, 2015).
In relation to the side effect of phosphene perception on the retina, no significant difference was found between the 4 Hz, 75 Hz, and sham. This is in line with the previous studies that found that the participants had experienced phosphene during monophasic a-tPCS (Jaberzadeh et al., 2014, 2015). The evidence has revealed that low frequency produces phosphene, which is more noticeable (Turi et al., 2013). Furthermore, the current intensity above 1 mA and the electrode-eye distance also affect phosphene induction (Fertonani et al., 2015; Schwiedrzik, 2009; Turi et al., 2013).
Thus, the observed effect would be related to the frequency of stimulation, the intensity of the applied current (1.5 mA), and the electrode-eye distance. One possibility of reducing the phosphene production would be using a more focal multielectrode array over the M1 despite the cephalic electrode montage. However, the use of a light flashing source helped blind the participants for phosphene in the present study successfully. Hence, this method can also be used in research with different frequencies of tPCS and for tACS, which is also a frequency-dependent technique and produces phosphene on the retina.
Limitations
The findings of the present study should be interpreted in the context of several potential limitations. We assessed the effect of monophasic a-tPCS on healthy young participants (<35 years old), which limited the potential to generalize findings to older people and people with neurological disorders. Another limitation was that we did not explore gender differences. The majority of the participants in this study were females (82.3%). It has been shown that female sex hormones impact changes in CSE (Hattemer et al., 2007; Inghilleri et al., 2004; Smith et al., 1999).
Therefore, caution should be taken when extrapolating the findings to the male population. More interestingly, a previous study has reported that SICI can be contaminated from short-interval cortical facilitation (SICF) at inter-stimulus interval of 2–3 ms and conditioning stimuli at intensities of 95% of the active motor threshold (Peurala et al., 2008). As the present study used 80% RMT, which corresponds to an active motor threshold used by the previous study, the contamination of the SICI could be high. The use of sham stimulation that is similar to sham in tDCS studies is also a limitation of the study. It has been suggested to use random noise stimulation as a sham when investigating the entrainment effects (Chanes et al., 2013; Feurra et al., 2019; Romei et al., 2010, 2016).
However, in this study, the current used for the sham stimulation was identical to the ones used in the active experimental conditions. Indeed frequencies of 4 and 75 Hz were randomly used for sham in different sessions. Moreover, we did not find any significant effect with sham stimulation and the effect of the sham is supposed to be improbable. Finally, a navigation system was not used in this study. According to Julkunen et al. (2009) and Cincotta et al. (2010), the MEP recording can vary according to whether navigation is used nor not (Cincotta et al., 2010; Julkunen et al., 2009).
In contrast, Jung et al. (2010) have shown that there is no significant difference in MEP reproducibility and variability when comparing outcomes from non-navigated protocols, with results involving an optically tracked TMS navigation system (Jung et al., 2010). Thus, we believe that the reproducibility of MEPs was unlikely to be adversely affected by non-navigated TMS.
Suggestions for future research
Future research needs to explore the effect of monophasic a-tPCS at 4 and 75 Hz on CSE with longer follow-ups to evaluate the duration of the effects. Such data would be beneficial in the development of an optimal approach to enhance the CSE of M1. It is also important to use EEG along with tPCS to confirm the entrainment effect in a future study. The present study used monophasic a-tPCS, and future studies would need to explore the effect of monophasic cathodal tPCS and balanced biphasic tPCS on CSE. Importantly, assessing the systematic difference between frequencies below and above 1 Hz would also be beneficial in the context of excitation and inhibition and to find a frequency-specific effect of a-tPCS.
Furthermore, the use of a-tPCS at different frequencies in different states, such as during rest, during motor imagery, and during motor observation, would be helpful in exploring the state-dependent effect in depth. A previous study on biphasic tPCS found a duration-dependent effect on interhemispheric coherence. Therefore, it is important to explore the duration-dependent effect of monophasic tPCS (Vasquez et al., 2016). In addition, the possibility of the effect of gender, age, menstrual time, and genotype should also be considered a potential covariate in the analysis of data in future studies.
Conclusions
A single-session monophasic a-tPCS at 75 Hz over the human M1 significantly increased CSE compared with both a-tPCS at 4 Hz and sham in a frequency-specific manner. The findings also indicate that monophasic a-tPCS at 4 Hz can significantly increase CSE compared with both baseline and sham. Moreover, a-tPCS leads to a reduction in SICI and an increase in ICF, although these effects do not correlate with CSE. However, motor performance did not vary in relation to a-tPCS. Thus, a-tPCS has a frequency-specific effect in terms of changes in CSE, but these changes did not translate into the modification of behavior in healthy individuals.
Footnotes
Acknowledgment
We thank Mrs. Maryam Zahraee for assistance with blinding the stimulation condition.
Authors’ Contributions
T.D.D., S.J., and M.Z. designed the study. T.D.D. conducted the experiment. T.D.D., M.Z., and M.F. analyzed the data. T.D.D., M.Z., M.F., G.E., and S.J. interpreted the results. T.D.D. prepared the figures and wrote the article. All authors reviewed the article.
Data Accessibility
The data that support the findings of this study are available from the corresponding author on request.
Author Disclosure Statement
No competing financial interests exist.
Funding Information
This research received no specific grant from any funding agency in the public, commercial, or not-for-profit sectors.