
Abstract
Aim:
To identify and characterize the functional brain networks at the time when the brain is yet to develop higher order functions in term-born and preterm infants at term-equivalent age.
Introduction:
Although functional magnetic resonance imaging (fMRI) data have revealed the existence of spatially structured resting-state brain activity in infants, the temporal information of fMRI data limits the characterization of fast timescale brain oscillations. In this study, we use infants' high-density electroencephalography (EEG) to characterize spatiotemporal and spectral functional organizations of brain network dynamics.
Methods:
We used source-reconstructed EEG and graph theoretical analyses in 100 infants (84 preterm, 16 term born) to identify the rich-club topological organization, temporal dynamics, and spectral fingerprints of dynamic functional brain networks.
Results:
Five dynamic functional brain networks are identified, which have rich-club topological organizations, distinctive spectral fingerprints (in the delta and low-alpha frequency), and scale-invariant temporal dynamics (<0.1 Hz): The default mode, primary sensory-limbic system, thalamo-frontal, thalamo-sensorimotor, and visual-limbic system. The temporal dynamics of these networks are correlated in a hierarchically leading–following organization, showing that infant brain networks arise from long-range synchronization of band-limited cortical oscillation based on interacting fast- and slow-coherent cortical oscillations.
Conclusion:
Dynamic functional brain networks do not solely depend on the maturation of cognitive networks; instead, the brain network dynamics exist in infants at term age well before the childhood and adulthood, and hence, it offers a quantitative measurement of neurotypical development in infants. Clinical Trial Registration Number: ACTRN12615000591550.
Impact statement
Our work offers novel functional insights into the brain network characterization in infants, providing a new functional basis for future deployable prognostication approaches.
Introduction
In humans, the development of neuronal systems in late gestation determines the organization of specialized neural functions that underpin the large-scale functional organization of the brain (Grayson and Fair, 2017; Tau and Peterson, 2009). Infants born very preterm and preterm are at high risk of neurodevelopmental disabilities in the brain higher order functions, such as learning, cognition, and motor behaviors in childhood (Marlow et al., 2005; Moore et al., 2012). Structural magnetic resonance imaging (MRI) and clinical assessments have not provided a basis for sufficiently accurate early diagnosis (Ball et al., 2015). As a measure of large-scale functional organization of resting-state (RS) brain activity, functional connectivity MRI (fcMRI) and electroencephalography (EEG) have revealed richly structured RS networks (RSNs) (Biswal et al., 1995; Mehrkanoon et al., 2014a,c), which fluctuate over time and form dynamic functional connectome (dFC) in adults (Allen et al., 2014; Boersma et al., 2011; Mehrkanoon et al., 2014a, 2016).
The EEG in infants born between ∼30 and 42 weeks of gestation has shown the emergence of low-frequency cortical oscillations (Arichi et al., 2017; Myers et al., 2012), which may exhibit an oscillatory activity of large-scale cortical correlation structure measured by scalp-EEG FC (Meijer et al., 2014; Tokariev et al., 2016). The neuronal oscillations, with their specific frequencies, open the gates of communications between cortical regions to establish patterns of local and large-scale functional brain network interactions (Hipp et al., 2012), which underpin frequency-specific dFC (Hipp et al., 2012; Mehrkanoon et al., 2014a). Thus, FC measurements based on the time and frequency components of interacting cortical oscillations may provide new insights into the evolutionary macroscopic neuronal circuits and their interaction patterns in the infant brain.
Despite numerous RS-fcMRI and EEG studies on the infant brain, to the best of our knowledge, there is no systematic description on the spatial organization, spectral fingerprints, and temporal dynamics of local and large-scale cortical activity in the infant brain. The infant scalp-EEG-based FC does not show details of the gray matter (GM)-based cortical networks (Kaminska et al., 2017; Meijer et al., 2014; Schumacher et al., 2015), due to an incomplete anatomical localization of RSNs and the absence of spatial topologies, spectral components, and temporal dynamics of RSNs at term age (Fransson et al., 2013; Mohammadi-Nejad et al., 2018; Roche-Labarbe et al., 2008; Routier et al., 2017; Tokariev et al., 2016). Because the brain and neuronal circuits are highly plastic in infancy, it is thought that the implementation of neurorehabilitation treatments is likely to minimize the emergence of neurodevelopmental disabilities (Sutton, 2013; Lee, 2018).
The EEG-based dFC may be useful both as a screening tool of developmental aberration as well to assess the effectiveness of neurorehabilitation treatments in real time. Such process has the potential to allow optimized and individualized treatments to be developed. To characterize the functional organization of macroscopic cortical activity in infants at term age, we infer source-space spatial topologies, spectral fingerprints, and temporal dynamics of RS-FCs that overcome current limitations in fcMRI and scalp-EEG topography.
Materials and Methods
Participants
The Human Research Ethics Committee of the University of Queensland and Royal Brisbane Women's Hospital approved the protocol (HREC/15/QRCH/5). Parents of participants provided informed consent. One hundred healthy infants were included in this study: 84 were preterm-born infants (born at 30–32 weeks of gestation), and studied at term-equivalent age (40–42 weeks of gestational age), and 16 were term-born infants.
High-density EEG data acquisition
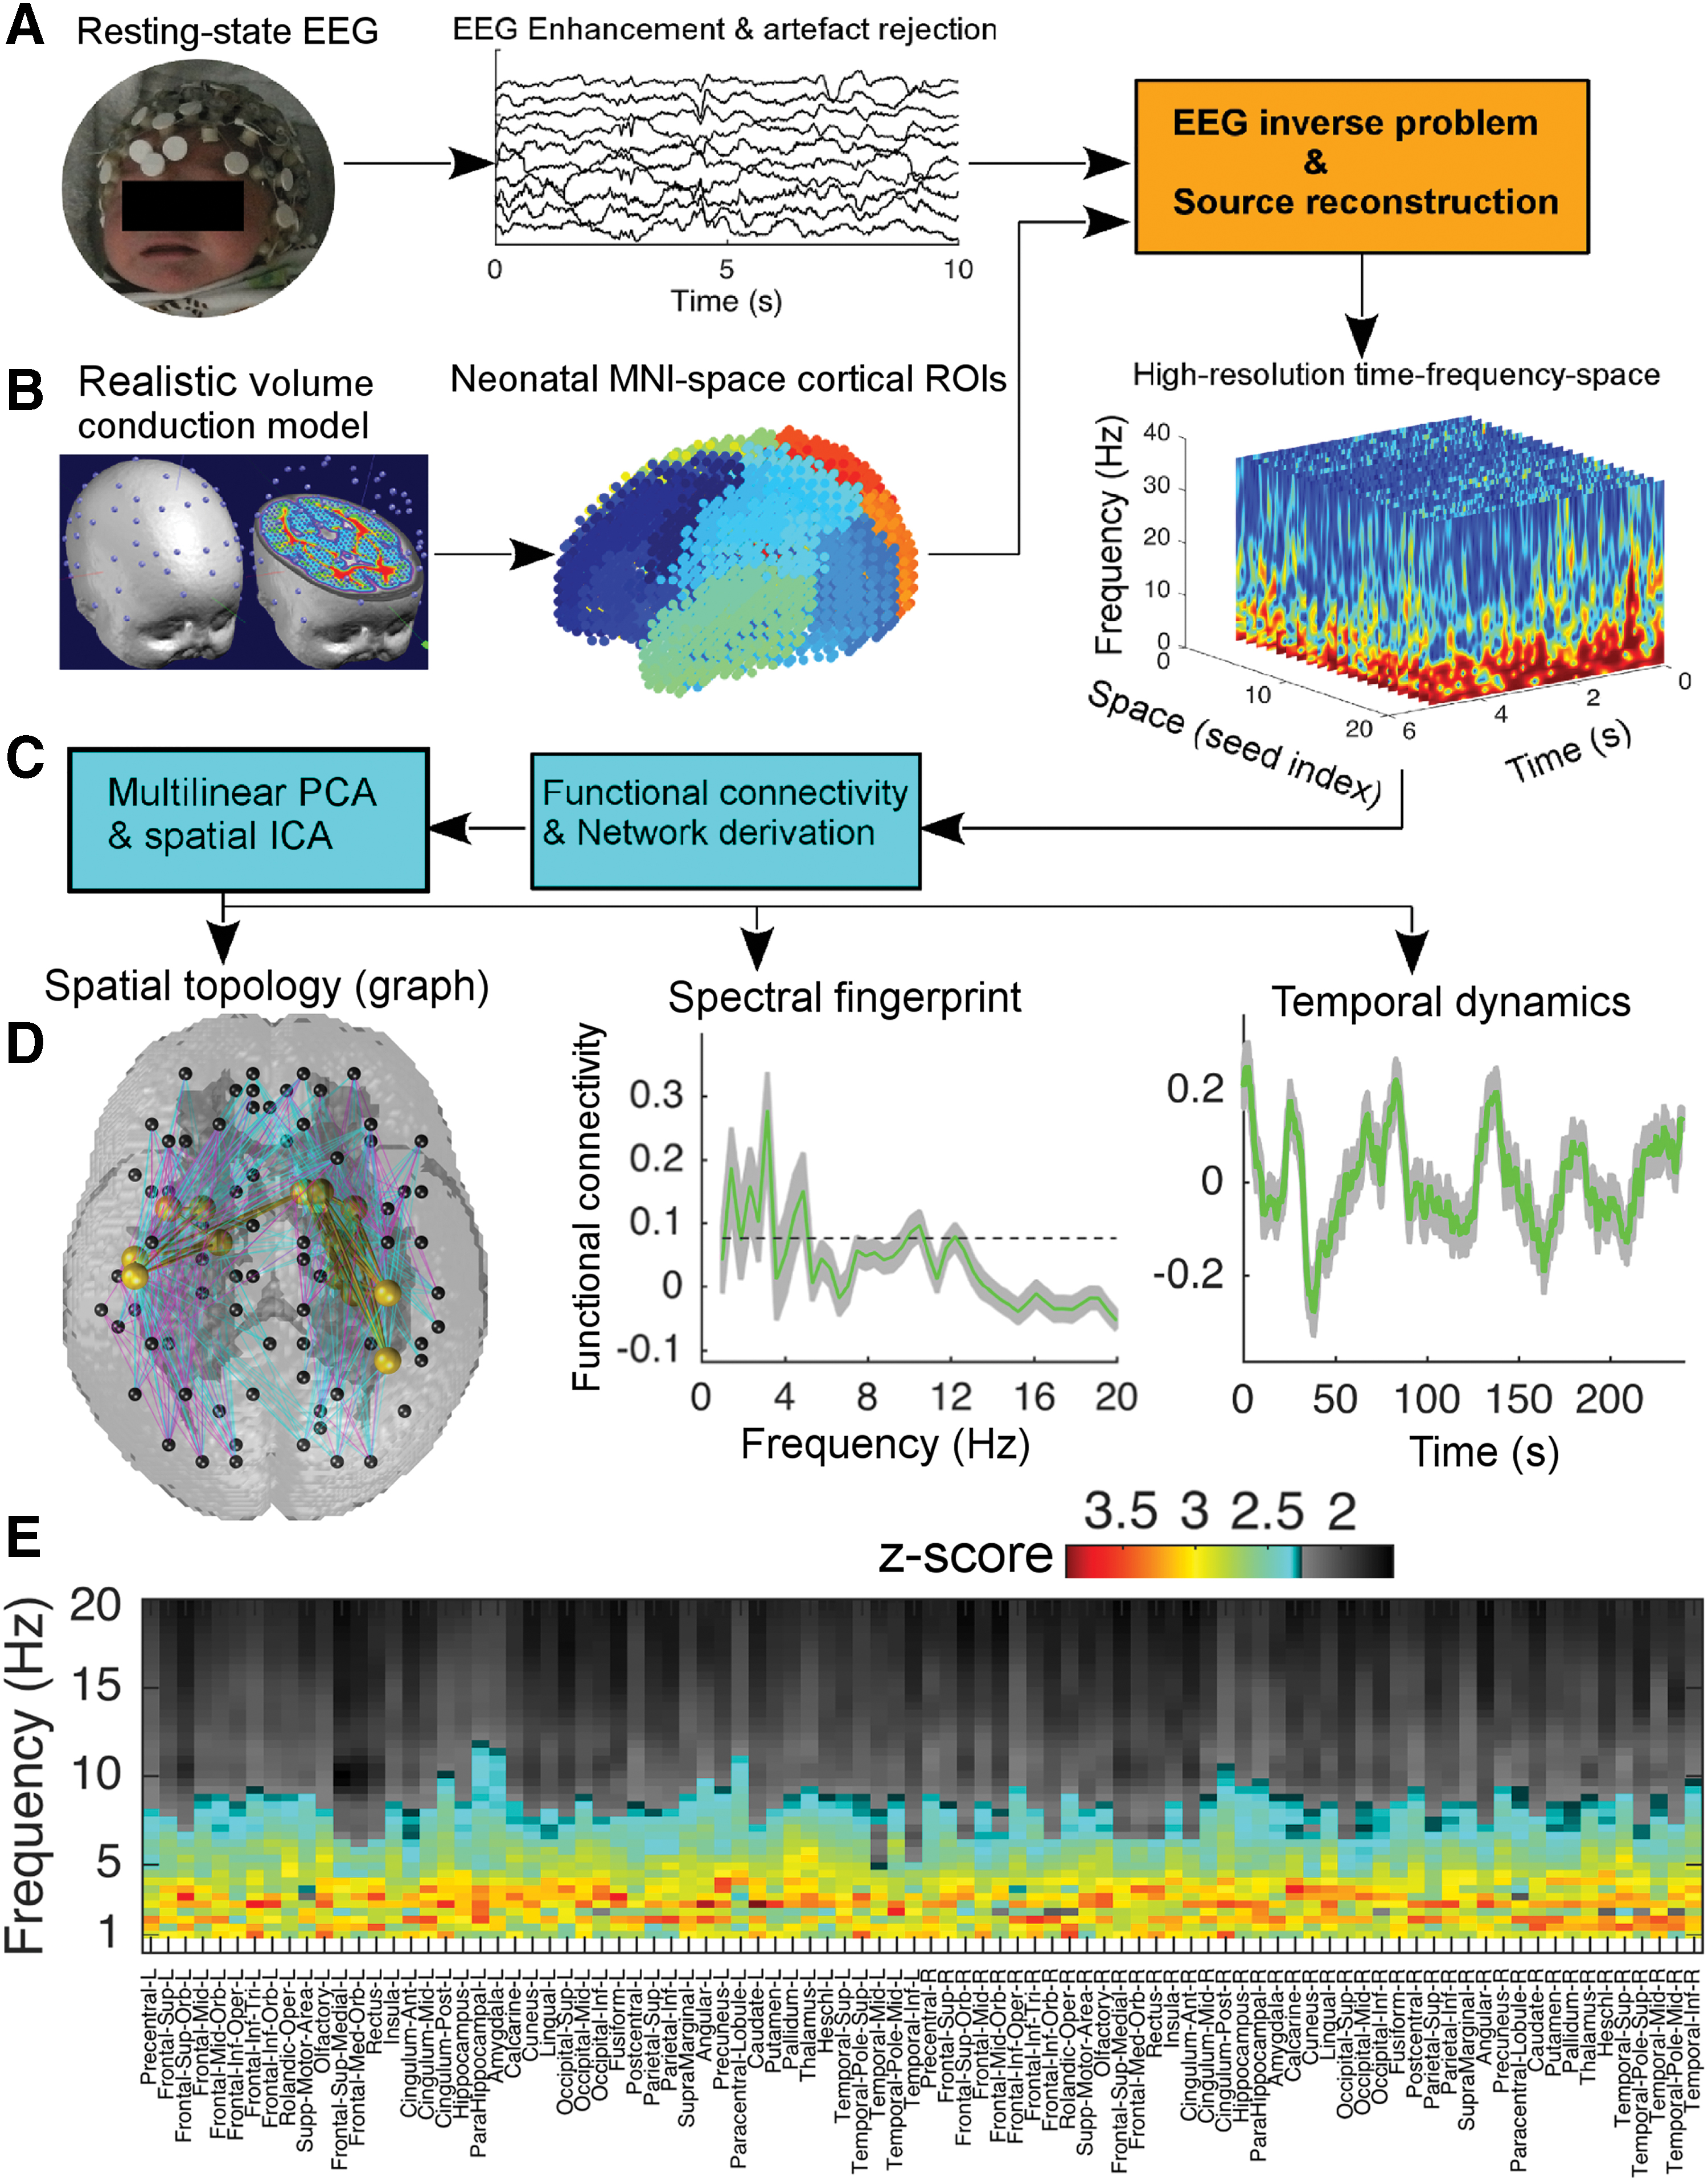
We recorded high-density EEG from 100 infants in eyes-closed active-sleep condition. The active-sleep condition was defined on the basis of visual inspections of behavior, including rapid eye movements, frowns, smiles and sucking, body and limb movements, and irregular respiration coincident with low-voltage EEG. A single 40-min session was selected to acquire EEG by a 61-channel appropriately sized neonatal EEG cap arranged according to the international 10–20 system (Fig. 1A). The experimental setup included EGI HydroCel GSN 130 Geodesic Sensor Nets and an EGI Net-Amps-300 amplifier (EGI; Philips) at sampling rate of
Construction of large-scale brain network dynamics in infants at term age.
For each infant, we selected a 4-min epoch from the annotated active-sleep period. We also ensured the 4-min epoch did not contain high-voltage chin movement artifact. All EEG data were referenced to Cz and band-pass filtered (0.5–30 Hz). The InfoMax independent component analysis (ICA) algorithm was then used to remove cardiac, ocular, and muscular artifacts (Mehrkanoon et al., 2016, 2014a,b,c) (Fig. 1A, middle panel). The artifact-free EEG was then used for the EEG source reconstruction (Fig. 1A, right panel, see below). To ensure that developmental stage was similar in the infants born preterm and studied at term equivalent and the infants born at term, we statistically compared the group-level power spectral density (PSD) of the 4-min EEG epoch across the two groups. For each infant, we estimated the Morlet wavelet PSD. The group-level PSD was obtained by averaging the PSDs across infants in each group (see the Results section).
Construction of the volume conduction and leadfield model of the infant head
The volume conduction model of the head represents the EEG forward problem that estimates the electric potentials on the scalp for a known configuration of electric dipole sources, provided that the physical properties of the head tissues such as conductivities are known (Mehrkanoon et al., 2014c). A publicly available neonatal normalized T2-weighted MR image model that consists of the tissue priors of scalp, skull, cerebrospinal fluid (CSF), GM, and white matter of the infant brain anatomical template was used in this work (Shi et al., 2011). Scalp EEG electrodes were first co-registered with this publicly available neonatal MRI model using a nine-parameter transformation of the EGI HydroCel GSN 130 Geodesic Sensor Nets such that the electrodes were placed according to the 10–20 system (Fig. 1B) (Mehrkanoon et al., 2014c).
Given the head tissue priors, the Matlab toolbox FieldTrip was used to construct the realistic volume conduction model of the infant head by numerically solving the forward model (Dang and Ng, 2011). The resulting leadfield matrix
The electric dipole locations were constrained by the infant GM volume with respect to the predefined Automated Anatomical Labeling neonatal brain atlas that comprises 90 regions of interest (ROIs; Fig. 1B, middle panel) (Shi et al., 2011). This process resulted in
Electric source imaging of neonatal EEG
We used the linearly constrained minimum variance (LCMV) beamforming algorithm to estimate the magnitude of the nth dipole source at each orientation (Veen et al., 1997):
Derivation of functional brain networks
To quantify the coherent spontaneous activity of spatially distributed cortical activity in each neonatal brain, the functional connectivity was measured by the imaginary part of the complex-valued time–frequency coherence (i.e., non-zero-lag synchronization) between all pairs of 90 ROI signals [Eq. (2)]. Taking the imaginary part of the coherence minimizes the occurrence of spurious correlation among the nearby seed voxels due to the volume conduction property (Mehrkanoon et al., 2013, 2014a; Nolte et al., 2004). For N = 90 ROIs, the maximum number of network edges is given by
where
where
The smoothing process was implemented by convolving the kernel
Since
where T denotes the matrix transposition, k is the subject index,
The time–frequency principal components (PCs) associated with these five eigenmodes were then obtained from the projection of the kth original functional connectivity array  . A second PCA was computed to extract
where truncated
where
Graph theoretical analysis
To quantitatively evaluate the topological architecture of each of the five RSNs obtained from the spatial ICA, mathematical graph theory was used. First, each
Primary connectivity metrics
The set of graph metrics computed for each of the five thresholded RSNs comprises node degree (K, the number of connections linked to each node); clustering coefficient (C, a measure of the brain's ability in functional segregation or information processing) (Watts and Strogatz, 1998); betweenness centrality (a measure of a node hubness); global efficiency (
Complex connectivity analysis
Small-world topology
We identified the small-worldness of each of the five RSNs by computing the ratio of the normalized clustering coefficient
Rich-club organization
The centerpiece of the graph theoretical analysis of the functional connectomes in this article is the exploration of the rich-clubs of functional hub nodes in the infants' RSNs by computing the rich-club coefficient
where
Statistical analysis of rich-club organization
Permutation testing was used to assess statistical significance of the rich-club organization of each neonatal RSN. The null distribution of rich-club coefficients
Dynamics of RSNs in infants
The exploration of the spectral fingerprints and temporal dynamics of neonatal RSNs was performed by analyzing the time–frequency spectra [i.e.,
Spectral fingerprints and temporal dynamics of RSNs
The spectral property and the temporal fluctuations of the networks were independently investigated by analyzing the marginal densities of the group-level time–frequency spectra
Long-range dependencies of RSN dynamics
The behavior of a complex dynamical system over time is sensitive dependence on an initial condition of the system. That is, the past behavior of the system influences its future behavior, indicating a long-range dependence property of the process that governs the system dynamics, and is related to fractality (Kobayashi et al., 1999). The Hurst exponent is a measure of the extent of long-range dependence of such process that is reflected by time series obtained from the system of interest. Here, for each infant, the behaviors of RS cortical networks are reflected by their affiliated temporal dynamics [
where
Temporal organization of interacting RSNs
Because these five RSNs capture the dynamics of the neonatal brain states in a low-dimensional space, we sought to explore between-networks temporal interactions. Such interactions or transitions between the brain states that are captured by a set of networks are referred to as meta-state dynamics (Vidaurre et al., 2017). To identify the pattern of interactions between the five RSNs, we assess the cross-correlation between the temporal dynamics of the networks
To extract the component of the cross-correlation functions that is not invariant to time reversal, we determine the asymmetric components of
The slope signs of the asymmetric component near the zero time lag,
Results
No significant difference between the PSD of EEG across the two groups
We found no significant difference between the PSD of the EEG of the two groups in the low-delta (1–2 Hz [0.085–0.11 mV
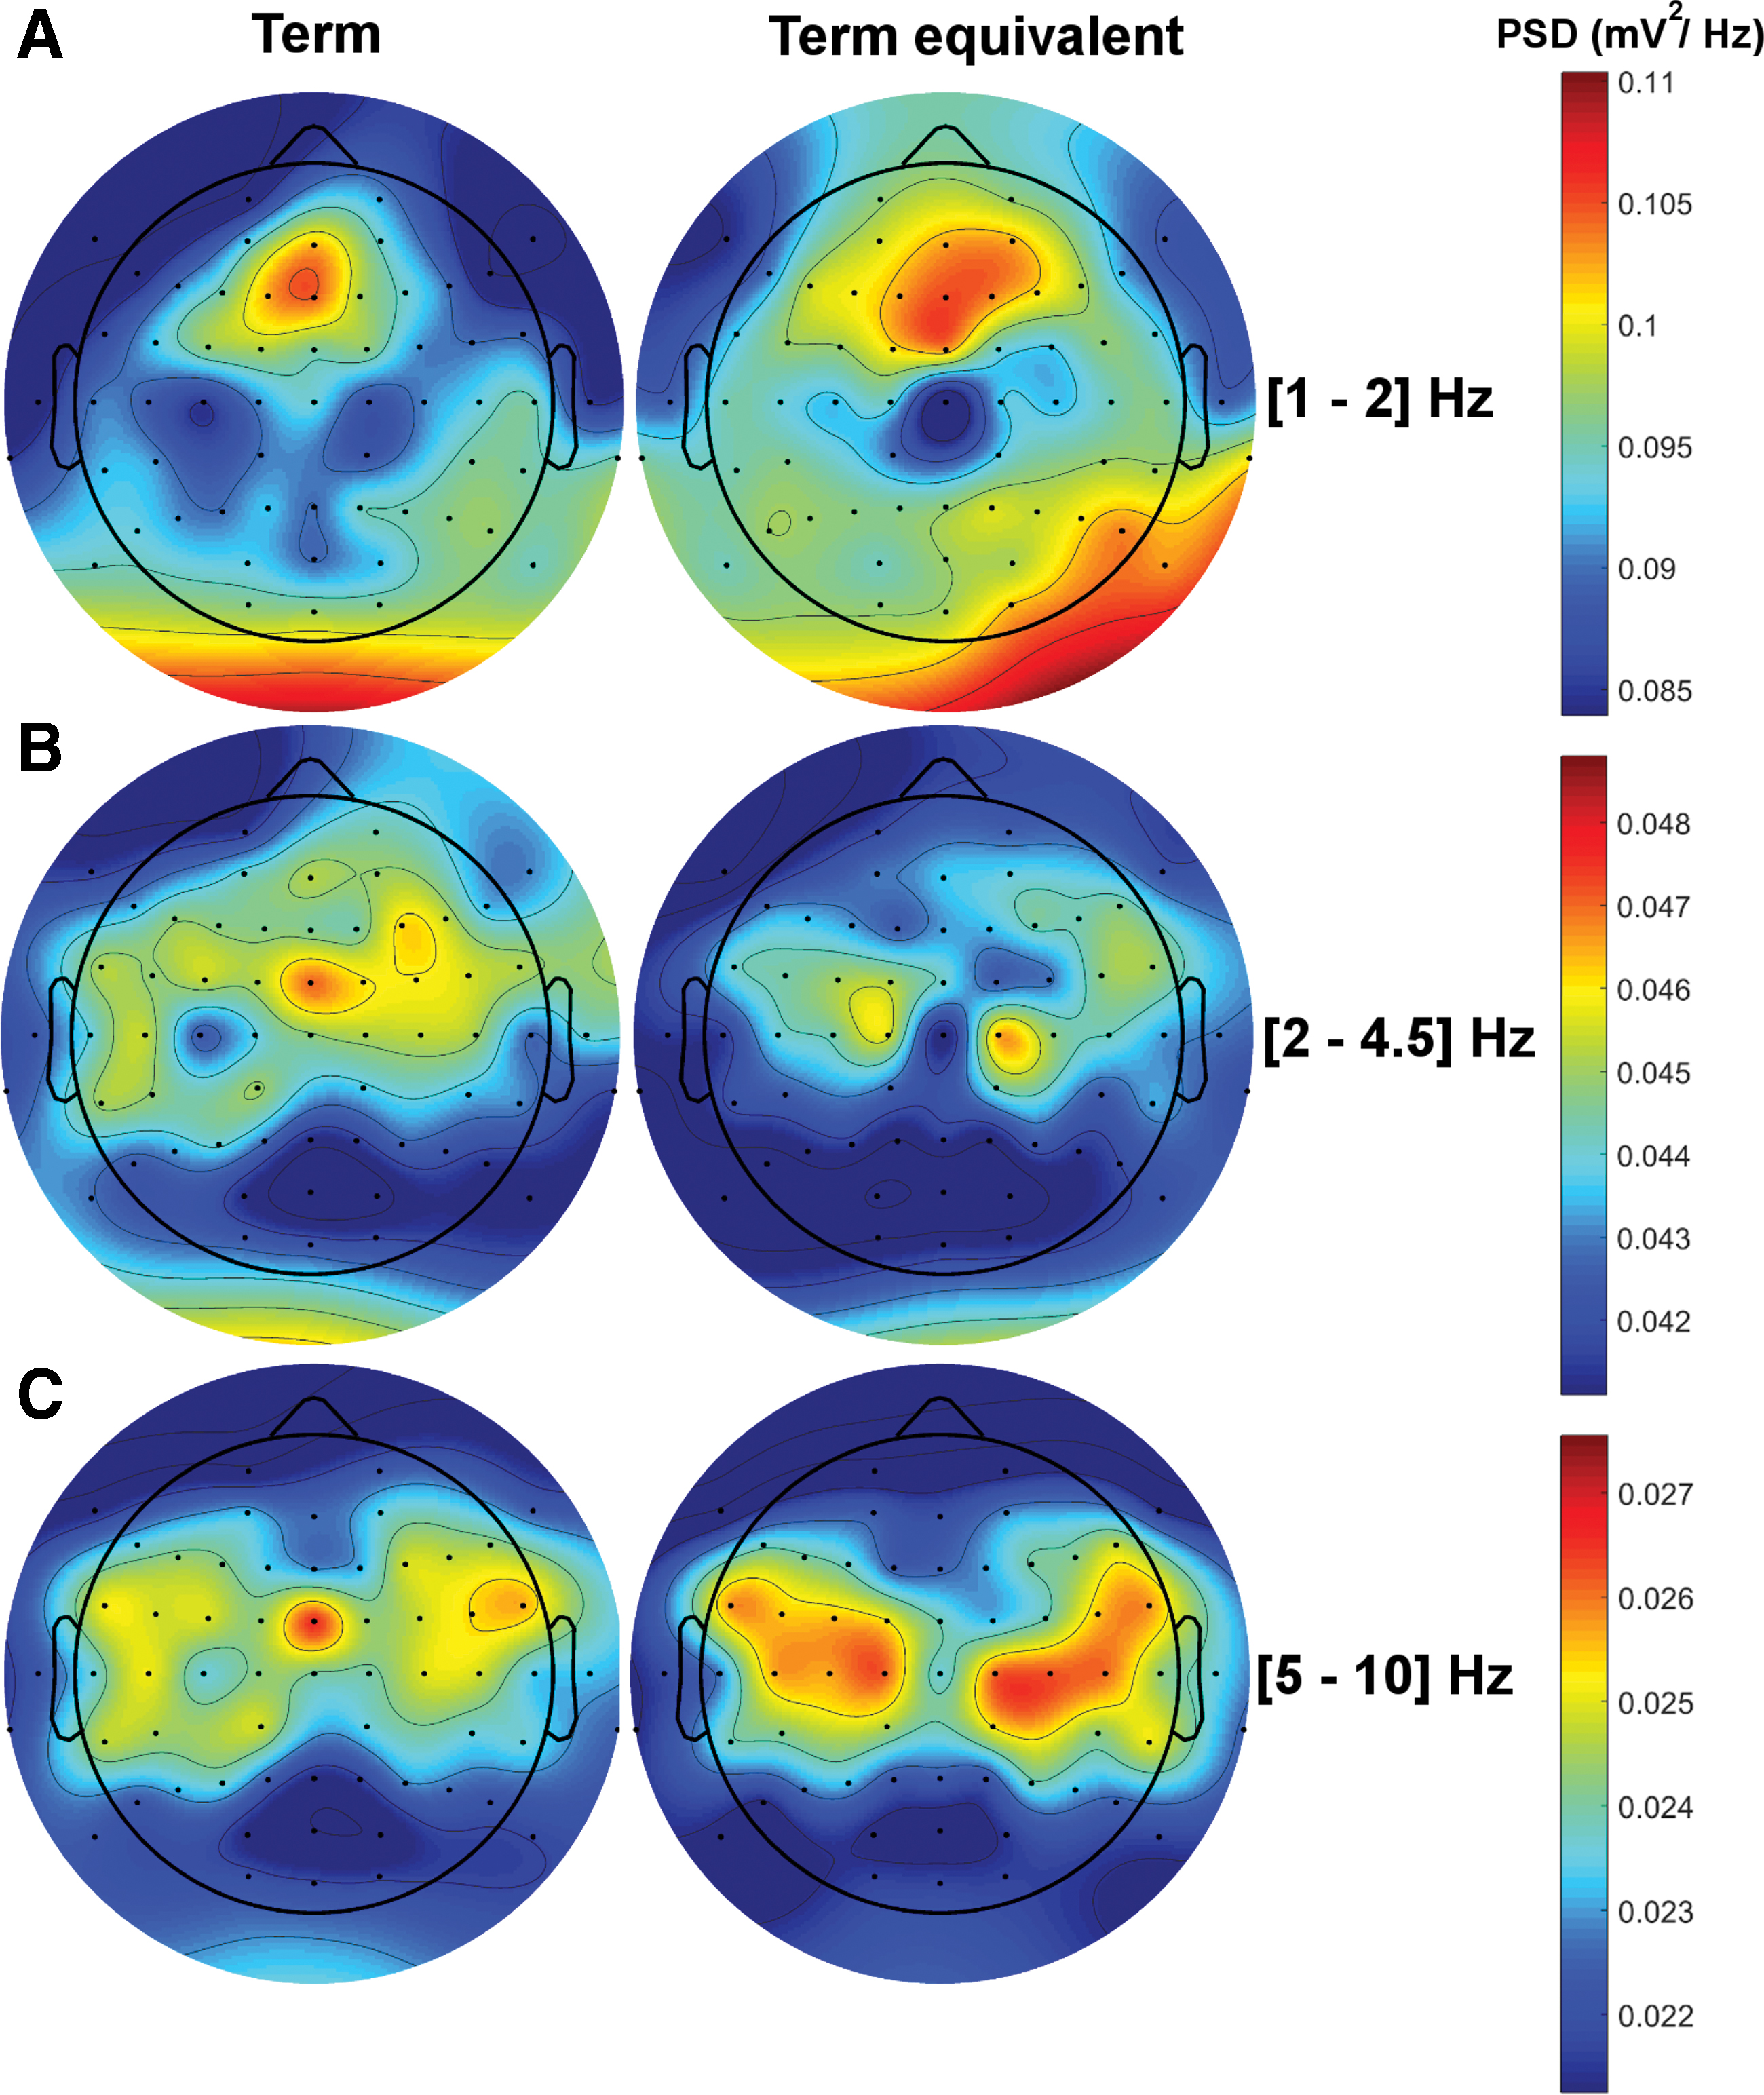
The group-level spatial patterns of the PSD in the term and pre-term born groups.
Dynamic RS brain networks inferred from EEG source estimates in infants
The spatial ICA of the concatenated subjects' mPCA of non-zero time-lagged time–frequency coherence between the cortical activity signals in these 90 ROIs revealed spatially, spectrally, and temporally resolved distinctive modes of functional brain networks that are consistently expressed in 100 infants (Jackknifing test, one-sided p
Rich-club organizations reflect cortical network states in infants
Our network derivation approach revealed five spatially independent patterns of RSNs, each with distinctive rich-club curves associated with specific rich-club topological organization (Fig. 3). The rich-club of interconnected cortical hubs in these five RSNs, respectively, show the existence of the default mode network (DMN), primary sensory-limbic system network, thalamo-frontal network, thalamo-sensorimotor, and visual-limbic system networks (Fig. 3). The normalized weighted rich-club curve (red), as the ratio of the weighted rich-club curve [

Rich-club coefficients (left column) and organization of RSNs (glass-brain panels).
The default mode network
The rich-club organization of the DMN at the node-degree K = 31 spans the left and right cortical hubs (gold) that are connected with each other by the rich-edges (gold): right superior frontal lobe, homologous posterior cingulate cortices, left cuneus, and right precuneus in the basic visual processing system (Fig. 3A, glass-brain panels). The functional connections among the basal ganglia (pallidum and caudate—the limbic system), right superior frontal lobe, and posterior cingulate cortex are richly structured in the DMN throughout the homologous thalamus regions. The non-hub cortical regions of homologous occipital lobes, frontal mid and superior gyri, left supplementary motor area, and somatosensory cortex, have a broad range of degrees
Primary sensory-limbic system network
The rich-club architecture of the second network at the degree K = 27 reveals the primary functional hubs, mainly interhemispherically and bilaterally, including the primary auditory cortex (Heschl), primary somatosensory cortex (left postcentral), left insula (involved in the motor control and cognitive functioning), inferior parietal lobe, right olfactory, Rolandic operculum, right hippocampus, amygdala, and basal ganglia (putamen and caudate; Fig. 3B, glass-brain panels). The topological organization of the feeders densely links the non-hub cortical regions of superior, middle, and inferior temporal, frontal, and occipital lobes (
Thalamo-frontal network
The rich-club of hub cliques in the third network spans the limbic system and frontal gyri including the homologous thalamus regions, posterior and anterior cingulate cortices, right hippocampus, superior, medial, and middle frontal orbits, and rectus at the degree K = 28 (Fig. 3C, glass-brain panels). The feeders link non-hub cortical regions of the right supplementary motor area, left hippocampus, parahippocampal, amygdala, homologous olfactory systems, basal ganglia (putamen, pallidum, and caudate) and occipital lobe (in a range of degrees
Thalamo-sensorimotor network
The spatial pattern of the rich-club of hubs in the fourth RSN reveals the sensorimotor-thalamic network spanning the thalamus, basal ganglia (putamen and caudate), supplementary motor area, primary motor cortex, somatosensory, superior/inferior frontal gyri at degree K = 27 (Fig. 3D, glass-brain panels). The feeders densely link the noncortical hubs of occipital lobes, superior, middle, and inferior frontoparietal lobes, and cingulate cortices, in a range of degrees
Visual-limbic system network
The spatial pattern of the rich-club of hub cliques in the fifth RSN shows the visual-limbic system network spanning the superior/middle occipital gyri, cuneus, putamen, posterior cingulate cortex, parahippocampal gyrus, hippocampus, amygdala, and olfactory at K = 27 (Fig. 3E, glass-brain panels). The feeders, throughout the rich-club of occipital lobe and the limbic system, link the homologous frontal lobes and anterior/middle cingulate gyri and the right occipital lobe with the rich-club brain hubs in a range of degrees
Richly structured RSNs in infants are functionally vulnerable
Graph theoretical analysis of the networks revealed the coexistence of functional integration and segregation capacity, small-world topology, and functional vulnerability in each of the five spatially independent RSNs (Table 1). Although the global node-degree/strength of the DMN (31/25) is greater than the others confined in the interval of [27/13, 29/16], the visual-limbic system network shows a greater mean betweenness-centrality (282.14) than the others nested in a range of [128, 278]. All networks show high mean clustering coefficient and small short path length in the intervals of [65, 78] and [0.6, 1.07], respectively. These five RSNs exhibit small-world topology with the values significantly >1 (1000 network randomization tests, one-sided p
Graph Theoretical Metrics of Resting-State Networks in Infants at Term Age
Measures represent mean + 1 SD.
Normalized values.
Interestingly, although the normalized values of the global efficiency measures of the networks are >1 (1000 network randomization tests), which indicate the existence of functional integration capacity in the infant brain at term age, the negative values of the assortativity coefficients of the networks (i.e., [−0.52, −0.35]) reveal the vulnerability (or weak resilience) of high-degree hubs in these five RSNs (Maslov and Sneppen, 2002). The results mean that neonatal cortical activity in the macroscopic large-scale level is functionally immature, suggesting the presence of neural plasticity in the large-scale functional organization of neonatal brain. The result offers a capacity to monitor brain health with respect to the functional resilience of brain function development in preterm infants.
Spectral fingerprints of RSNs in infants reflect the already established cortical network-dependent carrier frequency at term age
The spectral fingerprints of the five RSNs reveal the carrier frequency (or fast timescale) at which the spatially distributed large-scale cortical oscillations in the brain exhibit synchronous regimen over time (Hipp et al., 2012; Mehrkanoon et al., 2014a). In the DMN, a wide range of significant functional connectivities (0.28–0.57, one-sided p
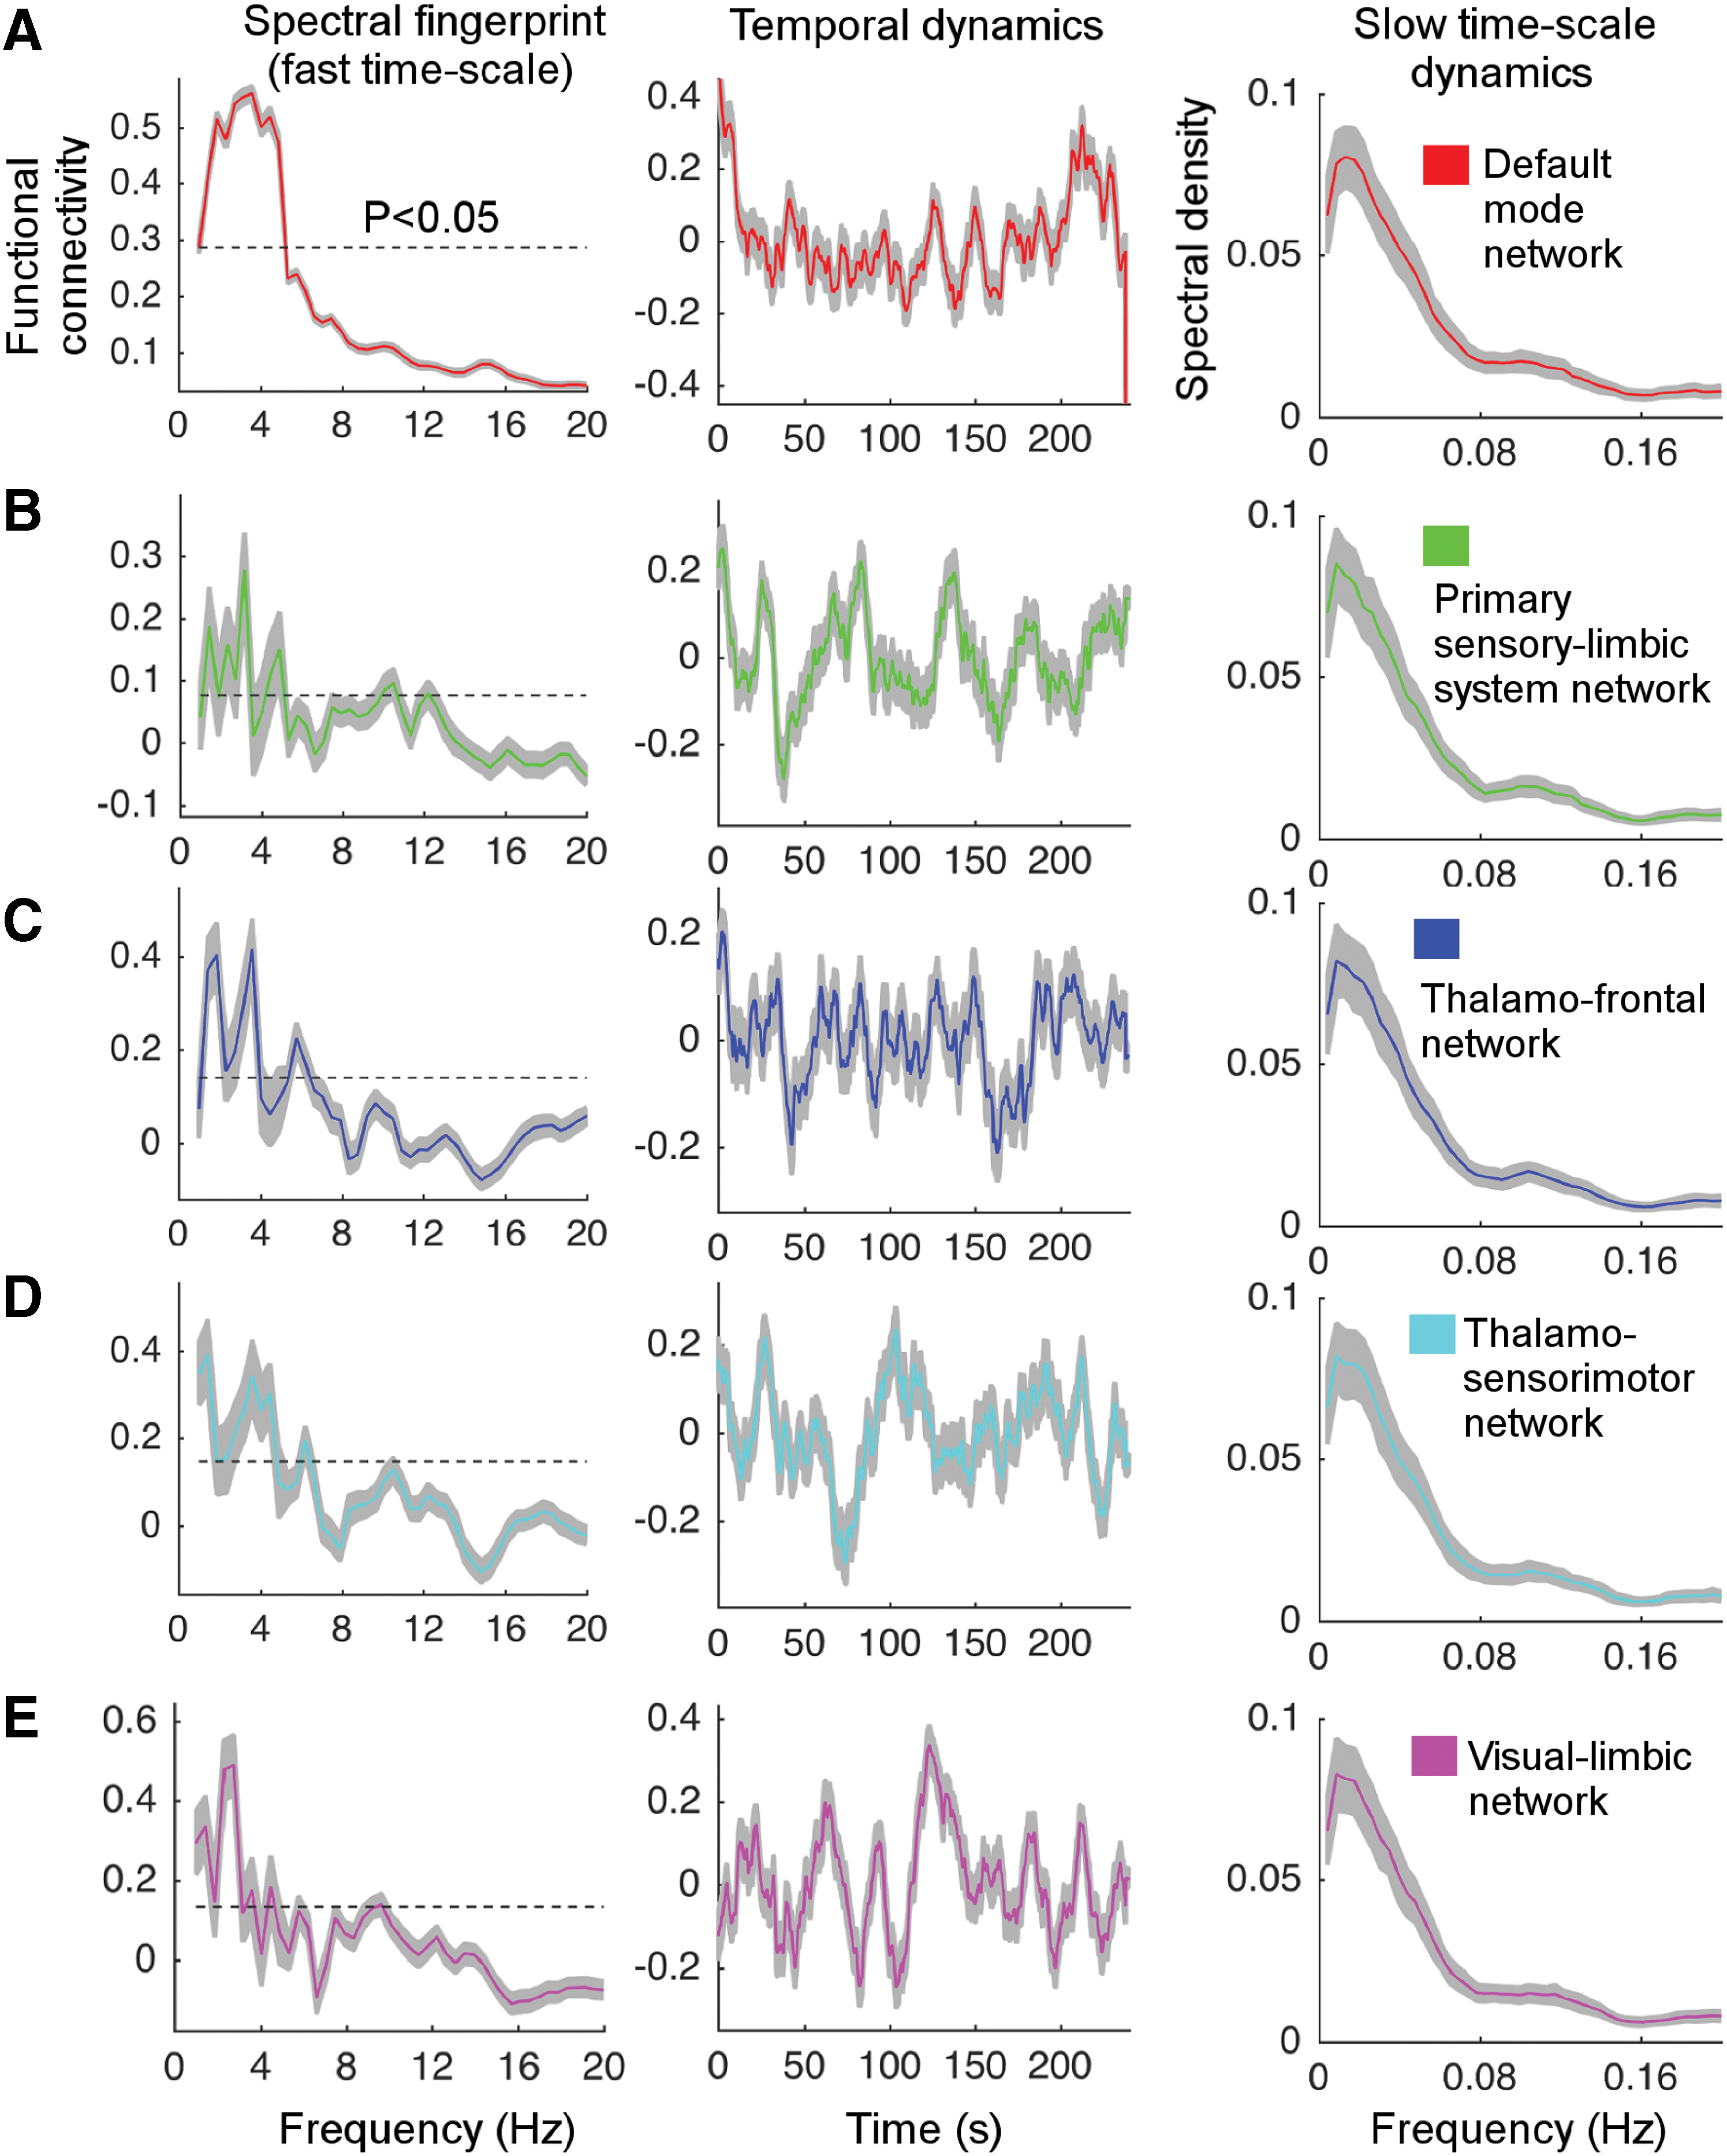
Spectral fingerprints, temporal dynamics, and slow timescale oscillations of the five robust RSNs in 100 infants.
The spectral fingerprints of the sensorimotor-thalamic and visual-limbic system networks, respectively, show significantly strong functional connectivity values of 0.38 (cyan) and 0.32 (pink; one-sided p
Infant brain networks exhibit richly organized temporal dynamics
The instantaneous fluctuations of the fast timescale of the RSNs are reflected by the temporal dynamics at slow timescales, unfolding the brain network dynamics (Mehrkanoon et al., 2014a). The temporal dynamics of the five RSNs show slow timescale oscillatory patterns of the connectivity strengths confined in [−0.3, 0.3] interval with multiple peaks between
All RSNs show peaks at
Long-range correlations of temporal dynamics of networks reflect scale invariance structure of cortical oscillations in infancy
Because the human brain can be thought of as a complex dynamical system (Kobayashi et al., 1999; Mehrkanoon et al., 2014a), temporal activity of such a system has a sensitive dependence on the initial condition of the system (Glasner and Weiss, 1993), indicating that the past temporal activity of the brain influences its future behavior (Kobayashi et al., 1999). To quantify the extent of a long-range dependence property of the infant brain network dynamics, the Hurst exponent analysis of the temporal dynamics of the five RSNs that exhibit apparent power-law (or 1/f-like) scaling of the low-frequency activity was performed (Fig. 5). The average Hurst exponent of the temporal dynamics of the RSNs lies in the range of 0.85–0.9 (Fig. 5A), indicating that the dFCs in infants at term age have persistent, long-range temporal dependencies, a property that is far from a random process and is consistent with slow power-law decay.

Temporal organization of brain network dynamics in infants.
Temporal dynamics of RSNs reflect fast–slow sequence of cortical network states in infants
The correlation matrix of the RSNs temporal dynamics show four levels of hierarchically interconnected clusters (1000 permutation tests, one-sided p
Crucially, the existence of temporal asymmetry in RSNs expression shows fast and slow sequences of directional interactions between RSNs in cortical activity. Each of the two temporally fast and slow sequences of leading–following network interactions show two cycles: a three-network cycle and a four-network cycle. The three-network cycle consists of {(DMN, thalamo-frontal, primary sensory-limbic system); (primary sensory-limbic system, thalamo-sensorimotor, visual limbic)} (panel I) and {(DMN, thalamo-sensorimotor, primary sensory-limbic system); (primary sensory-limbic system, visual limbic, thalamo-sensorimotor)} (panel J). The four-network cycle includes {(DMN, thalamo-frontal, primary sensory-limbic system, thalamo-sensorimotor); (primary sensory-limbic system, thalamo-sensorimotor, visual limbic, thalamo-frontal)} (panel I) and {(DMN, visual limbic, thalamo-sensorimotor, primary sensory-limbic system)} (panel J).
As an example, the thalamo-frontal network follows the networks of default mode, primary sensory-limbic system, thalamo-sensorimotor, and visual limbic at the time delays of 33.8, 23.9, 23.3, and 21.3 sec, respectively (panel J). The DMN and thalamo-frontal network, with in-degree = 3, are the leading networks in the fast sequence of network expression (panel I), tending to follow the sensorimotor–thalamic system and visual-limbic system networks in the slow sequence of network expression (panel J), revealing the existence of a swap in the leading and following networks among the temporally fast and slow sequences of network expressions. The primary sensory-limbic system network that has equivalent scores of in-degree = 2 and out-degree = 2 among the fast and slow sequences of network expressions plays a pass-through network in the dynamical interplay between the other four networks (panel K).
Discussion
The analysis of RS-EEG source reconstruction in 100 infants at term age revealed five robust RSNs that reveal significant new information; these identified RSNs capture, for the first time in human infants' functional brain network studies, the dominant patterns of anatomically constrained spatially, spectrally, and temporally resolved dynamic synchronization between distributed cortical activity. These RSNs are constituted by a narrowband carrier frequency (1–8 Hz) that is nested by much slower and persistent fluctuations at
Functional connectivity between the thalamus and other brain regions (e.g., basal ganglia, primary sensory, and sensorimotor systems) in these five RSNs suggests that long-range functional connections are already established at birth. These functional connections regulate the cortico-cortical functional networks and high-order cortices that support salience, executive, integrative, and cognitive functions in infancy and childhood (Cao et al., 2017; Gilmore et al., 2018; Tau and Peterson, 2009). Coexistence of the small-world topology and vulnerability of these five RSNs suggests that the primary dynamical complexity of the brain functions has the necessary, but insufficient, conditions for information processing at term age; this is consistent with the topological principles of the RSNs identified by diffusion MRI and fMRI studies in infants (Ball et al., 2014; Cao et al., 2017; Doria et al., 2010; Fransson et al., 2011; Van Den Heuvel et al., 2015); however, such poor network vulnerability gradually decreases during the first 2 years of life (Cao et al., 2017; Gao et al., 2011).
These networks have distinctive spectral fingerprints with narrowband frequency bases: The DMN has a bell-shape peak within the delta-theta bands, and the primary sensory, thalamocortical, and limbic system networks have peaks in the narrowband delta-theta and low-alpha frequencies The delta-band spectral fingerprint of the thalamo-frontal and thalamo-sensorimotor networks shows that low-frequency macroscopic neuronal oscillations in the thalamus regulate sensorimotor and frontal cortex, consistent with previous reports (Timofeev and Chauvette, 2011). The fMRI findings have shown that the visual networks start (or function) at birth (Doria et al., 2010; Fransson et al., 2007). The coexistence of peaks in the delta and low-alpha bands (as opposed to only alpha or low-alpha band) in the visual-limbic system network suggests that the visual networks start immaturely at birth. Because alpha oscillations increase in power from 4 to 10 months (Cornelissen et al., 2015), the visual networks observed at birth cannot be seen as already established mature visual networks.
The neuronal mechanisms underpinning network dynamics (or brain state) are governed by a long-range correlation process. The existence of this nonrandom process in cortical activity at birth is proven by the Hurst exponents of the temporal dynamics of the RSNs. The values of the Hurst exponents are >0.5 (0.88–0.9), indicating long-range correlation in the underlying process of network dynamics, which is consistent with previous studies (Mehrkanoon et al., 2014a). The coexistence of long-range correlation in network dynamics, distinctive spectral and spatial patterns of RSNs in infants suggest that the brain's intrinsic functional organization underpins the establishment of dynamic functional networks in infancy. This is consistent with macroscopic cortical network dynamics that evolve on very slow timescale and have long-range persistence in the adult RSN dynamics (Linkenkaer-Hansen et al., 2001; Mehrkanoon et al., 2014a).
Networks with a wide range of peaks in the delta-theta bands (DMN and thalamo-frontal network) are typically expressed slightly earlier than others during each fast cycle of network expression (i.e., t = 0 sec). In contrast, networks with distant, but distinctive, peaks in the delta, theta, and low-alpha bands are expressed over slow cycle of network expression t
This timing profile of network dynamics suggests an indirect brain state transition from spectrally and temporally ordered network state to those with distinctive peaks during each wave of network expression. This is consistent with the view of dynamic FC, which is the direct product of intrinsic brain electrical activity at distinctive frequencies in the adult brain (Tagliazucchi et al., 2012). The present findings suggest that infant brain network dynamics arise from long-range synchronization of band-limited cortical oscillations subjected to an interplay between temporally fast and slow sequences of coherent cortical oscillations. The timing profile of this interplay is not temporally symmetric among the networks, but rather the appearance of some networks such as the default mode and thalamo-frontal characteristically leads the primary functional limbic, thalamo-sensorimotor, and visual-limbic system networks (Fig. 5I).
The temporally fast and slow sequences of network interactions identify the leader and follower networks in the evolution of the dynamic repertoire of RS cortical activity; this provides key timing information by when the temporal formation and dissolution of the brain states are captured (Fig. 5B, I–K), reflecting immature meta-state dynamics and evolutionary traveling waves in the infant brain, consistent with the hierarchically organized cortical network dynamics that exhibit spontaneous travelling waves in the adult brain (Vidaurre et al., 2017). Furthermore, spectral fingerprints of the networks identify the neuronal oscillatory mechanisms underpinning the evolution of functional networks. Such functional network evolution as identified by thalamocortical FC (which is part of Fig. 3A, C, D) and cortico-limbic system network (Fig. 5B, E) reveals immature cognitive and memory network formation in infants, which has been shown to have the potential to predict neurocognitive outcomes in children born preterm (Ball et al., 2015). The fast timescale, temporal dynamics, and slow timescale (or modulation) of RSNs in infants offer a system neuroscience tool to help assess the development of functional brain networks. Particularly, our future work will investigate which of the spatial, spectral, and temporal information features of RSNs correlate with adverse neurodevelopmental outcomes.
In conclusion, this study of a large cohort of human infants has shown that integration of mPCA and spatial ICA algorithms in conjunction with time–frequency EEG source estimates provides a novel method for inferring patterns of robust dynamic functional brain connectivity. These richly organized dynamic brain networks captured the evolution of cortical oscillation synchronization at multiple frequencies. The characteristic temporal dynamics of the networks prove the existence of a scale-free property in the neonatal cortical activity in which the brain network states mutually correlate with each other to establish the functional organization of the brain in infants. The findings suggest that the functional organization of nested RS brain network dynamics does not solely depend on the maturation of cognitive networks; instead, the brain network dynamics exist in infants at term age well before the mature brain networks present in childhood and adulthood, and hence, the existence of both spontaneous cortical oscillations and network dynamics in infants at term age offer a quantitative measurement of neurotypical development in infants. Furthermore, this work offers a novel contribution to the assessment of brain network identification and assessments in infants by quantifying anatomically constrained cortical networks. This provides a new functional basis for future work to design an effective clinical diagnostic tool with the capacity for early accurate diagnosis of neurodevelopmental disability and prognostication of neurodevelopmental outcome in sick preterm and term babies.
Footnotes
Authors' Contributions
S.M. designed the research problem in collaboration with P.C. S.M. performed research, analyzed data, and interpreted the results. P.C. contributed to the clinical interpretation of the results. B.B. commented on the final version of the article. S.M., B.B., and P.C. wrote the article.
Acknowledgments
The preprint postings of this article can be found in the following servers: arXiv (2019/02/11,
Author Disclosure Statement
No competing financial interests exist.
Funding Information
S.M. was supported by an Advance Queensland Fellowship Grant (AQRF06016-17RD2) funded by the Queensland State Government, Australia (2017–2019). Data collection was supported by the National Health and Medical Research Project grant APP1084032. B.B. was supported by Qatar Foundation grants NPRP6-885-2-364 and NPRP6-680-2-282.