
Abstract
Background:
Functional connectivity quantifies the statistical dependencies between the activity of brain regions, measured using neuroimaging data such as functional magnetic resonance imaging (fMRI) blood-oxygenation-level dependent time series. The network representation of functional connectivity, called a functional connectome (FC), has been shown to contain an individual fingerprint allowing participants identification across consecutive testing sessions. Recently, researchers have focused on the extraction of these fingerprints, with potential applications in personalized medicine.
Materials and Methods:
In this study, we show that a mathematical operation denominated degree-normalization can improve the extraction of FC fingerprints. Degree-normalization has the effect of reducing the excessive influence of strongly connected brain areas in the whole-brain network. We adopt the differential identifiability framework and apply it to both original and degree-normalized FCs of 409 individuals from the Human Connectome Project, in resting-state and 7 fMRI tasks.
Results:
Our results indicate that degree-normalization systematically improves three fingerprinting metrics, namely differential identifiability, identification rate, and matching rate. Moreover, the results related to the matching rate metric suggest that individual fingerprints are embedded in a low-dimensional space.
Discussion:
The results suggest that low-dimensional functional fingerprints lie in part in weakly connected subnetworks of the brain and that degree-normalization helps uncovering them. This work introduces a simple mathematical operation that could lead to significant improvements in future FC fingerprinting studies.
Impact statement
We introduce a simple mathematical operation that systematically improves the extraction of functional connectivity fingerprints from neuroimaging data, according to three different metrics. The results suggest that the information related to individual traits lies in part in weakly connected brain areas and can be compressed in a low-dimensional space. We also show the benefits of using multiple metrics to quantify fingerprint in a data set. Our approach could improve future individual-level studies of functional neuroimaging data, which are crucial for the personalized diagnosis and treatment of neurological disorders, as well as for the study of the relationship between brain and behavior.
Introduction
The study of brain functional connectivity aims to understand how distributed neural regions of interest (ROIs) interact with each other during resting-state and task conditions (Bullmore and Sporns, 2009; Fornito et al., 2016). Thanks to advances in functional magnetic resonance imaging (fMRI), the measurement of blood-oxygenation-level dependent (BOLD) signals provides an estimate of brain activity across conditions (Ogawa et al., 1990). In this context, a widespread approach to quantify functional connectivity is to compute pairwise Pearson's correlation coefficients between BOLD time series measured at each ROI. The resulting symmetric correlation matrix is referred to as a functional connectome (FC) and can be understood as the adjacency matrix of a network where nodes are ROIs and edges represent functional interactions between those ROIs (Bullmore and Sporns, 2009; Fornito et al., 2016).
The network analysis of brain connectivity is able to capture important features of cortical organization, such as integration and segregation (Bullmore and Sporns, 2009; Shine et al., 2016, 2018, 2019), as well as modularity and community structure (Betzel et al., 2016; Betzel et al., 2019; Puxeddu et al., 2020; Sporns and Betzel, 2016). Furthermore, FCs have been used in the study of several brain disorders (Fornito et al., 2015), such as schizophrenia (Gutiérrez-Gómez et al., 2020; Lynall et al., 2010; Micheloyannis et al., 2006) and Alzheimer disease (Supekar et al., 2008; Svaldi et al., 2019).
Several studies demonstrated the existence of a fingerprint embedded in individual-level neuroimaging data, allowing participant identification in test–retest settings. Various types of descriptors have been investigated to uncover brain fingerprints, ranging from anatomical features (Valizadeh et al., 2018) and morphometric measures (Wachinger et al., 2015) to white matter fiber trajectories (Kumar et al., 2017) and multimodal embeddings (Kumar et al., 2018). In parallel to these nonconnectomic studies, a growing interest in the brain fingerprint specific to FCs has emerged (Finn et al., 2015; Gratton et al., 2018; Iturria-Medina et al., 2018; Liu et al., 2018; Mars et al., 2018; Menon and Krishnamurthy, 2019; Pallarés et al., 2018; Satterthwaite et al., 2018; Seitzman et al., 2019). This fingerprint can be extracted through data-driven procedures (Amico and Goñi, 2018; Byrge and Kennedy, 2019) as well as reproduced across sites (Bari et al. 2019). These findings have important implications in the perspective of individual-level functional connectivity analysis. For instance, personalized medicine in the study of brain disorders can benefit from FCs revealing robust individual traits (Iturria-Medina et al., 2018; Svaldi et al., 2019). Moreover, participant identifiability across test–retest fMRI sessions has recently been proposed as an indicator of scan reliability for both researchers and clinicians, provided that appropriate and possibly complementary fingerprinting metrics are investigated (Milham et al., 2021). In sum, uncovering meaningful brain fingerprints enables a shift from population-level research to individual-based scientific investigation and clinical examination.
As recently shown (Rajapandian et al., 2020), fingerprints are also reflected in different network properties of FCs. To characterize the topology of functional networks, numerous networks statistics have been introduced (Rubinov and Sporns, 2010). One of the most fundamental measures for binary networks is the degree of a node, that is, the number of nodes it is connected to. In weighted networks, the weighted degree (or the strength) of a node is the sum of the weights of its neighboring edges. The weighted degree sequence denotes the vector gathering the weighted degree of all nodes in the network.
In this study, we show the benefits of applying a mathematical operation, known as degree-normalization, to FCs before extracting functional connectivity fingerprints. Degree-normalization uses the information encoded in the weighted degree sequence to reduce the weight of edges lying between strongly connected nodes (hubs) comparatively to others, thereby balancing their excessive influence in the network. This operation has been applied in previous studies on weighted communicability measures of networks (Crofts and Higham, 2009; Estrada et al., 2012; Rajapandian et al., 2020) as well as in the study of random walks on networks through the use of the normalized Laplacian (Lambiotte et al., 2014). We adopt the differential identifiability framework recently developed by Amico and Goñi (2018) for FC fingerprinting based on a principal components analysis (PCA) decomposition-reconstruction procedure. Because computing the absolute value of FCs is an intermediate step required before applying degree-normalization, we compare the results of this framework applied on (1) the original (signed) FCs, (2) the FCs taken in absolute value, and (3) the degree-normalized FCs. To assess the quality of the fingerprint extraction, we consider two previously introduced metrics, namely differential identifiability (Amico and Goñi, 2018) and identification rate (Finn et al., 2015), and we introduce a variant of the latter called matching rate. Our results show that degree-normalization improves the fingerprinting scores for all metrics and that reconstructing the corresponding optimally identifiable FCs requires fewer principal components compared with original FCs. We also highlight the difference in the interpretation of the identification rate and the matching rate and argue that the latter provides a more robust depiction of the individual fingerprint in FCs.
Materials and Methods
Data set
We included 409 unrelated individuals from the Human Connectome Project (HCP) 1200-participants release (Essen et al., 2013). This subset of unrelated individuals was chosen from the overall data set to ensure that no two participants have a shared parent. The criterion to exclude siblings (whether they share one or both parents) was crucial to avoid confounding effects in our analyses due to family structure. Data from resting-state (REST) and seven fMRI tasks were used: emotion processing, gambling, language, motor, relational processing, social cognition, and working memory. In this study, we will collectively refer to the resting-state and all the tasks as conditions.
For each condition, subjects underwent two sessions corresponding to two different phase-encoding directions (left-to-right and right-to-left). The resting-state fMRI scans were acquired on two different days with a total of four sessions (coded as REST1 and REST2). In this study, we used the two sessions from REST1. The HCP scanning protocol was approved by the institutional review board at Washington University in St. Louis. Full details on the HCP data set have been published previously (Essen et al., 2012; Glasser et al., 2013; Smith et al., 2013).
The brain atlas used in this study is the multimodal parcellation MMP1.0 proposed by Glasser et al. (2016) and comprising 180 cortical regions by hemisphere. For completeness, we added 14 subcortical regions (covering the bilateral striatum, thalamus, hippocampus, and amygdala) provided by the HCP release, for a total of
Preprocessing
We used the minimally preprocessed data provided by the HCP (Glasser et al., 2013). This pipeline includes artifacts removal, motion correction, and registration to standard template. Full details on this pipeline can be found in earlier publications (Glasser et al., 2013; Smith et al., 2013).
In addition, we applied the following processing steps to the extracted BOLD signals. For resting-state fMRI data: (1) we regressed out the global gray matter signal from the voxel time courses (Power et al., 2014), (2) we applied a bandpass first-order Butterworth filter in the forward and reverse directions (0.001 to 0.08 Hz; Python function filtfilt from the Scipy package v1.2.1), and (3) the voxel time courses were z-scored and then averaged per brain region, excluding any outlier time points that were outside of three standard deviations from the mean (Workbench software, command-cifti-parcellate). For task fMRI data, we applied the same steps, with a more liberal frequency range for the band pass filter (0.001 to 0.25 Hz) since the relationship between different tasks and optimal frequency ranges is still unclear (Cole et al., 2014).
Degree-normalization of an FC
We compute a functional connectivity matrix
where
The degree di of node i of an unsigned network is defined as the sum of the weights of its neighboring edges:
The degree matrix
The degree-normalization of
The resulting matrix

Degree-normalization of an FC.
FC fingerprinting
We analyze each fMRI condition separately. To quantify the variability of our results in the population, we use sampling without replacement. We generate 100 random subsamples of the 409 individuals in the database to obtain 100 data sets containing
For each number of components, we compute the identifiability matrix
Quantifying the level of identifiability
We consider three metrics to estimate the amount of fingerprint in each subsample: the differential identifiability (
Each time a diagonal element
As we can also compute this metric column-wise (i.e., test FC identified from retest FC), we report the average of row-wise and column-wise
It might happen that the test FC of an individual i is most similar not only to its own retest FC but also to that of other individuals. In the extreme case of an FC being highly similar to many others, this will negatively impact the identification rate since many individuals will not be correctly identified. To remedy this, we propose a variant of identification rate, called matching rate (
Control experiment: surrogate degree-normalization
In the present work, we evaluate the impact of normalizing each FC by its own degree sequence. As a control experiment, we also report the results of normalizing each FC by the degree sequence of a surrogate individual chosen uniformly at random, a process denoted as surrogate degree-normalization. Mathematically, this comes down to performing the fingerprinting analysis with the following normalized FCs for individual u with surrogate v:
Here,
Statistical comparison between modalities
To assess the difference of fingerprinting scores obtained with baseline, absolute, surrogate-normalized, and self-normalized FCs (denoted together as modalities), we compute for each fingerprinting metric (
Results
We apply the differential identifiability framework (Amico and Goñi, 2018) to baseline, absolute, and normalized FCs. We compute three metrics: differential identifiability score (
Degree-normalization modulates the influence of high- and low-degree regions of FCs. To provide insight into the brain regions most affected by degree-normalization, Supplementary Tables S1 and S2 show information about the brain regions with the highest and lowest average weighted degrees, for each fMRI condition. In addition, cortical visualizations of the mean and standard deviation of regional weighted degree across individuals are shown in Supplementary Figures S1 and S2.
Figure 2 presents the results related to differential identifiability (
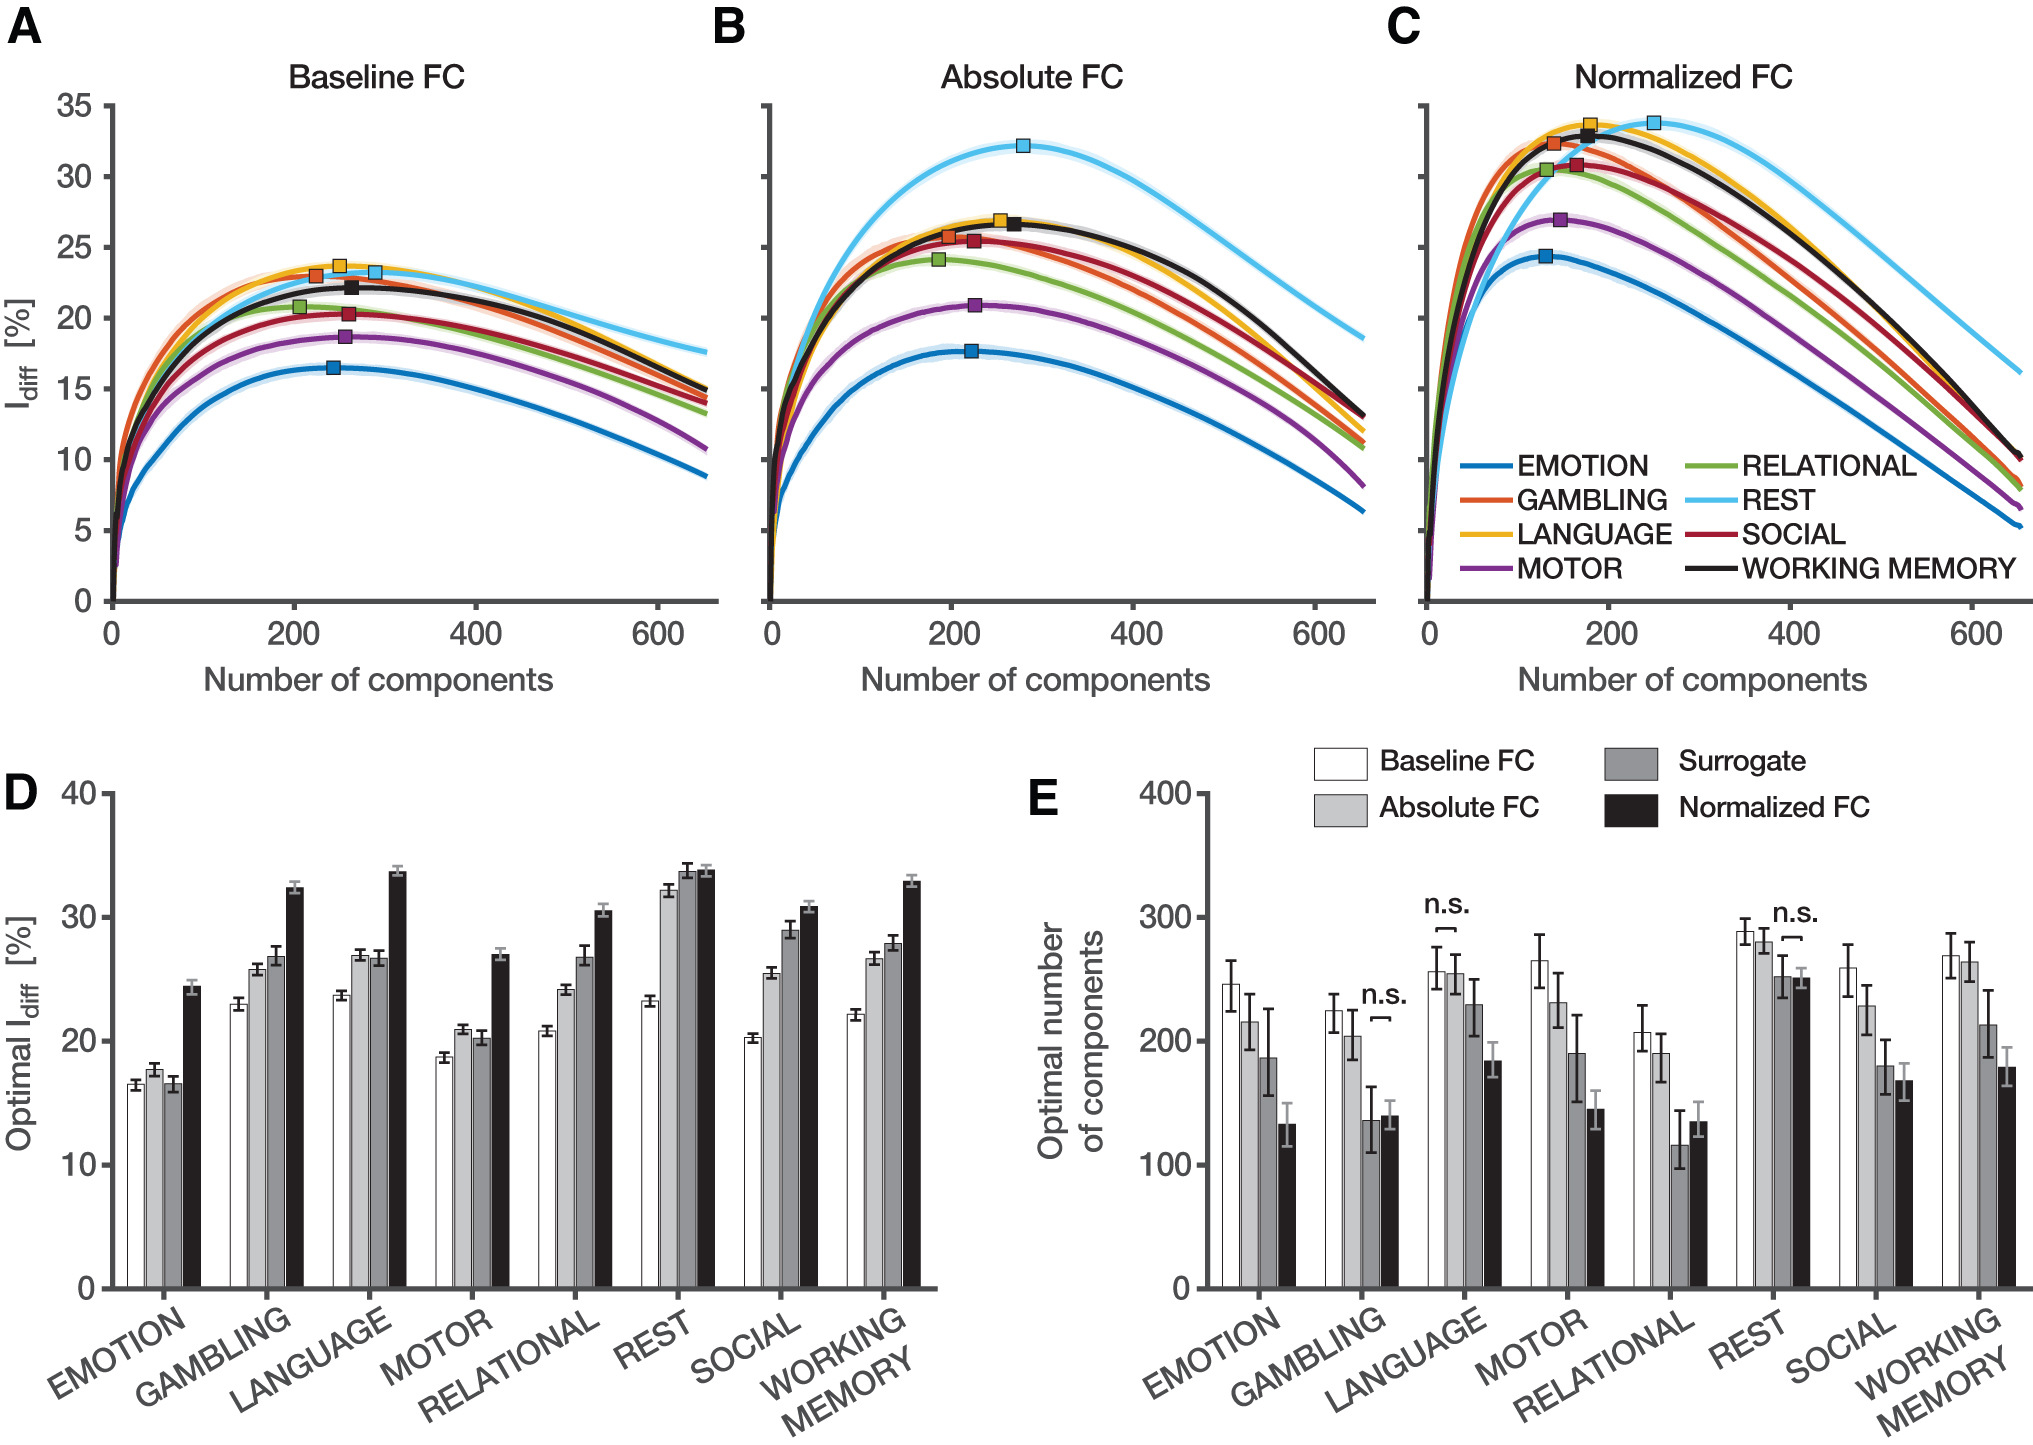
Impact of degree-normalization on differential identifiability.
Figure 3 reports the behavior of

Impact of degree-normalization on I
self and I
others.

Impact of degree-normalization on identifiability matrices. Top row: Identifiability matrices obtained with the baselines FCs at the optimal I diff value, for all fMRI conditions. For visualization purposes, only 25 randomly selected individuals of one subsample of the database are displayed. Middle and bottom rows show the same analysis for absolute and self-normalized FCs, respectively. fMRI, functional magnetic resonance imaging.
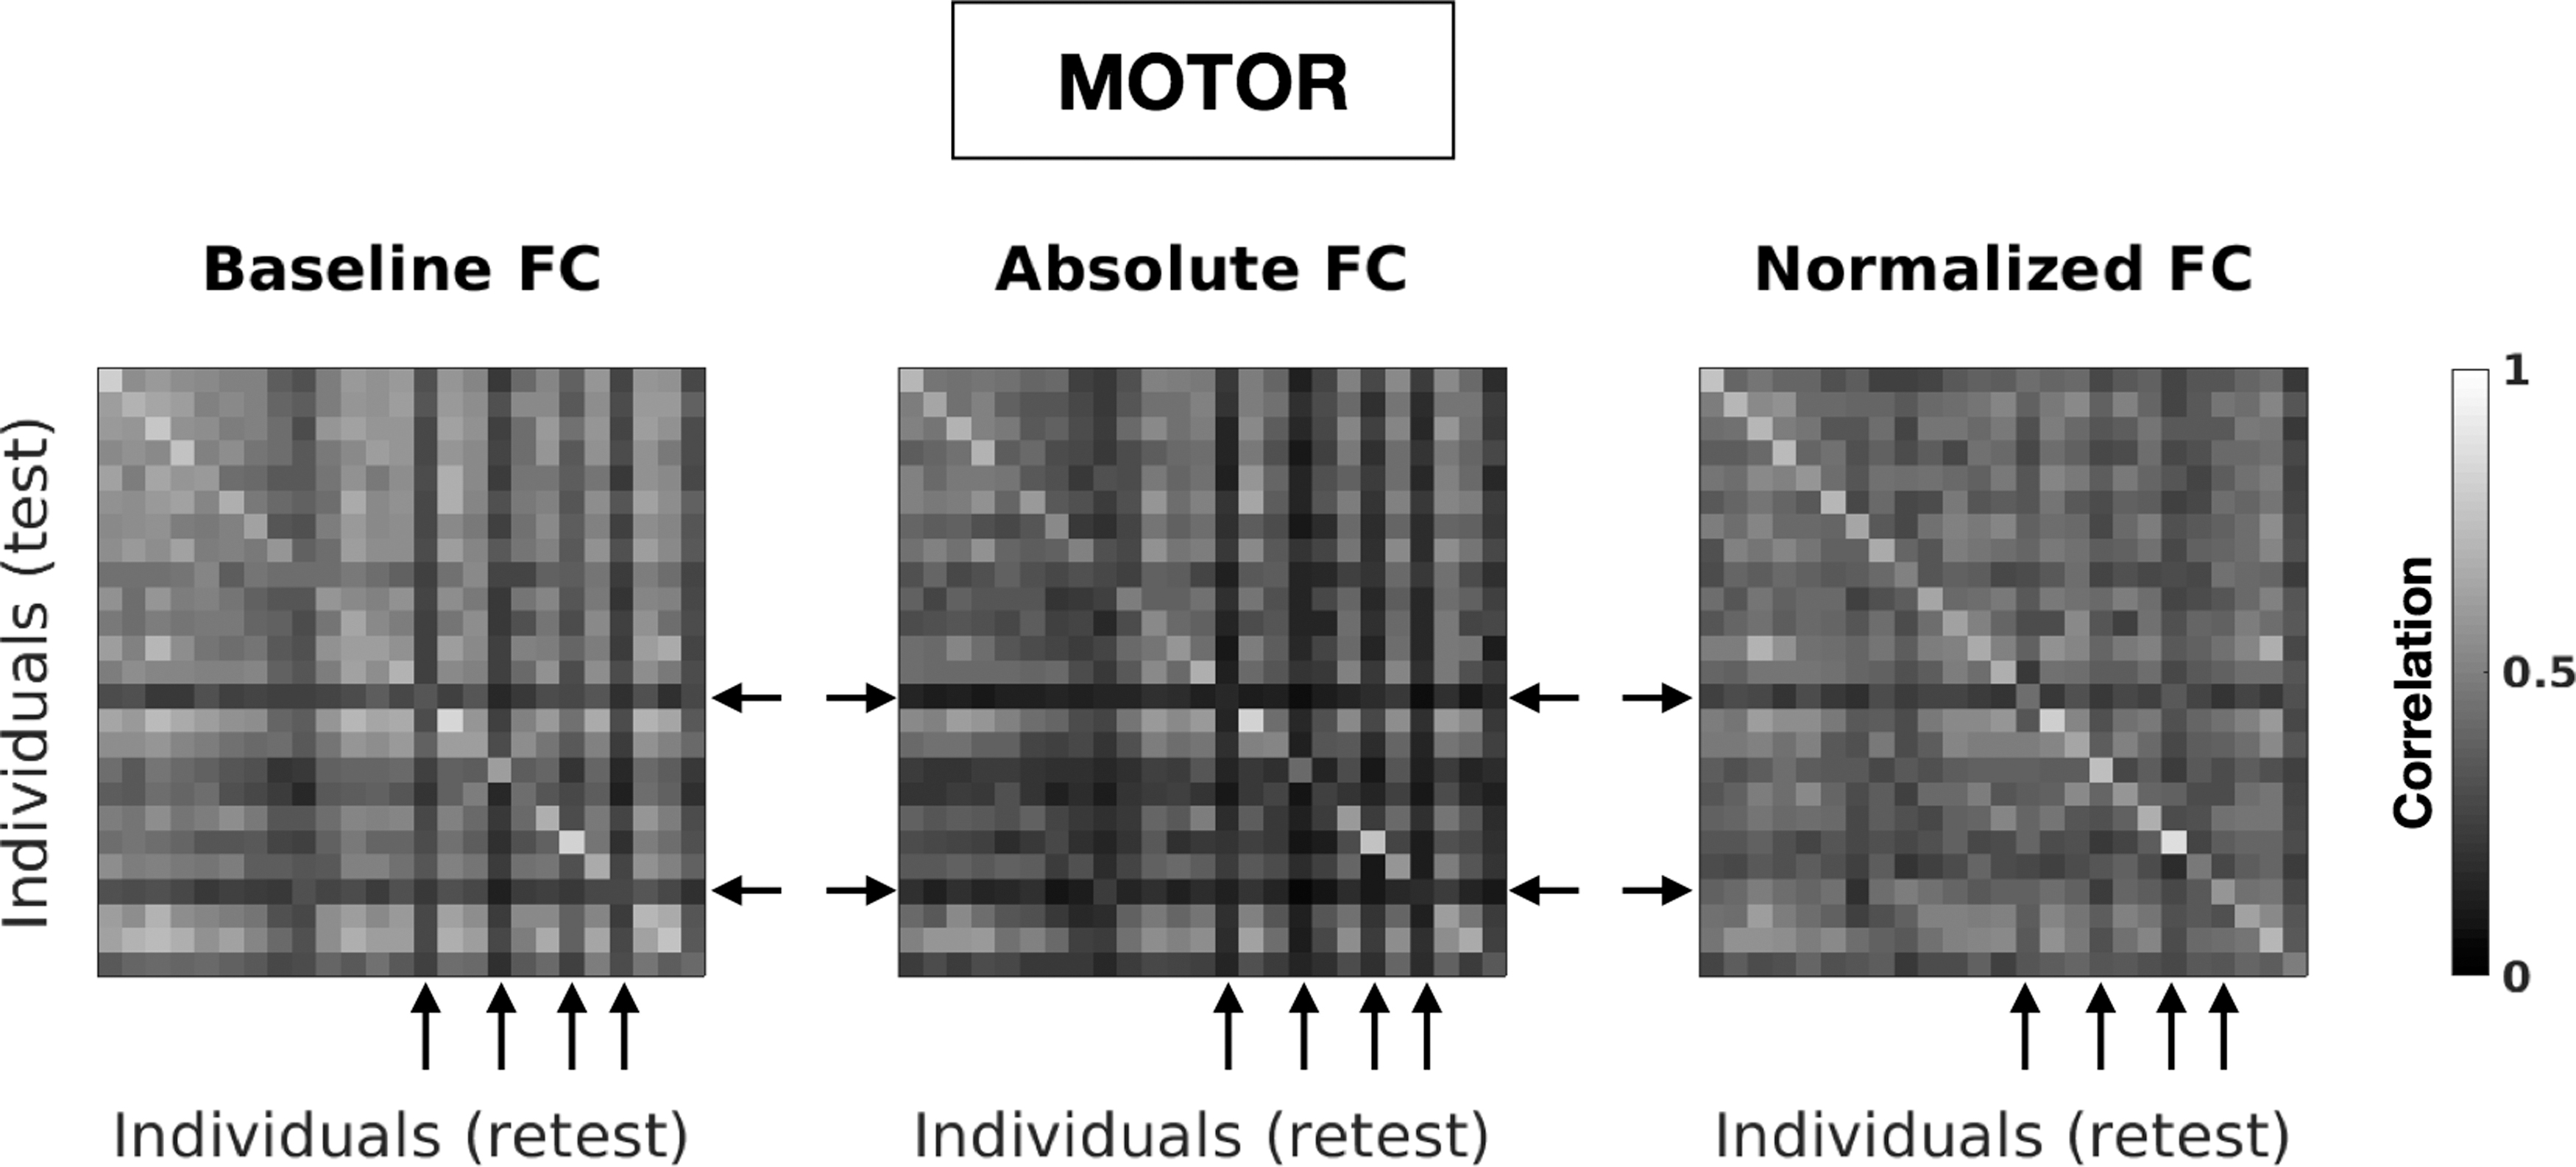
Degree-normalization corrects the profile of outlier FCs. Zoom on the panels of Figure 4 related to the motor task. Arrows highlight typical examples of FCs that are very different to any other FC in the cohort. Note that this effect is alleviated after degree-normalization.
Figure 6 presents the results related to the identification rate (

Impact of degree-normalization 70 on identification rate.
Figure 7 presents the results related to the matching rate (
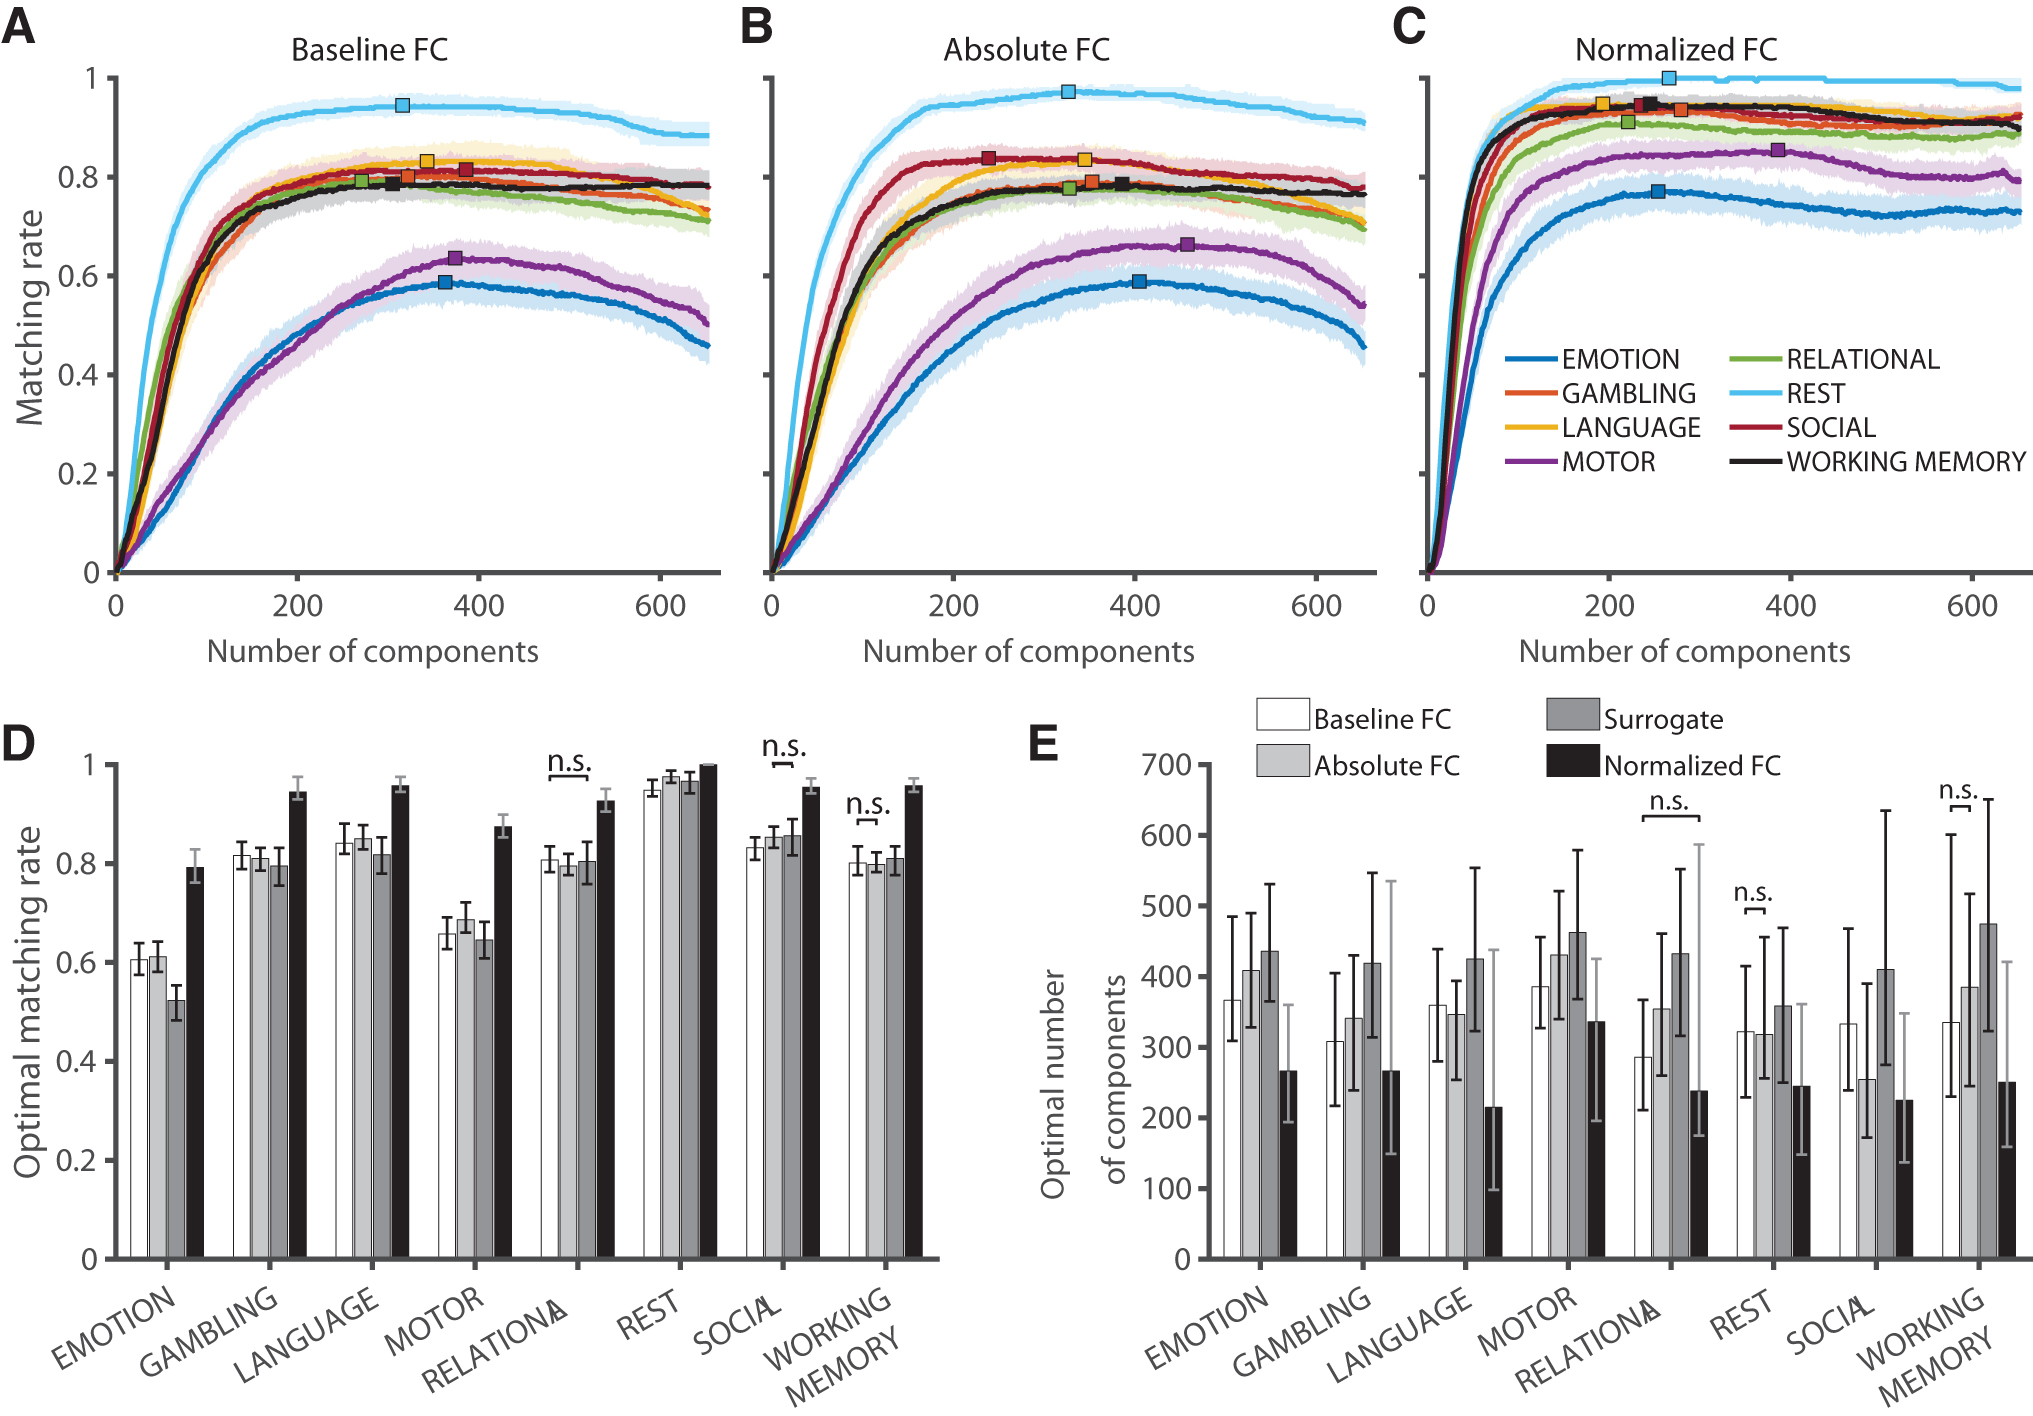
Impact of degree-normalization on matching rate.
Discussion
Extracting fingerprints from FCs is an important challenge for future individual-level studies of functional connectivity. This can be achieved through the decomposition of functional connectivity data into principal components to remove noisy components that deteriorate fingerprinting scores. Here, we showed that the degree-normalization of FCs improves the fingerprinting process, according to three different metrics: differential identifiability, identification rate, and matching rate. Moreover, the results indicate that the fingerprint of degree-normalized FCs is embedded in a lower dimensional space (and hence can be compressed) compared with baseline FCs.
Improved fingerprinting in a lower dimensional space
Throughout our results, we observed that normalizing FCs improves the three fingerprinting scores considered in this work (Figs. 2D, 6D and 7D), for all fMRI conditions. Importantly, this improvement was not driven by the participants' head motion (Supplementary Fig. S4). Instead, such normalization provides a modulation (or a balance) of the influence of different brain regions that enhance subject-level fingerprints. This is achieved by accounting for the weighted degree sequence in the FCs. The brain regions most affected by the degree-normalization, listed in Supplementary Tables S1 and S2, are the most strongly or weakly connected in each fMRI condition. The former are cortical hubs predominantly belonging to the visual and default mode networks, whereas the latter are mostly subcortical regions, consistently with previous reports (Buckner et al., 2009; Schaefer et al., 2014; Tomasi and Volkow, 2011). Moreover, the improved fingerprinting scores are achieved with fewer principal components than in the baseline and absolute cases (Figs. 2E, 6E and 7E). This suggests that the degree-normalization reduces the individuals' fingerprints to a first set of principal components (in descending order of explained variance). In addition, when looking at the cumulative percentage of explained variance of the principal components extracted from the data set (Supplementary Fig. S5), we observe a reduced dominance effect. In other words, the individual contribution of components to the explained variance is much more homogeneous. Together, these results indicate that the variance preserved by the components of normalized FCs, although lower, is highly specific to the contrast between individuals. From this perspective, degree-normalization could be beneficial for future FC fingerprinting research.
Surrogate degree-normalization improves differential identifiability, but not identification rate or matching rate
Figure 2 shows that differential identifiability is improved following degree-normalization for several conditions, no matter if the correspondence between FCs and their respective degree sequence is preserved (self-normalization) or not (surrogate-normalization). Normalizing FCs has a global effect of lowering the influence of hubs in the network (Crofts and Higham, 2009; Estrada et al., 2012; Rajapandian et al., 2020), which in turn allows better fingerprints to be extracted. This suggests that individual-specific components of functional connectivity might lie (in part) in sparsely connected areas whose contribution to the whole network is brought out by degree-normalization. The fact that surrogate degree-normalization sometimes improves differential identifiability compared with baseline indicates that the weighted degree sequence of FCs is similar across individuals. In Supplementary Figure S6, we show the results of the differential identifiability framework applied on degree sequences instead of functional connectivity matrices. We observe that the weighted degree sequence alone imparts a moderate fingerprinting power no matter the number of components kept for the reconstruction, which was previously reported (Rajapandian et al., 2020). However, matching FCs with their own degree sequence for degree-normalization appears to be beneficial to all metrics and all fMRI conditions, whereas surrogate-normalization has a null or negative effect on the identification rate and the matching rate, compared with baseline (Figs. 2D, 6D and 7D). This indicates that the normalization of FCs by their respective weighted degree sequence helps uncovering fingerprints and suggests a synergistic effect that goes beyond the fingerprints of original FCs and degree sequences separately.
Matching rate as a correction of identification rate
In this work, we observed that the identification rate metric, which has been used in several previous studies (Amico and Goñi, 2018; Finn et al., 2015), is sometimes driven down by a few individuals being highly similar to many others (Fig. 6C and Supplementary Fig. S3). Based on these results, it is noteworthy that the identification rate of an entire data set can be compromised by a few or even one subject or single session of an otherwise high-quality fingerprinting data set. Post hoc investigations on those particular FCs significantly dropping
Pros and cons of different fingerprinting metrics
As discussed in the Surrogate Degree-Normalization Improves Differential Identifiability, But Not Identification Rate or Matching Rate section, while surrogate degree-normalization increases
Limitations and future work
The present work has several limitations. First, we chose to keep for each condition the total number of fMRI volumes available in the database. Previous work reported that larger numbers of frames can positively impact fingerprinting metrics (Abbas et al., 2020b; Amico and Goñi, 2018). Here, as different scanning durations were used for each condition (Supplementary Table S3), our results should be interpreted in light of this limitation. Future work should investigate whether degree-normalization is beneficial to fingerprinting studies using short scanning durations. Additionally, the effect of degree-normalization during functional reconfiguration could be assessed in scanning sessions that combine resting periods and tasks (Amico et al., 2020).
Second, we conducted our experiments on a single data set and used a particular brain parcellation. To evaluate the variability of our results with respect to variations in the data set, we used sampling without replacement. Future work should reassess the impact of degree-normalization on external data sets, possibly obtained with different preprocessing pipelines (Parkes et al., 2018). We are confident that the results presented here are generalizable to other data sets and parcellations since the other fingerprinting frameworks have been shown to reproducible across fMRI conditions (Finn et al., 2015), robust across brain atlases (Amico and Goñi, 2018; Abbas et al., 2020a), and across scanning sites (Bari et al., 2019). Future work should include the assessment of this framework for studying brain injuries and neurological disorders.
Third, we identified an optimal set of principal components specific to each subsample, restricting the possibility of extracting the fingerprint of an unseen individual outside this sample with the same components. Further investigation is required to assess the possibility to derive a “universal” set of principal components (Sripada et al., 2019) on which one could project a new FC to directly obtain its fingerprint. Initial efforts in this direction have been performed by applying a leave-one-out strategy in multisite test–retest scenarios (Bari et al., 2019). A thorough investigation on this important topic would possibly require a significantly larger cohort and involve multisite, multi-scanner fMRI acquisitions.
Finally, in the construction of the identifiability matrix, we considered the statistical similarity between reconstructed FCs, operationalized by the entry-wise Pearson's correlation coefficient. In contrast, recent studies recommended considering the geometric similarity of FCs, leveraging the observation that signed FCs lie on the manifold of positive semidefinite matrices and are therefore associated with a geodesic distance (Abbas et al., 2020b; Venkatesh et al., 2020). However, we would like to note that taking functional connectivity in absolute value, as required by the degree-normalization, breaks the positive semi-definiteness of FCs and therefore proscribes the geometric approach. Besides, the degree-normalization procedure is parameterless, whereas the geometric approach involves a data set-dependent regularization parameter (Abbas et al., 2020b). Overall, we suggest that future work should consider statistical or geometric similarity depending on the context and application of the study.
Conclusion
Fingerprints extraction from FCs is an important step toward refined individual-level studies of brain connectivity, with potential applications in personalized medicine. In this report, we showed that the degree-normalization of FCs is a simple, parameterless mathematical operation producing significant improvements of the fingerprinting quality, according to three different metrics, in resting-state and several task conditions. Furthermore, we argued that the fingerprint of FCs can be compressed in a low-dimensional space, especially thanks to degree-normalization. We also show the potential benefits and pitfalls of three different fingerprinting metrics, where each of them uncovers different aspects of the fingerprint present in a sample of FCs. Overall, our results suggest that applying degree-normalization to FCs can be beneficial for future research focused on individual differences in brain networks.
Acknowledgments
B.C. is an FRIA (F.R.S.-FNRS) fellow. The authors would like to thank Jean-Charles Delvenne for his helpful comments and suggestions. Data were provided by the Human Connectome Project, WU-Minn Consortium (Principal Investigators: David Van Essen and Kamil Ugurbil; 1U54MH091657) funded by the 16 NIH Institutes and Centers that support the NIH Blueprint for Neuroscience Research and by the McDonnell Center for Systems Neuroscience at Washington University.
Authors' Contributions
All listed authors contributed to the presented article. Their respective contributions are: B.C.: conceptualization, formal analysis, methodology, validation, visualization, writing (original draft), and writing (review and editing). K.A.: data curation and preprocessing, conceptualization, methodology, validation, writing (original draft), and writing (review and editing). E.A.: conceptualization, methodology, and writing (review and editing). D.A.D.-T.: conceptualization, methodology, and writing (review and editing). F.C.: methodology, supervision, and writing (review and editing). J.G.: conceptualization, methodology, supervision, validation, writing (original draft), and writing (review and editing).
Footnotes
Author Disclosure Statement
No competing financial interests exist.
Funding Information
B.C. is an FRIA fellow (Grant No. 1.E051.18+F, Fonds pour la Formation à la Recherche dans l'Industrie et dans l'Agriculture, Fonds de la Recherche Scientifique, Belgium). E.A. acknowledges financial support from the SNSF Ambizione project “Fingerprinting the brain: network science to extract features of cognition, behavior and dysfunction” (Grant No. PZ00P2_185716). J.G. acknowledges financial support from NIH R01EB022574, NIH R01MH108467, Indiana Alcohol Research Center P60AA07611, and Purdue Discovery Park Data Science Award “Fingerprints of the Human Brain: A Data Science Perspective.”
Supplementary Material
Supplementary Figure S1
Supplementary Figure S2
Supplementary Figure S3
Supplementary Figure S4
Supplementary Figure S5
Supplementary Figure S6
Supplementary Figure S7
Supplementary Table S1
Supplementary Table S2
Supplementary Table S3
References
Supplementary Material
Please find the following supplemental material available below.
For Open Access articles published under a Creative Commons License, all supplemental material carries the same license as the article it is associated with.
For non-Open Access articles published, all supplemental material carries a non-exclusive license, and permission requests for re-use of supplemental material or any part of supplemental material shall be sent directly to the copyright owner as specified in the copyright notice associated with the article.