
Abstract
Background:
As resting-state functional connectivity (rsFC) research moves toward the study of individual differences, test–retest reliability is increasingly important to understand. Previous literature supports the test–retest reliability of rsFC derived with independent component analysis (ICA) and dual regression, yet the impact of dimensionality (i.e., the number of components to extract from group-ICA) remained obscure in the current context of large-scale data sets.
Methods:
To provide principled guidelines on this issue, ICA at dimensionalities varying from 25 to 350 was applied to the cortical surface with resting-state functional magnetic resonance imaging data from 1003 participants in the Human Connectome Project. The reliability of two rsFC measures, (within-component) coherence and (between-component) connectivity, was estimated.
Results:
Reliability and its change with dimensionality varied by network: the cognitive (frontoparietal, cingulo-opercular, dorsal attention, and default) networks were measured with the highest reliability, which improved with increased dimensionality until at least 150; the visual and somatomotor networks were measured with lower reliability, which benefited mildly from increased dimensionality; and the temporal pole/orbitofrontal cortex (TP/OFC) network was measured with the lowest reliability. Overall, ICA reliability was optimized at dimensionalities of 150 or above. Compared with two popular binary, nonoverlapping cortical atlases, ICA and dual regression resulted in higher reliability for the cognitive networks, lower reliability for the somatomotor network, and similar reliability for the visual and TP/OFC networks.
Discussion:
These findings highlight analytical decisions that maximize the reliability of rsFC measures and how they depend on one's networks of interest.
Impact statement
Independent component analysis (ICA) and dual regression is a popular approach to resting-state functional connectivity (rsFC) analysis. Yet there is little consensus around the optimal ICA dimensionality, i.e., how many brain components to extract from group-ICA. We proposed that rsFC test-retest reliability is an important criterion when choosing dimensionality. The present study compares rsFC reliability across various dimensionalities in the state-of-the-art Human Connectome Project data. We also compared reliability based on ICA versus two popular brain atlases. The findings are of interest to both researchers who study brain parcellation and those who use rsFC to examine brain-behavior relationship.
Introduction
Resting-state functional connectivity (rsFC) (Biswal et al., 1995) is a powerful tool for understanding brain functional organization. Recent interests in rsFC research evolve from making between-group comparisons into understanding within-group heterogeneity, such as individual differences in personality (Dubois et al., 2017), cognition (Dubois et al., 2018), and overall life adjustment (Smith et al., 2015). Evidence further indicates that an individual's entire rsFC information (referred to as the “connectome”) serves as a “fingerprint” that uniquely identifies the individual from a group (Finn et al., 2015). These findings support the potential of rsFC to unveil the neural foundation of individual differences and serve as biomarkers for diagnosis, prognosis, and symptom monitoring of neuropsychiatric disorders. One essential prerequisite for these applications is satisfactory neurometric—or measurement—properties of rsFC. The current project addresses the need for analytical guidelines for improving rsFC neurometrics.
Previous work establishes that rsFC reflects patterns of brain functional organization that are reproducible over time, across groups, and between task and resting states (Choe et al., 2015; Meindl et al., 2010; Wisner et al., 2013). To be used in individual differences research, rsFC measures additionally need to have adequate test–retest reliability. Unreliable measures lead to underestimation of effect sizes only when sample sizes are large, while overestimation is equally likely when sample sizes are small (Loken and Gelman, 2017). This can lead to even more bias as many rsFC studies involve a preselection process where only brain connections that bivariately correlate with the outcome of interest are entered into further analysis. Thus, maximizing test–retest reliability is crucial for powerful and reproducible rsFC research. In addition, knowledge about test–retest reliability is necessary for (1) validating the application of rsFC for single-subject inferences in clinical settings; (2) guiding advancement in image acquisition and processing techniques (Marchitelli et al., 2017); and (3) providing insights about state- versus trait-dependent neural mechanisms (Geerligs et al., 2015).
One crucial decision that presumably affects the test–retest reliability of rsFC is the method of dimension reduction, that is, the way to grouping brain voxels into functionally coherent parcels/networks/components for which rsFC is derived. One popular approach for this purpose is independent component analysis (ICA) (Beckmann and Filippini, 2009). In this data-driven approach, group-level spatial ICA groups brain voxels into components that are maximally spatially independent. This is typically followed by a two-step regression procedure (i.e., dual regression) that derives subject-specific time series and spatial maps corresponding to the components. RsFC measures can then be derived: (within-component) coherence represents the mean connectivity strength, or consistency of activities within the spatial map of a component; (between-component) connectivity reflects the temporal synchrony between the activities of two components. Accumulating evidence supports the validity of the ICA and dual regression approach (Biswal et al., 2010; Laird et al., 2011; Smith et al., 2009). Several studies concluded that the test–retest reliability of rsFC derived with ICA and dual regression was acceptable but varied widely across the brain (Choe et al., 2015; Mejia et al., 2016; Poppe et al., 2013; Shirer et al., 2015; Zuo et al., 2010).
Despite these early reports, recent key advancements in the field call for new investigations into rsFC reliability. First, large-scale neuroimaging data sets [e.g., the Human Connectome Project (HCP) (Van Essen et al., 2013), the International Neuroimaging Data-sharing Initiative (Mennes et al., 2013), and the Enhancing NeuroImaging Genetics through Meta-Analysis Consortium (Thompson et al., 2014)] have increased the size of resting-state functional magnetic resonance imaging (rsfMRI) data sets by at least 10 times through larger sample sizes, longer scan duration, and higher spatial and temporal resolution. These factors will likely improve the performance of ICA as well as other dimension reduction algorithms. Second, it is now considered vital for rsFC research to remove motion and physiological artifacts (Power et al., 2015), and several advanced denoising methods have only recently become available (Pruim et al., 2015; Salimi-Khorshidi et al., 2014).
In this context, recent studies have characterized rsFC reliability in large-scale rsfMRI data sets (Dubois et al., 2017; Mejia et al., 2016; Noble et al., 2017; Zhang et al., 2018). However, to date no study has focused on the impact of ICA dimensionality on reliability. ICA dimensionality is the number of independent components to extract from group-ICA and affects the spatial, functional, and neurometric properties of the resulting components (Abou-Elseoud et al., 2010, 2011; Beckmann and Smith, 2004; Poppe et al., 2013; Ray et al., 2013). Low dimensionalities may result in large heterogeneous components, while high dimensionalities may lead to separation of functionally distinct networks and also an abundance of artifactual components, especially when data are few and of poor quality (Beckmann and Smith, 2004; Särelä and Vigário, 2003). Previous ICA studies have recommended a lower dimensionality of around 20 and a higher dimensionality of around 70 based on functional interpretability of components, whereas dimensionalities above 150 were discouraged (Abou-Elseoud et al., 2010; Ray et al., 2013). However, algorithms other than ICA indicate that more than 300 components may be meaningfully derived (Glasser et al., 2016; Gordon et al., 2014). While Mejia and colleagues (2016) reported rsFC reliability at various dimensionalities in a subsample of the HCP, the interaction between dimensionality and brain region was not taken into account, and the dimensionalities tested were sparse.
To provide guidelines for the field regarding dimensionality decisions, we used a large rsfMRI data set to examine the test–retest reliability of two rsFC measures, coherence and connectivity, when decomposing the cortical surface with ICA. Our aims were twofold: (1) examine the impact of ICA dimensionality (varying from 25 to 350) as well as other analytical decisions on the reliability of rsFC; and (2) compare the reliability derived with ICA and dual regression with two existing binary, nonoverlapping cortical atlases, including a 333-region atlas derived with rsFC-boundary (Gordon et al., 2014) and a 360-region atlas derived with multimodal parcellation (Glasser et al., 2016).
Materials and Methods
Image acquisition and preprocessing
RsfMRI data were from the 1200 Subjects Data Release of the WashU–UMinn HCP. One thousand three participants from 429 families completed rsfMRI scans [age = 28.7 ± 3.7 years, range = 22–37 years, 53% female, mean relative root mean square movement (relative RMS) (Jenkinson et al., 2002) = 0.088 ± 0.037 mm]. This study was approved by the University of Minnesota Institutional Review Board (1605S87421).
Image acquisition procedure and parameters are detailed in Van Essen and colleagues (2013). Briefly, participants completed two scan sessions (REST1 and REST2), typically over two consecutive days. Each session included two 15-min rsfMRI runs (TR = 0.72 sec, voxel size = 2.0 mm isotropic) with opposite phase encoding directions (left-to-right [LR] and right-to-left [RL]). This resulted in four rsfMRI runs for each participant (REST1_LR, REST1_RL, REST2_LR, and REST2_RL).
“Resting State Denoised” data were downloaded from ConnectomeDB. Images were preprocessed with the HCP preprocessing pipeline v3.4.0, which included minimal preprocessing as detailed in Glasser and colleagues (2013), followed by high-pass filtering (FWHM = 2355 sec) and removal of artifacts and 24 motion parameters with FMRIB's ICA-based Xnoiseifier (FIX) (Griffanti et al., 2014) as detailed in Smith and colleagues (2013). The images were registered to the standard CIFTI grayordinate space using an areal-feature-based Multimodal Surface Matching algorithm (“MSMAll”) (Glasser et al., 2016; Robinson et al., 2014) and spatially smoothed at 2 mm FWHM with pipeline v3.13.2.
ICA and component categorization
Similar to previous studies (Schaefer et al., 2018; Yeo et al., 2014), we restricted the parcellation to the cerebral cortex due to low signal-to-noise ratio in the subcortical regions [see the supplementary methods of Glasser and colleagues (2016) for an example of subcortical oversplitting at high dimensionalities when these regions were included in group-ICA].
Participants' CIFTI data in the cerebral cortex were temporally demeaned, variance normalized, concatenated, and reduced to the top 4500 weighted spatial eigenvectors through MELODICs Incremental Group-PCA (Smith et al., 2014), resulting in a 59,412 grayordinates × 4500 eigenvector matrix. Group-ICA of the cerebral cortex was performed by feeding the principal component analysis (PCA)-reduced data to the Infomax algorithm in FSL's MELODIC (Beckmann and Smith, 2004). ICA dimensionality was set at 25, 50, 100, 150, 200, 250, 300, or 350.
We categorized the resulting components with the seven canonical resting-state networks in Yeo and colleagues (2011). We first parcellated the brain into nonoverlapping components through which each grayordinate was assigned to the component that had the largest value for that grayordinate among all component maps. We then characterized association indices (Dice, 1945), where the association index of a canonical network with a component was defined as the proportion of grayordinates in the component that overlapped with the canonical network. A component was classified under one of the following canonical networks with which it had the largest association index: (1) frontoparietal, (2) cingulo-opercular, (3) dorsal attention, (4) default, (5) visual, (6) somatomotor, and (7) temporal pole/orbitofrontal cortex (TP/OFC).
Coherence and connectivity
To estimate subject- and run-specific coherence and connectivity at each ICA dimensionality, we first used dual regression (Beckmann and Filippini, 2009) on individual rsfMRI data in each run to derive time series and spatial maps corresponding to the group-level components. Variance normalized time series were used in stage 2 of dual regression to derive spatial maps with both shape and amplitude information (Nickerson et al., 2017).
Coherence
For each component, we characterized coherence by first creating a binary mask with the group-level component map. Specifically, we normalized the group-level component z statistic map by its maximum z value so that the maximum of the normalized map was 1. We then binarized the normalized map after applying a normalized threshold varying from 0.1 to 0.9, in steps of 0.1. According to prior work, this procedure has similar effects to thresholding according to the connectivity of each grayordinate with the peak grayordinate of the component (Poppe et al., 2013). We then applied this mask to the individual spatial map and computed the mean within the mask as coherence. For each normalized threshold, this resulted in a d components × 1003 subjects × 4 runs array of coherence values (Supplementary Fig. S1a, d: dimensionality). Of note, our coherence metric differs from that in electroencephalogram and magneto encephalogram research, where coherence represents the synchronicity of signals in the frequency domain (Thatcher et al., 1986). Previous work supports the reliability of coherence by our definition with links to individual differences (Abram et al., 2015; Blain et al., 2020; Poppe et al., 2013).
Connectivity
For each pair of components, we characterized connectivity as the correlation between their time series. Three correlation methods in the FSLNets toolbox were used, including (1) full (i.e., Pearson's) correlation; (2) partial correlation with L1 regularization; and (3) partial correlation with L2 regularization. Partial correlation is thought to reflect the direct connectivity between two components independent from the contribution of other components and has been shown to successfully detect true connections in simulated and real neural networks (Marrelec et al., 2006; Smith et al., 2011). We set the tuning parameters for L1 (λ = 100) and L2 (ρ = 0.01) regularization to be consistent with the HCP's parcellations+time series+netmats release. For each correlation method, this resulted in a d components × d components × 1003 subjects × 4 runs array of connectivity values (Supplementary Fig. S1b). Connectivity values were then transformed with Fisher's z transformation.
The Gordon and Glasser atlases
While components derived with ICA are unthresholded and overlap, regions in the Gordon and Glasser atlases are binary and do not overlap. Thus, the procedure of characterizing coherence and connectivity for these two atlases differed from that described above. Coherence for a Gordon or Glasser region was defined as the average (Fisher's z transformed) Pearson's correlation of the time series of grayordinates within the region with its mean time series. Connectivity between two regions was defined as the (full, L1 regularized, or L2 regularized) correlation between their mean time series. Despite the disparity between the definitions of coherence and connectivity for ICA and dual regression versus the Gordon and Glasser parcellations, we believe that each reflects the modal of how rsFC measures are derived for the respective approaches in the literature, which makes their comparison reasonable and meaningful. Reliability when forcing ICA spatial maps to be binary or nonoverlapping is shown in Supplementary Figures S9–S12.
Reliability
We evaluated the test–retest reliability of rsFC with intraclass correlation coefficients (ICCs), type “A-1” as defined in McGraw and Wong (1996). For any rsFC measure of interest, the observed rsFC
where
We calculated ICCs with the MATLAB script ICC.m developed by Salarian (2016). Although ICCs in theory are never negative, ICC estimates can take negative values when
We derived within-session reliability as the mean of ICCs between any pair of 15-min runs within the same session (i.e., REST1_LR vs. REST1_RL, and REST2_LR vs. REST2_RL) and between-session reliability as the mean of ICCs between any pair of 15-min runs between sessions (i.e., REST1_LR vs. REST2_LR, REST1_RL vs. REST2_RL, REST1_RL vs. REST2_LR, and REST1_LR vs. REST2_RL). We interpret ICCs according to the following rule of thumb: ICCs less than 0.4 indicate “poor” reliability; ICCs between 0.4 and 0.6 indicate “fair” reliability; ICCs between 0.6 and 0.8 indicate “good” reliability; and ICCs larger than 0.8 indicate “excellent” reliability (Cicchetti and Sparrow, 1981).
Potential motion confounds
Head motion is known to confound rsFC measures (Power et al., 2015). In the current study, motion denoising strategies include ICA-FIX artifact removal and 24 motion parameter regression. To further rule out motion confounds in reliability estimates, we regressed mean relative RMS in each run out of rsFC measures and recalculated ICCs.
Results
ICA-based cortical parcellations across dimensionalities are shown in Figure 1 alongside the Gordon and Glasser atlases. Increasing dimensionality resulted in finer parcellation of all canonical networks, particularly the default network.
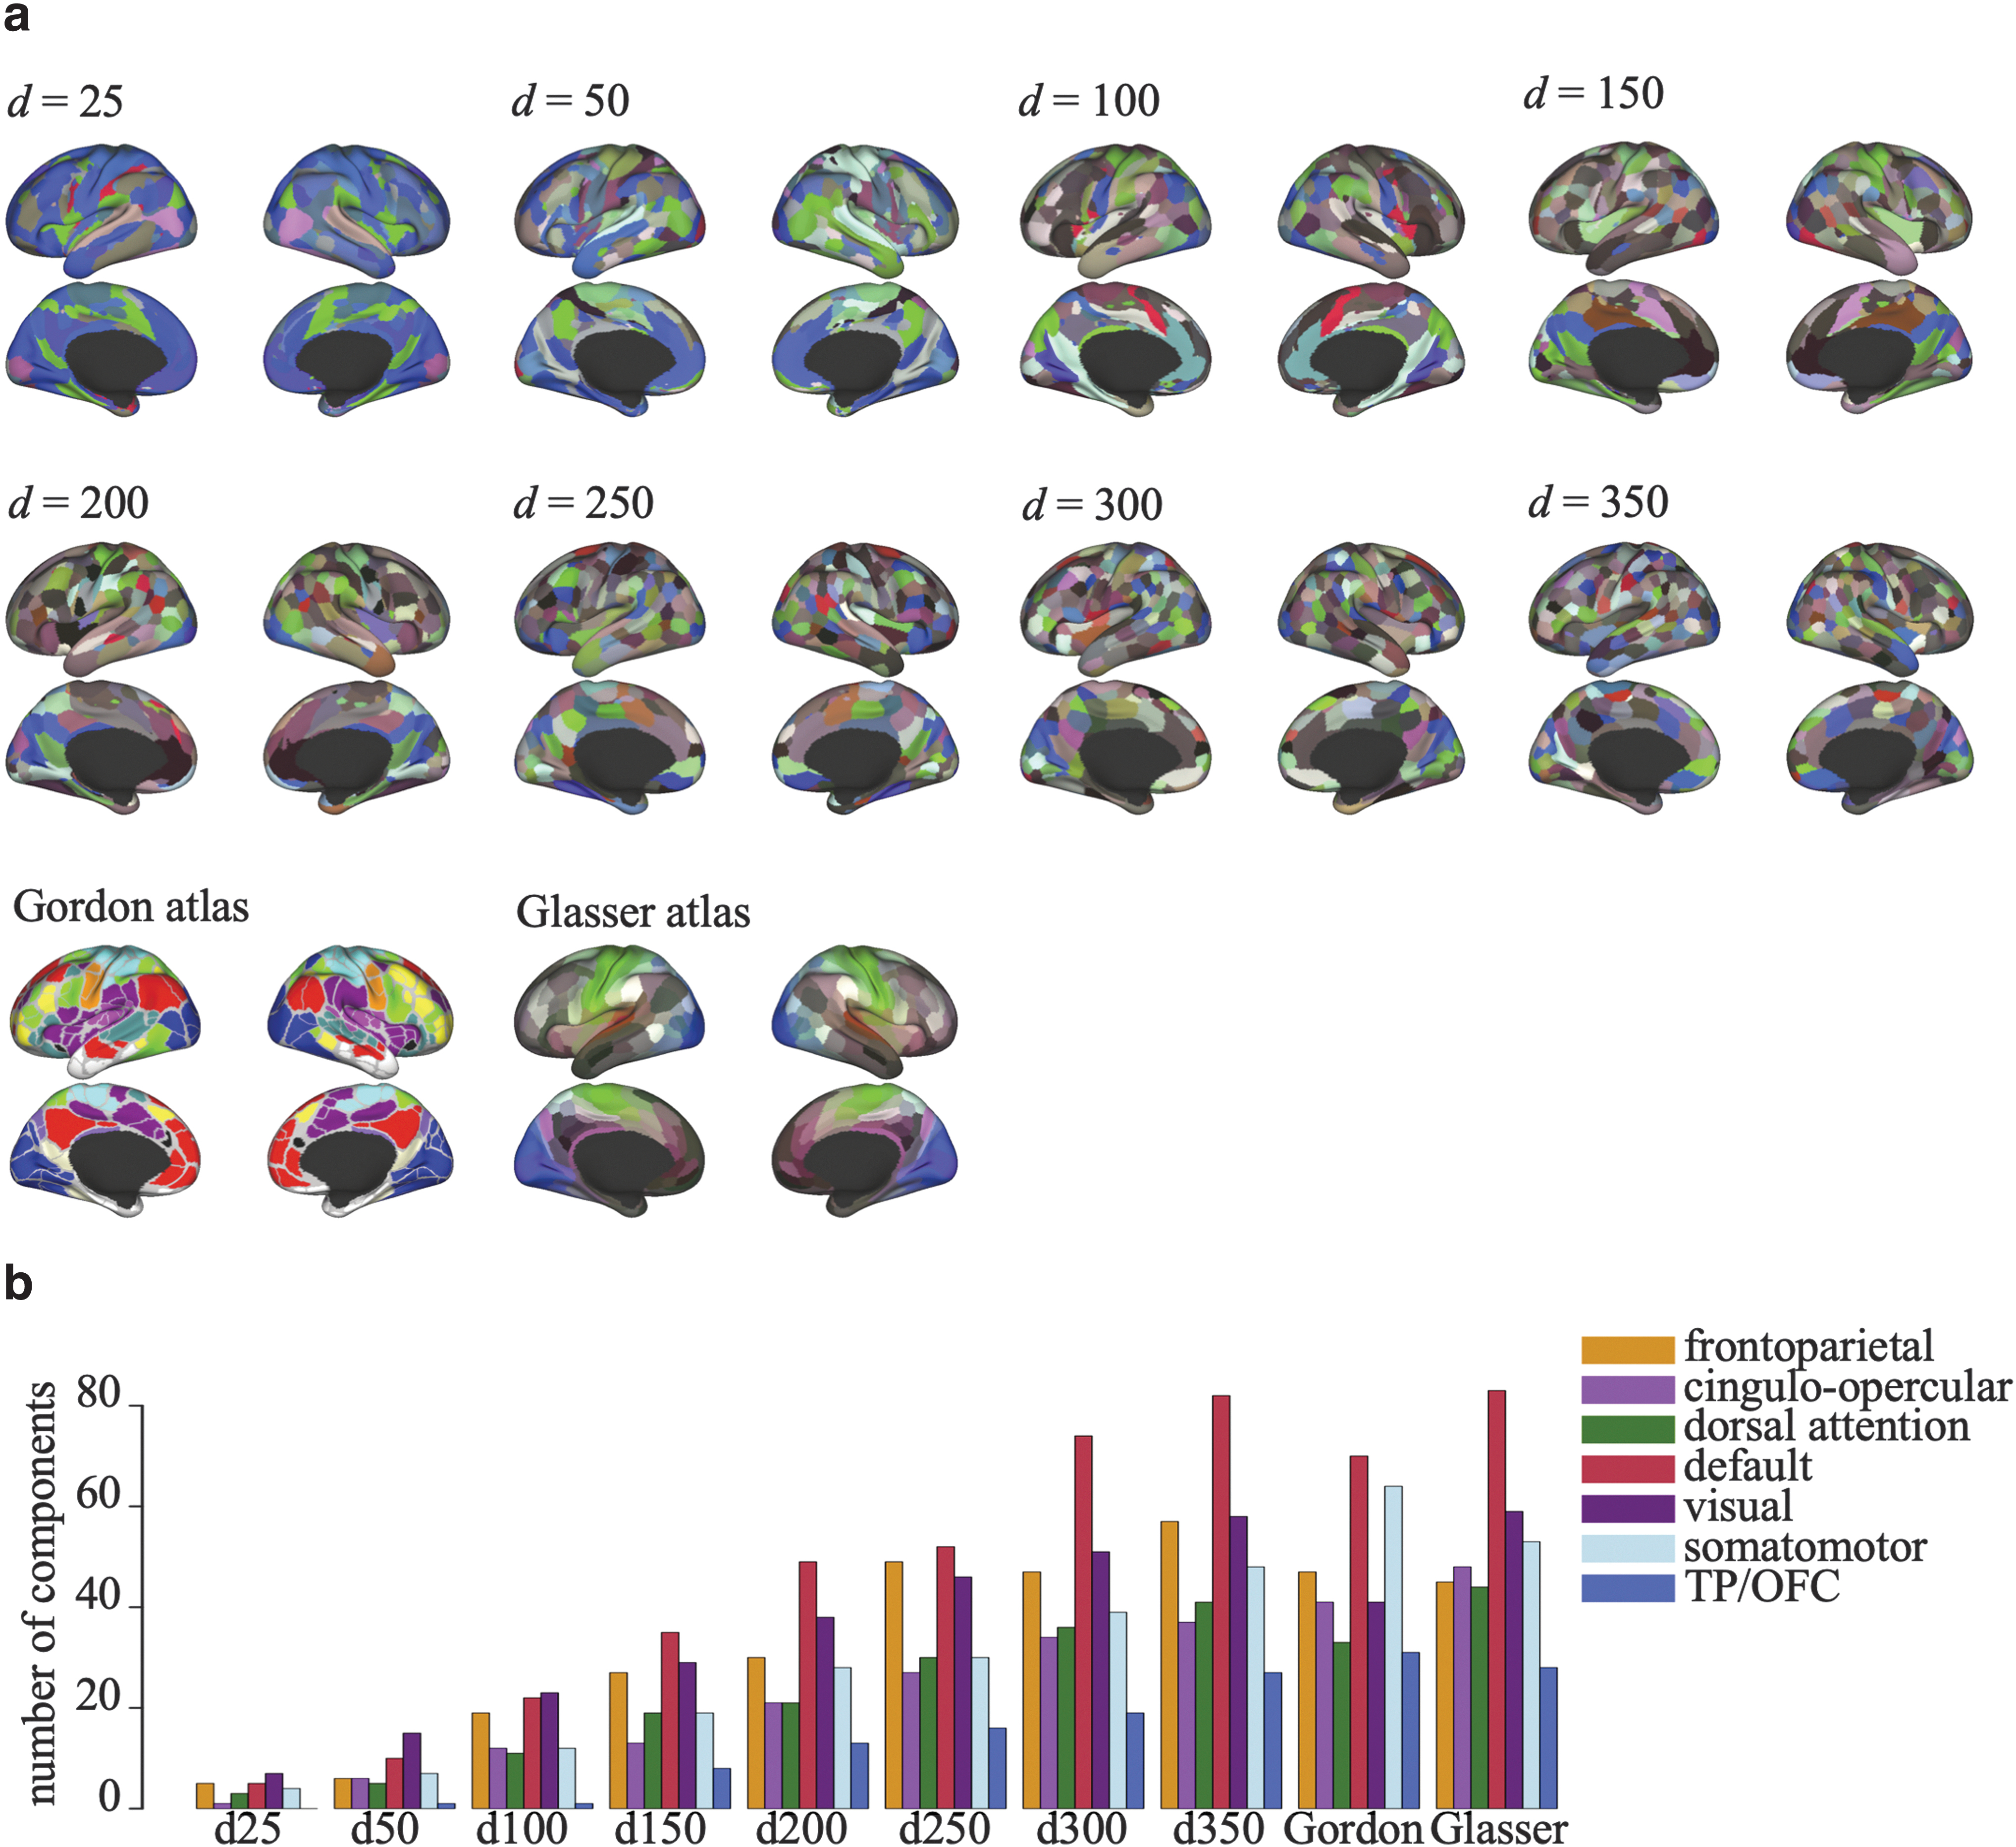
Cortical parcellations.
Coherence reliability
The distributions of coherence reliability improved with higher normalized thresholds (Supplementary Fig. S2). Below we report coherence reliability when normalized threshold was 0.5, balancing gain in reliability and inclusiveness of component maps. We also report between-session reliability unless otherwise specified as it generalizes to most research designs. Reliability estimates were not systematically biased by image reconstruction version (Supplementary Fig. S3a) or family structure in the sample (Supplementary Fig. S4a).
Coherence reliability within each canonical network was summarized in Figure 2. In the following discussion, we compare parcellations based on descriptive statistics. Formal statistical testing was not performed for two reasons: (1) ICCs derived from parcellations that include the same grayordinates are neither fully independent nor paired, violating the assumptions of most parametric and nonparametric tests; and (2) significant test results do not speak to differences between distributions in spread and shape. Neither do they indicate that differences are of practical significance.
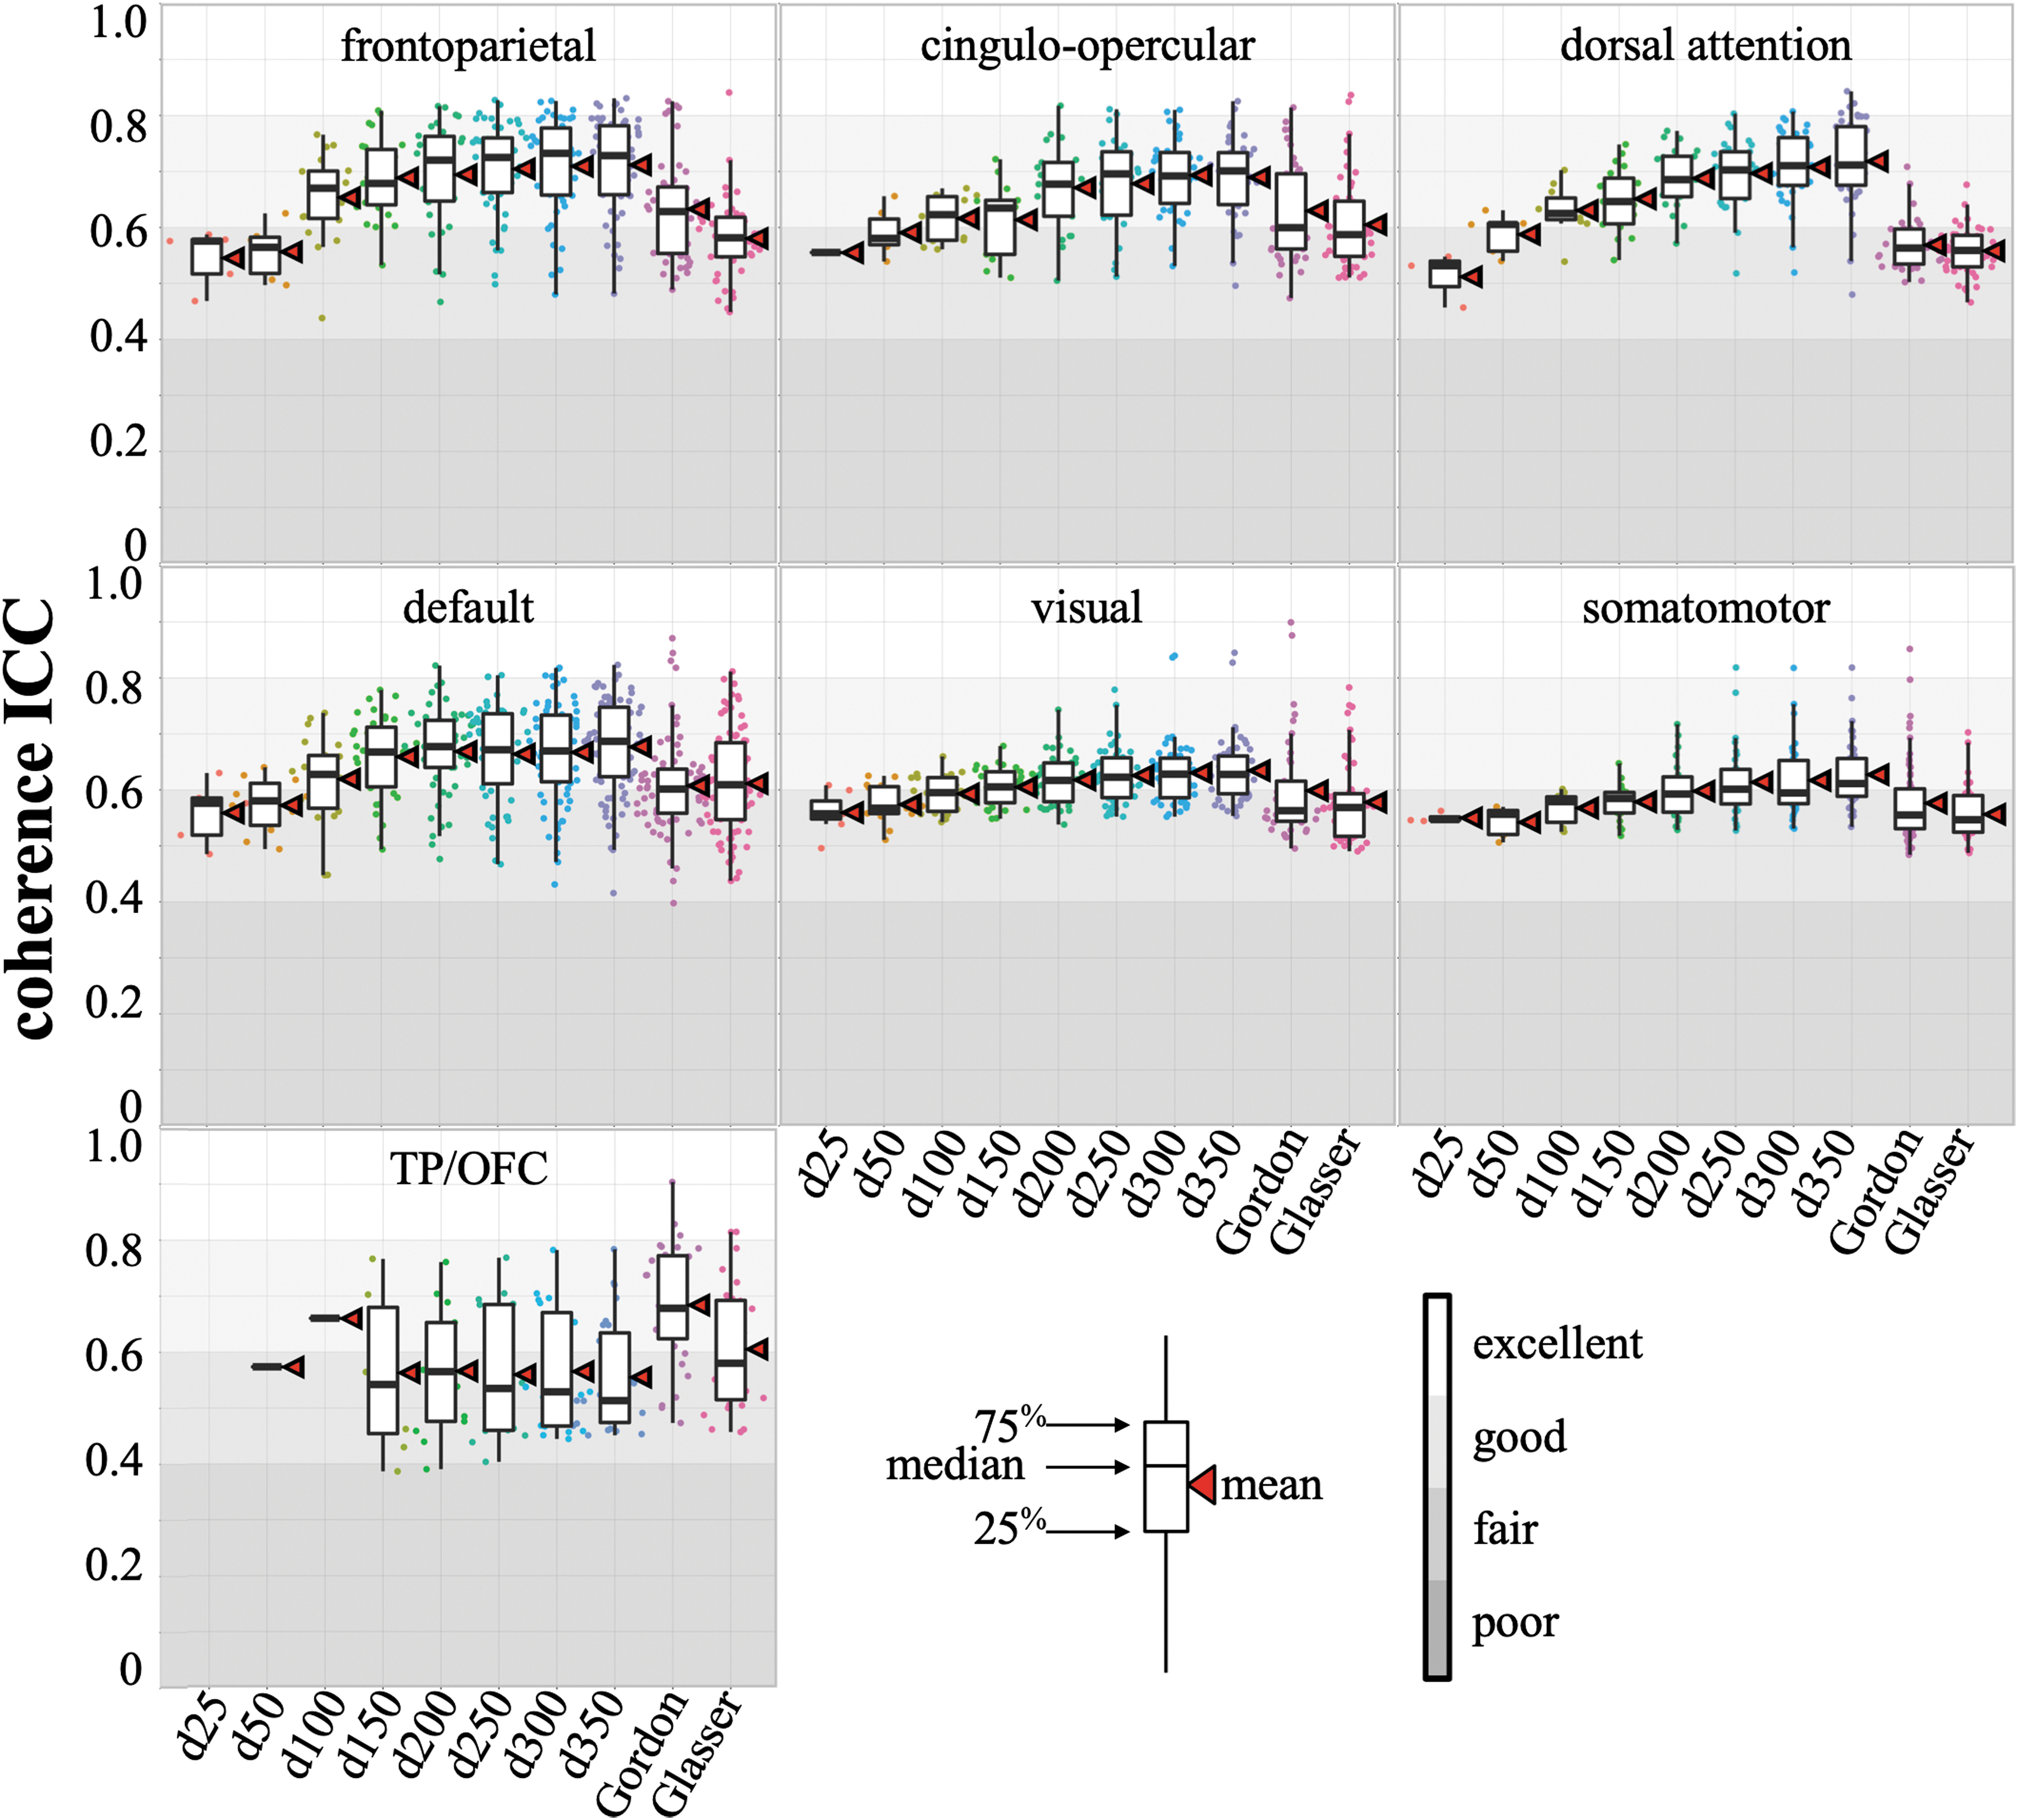
Coherence reliability within canonical cortical networks. Each point in the sina plots (Sidiropoulos et al., 2018) corresponds to one network. Points are jittered across the x-axis to form the shapes of the density distributions. Boxplot outliers are more than 1.5 interquartile range above the 75th or below the 25th percentile. See main text for important differences in coherence definition for ICA and dual regression versus the Gordon and Glasser atlases. Shown here: between-session reliability of 15-min runs, normalized threshold = 0.5. ICC, intraclass correlation coefficient.
Reliability in the frontoparietal, cingulo-opercular, dorsal attention, and default networks ranged from “fair” to “excellent,” with most ICCs falling into the “good” range. In these cognitive networks, reliability improved considerably with increased dimensionality until plateauing at 150 or 200. Overall, ICA and dual regression resulted in higher reliability than the Gordon and Glasser atlases.
Reliability in the visual and somatomotor networks ranged mostly from “fair” to “good” and reached “excellent” in rare cases. Reliability improved mildly with increased dimensionality, although nearly negligible after dimensionality reached 250. Overall, ICA and dual regression resulted in slightly higher reliability than the Gordon and Glasser atlases.
Reliability in the TP/OFC was highest in the Gordon atlas, which was mostly “fair” and “good.” ICA reliability showed little change with increased dimensionality (except for higher reliability when dimensionality was 100) and was lower than the Gordon and Glasser atlases overall.
Connectivity reliability
Full correlation resulted in the best overall connectivity reliability among the three correlation methods (Supplementary Fig. S5a). Connectivity derived with partial correlation was highly restricted in range and was only more reliable than full correlation for a small portion of connections with nearly zero “effective connectivity” (Supplementary Fig. S5b). Thus, below we report between-session reliability of full correlation connectivity. Reliability estimates were not systematically biased by image reconstruction version (Supplementary Fig. S3b) or family structure in the sample (Supplementary Fig. S4b).
Connectivity reliability of connections within each canonical network is summarized in Figure 3. Connectivity reliability of connections between two canonical networks is summarized in Supplementary Figure S6. We used the same rationale for interpretation as explained for coherence reliability.

Connectivity reliability within canonical cortical networks. Reliability of connections within the same canonical network is shown. For connections between two canonical networks, see Supplementary Figure S6. Each point in the sina plots (Sidiropoulos et al., 2018) corresponds to one connection. Points are jittered across the x-axis to form the shapes of the density distributions. Boxplot outliers are more than 1.5 interquartile range above the 75th or below the 25th percentile. See main text for important differences in connectivity definition for ICA and dual regression versus the Gordon and Glasser atlases. Shown here: between-session reliability of 15-min runs, correlation method = full correlation.
Reliability in the frontoparietal and default networks ranged from “poor” to “excellent,” with most ICCs categorized as “fair” and “good.” Reliability improved considerably as dimensionality increased from 50 to 100 and 100 to 150 and plateaued afterward. ICA and dual regression offered better reliability than the Gordon and Glaser atlases.
Reliability in the cingulo-opercular and dorsal attention networks ranged from “poor” to “good,” with most ICCs falling into the “fair” range. Reliability improved somewhat as dimensionality increased until 200 and plateaued. ICA and dual regression and the Gordon and Glasser atlases offered comparable mean reliability. In particular for the cingulo-opercular network, ICA reliability had a wider spread with more “poor” as well as “good” connections.
Reliability in the visual network ranged from “poor” to “good” and was mostly “fair.” Increases in dimensionality led to noticeable increases in the range of reliability distributions, while changes in central tendency were minimal. Overall, the Glasser atlas offered the best reliability in this network by a narrow margin.
Reliability in the somatomotor network was highest in the Gordon and Glasser atlases, where most ICCs were “fair.” ICA reliability changed minimally with dimensionality and at least half of the ICCs were “poor.”
TP/OFC was the only network with mostly “poor” reliability irrespective of parcellation method.
Reliability and population mean and standard deviation
Based on previous findings that suggest higher reliability in statistically nonzero connections (Shehzad et al., 2009), we examined the relationship between reliability and the population mean and standard deviation of rsFC to test the possibility that reliability can be readily predicted from such descriptive information. We computed the population standard deviation as the standard deviation of average subject rsFC over four runs.
For coherence, the population mean and standard deviation were weakly and mostly nonsignificantly correlated with reliability, except for a correlation of 0.61 between the population mean and reliability for ICA at a dimensionality of 25 and a correlation of 0.40 at a dimensionality 50 (Table 1 and Fig. 4a, b).
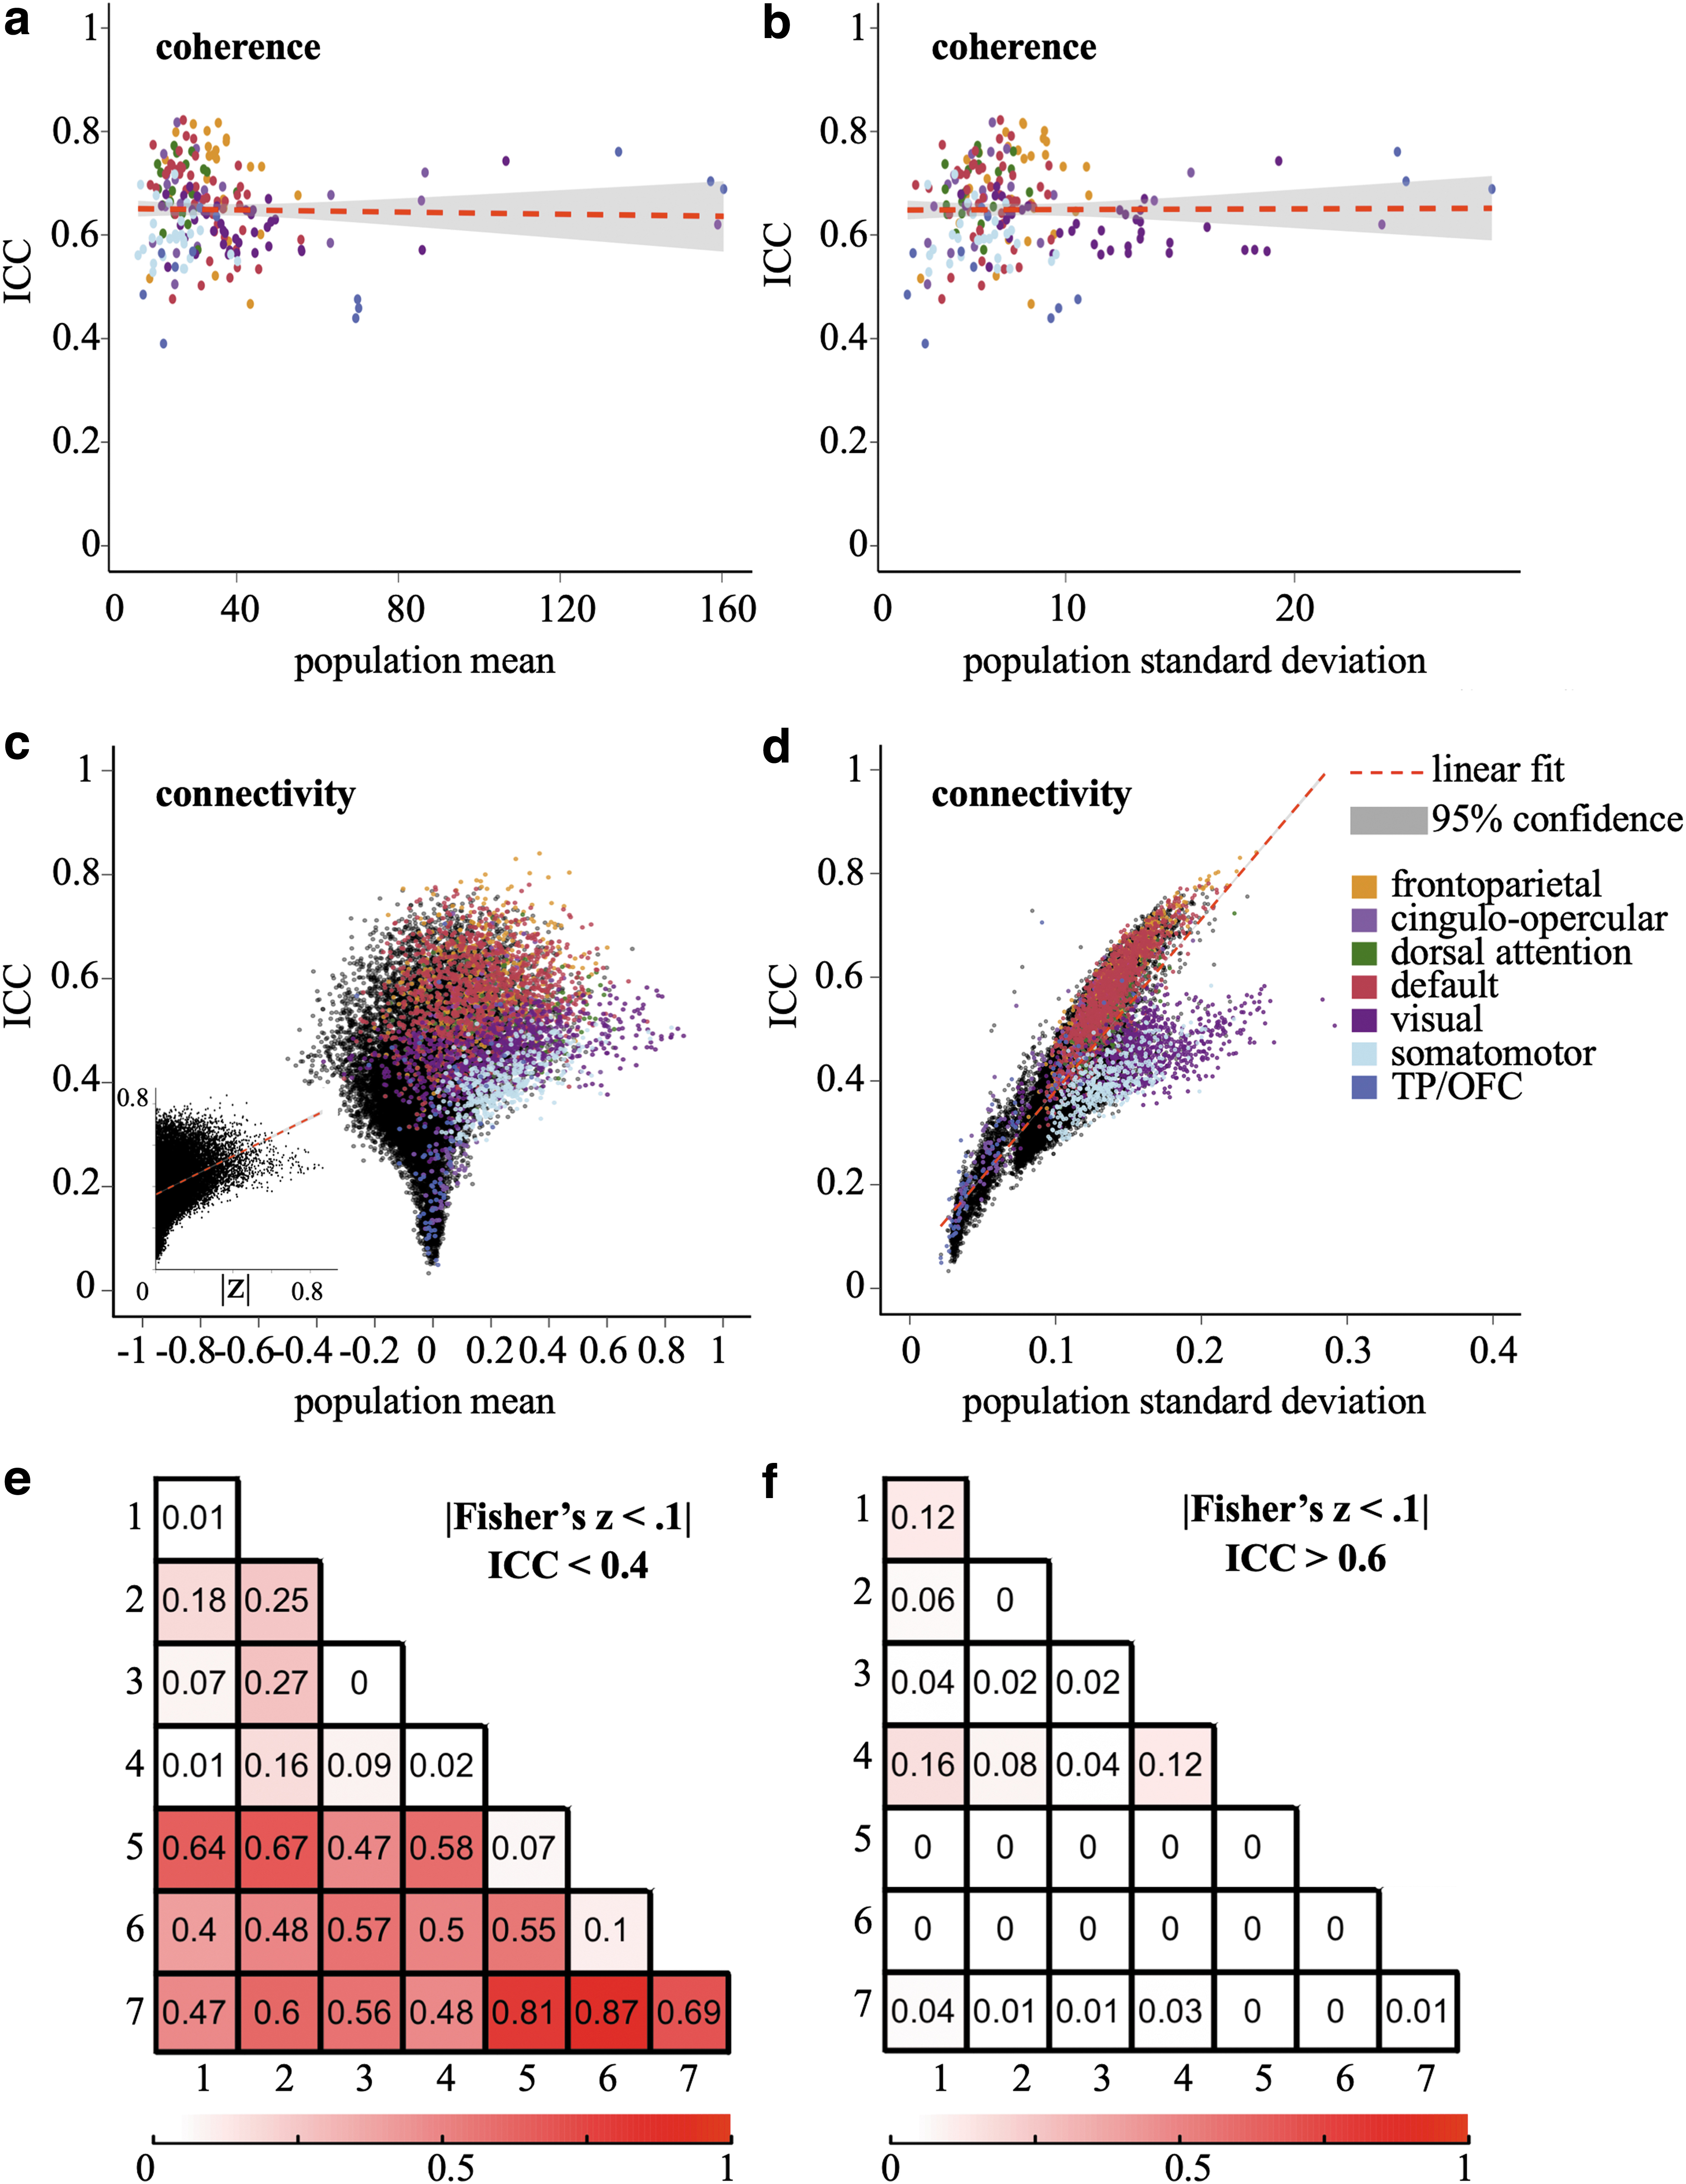
Reliability and population mean and standard deviation.
Correlation Between Resting-State Functional Connectivity Reliability and Population Mean and Standard Deviation
For coherence, correlation was computed across all components/regions. For connectivity, correlation was computed across all connections. Shown here: between-session reliability of 15-min runs, normalized threshold for coherence = 0.5, correlation method for connectivity = full correlation.
p < 0.05; ** p < 0.01; *** p < 0.001. All p values were Bonferroni adjusted for 10 comparisons.
d, dimensionality.
For connectivity, reliability was highly positively correlated with population standard deviation for all parcellations (Table 1 and Fig. 4d). The relationship between reliability and population mean for ICA parcellations resembled a “funnel” shape (Fig. 4c): while reliability tended to be higher as connections became stronger (positive or negative), reliability of weak connections ranged from “poor” to almost “excellent.” Connections that were weak on the population level (defined heuristically as |Fisher's z transformed full correlation| < 0.1, or roughly less than 1% shared variance) and measured with “poor” reliability arguably reflected a lack of functional relationship between components (Fig. 4e). These included connections with the TP/OFC, connections of the visual and somatomotor networks with the cognitive networks, and connections between the visual and somatomotor networks. On the contrary, a number of connections within the cognitive networks were weak on the population level yet measured with at least “good” reliability (Fig. 4f). As high reliability indicated high interindividual variability (Fig. 4d), these connections were characterized by considerable heterogeneity within the population, so that they may be positive, negative, or zero for different individuals and reliably measured. This finding calls into question a common practice of only analyzing statistically significant connections. When dimensionality was 200, 40.2% of the connections with “good” reliability and above were not statistically significant at a significance level of 0.05 (uncorrected).
Reliability loss from within- to between-session
To isolate the effect of within- to between-session and effect of phase encoding direction, here we estimated between-session reliability only from runs with opposite phase encoding directions (i.e., the mean of REST1_LR vs. REST2_RL and REST1_RL vs. REST2_LR). When ICA dimensionality was 200 (Supplementary Fig. S7), loss in coherence reliability ranged from 0 to 0.16 (mean = 0.07, standard deviation = 0.03); and loss in connectivity reliability ranged from −0.09 to 0.16 (mean = 0.05, standard deviation = 0.03). Patterns were similar at other dimensionalities as well as for the Gordon and Glasser atlases.
Reliability when controlling for motion
As is shown in Supplementary Figure S8a and b, some coherence and connectivity estimates remained correlated with mean relative RMS despite motion denoising strategies. This is expected, and likely reflects widespread artifacts in the BOLD signal due to respiration accompanying motion (Power et al., 2018). When controlling for mean relative RMS, coherence reliability changed minimally for most components yet increased by almost 0.2 for a small number of components (Supplementary Fig. S8c, e). Visual inspection indicated that the components with more pronounced increase in coherence reliability fell in the prefrontal, TP, and temporal parietal junction regions across dimensionalities. On the contrary, changes in connectivity reliability were mostly negligible (Supplementary Fig. S8d, f).
Discussion
To establish principled guidelines for the field, we examined the test–retest reliability of two rsFC measures on the cortical surface derived with ICA and dual regression and compared it with two existing binary, nonoverlapping cortical atlases. Canonical networks differed in their level of reliability. ICA dimensionality affected reliability and such effects varied by network. Canonical networks differed in whether they were more reliably measured with ICA and dual regression or the Gordon and Glasser atlases. For connectivity, but not coherence, reliability could be predicted by population standard deviation estimated from a single run. Contrary to hypotheses, neither connection strength nor statistical significance was a good predictor of connectivity reliability. By using a large rsfMRI data set and state-of-the-art image processing methods, this study updates previous knowledge on rsFC reliability derived with ICA and dual regression.
Canonical networks varied in reliability
Consistent with previous studies (Mejia et al., 2016; Mueller et al., 2013, 2015; Shah et al., 2016; Somandepalli et al., 2015; Zuo and Xing, 2014; Zuo et al., 2010), we found varied reliability across canonical networks. The cognitive networks, especially the frontoparietal and default networks, were measured with the highest reliability, averaging at “good” for coherence and “fair” to “good” for connectivity. The visual and somatomotor networks were measured with intermediate reliability, ranging from “fair” to “good” for coherence and mostly “fair” for connectivity. The TP/OFC network tended to be the least reliably measured: coherence reliability was typically “fair” to “good” and connectivity reliability was mostly “poor.” Notably, many components in the TP/OFC did not show meaningful connections within or outside of this network (Fig. 4e).
The neurometric advantage of the cognitive networks was not restricted to a specific rsFC approach (Mueller et al., 2015; Shah et al., 2016; Somandepalli et al., 2015; Zuo and Xing, 2014). High reliability is a combination of high interindividual variability and low intraindividual variability. Compared with other networks, connections in the cognitive networks had higher population variance (Fig. 4d) and less loss in reliability from within- to between-session (Supplementary Fig. S7b), which may reflect abundant individual difference information and less day-to-day variability. On the contrary, relatively lower reliability in the visual and somatomotor networks was mainly a result of higher intraindividual variability (Supplementary Fig. S7), consistent with a previous report (Laumann et al., 2015). Lastly, poor connectivity reliability in the TP/OFC likely reflects susceptibility artifacts in this region. Fine parcellation in this network is particularly challenging, and ICA and other algorithms alike resulted in components that did not show meaningful engagement in the brain's functional organization, although spatially reliable.
ICA dimensionality had different effects on reliability across canonical networks
Canonical networks responded differently to increases in ICA dimensionality. The cognitive networks benefited from increased dimensionality until at least 150, while reliability gain for the visual, somatomotor, and TP/OFC networks was small. An ICA dimensionality of 150 or above appeared to maximize rsFC reliability in the cortical surface.
That a finer parcellation can be as reliable as or more reliably measured than its coarse counterpart is encouraging and may reflect the advantage of the current large data set. Indeed, the optimal dimensionality in the current data set surpasses that recommended in previous studies (Abou-Elseoud et al., 2010; Ray et al., 2013). Future studies are needed to verify the validity of these high-dimension parcellations, especially their utility in investigating brain/behavior relationships.
Comparing ICA and dual regression with the Gordon and Glasser atlases
ICA and dual regression and the Gordon and Glasser atlases showed different strengths in measuring canonical networks. ICA and dual regression at a dimensionality of at least 150 typically led to higher reliability in the cognitive networks. The Gordon and Glasser atlases led to higher connectivity reliability in the somatomotor network. Performance was on par for the visual network and equally poor for the TP/OFC.
One apparent source of the differences described above is the differences in how coherence and connectivity were calculated for ICA and dual regression versus the binary, nonoverlapping Gordon and Glasser atlases. To examine this further, we performed new analyses where we forced the ICA spatial maps into (1) binary, overlapping components, with a normalized threshold of 0.5; and (2) binary, nonoverlapping components, by assigning each grayordinate to the component with the largest value for that grayordinate (i.e., Fig. 1a). Coherence and connectivity of these binary components were then computed in identical ways with the Gordon and Glasser atlases and reliability comparisons are shown in Supplementary Figures S9–S12. Briefly, (1) and (2) had similar reliability patterns that deviated from ICA and dual regression. For coherence, ICA reliability did not increase with dimensionality nor did it surpass the Gordon and Glasser atlases. For connectivity, ICA reliability in the cognitive networks increased with dimensionality with less steep slopes and outperformed the Gordon and Glasser atlases in the frontoparietal and default networks by a smaller margin. Interestingly, ICA reliability in the somatomotor network actually improved and was on par with the Gordon and Glasser atlases.
Taken together, dual regression on nonbinary, overlapping ICA spatial maps contributed to the superiority of ICA-derived reliability to the Gordon and Glasser atlases. Presumably, using dual regression allowed for individualized mapping of group-level components, resulting in more reliable measures. Consistent with this interpretation, this effect was more obvious at high dimensionalities, where misalignment of components is more consequential. In addition, using nonbinary components likely improved reliability by allowing the weighted sum of rsFC information, and this benefit is most noticeable for coherence. On the contrary, the similarity between the reliability of (1) and (2) suggests that reliability was not greatly altered by allowing components to overlap. Notably, Glasser and colleagues (2016) created a classifier that allows customized parcellation of an individual brain according to the Glasser atlas. While such customization may improve reliability, this classifier has not been publicly available at the time of this project.
Predicting reliability from population mean and standard deviation
For coherence, population mean and standard deviation had limited utility for predicting reliability. For connectivity, reliability was highly positively correlated with population standard deviation. Thus, the potential of a connection to be reliably measured depended largely on how variable it was across the population. Previous research also suggested that the reliability of connections can be postulated from their strengths, and those with significantly nonzero connectivity were more reliable (Shehzad et al., 2009). We, however, argue for a more nuanced approach to this issue. Importantly, we call attention to connections that are weak (|full correlation connectivity| < 0.1) on the population level, may fail to reach significance even in the current large sample, yet were measured with “good” reliability or higher due to decent interindividual variability. These connections, mostly found in the cognitive networks, may be a critical piece of understanding individual differences, such as modulating mechanisms that are present in some but not other subjects.
Other analytical decisions
In addition to ICA dimensionality, we examined the effects of other analytical decisions in ICA and dual regression on reliability. For coherence, reliability tended to increase with normalized threshold, suggesting that components were better defined as spatial maps were more restricted to their functional cores. For connectivity, the reliability of full correlation was systematically higher than partial correlation. This observation is consistent with the speculations by Smith and colleagues (2011) that partial correlation may perform worse than full correlation when the total number of components is large (e.g., >50), as the number of third-party connections to partial out grows quadratically and serves to detract from real connectivity. On a related note, it is possible that our tuning parameters for the regularization algorithms were not optimal. To conclude, although partial correlation is promising to characterize effective connectivity, more work is necessary to find the proper regularization parameters and schemes.
Limitations
Results of the current study should be interpreted with several limitations in mind. First, findings may depend on important characteristics of the HCP data set and not generalize to non-HCP data sets. Nonetheless, the HCP and HCP-style data are increasingly used by researchers, supporting the relevance of these findings. Second, while ICA typically results in some artifactual components, we included all components in our analysis as guidelines for artifact identification are not yet available and pre-exclusion may be arbitrary. Future research may examine the applicability of previously developed classifiers (De Martino et al., 2007) in the CIFTI space and at high ICA dimensionalities. Third, global noise in rsfMRI related to respiration and accompanying head motion is increasingly acknowledged (Power et al., 2018) yet not removed in this study. At the time of this study, this topic remains heavily debated (Glasser et al., 2018, 2019; Power, 2019) and algorithms such as temporal ICA (Glasser et al., 2018) are unavailable. However, we note that our reliability estimates remained mostly unchanged when controlling for mean relative RMS in rsFC, offering some confidence that the presence of global noise did not greatly impact reliability estimates. Lastly, while an important prerequisite, reliability is not the same as validation or behavioral prediction. Bijsterbosch and colleagues (2018) is one example of comparing various parcellations in predicting behavior in the HCP (although ICA in that work was performed on the whole brain and differed from the surface-constrained ICA in the present work).
Conclusion
The present study characterized the test–retest reliability of rsFC on the cortical surface derived with ICA and dual regression at various dimensionalities and compared it with two existing binary, nonoverlapping cortical atlases. Findings provide guidance for variable selection and parameter optimization for rsFC analysis, and importantly highlight that these decisions are hypothesis-dependent. In particular, network assignment is an important factor that affects the general level of reliability, optimal ICA dimensionality, and whether ICA or other parcellations are preferred. For general purposes, cortical ICA with a dimensionality of 150 may provide an optimal balance between parcellation fineness, reliability, and burden for multiple comparison correction. Reliability research is critical as neuroimaging studies continue to adopt larger sample sizes and more advanced methodology to study individual differences such as psychopathology.
Footnotes
Acknowledgments
Data were provided by the Human Connectome Project, WU-Minn Consortium (Principal Investigators: David Van Essen and Kamil Ugurbil; 1U54MH091657) funded by the 16 NIH Institutes and Centers that support the NIH Blueprint for Neuroscience Research; and by the McDonnell Center for Systems Neuroscience at Washington University. Y.M. was supported by a University of Minnesota Informatics Institute On the Horizon Grant to A.W.M. The authors acknowledge the Minnesota Supercomputing Institute at the University of Minnesota for providing resources that contributed to the research results reported within this article.
Data Availability
HCP data are freely available from
Author Disclosure Statement
No competing financial interests exist.
Funding Information
This work was supported by an On the Horizon Award from the University of Minnesota Informatics Institute and a Conte Center grant P50MH119569.
Supplementary Material
Supplementary Figure S1
Supplementary Figure S2
Supplementary Figure S3
Supplementary Figure S4
Supplementary Figure S5
Supplementary Figure S6
Supplementary Figure S7
Supplementary Figure S8
Supplementary Figure S9
Supplementary Figure S10
Supplementary Figure S11
Supplementary Figure S12
References
Supplementary Material
Please find the following supplemental material available below.
For Open Access articles published under a Creative Commons License, all supplemental material carries the same license as the article it is associated with.
For non-Open Access articles published, all supplemental material carries a non-exclusive license, and permission requests for re-use of supplemental material or any part of supplemental material shall be sent directly to the copyright owner as specified in the copyright notice associated with the article.