
Abstract
Background:
Recurrent complex visual hallucinations (VHs) are common in dementia with Lewy bodies (DLB). Previous investigations suggest that VHs are associated with connectivity changes within and between large scale networks involved in visual processing and attention.
Aim:
To examine more directly whether VH in DLB reflects direct changes in neuronal activity between cortical regions assessing metabolic connectivity with 18F-fluorodeoxyglucose (FDG)-positron emission tomography (PET)/magnetic resonance and graph theory.
Methods:
Twenty-six patients with probable DLB (13 VHs and 13 no-VHs; mean age: 72.9 ± 6.87 years vs. 70.2 ± 7.96 years) were enrolled. T1-weighted 3T-MR images and FDG-PET data were coacquired using an integrated PET/MR scanner. MR images defined cortical parcels of the Shaefer-Yeo atlas for multiple functional networks. We computed in each parcel the regional standardized-uptake-values (SUV) corrected for partial volume and normalized to the cerebellar cortex. Strength degree, clustering coefficient, characteristic path length, and hubs were analyzed with graph analysis.
Results:
The mean 18F-FDG-PET SUVr of parcels belonging to the visual and dorsal attention networks (DANs) were significantly lower in the VH group (p = 0.01). Metabolism in the right temporoparietal cortex correlated with VH severity (R = −0.58; p < 0.01). VH patients showed weaker metabolic connectivity in the parietal, temporal, and occipital cortex of the default mode network, DAN, and visual networks, but more robust connectivity in the right insula and orbitofrontal cortex. A lower global efficiency characterized the VH group, except for ventral attention network and limbic network.
Conclusions:
VHs in DLB correlate with lower glucose metabolism and weaker metabolic connectivity in the parietal–occipital cortex, but stronger connectivity in the limbic system.
Impact statement
This study shows that application of the graph theory to 18F-fluorodeoxyglucose-positron emission tomography data, commonly acquired during the diagnostic workflow in neurodegenerative diseases, could be used to obtain information of functional connectivity at a group level, with results that are consistent with other data commonly used in brain functional investigation (e.g., electroencephalography or functional magnetic resonance). New network-based methods of metabolic image analyses, such as graph analysis, are a recent area of research with a potential capacity to extract information on alterations of metabolic connectivity that may become pharmacological and neuromodulation targets of the physiopathology of recurrent complex visual hallucinations.
Introduction
Visual hallucinations (VHs) represent a core symptom of dementia with Lewy bodies (DLB; McKeith et al., 2017). VHs specifically differentiate DLB from Alzheimer's disease and represent an early manifestation of the disease (Onofrj et al., 2013).
VHs in DLB patients are stereotypical and are characterized by view of complex scenes involving human faces and animals, natural stimuli coded in the occipital and temporal cortex. This symptom of DLB thus offers the opportunity to understand the pathophysiology of visual misperceptions.
Investigation of functional brain connectivity with functional magnetic resonance (fMRI) and electroencephalography (EEG) reported changes within and between multiple large-scale networks engaged in visual information processing (the visual network), attention and imagery (the dorsal attention network [DAN]), the salience of stimuli (the salience/ventral attention network [VAN]), and episodic memory (the default mode network [DMN]; Onofrj et al., 2013). However, these methods are only indirectly related to neuronal activity and energy consumption, which are affected by neurodegeneration. The 18F-fluorodeoxyglucose (FDG) positron emission tomography (PET) measures glucose metabolism directly related to the level of neuronal activity.
Cellular metabolism is depressed in the parieto-occipital cortex of DLB patients (Nobili et al., 2018). However, the correlation with VHs is more controversial, with some studies reporting decrements in the right occipitotemporal and frontal cortex (Perneczky et al., 2008) or bilaterally in the frontal cortex (Morbelli et al., 2019), whereas others reported increased metabolism in the temporal and parietal regions (Imamura et al., 1999).
A relative novel measure of functional interaction closer to cellular activity is the covariation of glucose metabolism across brain regions, that is, metabolic connectivity. Two regions showing correlated levels of glucose metabolism across subjects can be assumed to interact functionally (Passow et al., 2015). There have been only a handful of studies that used connectivity models of 18F-FDG PET data in DLB. These studies reported altered metabolic connectivity in DLB patients with VHs within the visual (Iaccarino et al., 2018), DAN, and salience networks (Iaccarino et al., 2018; Sala et al., 2019). Graph theory allows us to study complex networks' features of data obtained with EEG and fMRI (Bullmore and Sporns, 2009). In the case of metabolic connectivity, graph methods exploit the covariance matrix of the mean uptake value from a region of interest to all other regions across a sample of subjects (Horowitz, 1964). The application of covariance statistics and network-based methods has good reproducibility and applicability when applied to PET data to characterize pathological conditions (Veronese et al., 2019).
Here we combine metabolic connectivity with 18F-FDG PET data in DLB patients and graph theory to study the alterations of functional brain architecture related to VHs. We characterize graphs of metabolic connectivity embedded in the Shaefer-Yeo 100 region functional atlas (Schaefer et al., 2018) to measure differences in the functional architecture of DLB patients, with or without VHs. Such alterations may predispose to VHs and are potential targets for neuromodulation.
Materials and Methods
Patients
Twenty-six patients with a diagnosis of probable DLB according to current criteria (McKeith et al., 2017) were recruited at the Memory Clinic at the University of Padova and divided into two age-matched subgroups according to presence of VHs: 13 with VHs (mean age 72.3 ± 6.09, gender female/male: 7/6) and 13 without VHs (no-VHs; 70.3 ± 7.92 years, gender female/male: 4/9). Exclusion criteria were brain MRI evidence of severe cerebrovascular disease, diagnosis of concomitant diseases contributing to cognitive decline, and presence of eye diseases causing significant loss of visual acuity. Each subject underwent clinical assessments evaluating (1) visual acuity, (2) severity of extrapyramidal signs using the motor part of the Unified Parkinson Disease Rating Scale, (3) presence of fluctuations of cognition and alertness using the Clinician Assessment of Fluctuations scale, (4) presence of symptoms suggestive of REM sleep behavior disorder (RBD) using the single-question RBD screening tool, and (5) the burden of behavioral disturbances with the neuropsychiatric inventory (NPI) questionnaire. Profile of cognitive impairment was investigated with the following neuropsychological tests: mini-mental status examination scale (MMSE) for global cognition, visual object and space perception battery to assess visual–perceptual and visual–spatial impairments; digit cancellation test to evaluate visual attention, clock drawing test for visuoconstructional abilities and executive functions, digit span forward and backward and prose memory for the evaluation of short- and long-term verbal memory, letter fluency test for language, and Rey–Osterrieth complex figure for visual–constructional abilities and visual memory (Cagnin et al., 2013). The study was approved by the local ethical committee at Padova Hospital (No. 0038879) and all participants signed an informed consent.
Image analyses
Acquisition and processing of 18F-FDG PET/MRI
Following the European Association of Nuclear Medicine guidelines for neurodegenerative diseases (Varrone et al., 2009), after fasting for ∼8 h, subjects received an intravenous injection of 3 MBq/kg of 18F-FDG (using a Medrad Intego PET infusion system) in a quiet dimly lit room after been instructed to keep eyes closed and not to speak or be otherwise active for 25 min. No significant hyperglycemia was detected (<150 mg/dL) before injection. One hour after injection, all subjects underwent a whole brain 18F-FDG PET/MRI study on a 3T clinical PET/MR scanner (Biograph mMR; Siemens Healthcare, Erlangen, Germany) with scan lasting 25 min. A radial VIBE (UTE) sequence (1.6 × 1.6 × 1.6) was used to generate attenuation coefficient maps. PET was reconstructed into a 344 × 344 matrix using a single frame. Standard corrections for decay, scatter, and dead time were performed.
T1-MPRAGE images cortical reconstruction and volumetric segmentation were performed with the Freesurfer image analysis suite (v 6.01), which is documented and freely available for download online. Technical details of these procedures are described in previous publications.
18F-FDG PET images were processed using PetSurfer, a built-in package of Freesurfer. The package allows to correct for partial volume through a wide range of models, but for our purpose we used the symmetric geometric transfer matrix. We followed the standard pipeline as described at PetSurfer to process the images data using for the cortical parcellation the Schaefer-Yeo 100 ROIs functional atlas (Schaefer et al., 2018); a resolution of 5 mm (full width at half maximum) was used. We used the cerebellum cortex as reference region to obtain standard uptake value (SUV) ratios (SUVr). At the final step of analysis, FDG SUVr, corrected for partial volume effect, were obtained for each region of the Shaefer-Yeo Atlas from every subject.
Graph analysis
The graph reconstruction and analysis were performed in R v3.6.1 (R Core Team, 2019), using igraph and brainGraph packages (Csardi and Nepusz, 2006; Watson, 2020). First, a general linear model was specified for each brain region, with SUVr as the outcome variable and age, gender, and MMSE values as covariates. Second, Pearson correlation coefficients between the model residuals for all pairs of regions were calculated, and an adjacency matrix of size 100 × 100 was created for each group of patients (VHs and no-VHs). The adjacency matrix of each group was binarized by thresholding and removing any correlations lower than the threshold level. Negative correlations were not considered. To ensure equal network sizes for both groups, the threshold level was chosen to result in a specific density (i.e., a ratio of the number of edges present in the network to total possible number of edges); a range of densities from 0.05 to 0.40 (step size: 0.01) was investigated. A fixed density at 29%, the minimum in which all nodes have at least one connection with another node (connected network) in all groups, has been chosen for single network and nodal level analysis. The networks created were undirected, weighted, and simples (i.e., without loops). Figure 1 summarizes all processing steps of PET/MRI data.
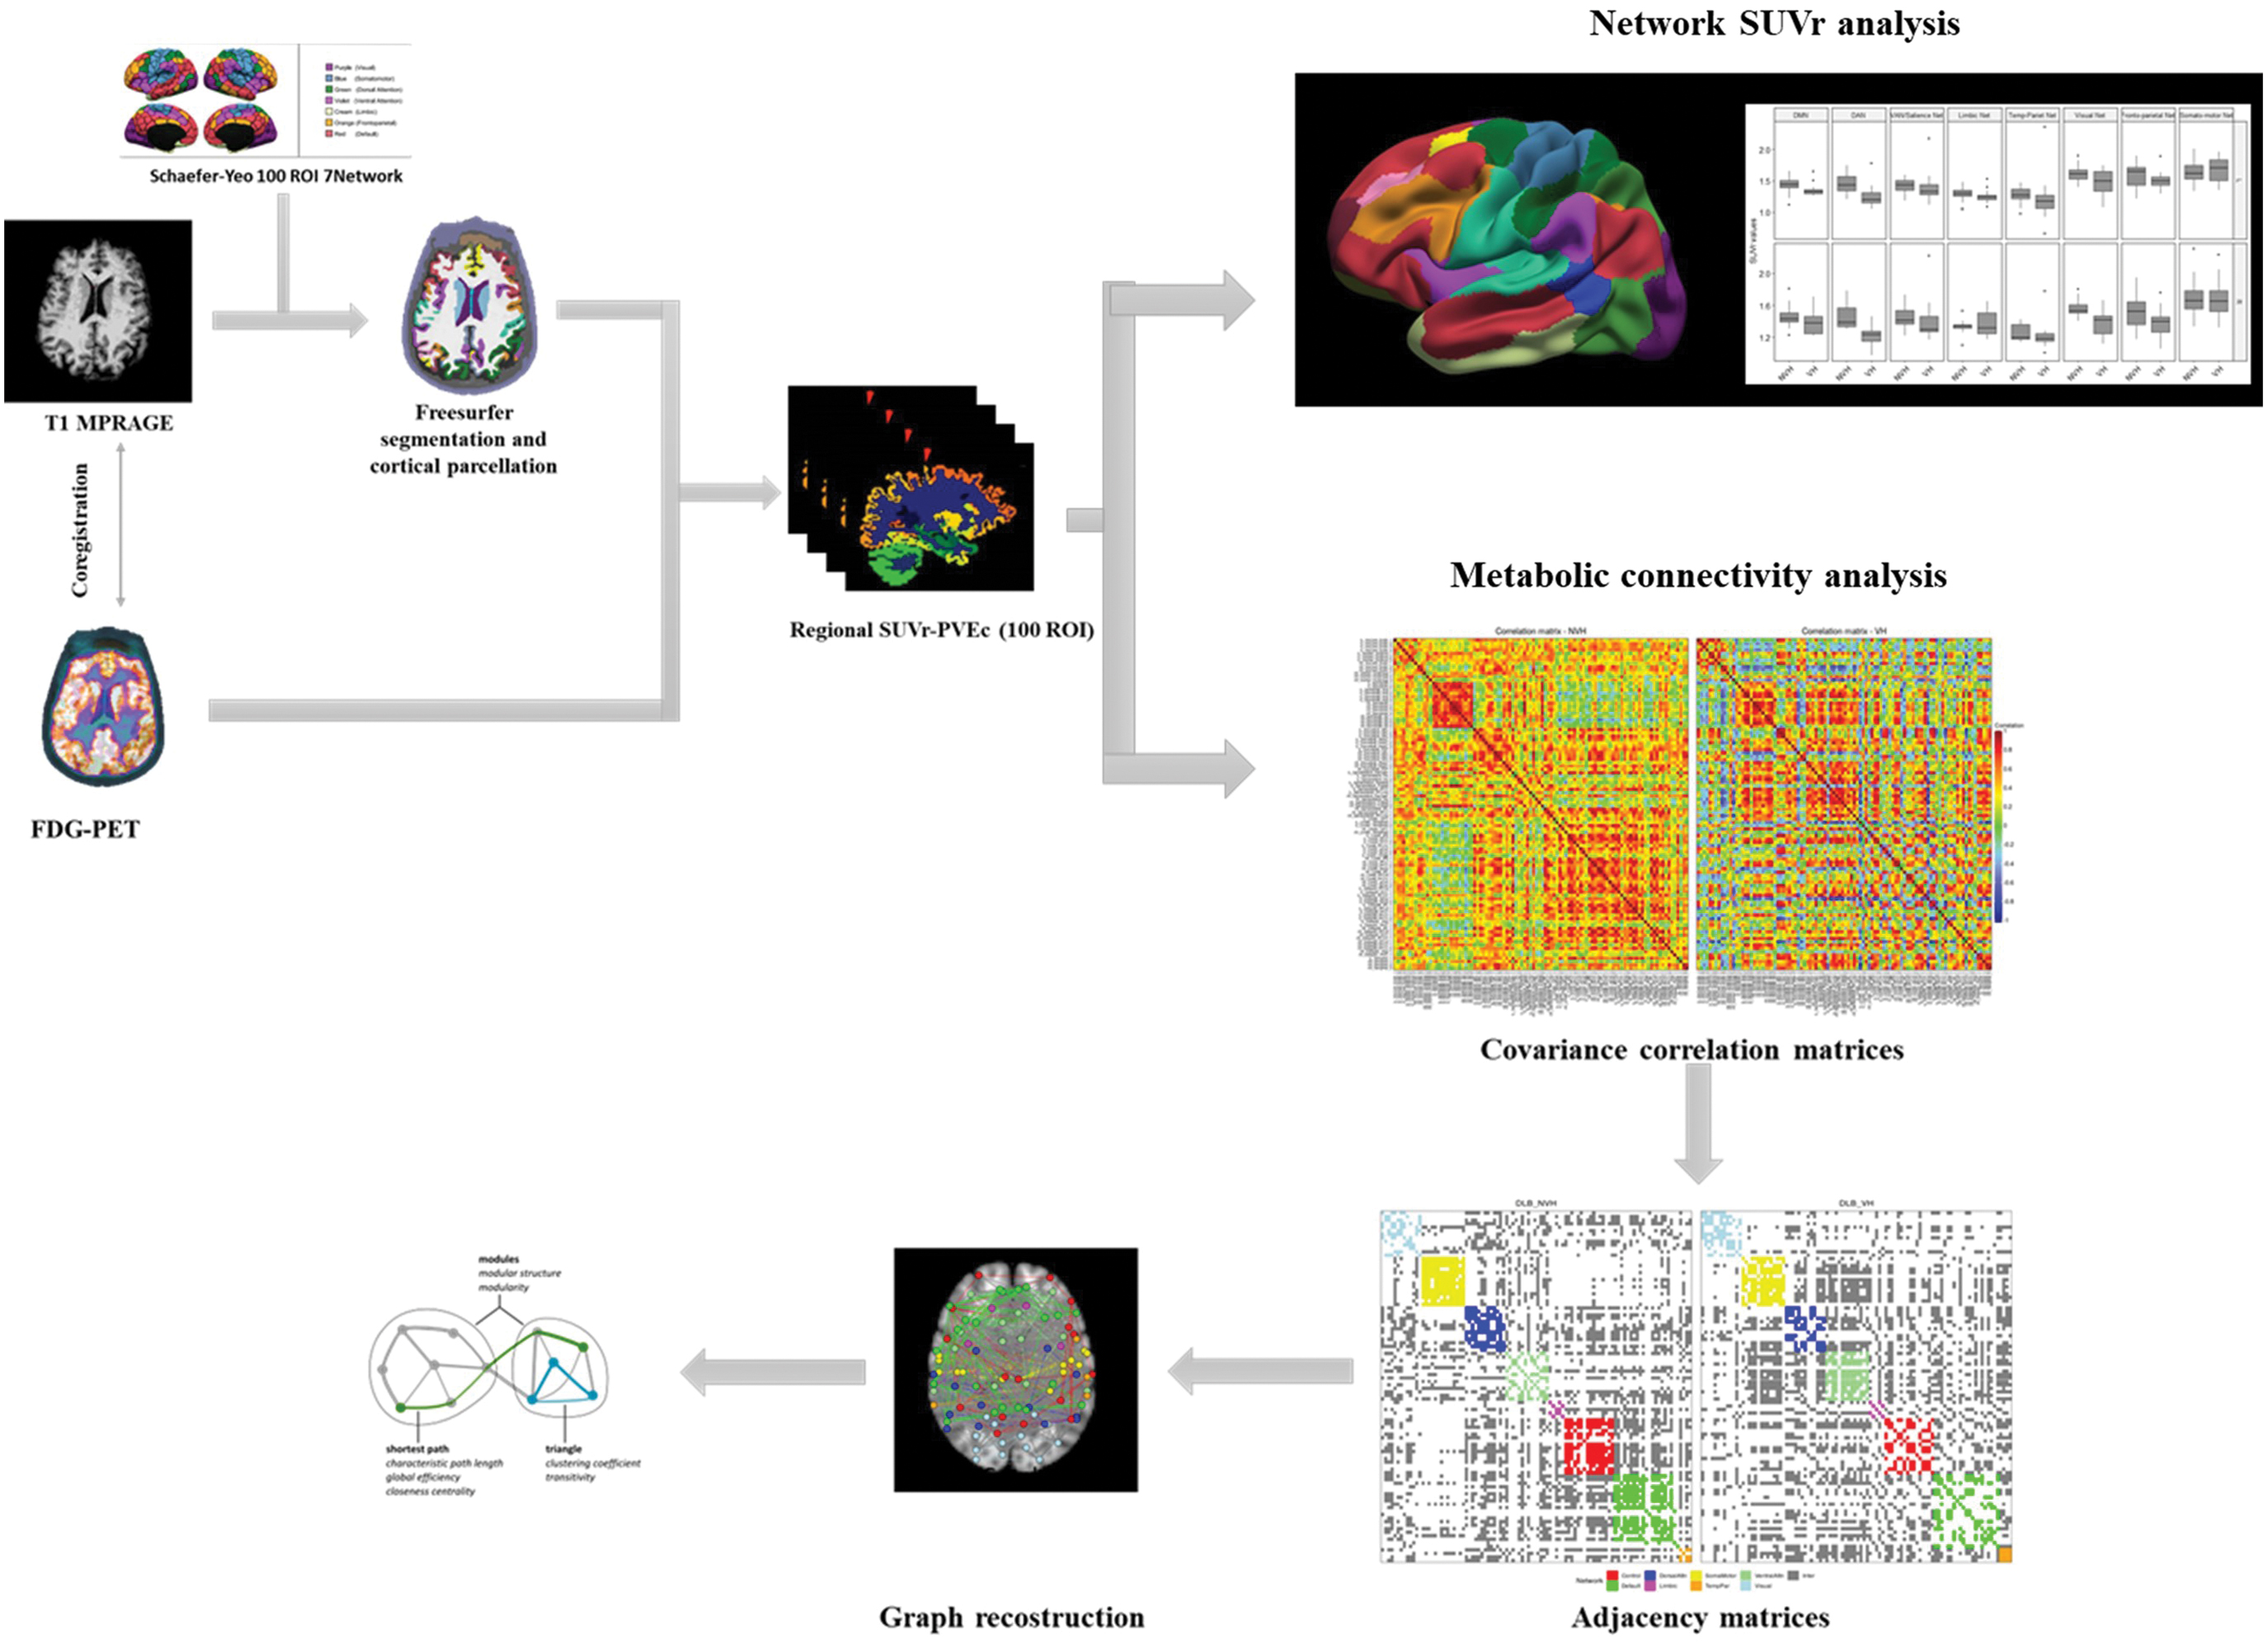
Schematic representation of MRI-PET images data processing. FDG, fluorodeoxyglucose; MRI, magnetic resonance imaging; PET, positron emission tomography; PVEc, partial volume effect correction; ROI, region of interest; SUVr, standardized uptake value ratio. Color images are available online.
Network parameters obtained with graph theory were degree strength, cluster coefficient, and weighted characteristic path length. Degree strength describes the mean strength of all connections of one selected node to neighborhood nodes: the strength of the connection is weighted by the strength of correlation between two nodes. Cluster coefficient is calculated as the average fraction in which pairs of neighboring nodes are also neighbors of each other, and represents a measure of the degree to which nodes in the graph tend to be clustered together (Latora and Marchiori, 2001). The average of the shortest path length between all pairs of nodes considering the edge weighted is called the weighted characteristic path length (Lp.wt) of the network and it describes the efficiency of the information flow between all pairs of nodes (Watts and Strogatz, 1998). In topology, the shortest path length was defined as the shortest path distance from node “i” to node “j.” In practice, it represents the minimum number of points connecting node “i” with node “j.”
Moreover, distribution of hubs has also been investigated for each group. Hub is defined as a special node with a significative relevance in the network due to its centrality in flowing information (van den Heuvel and Hulshoff Pol, 2010). Despite the simplicity of this definition, there are no standardized ways to calculate network's hubs and several measures have been proposed (Sporns et al., 2007). For the purpose of this study, a node with a nodal strength higher than the mean strength of the network, calculated for each density value and in at least 50% of the density, was considered a hub. BrainNet Viewer and built-in braingraph functions were used for visualization of network descriptors (Xia et al., 2013).
Statistical analysis
Statistical analysis was performed using R v3.6.1 (R Core Team, 2019). Continuous variables were tested for normality of distribution and visual inspection of variable histograms and qplots were performed. Demographic, clinical, and neuropsychological features were assessed using analysis of variance, Kruskal–Wallis, and Mann–Whitney U test as appropriate. Fisher's exact test was performed for categorical variables. The significative level was set at p < 0.05. PET data were analyzed with analysis of variance with significance level was set at p < 0.05. The statistical analyses were done using age, gender, and MMSE score as nuisance covariates.
Differences between DLB groups in the number of connections within and between networks were studied using a resample with replacement method namely bootstrap. For each connectivity matrix, we built 5000 samples with replacement of 13 subjects for each group. A threshold to each of the 5000 bootstrapped samples at 29% of sparsity was applied and number of connections within and between networks was calculated. Multiple independent t-test corrected for Bonferroni was performed to evaluate differences between the two DLB groups.
Differences of strength at global and nodal levels, clustering coefficient, and characteristic path length parameters were evaluated using permutation-based analysis (5000 permutations) with p < 0.05 and controlling with false discovery rate.
Results
Patients characteristics
Demographic and clinical features of the sample are summarized in Table 1. Patient groups were comparable for demographic variables, degree of cognitive impairment, and parkinsonism. Burden of behavioral disorders was similar except for the NPI-subitem for VHs. As for cognitive evaluation, the mean score at the Rey–Osterrieth copy test was worst in the VH group (F = 24.5, p = 0.02). The two groups performed similarly in the remaining cognitive tests.
Demographic, Clinical, and Neuropsychological Data
Bold values indicate p < 0.05.
DLB, dementia with Lewy bodies; MMSE, mini-mental state examination scale; NPI, neuropsychiatric inventory; NVH, DLB without visual hallucination; RAVLT, Rey Auditory Verbal Learning Test; RBD, REM-sleep behavior disorders; SD, standard deviation; TMT-A, trial making A; UDRPS, Unified Parkinson's Disease Rating Scale; VH, DLB patients with visual hallucinations; VOSP, visual object and space perception battery.
Network-based 18F-FDG PET uptake
Mean 18F-FDG PET SUVr (partial volume effect corrected) for each network comparing DLB VH with no-VH groups are shown in Figure 2. In the VH group, mean FDG SUVr were lower in the DAN (left: F = 8.03, p = 0.01 and right: F = 12.86, p = 0.01) and in the visual network (left: F = 6.88, p = 0.01 and right: F = 9.38, p = 0.006) bilaterally. Mean SUVr data are available in Supplementary Table S1.
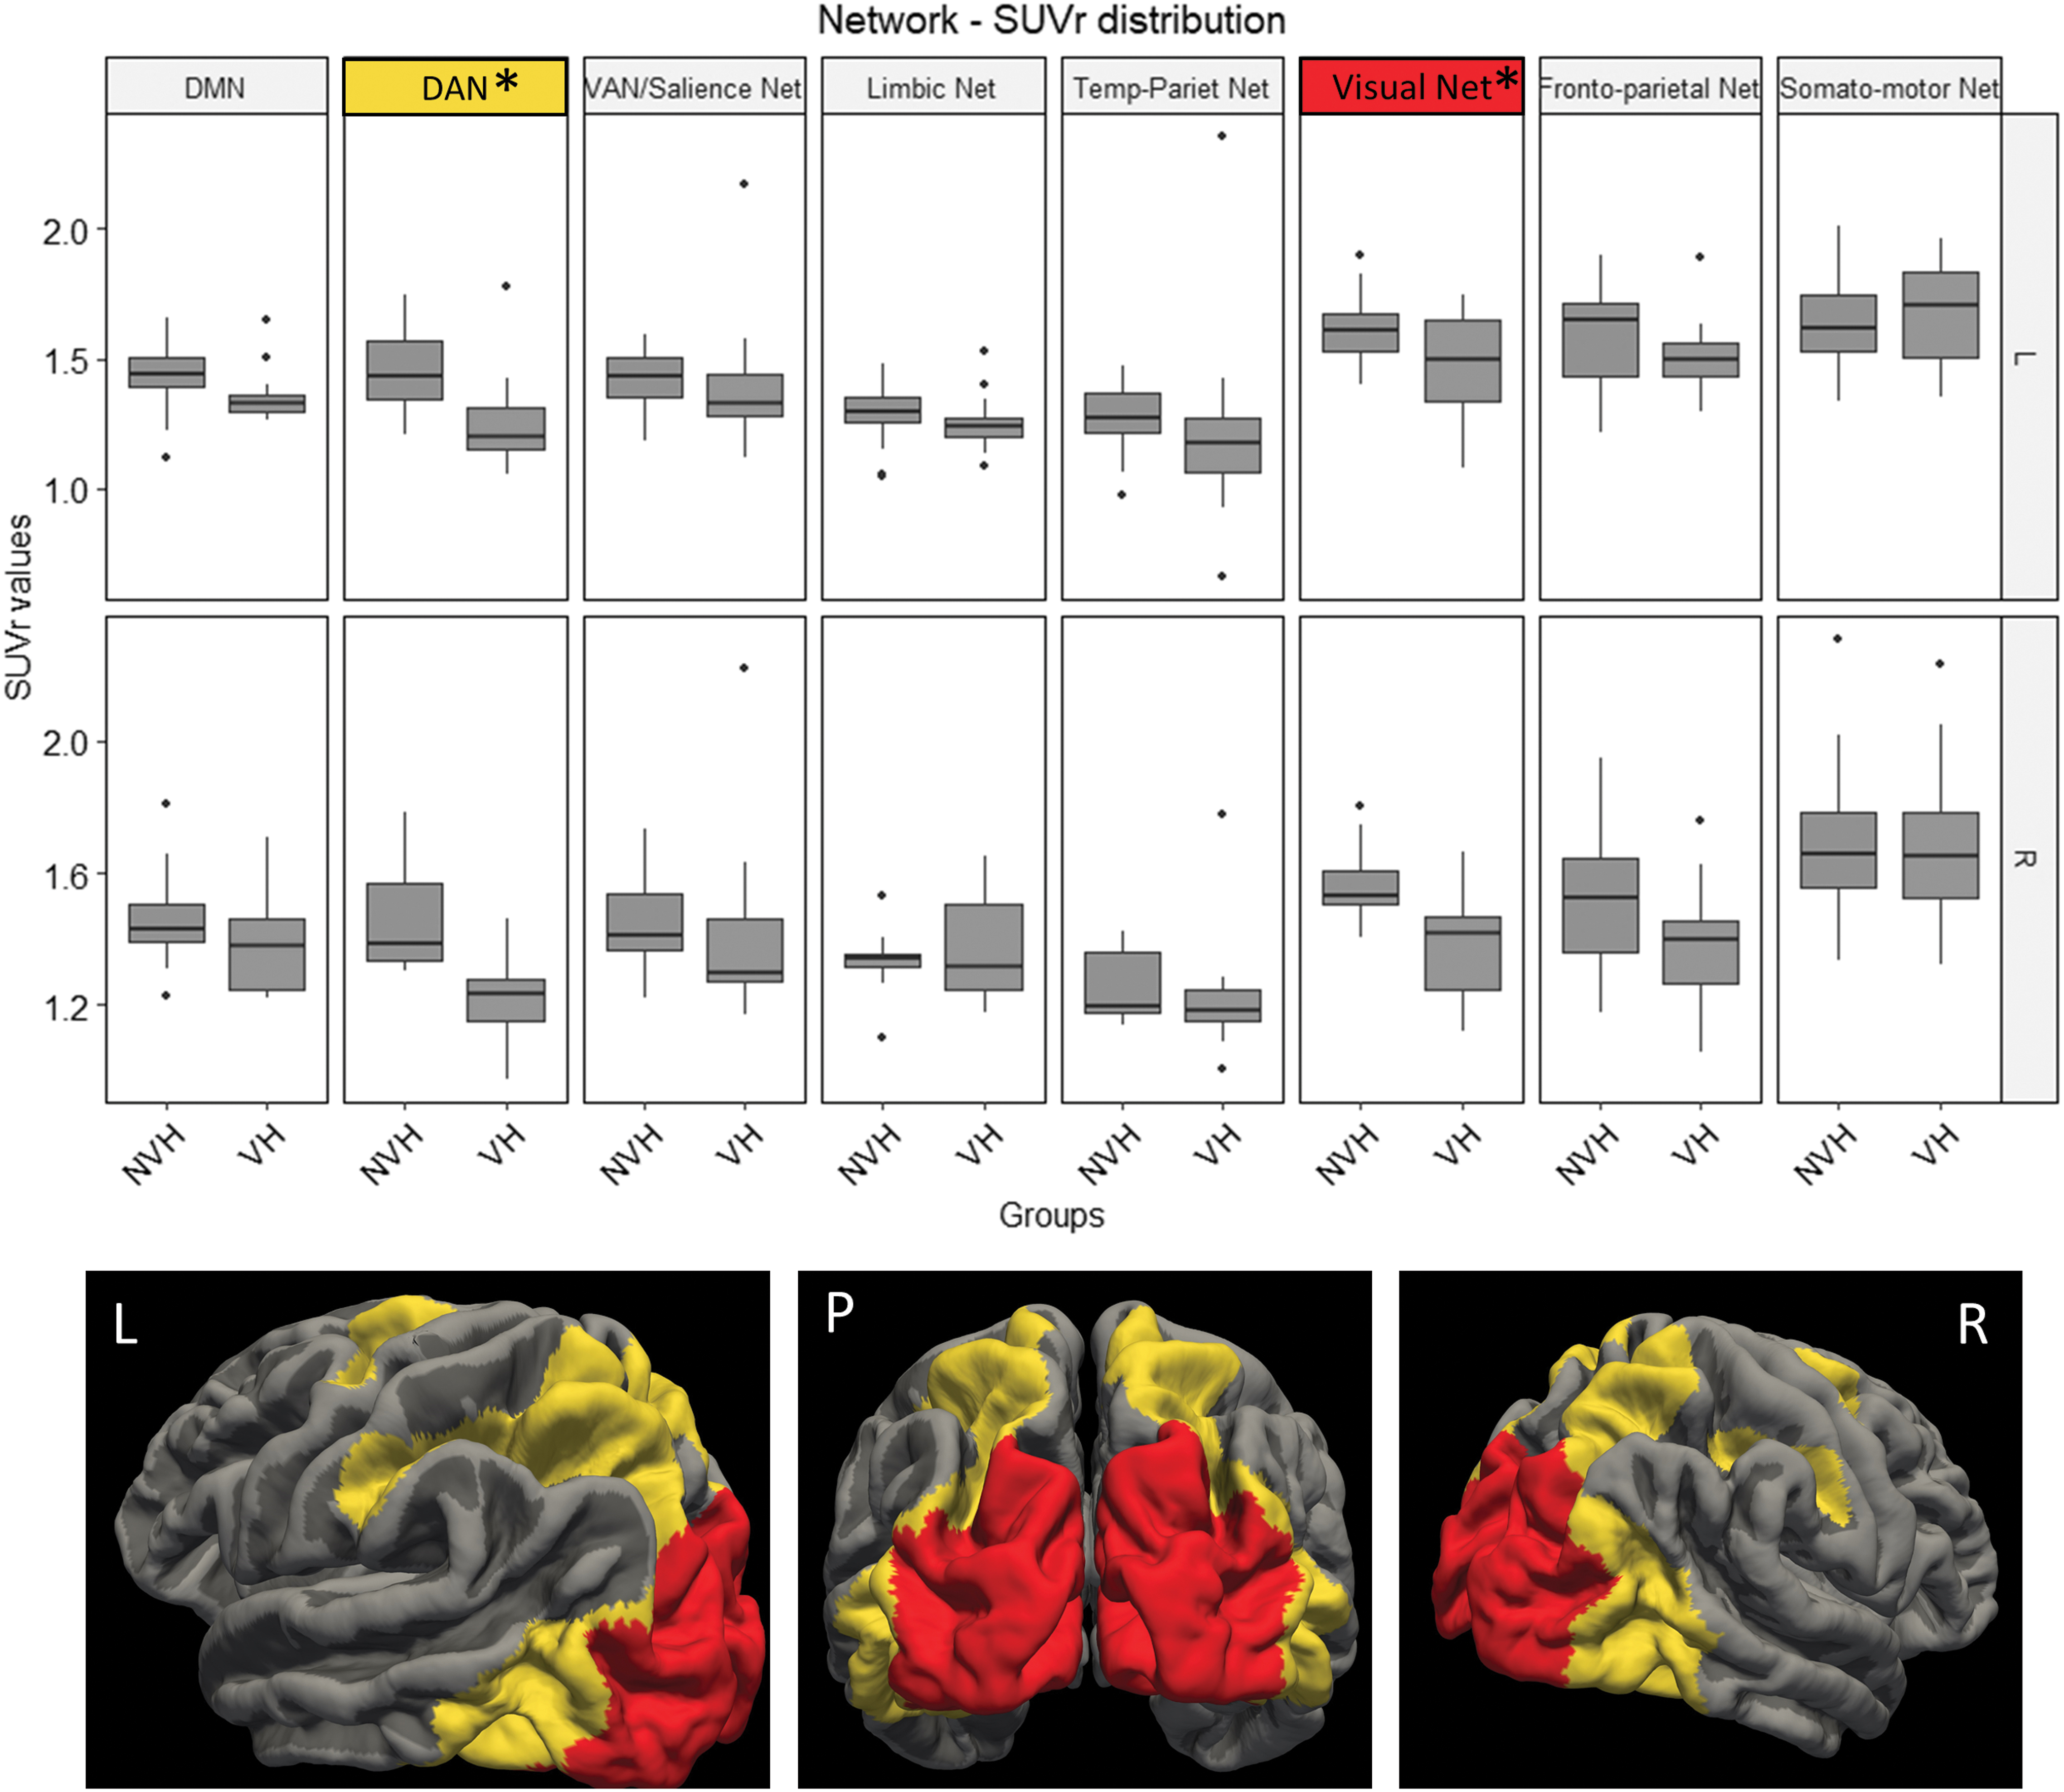
Boxplot graph represents the FDG-PET SUVr variance distribution of different networks in VHs and NVH. Mean SUVr values in the DAN and visual networks are lower in VHs than in the NVH group. Images in the lower part of the box illustrate the topographical localization of regions belonging to the DAN (yellow) and visual network (red). Marked (*) network p < 0.05. DAN, dorsal attentive network; DLB, dementia with Lewy bodies; DMN, default mode network; NVH, DLB patients without visual hallucinations; VAN, ventral attentive network; VHs, patients with visual hallucinations. Color images are available online.
Graph analysis
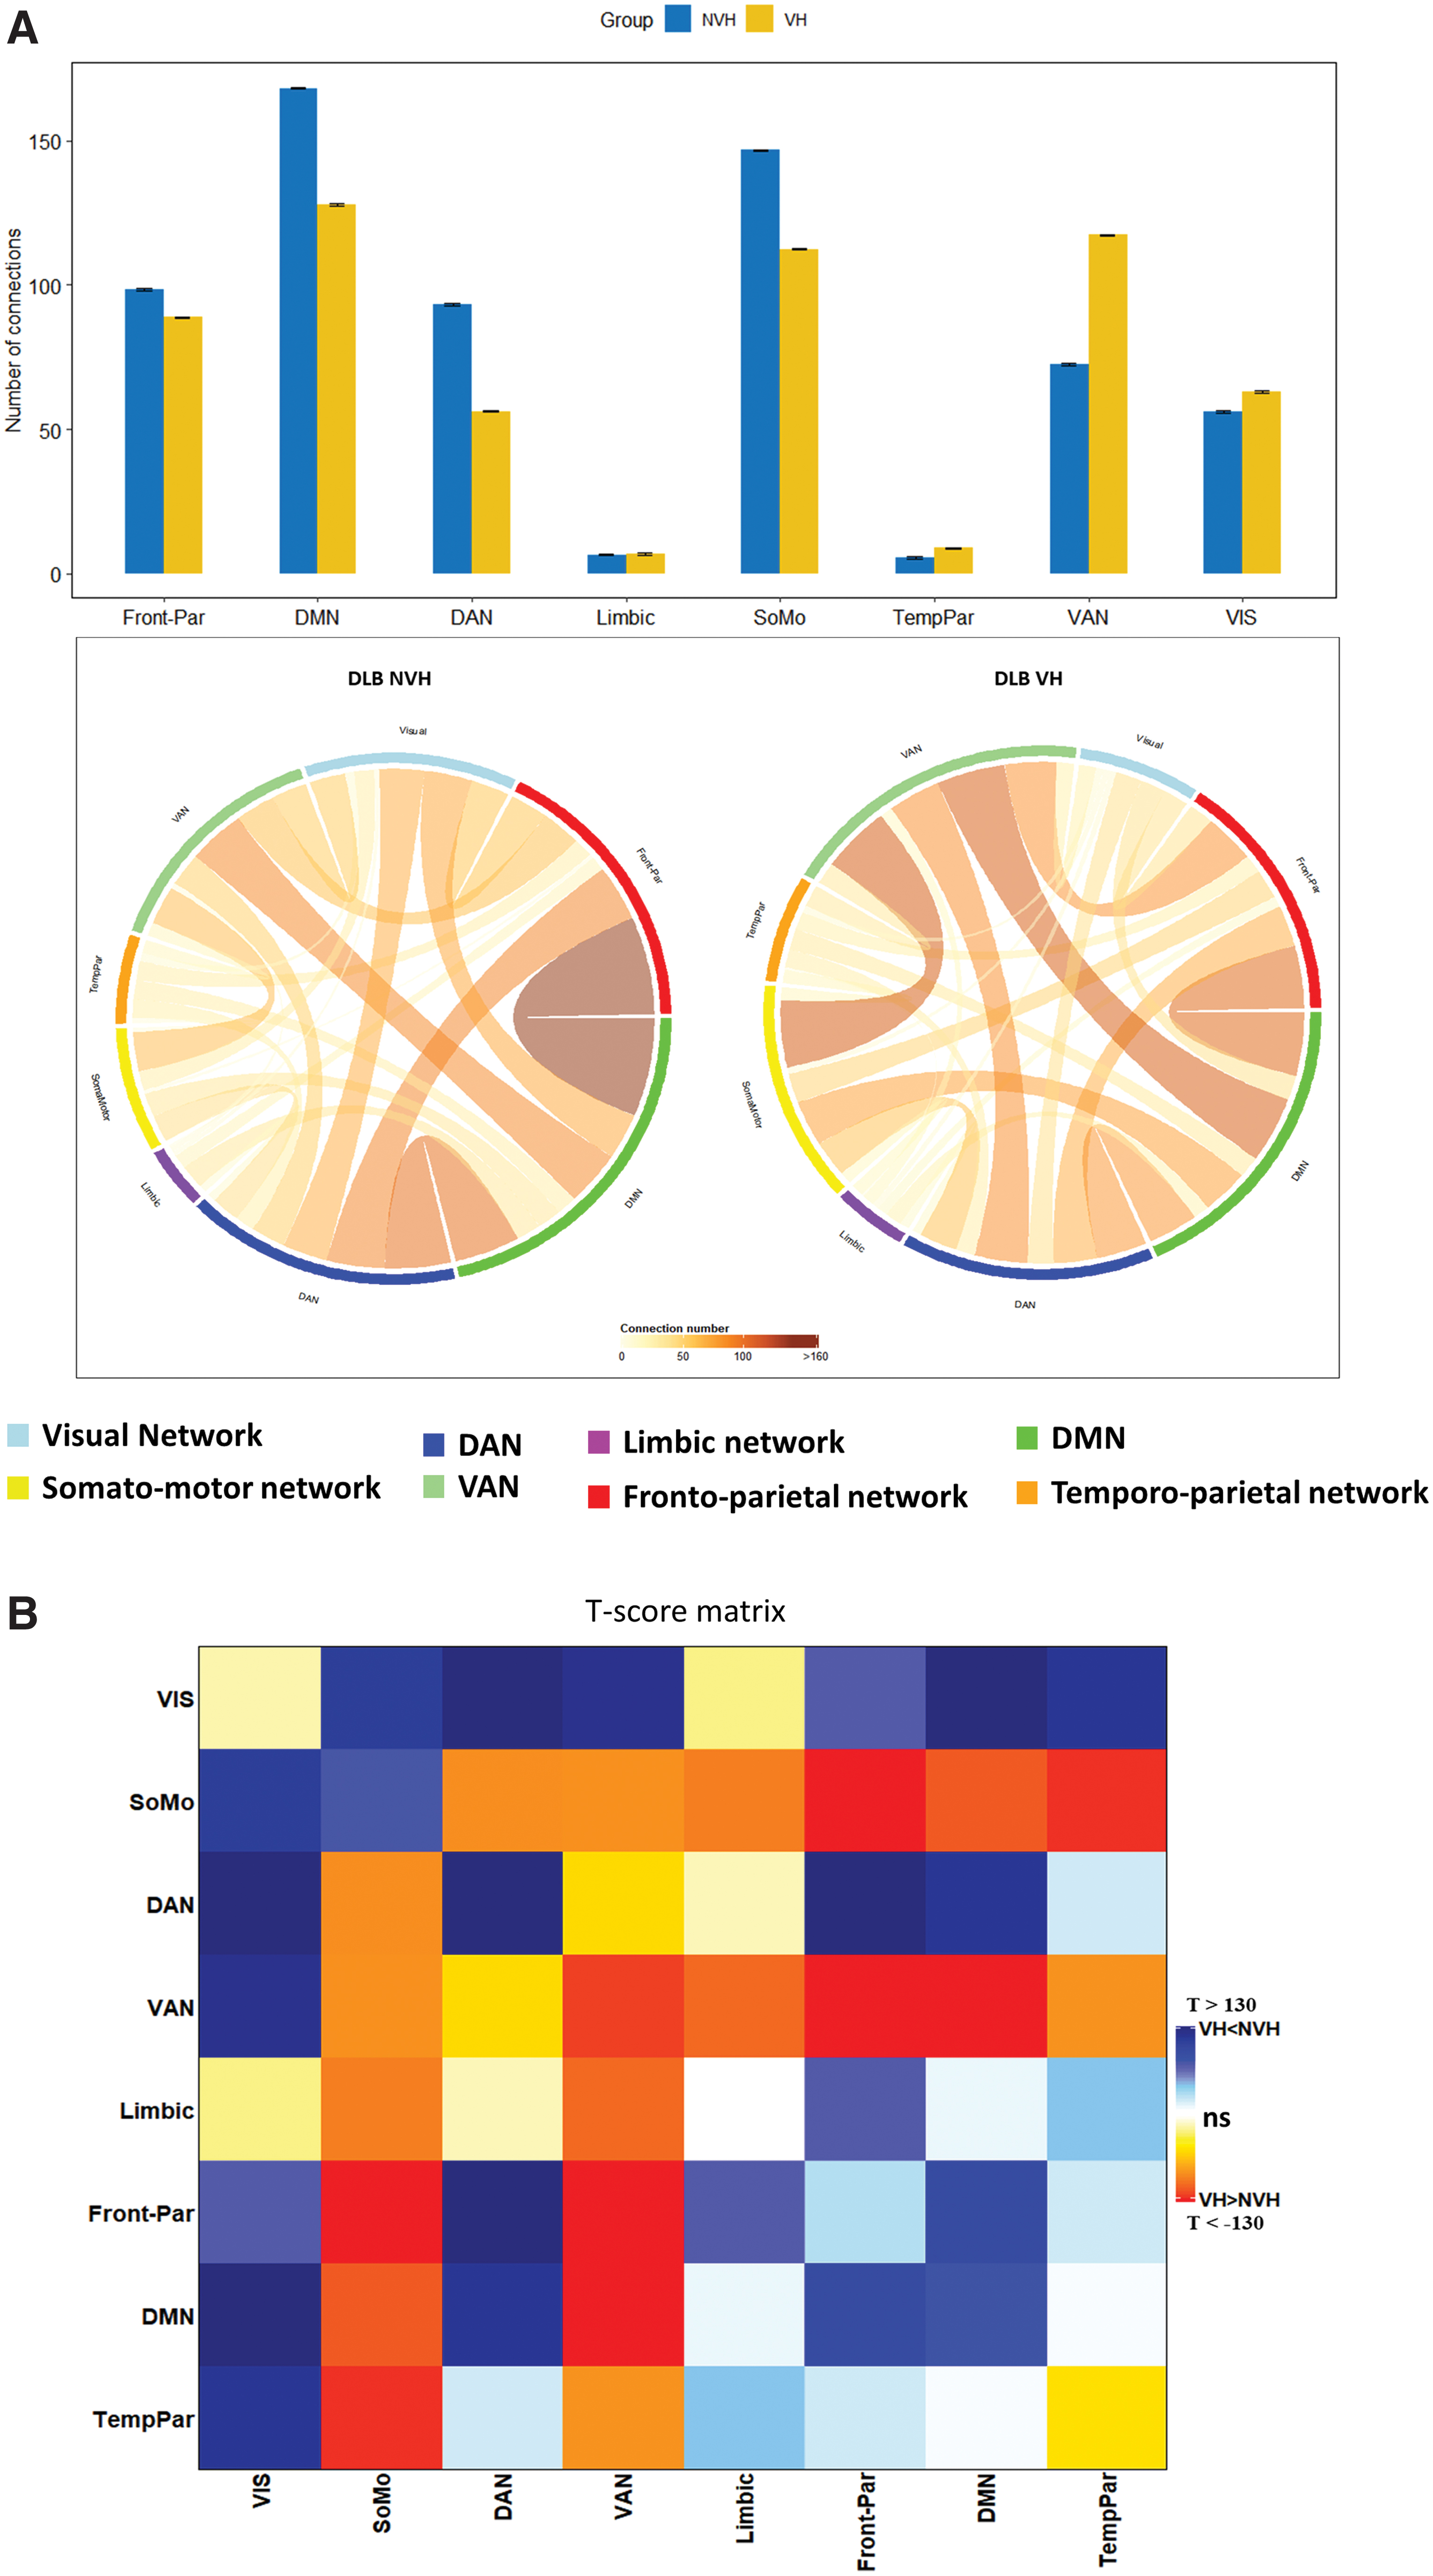
Differences of within and between networks connectivity in the DLB VH and no-VH groups are shown in Figure 3 and in Supplementary Table S2. The VH group had lower connectivity within DAN, DMN, and somatomotor networks, and higher connectivity within VAN and visual networks. As for the differences in between-networks connectivity, we found both higher and lower values in VH than in no-VH group. In detail, the DLB VH group had lower connectivity between the visual network and all other networks, except the limbic network, and between DAN, frontoparietal, and DMN; higher connectivity was found between both VAN and somatomotor networks with all the other networks; the limbic network had higher connectivity with VAN and somatomotor network (see results in Supplementary Table S3).
We also ran an analysis at the single parcel level to identify the cortical nodes whose metabolic connectivity showed the greatest differences in VHs (Fig. 4). In patients with VHs, the strength of metabolic connectivity was lower in the superior lateral and medial parietal (DAN, DMN, and frontoparietal networks) and in occipital cortex (visual network; p < 0.05). In contrast, it was higher in the right frontal (VAN/Salience network) and orbitofrontal cortex (limbic), and in regions of the somatomotor network bilaterally (p < 0.05). Detailed values are available in Supplementary Table S3.
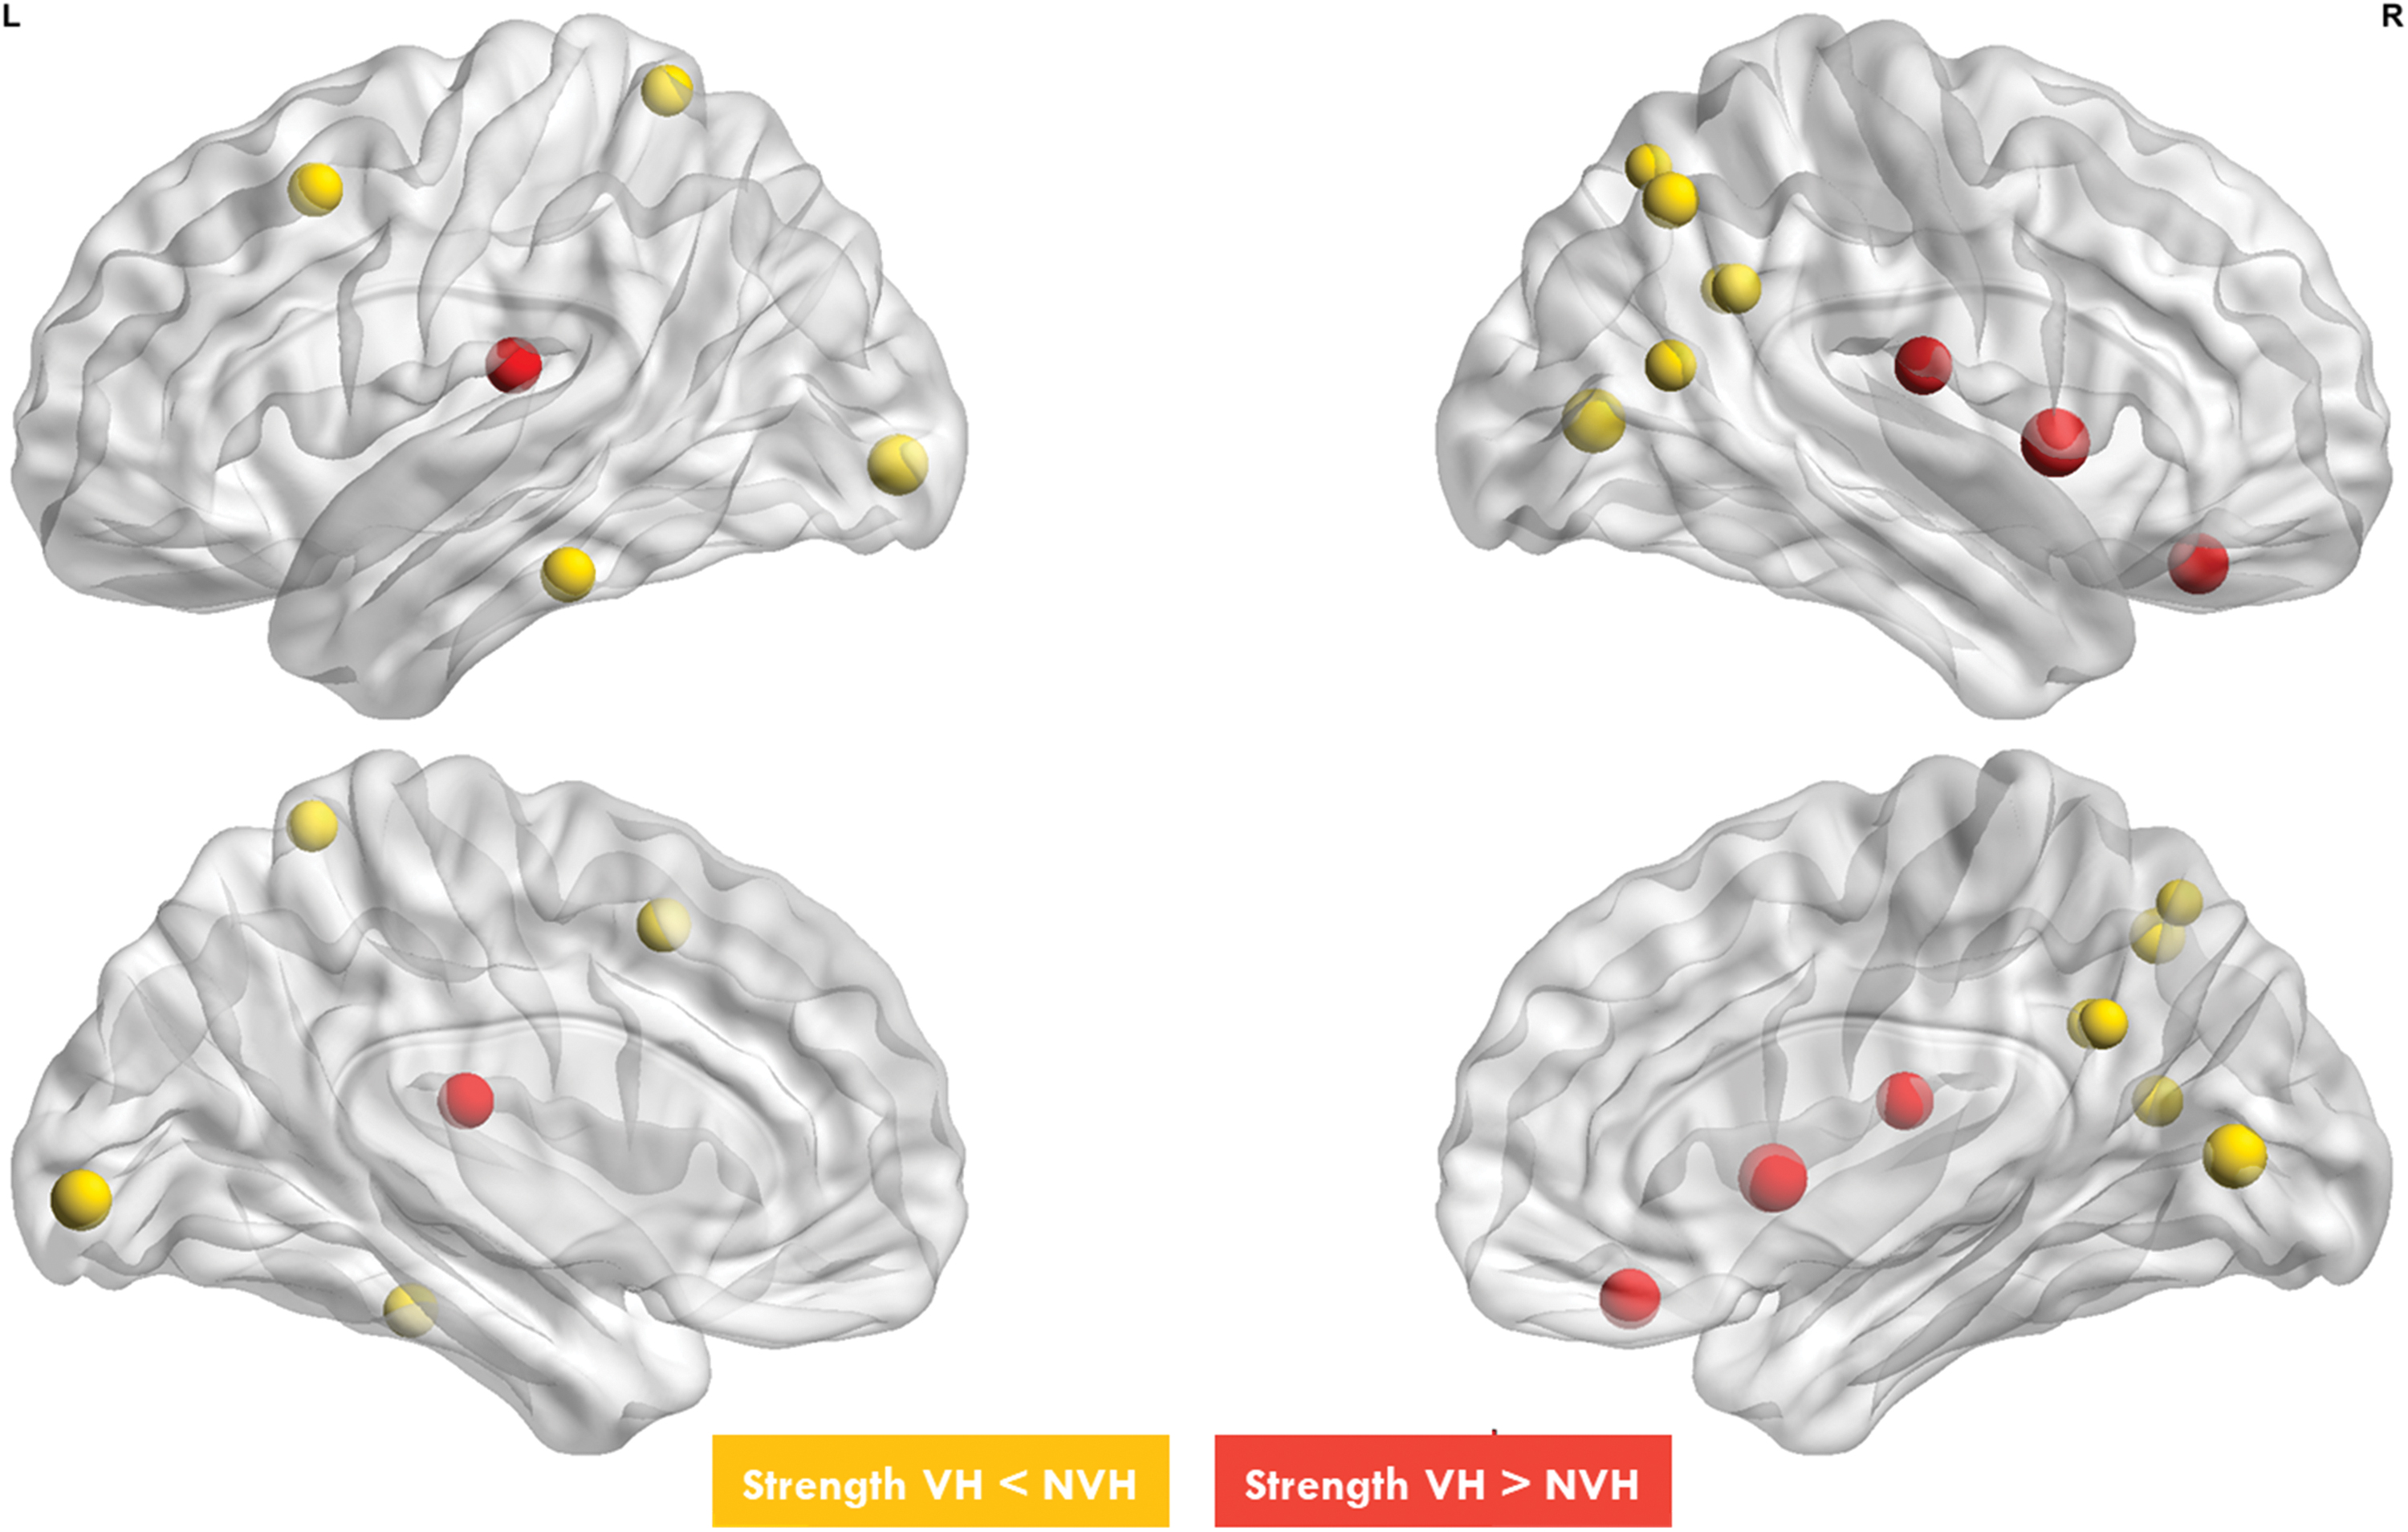
The figure shows nodes with different strength connectivity between DLB NVH and DLB VHs. Yellow nodes, that belong to DMN, DAN and visual network, have a lower nodal strength in DLB VHs compared with DLB NVH. Red nodes, that mainly belong to limbic network and VAN, have a higher nodal strength in DLB VHs compared with DLB NVH. Color images are available online.
Next, we examined whether regional metabolism was related to the degree of experienced VHs (NPI-VH scores; Fig. 5). Low metabolism in two regions of the occipito-parietal cortex, part of the DAN, correlated with the severity of hallucinations (DorsAttnA_ParOcc_1: R = −0.42; p = 0.03; DorsAttnA_TempOcc_1: R = −0.58; p < 0.01). Interestingly, a trend of positive correlation was found between the metabolism of a right orbitofrontal region belonging to the limbic network and severity of hallucinations (R = 0.37, p = 0.065).
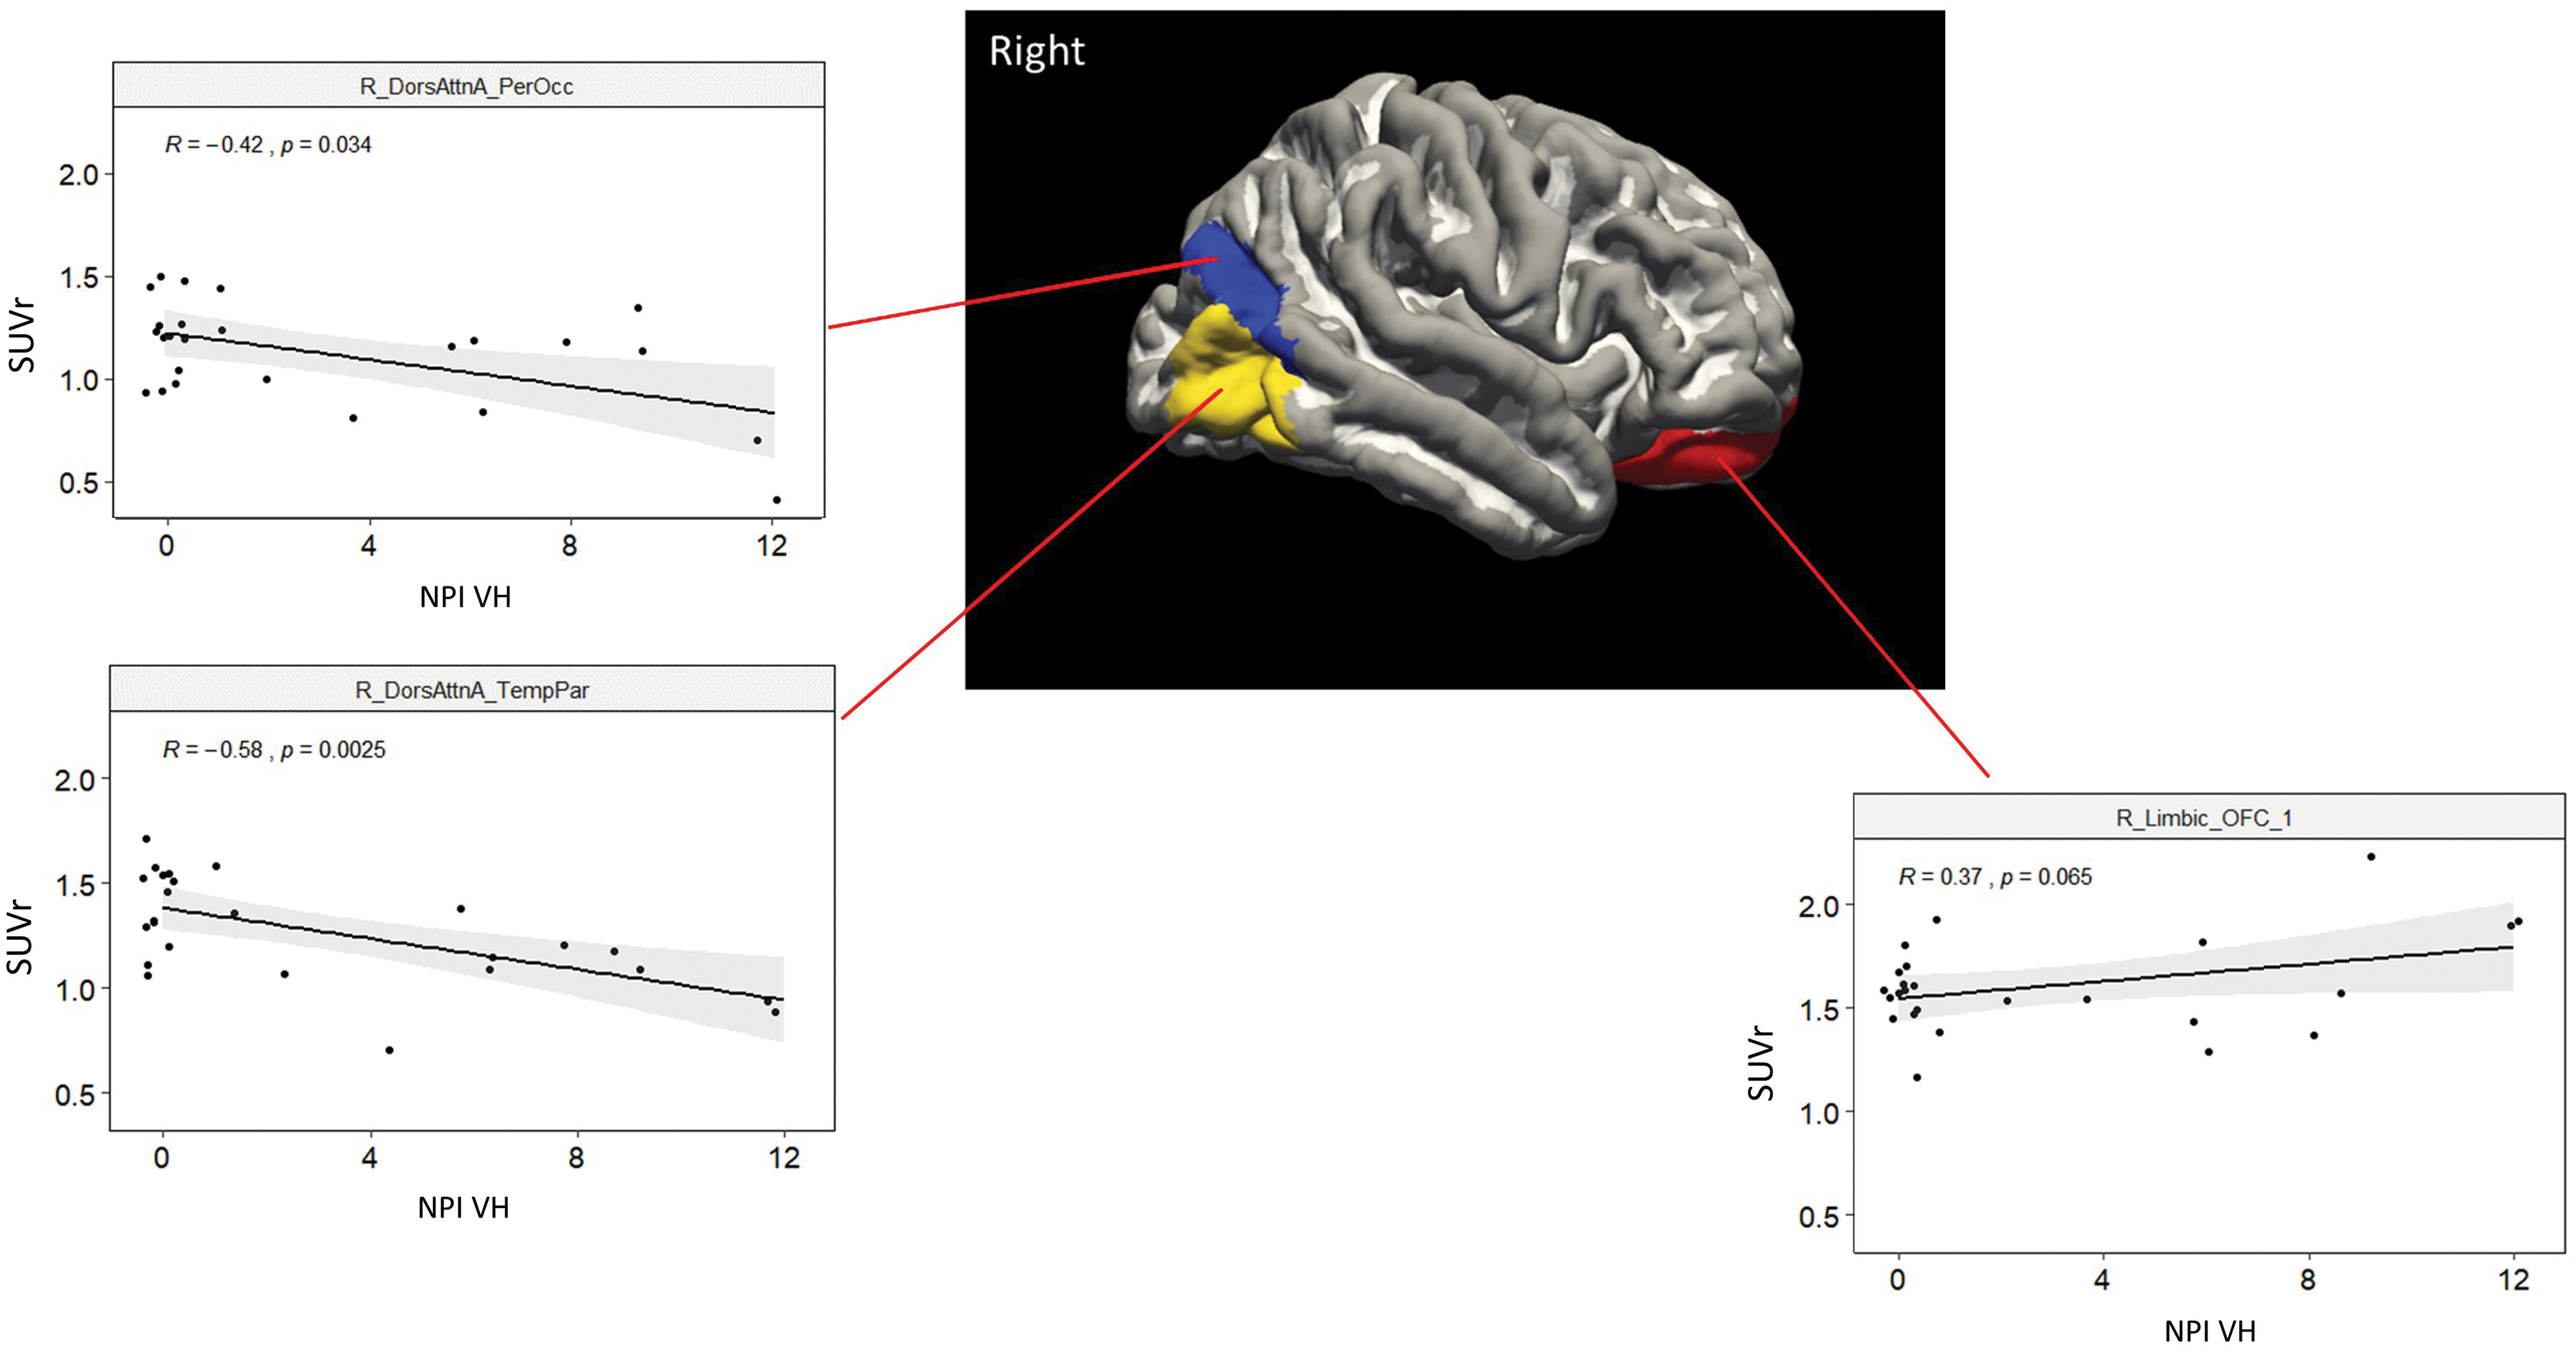
Plots describe the significant correlations between VH severity (NPI VHs) and SUVr in three regions of the right hemisphere outlined in the image (see coordinate information at
The whole brain analysis of graph metrics is shown in Supplementary Fig. S1 and Supplementary Table S4. The DLB VH group showed a higher Lp.wt and trend of higher clustering coefficient, while nodal strength was similar.
A global modification of hubs distribution was found in VH compared with no-VH group, with a gain of hubs mainly in the anterior regions of the limbic network, VAN/Salience network, and temporoparietal networks, and a loss in the DAN and DMN networks (Supplementary Fig. S2; Supplementary Table S5).
Discussion
DLB patients with VHs showed lower glucose metabolism in the occipital and parietal cortex correlated with the severity of visual misperception in the right occipitotemporal cortex. The visual network was also relatively disconnected from other cognitive control networks (DAN, DMN, FPN), which were also affected. In contrast, regions of the VAN and limbic networks were relatively hyperconnected, with a positive correlation with VHs in the right orbitofrontal cortex metabolism.
The reduction of glucose metabolism in posterior cortical regions is characteristic of DLB (Firbank et al., 2016), and patients with VHs show both right hemisphere occipitotemporal and prefrontal-parietal hypometabolism (Perneczky et al., 2008). The study by Morbelli et al. (2019) study is notable for the large sample size (n = 171) and the correlation analysis with multiple symptoms of DLB, including parkinsonism, VHs, and rapid eye movement disorders. They found VHs to covary with hypometabolism of bilateral dorsolateral-frontal cortex, posterior cingulate, and parietal cortex (Morbelli et al., 2019). The metabolic changes are congruent with structural changes in the same regions, for example, in microstructural diffusion properties (Delli Pizzi et al., 2015; Kantarci et al., 2010), or cortical thickness (Delli Pizzi et al., 2014).
Our study is the first to perform a metabolic connectivity analysis using a functional cortical parcellation atlas to define specific networks and their interaction. This approach led to several novel insights.
First, although our regional metabolic analysis is consistent with previous study showing an association of occipitoparietal hypometabolism, especially in the right hemisphere, and VH, here we also show a novel dramatic disconnection of visual occipital regions with control networks of frontal and parietal cortex (DAN, DMN, FPN). This disconnection parallels a relative hyperconnectivity between somatosensory, VAN, and limbic networks in the right hemisphere with other networks.
Second, these metabolic connectivity patterns resemble patterns of fMRI connectivity in the healthy brain. The visual network strongly correlates with other sensory and motor networks and the DAN (so-called task positive or external networks). In turn, these networks show a negative correlation with the DMN and frontoparietal networks that are positively correlated (task negative or internal networks; Hacker et al., 2013; Yeo et al., 2011). Finally, the VAN is the most independent network with weak or no correlation with internal or external networks.
Metabolic connectivity in the DLB patients without VHs resembles this healthy pattern (Fig. 3A) with a relatively segregated VAN and connectivity between visual, somatomotor, and DAN on one hand and frontoparietal and DMN on the other. Interestingly, the negative fMRI correlation between DAN and DMN (Fox et al., 2005) appears as positive metabolic connectivity.
In DLB patients with VH, the VAN becomes excessively connected vis-a-vis with other control networks, which lose internal connectivity (e.g., FPN and DMN).
From a cognitive neuroscience standpoint, the loss of interaction between DAN and visual networks may reflect the loss of top–down control necessary for normal perception (Corbetta and Shulman, 2002). Top–down signals inhibit irrelevant information in the visual field and provide priors for perception. In the absence of top–down signals, visual information stored in the association cortex may be perceived (Collerton et al., 2003; Shine et al., 2014). This is also the case in Anton syndrome.
The hyperconnectivity in the right ventral attention and limbic regions positively associated with the frequency of hallucinations may reflect a loss of signals to disengage attention (Corbetta and Shulman, 2002) from limbic signals in the insula and orbitofrontal cortex. The insula responds to salient stimuli (Menon and Uddin, 2010) and integrates internal and external states (Onofrj et al., 2019). Orbitofrontal cortical regions may mediate VHs (Hall et al., 2019; Walpola et al., 2020) as the possible source of top–down predictions for object recognition (Chaumon et al., 2014).
Conclusions
This study has several limitations, including the lack of a healthy control group, the small sample size, and the qualitative assessment of VHs. The strength lies in the novel application of graph theory to PET data to extract information on alterations of metabolic connectivity that may become pharmacological and neuromodulation targets.
In summary, VHs seem to correlate with a disconnection between visual and cognitive control regions, for both top–down prediction and shifts of attention, paired with overactivity and connectivity in the limbic system.
Footnotes
Acknowledgments
We acknowledge the invaluable support of bioengineers, informatic engineers, physicists, and mathematicians of the University of Padova and Padova Neuroscience Center. We thank Domenico Zacà and Nashiely S. Pineda Alonso from Siemens Healthcare. Finally, we also thank all the patients, their caregivers, and the referring physicians who were in any way involved with this study.
Author Disclosure Statement
No competing financial interests exist.
Funding Information
The acquisition of the PET/MR System of the University-Hospital of Padova was founded by “Fondazione Cassa di Risparmio di Padova e Rovigo” and cofounded by the Hospital of Padova. Grants FLAG-ERA JTC 2017, Progetto Cariparo 2019, and Progetto Strategico University of Padova were to M.C. This study was also supported by the “Department of excellence 2018–2022” initiative of the Italian Ministry of Education (MIUR) awarded to the Department of Neuroscience, University of Padua.
Supplementary Material
Supplementary Figure S1
Supplementary Figure S2
Supplementary Table S1
Supplementary Table S2
Supplementary Table S3
Supplementary Table S4
Supplementary Table S5
References
Supplementary Material
Please find the following supplemental material available below.
For Open Access articles published under a Creative Commons License, all supplemental material carries the same license as the article it is associated with.
For non-Open Access articles published, all supplemental material carries a non-exclusive license, and permission requests for re-use of supplemental material or any part of supplemental material shall be sent directly to the copyright owner as specified in the copyright notice associated with the article.