
Abstract
Introduction:
It is well known that even small head movements introduce artifacts in resting-state functional magnetic resonance imaging data, and over the years, numerous methods were introduced to correct for this issue. The field of robust statistics, however, has not yet received much attention in this regard. In this article, we tested a recently developed statistical method called wrapping and compared it with two already established methods: data scrubbing and an independent component analysis-based approach for the automatic removal of motion artifacts (ICA-AROMA).
Methods:
A group of N = 120 healthy adult subjects were divided into high and low movement cohorts. The functional connectomes following wrapping, data scrubbing, and ICA-AROMA of the high movement cohort were compared with the mean functional connectome of the low movement cohort.
Results and Discussion:
Our results showed that wrapping could significantly decrease the Euclidean distance between connectomes of the two cohorts. Furthermore, wrapping was able to compensate the systematic effect of increased short distance correlations and reduced long distance correlations in functional connectomes, which often result from high subject motion. Our findings suggest that wrapping constitutes a valuable approach to correct for movement-related artifacts when estimating functional connectivity in the brain.
Impact statement
The influence of subject motion on functional magnetic resonance imaging (fMRI) data is still an actively discussed topic. However, to handle this problem, the field of robust statistics has not been given much attention yet. We want to fill this void by introducing and validating a recently developed method for calculating robust correlations. Our study shows that estimating robust correlations can improve fMRI preprocessing, and documents for a wider readership that fMRI analyses can benefit from new methods in the field of robust statistics.
Introduction
The estimation of the correlation matrix represents a cornerstone in the analysis of functional connectivity in functional magnetic resonance imaging (fMRI) resting-state networks. It is well known that this estimate can be strongly influenced by head movements during scanning (Arnold et al., 2003; Friston et al., 1996; Van Dijk et al., 2012). Various algorithms have been developed to correct these artifacts, which have shown to induce systematic changes in brain connectivity (see, e.g., Maknojia et al., 2019 for a review). Interestingly, the correction of motion artifacts and the development of corresponding algorithms show many parallels in how robust statistics handles outliers and extreme data.
While early approaches in the field of fMRI such as scrubbing/censoring suggested to estimate statistics after excluding outliers (Power et al., 2012), later approaches gradually attenuate data to mitigate the effect of extreme values (Patel et al., 2014). However, classical movement correction approaches still follow a different perspective than robust statistics. Instead of cleaning up data by subtracting movement artifacts or by excluding data, robust statistics tries to estimate parameters that are not susceptible to violation of the distributional assumptions and extreme values (Maronna et al., 2006). Furthermore, robust parameters are developed with regard to clear criteria such as influence functions that systematically assess how a parameter can be biased by a single extreme value (Shevlyakov and Hannu, 2016).
In the field of fMRI, previous work developed robust statistics for nonparametric group analysis (Meriaux et al., 2006) and used robust correlation for image registration and signal detection (Kim and Fessler, 2004; Rydell et al., 2008). However, the effects of subject motion on functional connectivity have, to our knowledge, not yet been explored through robust statistics. In this article, we introduce a recently developed algorithm called wrapping to estimate more robust correlations (Raymaekers and Rousseeuw, 2019). Developed to react robustly to outliers and to have sufficient accuracy in terms of low variability, wrapping has shown to be successful for high-dimensional data such as separating movement from background in video images, but is yet to be tested on fMRI data (Raymaekers and Rousseeuw, 2019).
For this, we used a publicly available data set and split it into high and low movement groups. We performed the same initial preprocessing on all data, which already included basic motion correction through confound regression of translation and rotation parameters and their derivatives. However, confound regression is found to not be sufficient in removing artifacts introduced by motion (Parkes et al., 2018) and is often supported by other methods. Thus, we individually applied three additional motion correction methods on the high movement cohort: wrapping, scrubbing, and an independent component analysis approach of automatic removal of motion artifacts (ICA-AROMA) (Power et al., 2012; Pruim et al., 2015; Raymaekers and Rousseeuw, 2019).
We expected that wrapping would show a larger decrease in motion-related artifacts than the other approaches, which should result in more similar connectomes between the high and low movement cohorts while still maintaining the variance between individual subjects. We evaluated this hypothesis by investigating the Euclidean distances between the connectivity matrices of subjects with high and low head movement. Previous studies also showed that motion has a systematic impact on the functional connections between brain regions, where correlations between brain nodes of short physical distances are increased, while correlations between long distance nodes are decreased (Power et al., 2012, 2014). As further evidence that wrapping reduces noise related to motion, we expect wrapping to compensate these distance-dependent artifacts.
Materials and Methods
Data
We used the publicly available Washington University 120 data set provided by Power and associates (2017), which was obtained from the OpenfMRI database. Its accession number is ds000243. No IRB approval has been requested for this article because we analysed a previously published dataset. This dataset contains resting-state T2*-weighted scans (TR = 2.5 sec) acquired on a Siemens MAGNETOM Tim Trio 3T scanner with a Siemens 12-channel head coil (Erlangen, Germany). The participants were 120 healthy young adults (59 male, 61 female) aged between 18 and 32 (median 24.5), right-handed, and native English speakers. The participants were instructed to keep their eyes open and fixate a white crosshair on a black background.
Preprocessing
Preprocessing was performed using fMRIPrep 20.1.1 (Esteban et al., 2018a, 2018b), which is based on Nipype 1.5.0 (Gorgolewski et al., 2011, 2018). In the following subsections, we provide a brief summary of the preprocessing pipeline. Please refer to the Supplementary Data S1 for more detailed information provided by fMRIprep.
Anatomical data preprocessing
The T1-weighted (T1w) images were corrected for intensity nonuniformity and skull stripped. Tissue segmentation of cerebrospinal fluid (CSF), white matter (WM), and gray matter was performed, and brain surfaces were reconstructed. Spatial normalization was performed using the MNI152NLin6Asym template.
Functional data preprocessing
For each of the blood oxygenation level dependent (BOLD) runs, a reference volume and its skull-stripped version were generated with a median over a subset of motion-corrected volumes. Head-motion parameters were estimated before spatiotemporal filtering; slice-time correction, realignment, and coregistration to the T1w reference were performed. The BOLD time-series were then resampled into MNI152NLin6Asym space. Confounding time-series were calculated, but not yet removed from the data.
Additional preprocessing
Using the outputs of fMRIprep, a custom pipeline built with Python 3.7.7 was applied for further processing. The data were smoothed with a kernel of 6 mm and parcellated using the Power and associates (2011) atlas consisting of two hundred sixty-four spherical regions of interest (ROIs) with a diameter of 10 mm, from which 16 were removed as they contained data in less than 25% of voxels in the ROI for at least one subject. The resulting averaged time-series for each ROI were then standardized and detrended. With confounds provided by fMRIprep, nuisance regression was performed using six-motion (translation and rotation), WM, CSF, and global signal regressors as well as their derivatives, resulting in a total of 18 regressors. Furthermore, a bandpass filter from 0.009 to 0.08 Hz was applied. Finally, the functional connectomes were calculated from the resulting BOLD time-series using three different approaches: (1) the wrapping method for robust correlation (Raymaekers and Rousseeuw, 2019), (2) nonaggressive ICA-AROMA (performed by fMRIprep), and (3) data scrubbing for volumes with a framewise displacement (FD) greater than 0.5 mm as a lenient approach and FD >0.2 mm as a more conservative threshold. For scrubbing, we created a temporal mask that included one time point before and two time points after a spike in FD occurred (Power et al., 2012). Furthermore, identical preprocessing was performed in subject space as well as on a voxelwise basis. Details for this are described in Supplementary Data S2 and S3.
Motion correction methods
Wrapping
Due to the nature of its inner product, the Pearson correlation is very susceptible to outliers in the data (Kim et al., 2015). To counteract this effect, wrapping restrains the impact of values, which lie more than b robust standard deviations (SDs) from a robust location parameter by “folding” them inward, which is done individually for each time-series extraced from the ROIs. The wrapping function is, with the default parameters chosen in Raymaekers and Rousseeuw (2019), displayed in Figure 1. The influence of values further than b = 1.5 robust SDs away is continually reduced until their effect is eliminated for more than c = 4.0 robust SDs. Due to this behavior, the parameters b and c can be called “corner values” of the wrapping function, which is defined as
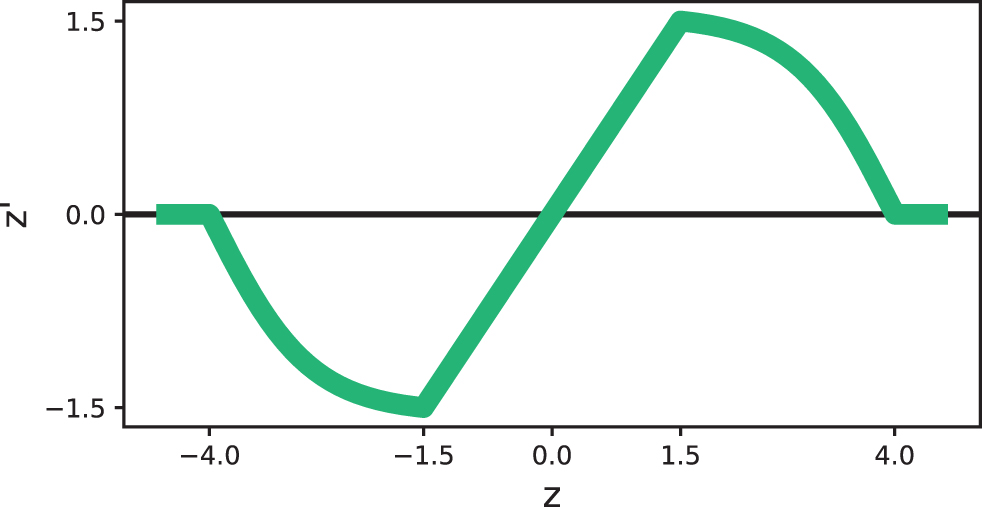
Wrapping function. The wrapping function with parameters b = 1.5 and c = 4.0. Standardized values z between −b and b will remain unchanged (for b = 1.5, under normality this would be 86.6% of data), while values between b and c are folded inward. The outputs are transformed values z′. Color images are available online.

to obtain the highest efficiency subject to a given change-of-variance sensitivity (Hampel et al., 1981).
For any given combination of b and c, the values of q1 and q2 can be derived to minimize the asymptotic variance of the function (see appendix 6 of Raymaekers and Rousseeuw, 2019 for details). The median and median absolute deviations were chosen as initial, robust estimates to calculate the location and scale parameters using a 1-step M-Estimator with the wrapping function. After the wrapping procedure, the data were then used to calculate a more robust correlation matrix with the standard Pearson's correlation coefficient. The wrapping method is described in detail in Raymaekers and Rousseeuw (2019) and is accessible through the cellWise R-package. For the usage in our pipeline, we performed a basic reimplementation of the method in Python, which is publicly accessible.
Scrubbing and ICA-AROMA
Wrapping was compared with the already established preprocessing methods of scrubbing and the more recent approach of ICA-AROMA. On the one hand, scrubbing is quite a strict approach of removing data potentially influenced by motion from the BOLD time-series. For a chosen threshold of head displacement between individual volumes of the scan (usually between 1.0 mm for task-based studies and down to 0.2 mm for resting-state data), the corresponding and adjacent volumes are completely removed from the data (Davis et al., 2016; Power et al., 2012, 2014; Satterthwaite et al., 2013). This comes at the cost of losing temporal degrees of freedom and the autocorrelation of the time-series (Carp, 2013; Yan et al., 2013). On the other hand, ICA-AROMA as an independent component (IC)-based method does not have these drawbacks. Using FSL's MELODIC, the data are decomposed into spatially ICs (Beckmann et al., 2005). A theoretically motivated, motion-specific, and pretrained classifier then identifies components as signal or noise and subsequently removes the latter from the data through an ordinary least-squares regression.
Group selection
The 120 subjects in the data set were split into two groups by performing a median split for average FD, separating them into high and low movement groups of 60 participants each. The resulting high movement group had an average FD of 0.14 mm (SD = 0.02), while the low movement cohort displayed a much lower head displacement (mean [M] = 0.07, SD = 0.03). For the high movement cohort, this resulted in 26% (FD >0.2 mm) and 4% (FD >0.5 mm) of data being marked as contaminated by motion (for the low movement cohort 5% [FD >0.2 mm] and 0.6% [FD >0.5 mm]). Both groups went through the same preprocessing pipeline, with the only difference being the application of scrubbing, wrapping, or ICA-AROMA, which were individually applied on only the high movement cohort, as the low movement cohort acted as fixed reference group. The functional connectomes of the low movement cohort were averaged and then acted as a baseline to which we compared the high movement data.
Results
Visual illustration
A visual comparison of the three motion correlation strategies is displayed for a subject of the high motion cohort (Fig. 2). For scrubbing, all frames with an FD >0.2 mm have been removed from the data (as well as one frame before and two after), which in this case corresponded to 30% of data being removed. Wrapping and ICA-AROMA did not remove scans potentially corrupted by movement, but individually adjusted the values of voxels. Figure 2 illustrates the change introduced by each method. ICA-AROMA adjusted (to varying degrees) the values of every single voxel, while wrapping was quite sparse and left a majority of data points untouched. Each method displayed individual characteristics with almost no visual overlap.

Effects of motion processing on BOLD time-series of a representative subject. Displayed are the FD and the change in the time-series after the application of the three different methods of scrubbing, wrapping, and ICA-AROMA (as demeaned and standardized BOLD-values z). The rows being the 248 parcels of the atlas and the columns being the volumes with respect to time. Top row: For FD, a horizontal line is drawn at a threshold value of 0.2 mm, which was used for scrubbing. Second to fourth row: Scrubbed frames (in this case 30% of data) were completely removed from the data, while wrapping and ICA-AROMA adjusted the values of individual voxels suspected to be influenced by motion. BOLD, blood oxygenation level dependent signal; FD, framewise displacement; ICA-AROMA, independent component analysis-based approach of automatic removal of motion artifacts. Color images are available online.
Similarity between connectomes
Figure 3 displays how the Euclidean distance changed for the different motion correction strategies. In a first step, the Euclidean distances between the connectomes of the uncorrected high movement cohort and the averaged connectome of the uncorrected low movement cohort (which served as a baseline) were computed (M = 33.51, standard error of mean [SEM] = 0.97) and called “default.” This process was repeated for all the processing methods. In a second step, two-sided permutation tests were used to compare the default distances with the distances following scrubbing, ICA-AROMA, and wrapping.
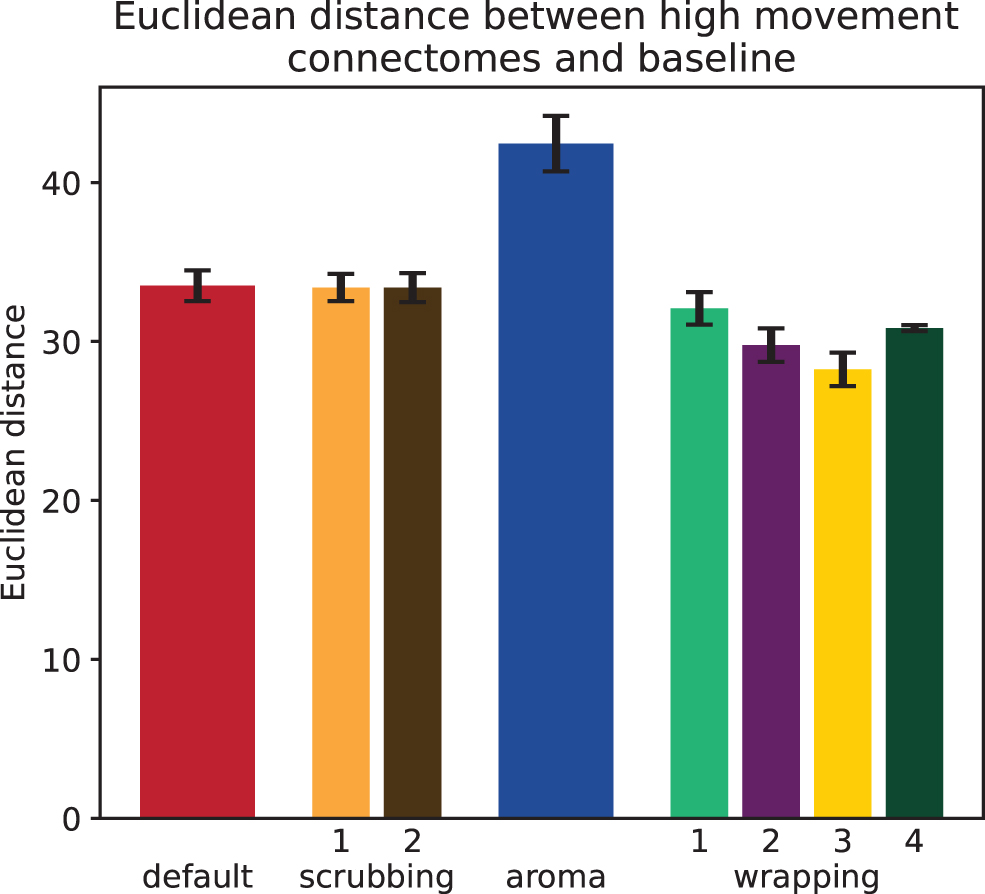
Euclidean distance between cohorts. Mean Euclidean distance (and standard error of the mean) between connectomes of high movement subjects and the averaged connectome for the low movement cohort. While scrubbing (1: FD >0.2 mm; 2: FD >0.5 mm) had no significant effect on the distance, ICA-AROMA increased the distance between the connectomes. For the wrapping procedure, the distance depended on parameters b and c of the wrapping function (b = [1.5, 1.25, 1.25, 0.75]; c = [4.0, 3.5, 3.0, 2.5]). The distance reached its minimum for the third set of parameters (b = 1.25 and c = 3.0). Color images are available online.
Our results showed that scrubbing did not significantly decrease the Euclidean distance for either the more lenient threshold of FD >0.5 mm (M = 33.39, SEM = 0.86, p = 0.06, two-sided) or for the more stringent threshold of FD >0.2 mm (M = 33.38, SEM = 0.92, p = 0.50). While ICA-AROMA significantly increased the distance between the connectomes (M = 42.45, SEM = 1.75, p < 0.001), wrapping showed a significant decrease for all parameter sets (Table 1) with a minimum in distance reached for parameter set 3 (b = 1.25, c = 3.0). For parameter set 4, the Euclidean distance increased again. However, these parameters would not have been considered for practical use since they are too stringent and served more of a demonstrative purpose.
Permutation Tests for the Euclidean Distance
SEM, standard error of mean.
Directly comparing scrubbing (FD >0.5 mm) to the weakest set of wrapping (wrap 1) showed that wrapping decreased the Euclidean distance to a larger degree (p < 0.001). Furthermore, while the distance significantly decreased, the SEMs stayed roughly constant for wrapping 1–3. For wrapping 4 the SEM collapsed, which showed a large loss of signal. Calculating the Pearson correlation coefficient between the distance vectors of individual subjects and the baseline, correlations were very high for wrapping 1–3 (r = [0.997, 0.990, 0.982]), while it decreased for wrapping 4 (r = 0.723). This evaluation was also performed in subject-space as well as on a voxelwise basis (Supplementary Data S2 and S3). The results were similar, with the only major exception being the Euclidean distance decreasing further for wrapping 4 in the voxelwise analysis.
Impact on short and long distance functional connectivity
Power and associates (2012) described the systematic effects of subject motion on correlations in functional connectivity. While many short distance correlations were increased by motion, many long distance correlations were decreased. This effect was present in our data as well and is shown in Figure 4 with scatterplots plotting the difference between functional connectomes (depending on the analysis) against the Euclidean distances between brain nodes in physical space. The slopes of the corresponding regression lines are shown in Table 2. Figure 4a shows the difference in the averaged connectomes of the high and low movement cohorts and displays a steady decrease in correlations over distance (m = −2.09 × 10⁻⁴; r 2 = 0.03). Since this effect is attributed to movement, the motion correction strategies should be able to compensate it, leading to a regression slope closer to zero.
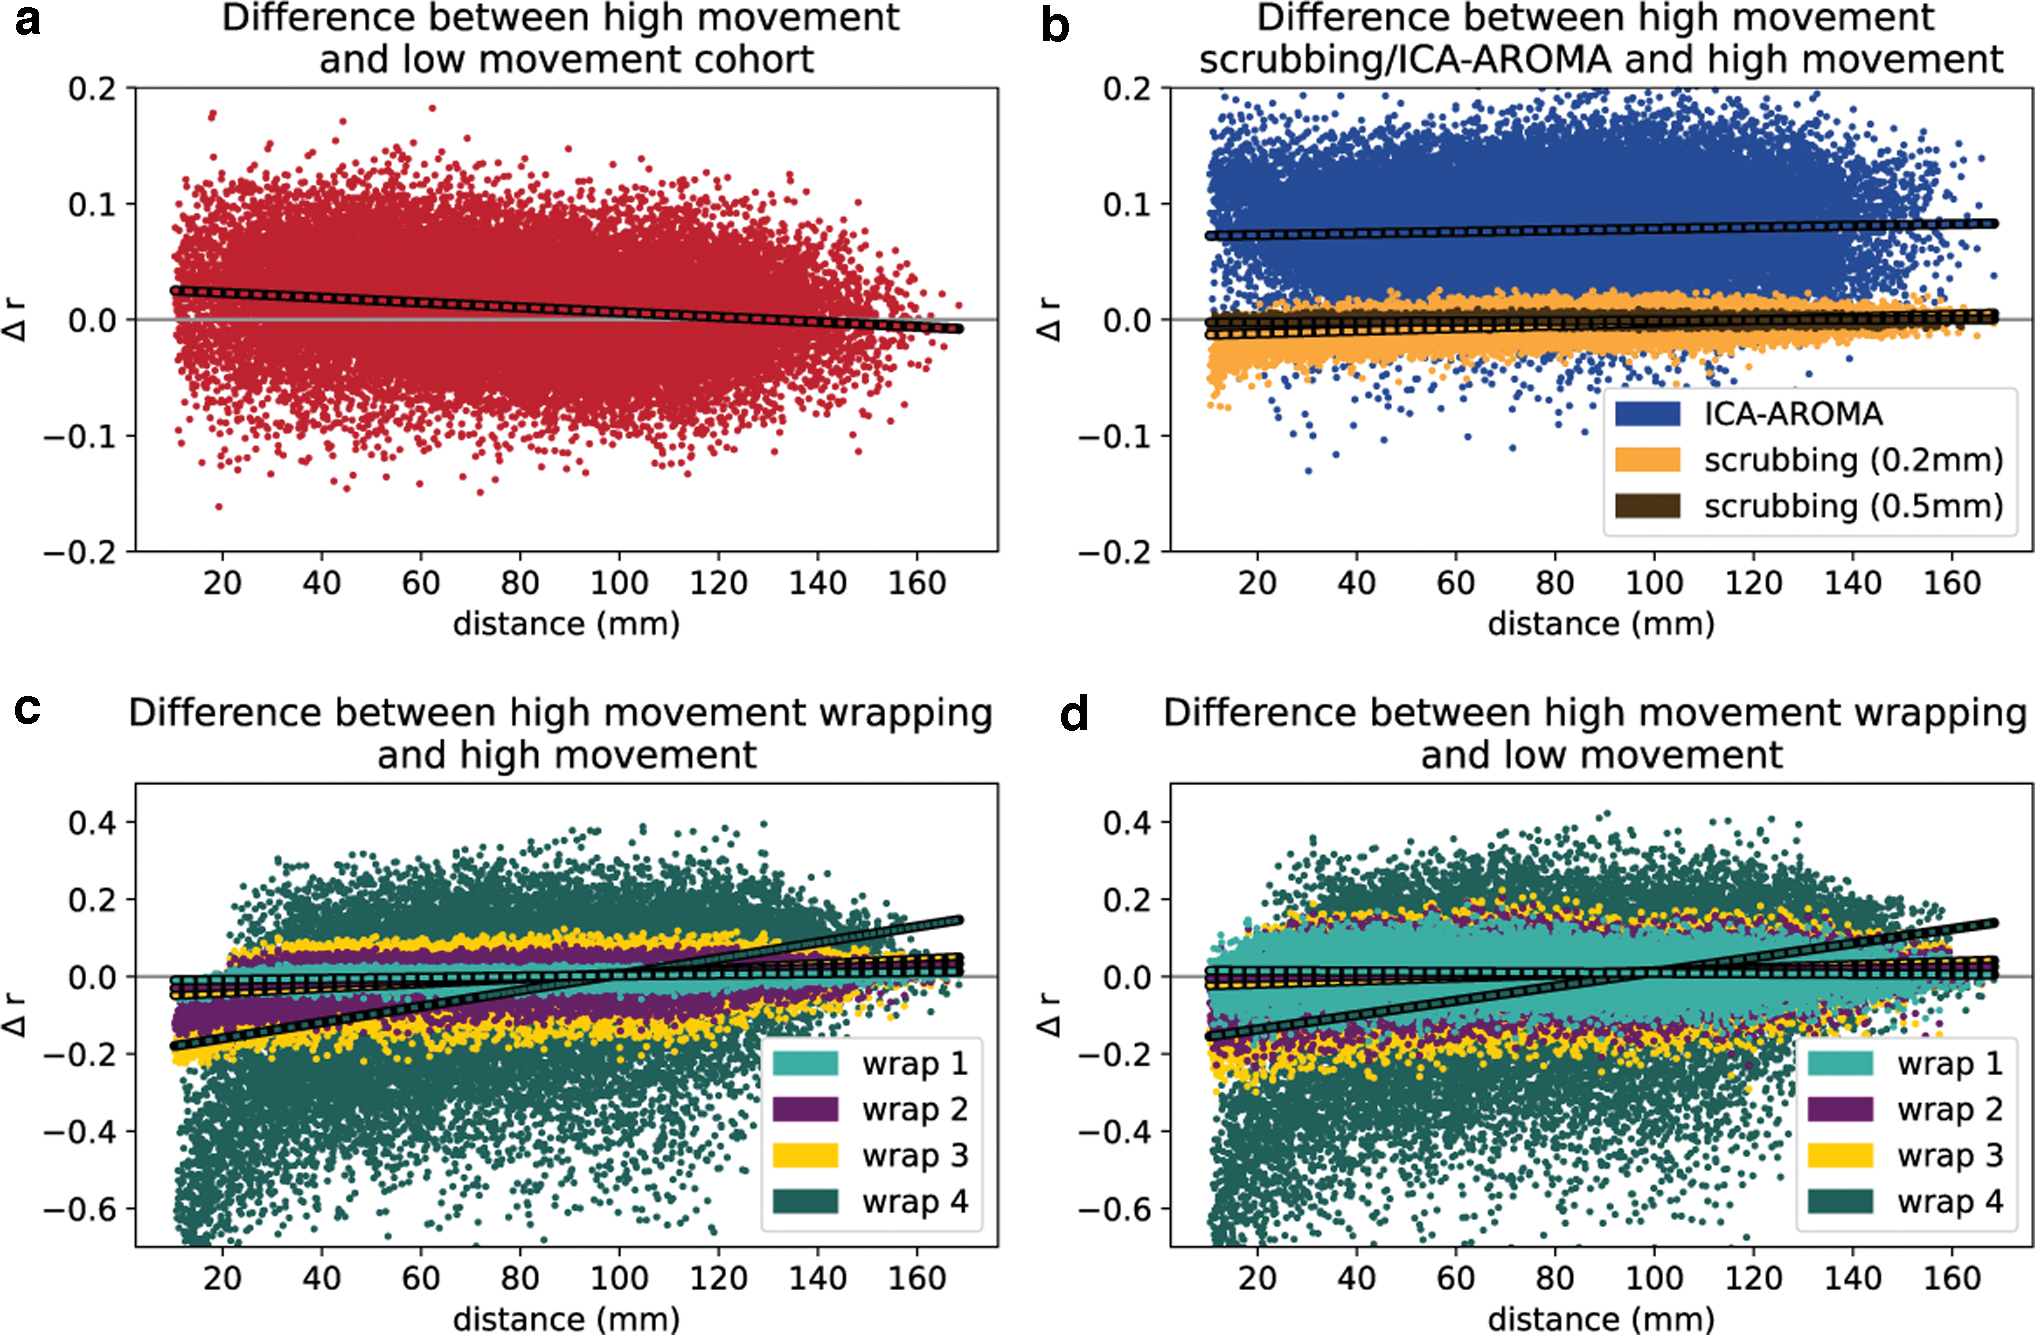
Difference between connectomes with respect to physical distance. In all four subplots, the averaged functional connectomes of the high and low movement cohorts were compared and related to the Euclidean distances between brain nodes in physical space. The regression lines were drawn as dotted lines in each plot.
Slope (m) and Degree of Determination (r 2) for the Regression Lines in Figure 4
The influence of scrubbing and ICA-AROMA on the high motion cohort can be seen in Figure 4b: Scrubbing with a threshold of 0.2 mm seemed to produce a trend in the right direction, although on a smaller scale than needed to completely remove the distance-dependent effect (with a slope of m = 1.15 × 10⁻⁴ not being large enough to compensate the slope of m = −2.09 × 10⁻⁴ between the uncorrected high and low motion cohorts shown in Table 2). On the contrary, ICA-AROMA increased the functional connectivity over the whole brain, while also displaying only a minor effect over distance. For the wrapping method, results were dependent on the chosen parameters, with a general effect of increasing slopes and scattering of data points for stricter parameters. Figure 4c shows positive slopes, which increase with decreasing values for parameters b and c. This effect of wrapping was able to cancel out the distance-dependent effect on correlations as shown in Figure 4d. The slopes of the regression line were still negative for higher wrapping parameters, but as the parameter values decreased, the slopes tended to become positive and even overcompensated for the effect shown in Figure 4a. It can be argued that in this case, a small overcompensation might be beneficial since the low movement cohort is still contaminated by motion, although to a lower degree.
With these data, two-sided Wald tests comparing the slopes of regression lines between different prepocessing approaches showed that wrapping, already for the lenient parameter set 1, compensated the distance-dependent effects more strongly than ICA-AROMA (p < 0.001) and scrubbing (independent of threshold; p < 0.001). However, due to the large sample size, the p-values did not provide more meaningful information than the slopes of the regression lines themselves. Similar effects were also observed for the evaluation in subject space and for the voxelwise analysis (Supplementary Data S2 and S3).
Discussion
We introduced wrapping as a robust way of calculating functional correlation in resting-state fMRI analysis and showed that it was able to significantly increase the similarity between the high and low movement cohorts. Multiple parameter sets were tested, starting from the initial values of b = 1.5 and c = 4.0. As this initial set already displayed a good compromise between robustness and efficiency (Raymaekers and Rousseeuw, 2019), additional parameter sets should not deviate too much from this original proposal. We therefore tested a small range of parameters to identify sets of values most suitable to correct for artifacts of head motion.
Comparing the Euclidean distance between the functional connectomes of the high movement group and the baseline, a minimum was reached for parameter set 3 (b = 1.25, c = 3.0) of the wrapping function. While scrubbing with a threshold of FD >0.5 mm showed a trend in decreasing the Euclidean distance (p = 0.06), a direct comparison between scrubbing and wrapping showed that wrapping did so to a significantly larger degree for the already weakest parameter set 1 (p < 0.001). ICA-AROMA was the only method shown to increase the Euclidean distance significantly. Furthermore, the distance vectors for wrapping 1–3 were highly correlated and their SEMs stayed roughly constant, which suggests that the variance and structure of interindividual differences were not majorly affected by wrapping.
As our second finding, similar to Power and associates (2012), we observed distance-dependent effects on functional connectivity for higher movement subjects. An evaluation of these effects showed that wrapping was able to diminish and even overcompensate this effect. The initially negative slope of the regression line in the comparison between the high and low movement cohorts (Fig. 4a) became positive when wrapping with parameters of b = 1.25 and c = 3.5 (or smaller) was applied on the high movement cohort (Table 2 and Fig. 4d). In comparison, ICA-AROMA generally increased connectivity all over the brain, independent of the distance between regions. Scrubbing volumes with an FD larger than 0.2 mm showed similar effects than a lenient version of wrapping (wrap 1 with b = 1.5, c = 4.0), but was not able to fully remove the distance-dependent effect from the data. A reason for this might have been the relatively small amount of movement in our data set. Previous findings of, for example, Power and associates (2012) showed a much larger effect of scrubbing on distance-dependent effects in the functional connectome of subjects with larger movements such as children.
In summary, our data suggested that in a sample of healthy adult subjects, wrapping successfully corrects motion-related artifacts and might even lead to better results than existing approaches. Wrapping with parameter set 2 (b = 1.25, c = 3.5) and parameter set 3 (b = 1.25, c = 3.0) both performed well in increasing the similarity between high and low movement connectomes while still maintaining within-group variance. Looking at distance-dependent effects in the functional connectome, both parameter sets performed as expected and corrected the negative slope in distance-dependent correlations, while set 3 already began to overcompensate this effect rather strongly. We therefore recommend set 2 (b = 1.25, c = 3.5) as a reasonable starting point for other evaluations. However, the effects caused by wrapping should be observed carefully, as for other types of data (e.g., children) more lenient or stronger parameters might be more suitable.
All three methods have substantially different approaches in how they handle data, which were suspected to be influenced by motion. This became particularly clear in Figure 2, where barely any visual overlap was visible. ICA-AROMA uses selected components to be regressed out of the time-series, which results in changes over all voxels. Scrubbing acts on only a subset of the time-series, but completely removes the underlying data (26% of data at a threshold of 0.2 mm and 4% at a threshold of 0.5 mm). Wrapping is different in that data are folded inward instead of completely removed, and therefore overcomes many of the drawbacks associated with data scrubbing such as the loss of temporal degrees of freedom or the autocorrelation structure of the time-series (Carp, 2013; Yan et al., 2013). In contrary to ICA-AROMA, wrapping leaves a majority of data points untouched and affects the functional connectome to a smaller degree, but has still shown to be effective in increasing the similarity toward the connectome of the low movement cohort and removing distance-dependent effects from functional connectomes.
Since functional connectivity can already be altered by small head movements (Van Dijk et al., 2012), the approach of this study comes with the apparent limitation of the low movement cohort also being affected by artifacts of motion. We argue that since the high movement group displayed more than twice as much motion as the low movement group, motion correction methods should affect higher motion data to a larger degree and therefore still be able to decrease motion-dependent differences between both cohorts.
Conclusion
As Figures 3 and 4 show, wrapping seems to successfully reduce systematic differences between the two groups, which supports our hypothesis and could act as a foundation of subsequent research. Furthermore, robust statistics might not only improve the estimation of links within brain networks but might also inspire other parts of preprocessing and the statistical analysis of brain connectivity to cope with motion-induced artifacts.
Footnotes
Acknowledgments
We thank Steve Petersen and Brad Schlaggar for releasing the investigated data for public use.
Authors' Contributions
C.G., M.B., and C.M.T. conceptualized and designed the study. M.B. performed the main data analysis and took the lead in writing the article with contributions from C.G. and C.M.T.
Author Disclosure Statement
No competing financial interests exist.
Funding Information
No funding was received for this article.
Supplementary Material
Supplementary Data S1
Supplementary Data S2
Supplementary Data S3
References
Supplementary Material
Please find the following supplemental material available below.
For Open Access articles published under a Creative Commons License, all supplemental material carries the same license as the article it is associated with.
For non-Open Access articles published, all supplemental material carries a non-exclusive license, and permission requests for re-use of supplemental material or any part of supplemental material shall be sent directly to the copyright owner as specified in the copyright notice associated with the article.