
Abstract
Introduction:
Electrophysiological and neuroimaging studies have demonstrated that large-scale brain networks are affected during the development of epilepsy. These networks can be investigated by using diffusion magnetic resonance imaging (dMRI). The most commonly used model to analyze dMRI is diffusion tensor imaging (DTI). However, DTI metrics are not specific to microstructure or pathology and the DTI model does not take into account crossing fibers, which may lead to erroneous results. To overcome these limitations, a more advanced model based on multi-shell multi-tissue constrained spherical deconvolution was used in this study to perform tractography with more precise fiber orientation estimates and to assess changes in intra-axonal volume by using fixel-based analysis.
Methods:
dMRI images were acquired before and at several time points after induction of status epilepticus in the intraperitoneal kainic acid (IPKA) rat model of temporal lobe epilepsy. Tractography was performed, and fixel metrics were calculated in several white matter tracts. The tractogram was analyzed by using the graph theory.
Results:
Global degree, global and local efficiency were decreased in IPKA animals compared with controls during epileptogenesis. Nodal degree was decreased in the limbic system and default-mode network, mainly during early epileptogenesis. Further, fiber density (FD) and fiber-density-and-cross-section (FDC) were decreased in several white matter tracts.
Discussion:
These results indicate a decrease in overall structural connectivity, integration, and segregation and decreased structural connectivity in the limbic system and default-mode network. Decreased FD and FDC point to a decrease in intra-axonal volume fraction during epileptogenesis, which may be related to neuronal degeneration and gliosis.
Impact statement
To the best of our knowledge, this is the first longitudinal multi-shell diffusion magnetic resonance imaging study that combines whole-brain tractography and fixel-based analysis to investigate changes in structural brain connectivity and white matter integrity during epileptogenesis in a rat model of temporal lobe epilepsy. Our findings present better insights into how the topology of the structural brain network changes during epileptogenesis and how these changes are related to white matter integrity. This could improve the understanding of the basic mechanisms of epilepsy and aid the rational development of imaging biomarkers and epilepsy therapies.
Introduction
Epilepsy is a neurological disorder characterized by recurrent epileptic seizures, and it affects more than 50 million people worldwide (Fisher et al., 2005; Kwan and Brodie, 2000). In about one third of patients, seizures cannot be suppressed with anti-epileptic drugs, that is, they suffer from drug-resistant epilepsy. One of the most prevalent types of drug-resistant epilepsy is temporal lobe epilepsy (TLE; Engel Jr, 2014). This type of epilepsy is often the result of an initial precipitating insult, such as stroke, head trauma, infection, brain tumor, or status epilepticus (SE), that is, a prolonged, uncontrolled seizure. The transformation process of a normal brain into an epileptic brain is called epileptogenesis (Goldberg and Coulter, 2013). Studies investigating brain connectivity have demonstrated that large-scale brain networks are affected during epileptogenesis. Obtaining more knowledge about these networks could improve our understanding of the disease mechanisms and help to develop new therapies (Tavakol et al., 2019).
When investigating brain connectivity, a distinction can be made between structural connectivity, the “hardware” of the brain, and functional connectivity, the “software” that uses the hardware to execute specific tasks. Many studies have investigated functional connectivity in epilepsy (for review, see Xiao et al., 2017), but the research into structural connectivity is more limited, even though integrating the functional and structural changes could provide more accurate information about the epileptogenic process. In this article, we will focus on structural connectivity, assessed by using diffusion magnetic resonance imaging (dMRI). dMRI is an imaging technique that can be used to map the microstructure and structural integrity of the brain. Using diffusion tensor imaging (DTI), studies investigating epilepsy found extensive and bilateral alterations in white matter tracts and mainly reported decreased fractional anisotropy (FA) and increased diffusivity (Gross, 2011; Otte et al., 2012; Tavakol et al., 2019). Using DTI-based tractography, most studies found decreased structural connectivity and decreased global and local efficiency in the structural brain network (Bernhardt et al., 2019; DeSalvo et al., 2014; Kamiya et al., 2016; Liao et al., 2011).
Disadvantages of DTI are that the metrics are not specific to microstructure or pathology and difficult to interpret (Jones et al., 2013). In addition, this model does not take into account that many voxels contain crossing or kissing fibers, leading to diffusion metrics that may not be fiber-specific and even erroneous (Jeurissen et al., 2014; Raffelt et al., 2017). A model that can overcome this limitation is multi-shell multi-tissue constrained spherical deconvolution (MSMT-CSD). Using this model, fiber orientation distribution functions can be estimated and whole-brain fiber tractography can be performed with more precise fiber orientation estimates (Jeurissen et al., 2014). Based on the tractography, structural brain networks can be investigated. The few studies that investigated epilepsy using this technique reported decreased structural connectivity in patients with TLE (Besson et al., 2014).
Using the MSMT-CSD model, it is also possible to obtain information about specific fiber populations within a voxel, referred to as a fixel (

Representation of a normal axon bundle (black) containing axons (blue). The grid (gray) represents imaging voxels. In this example of pathological changes in fixel metrics, FD, FC, and FDC are decreased compared with a normal axon bundle. Adapted from Raffelt et al. (2017). FC, fiber-bundle cross-section; FD, fiber density; FDC, fiber-density-and-cross-section.
In this study, changes in structural brain connectivity and white matter integrity during epileptogenesis were investigated by using whole-brain tractography and FBA based on the MSMT-CSD model in the intraperitoneal kainic acid (IPKA) rat model for TLE. Diffusion magnetic resonance (MR) images were acquired before SE and at multiple time points (1, 3, 11 and 16 weeks) post-SE in IPKA animals and age-matched controls. The aim of this study was twofold: (1) to investigate how the structural brain network changes during epileptogenesis and which brain regions are affected most and (2) whether the changes in network topology are related to changes in white matter integrity, assessed using FBA. To the best of our knowledge, this is the first longitudinal dMRI study that combines analysis of structural connectivity and FBA in a rat model of TLE.
Materials and Methods
Animals
Sixteen adult male Sprague–Dawley rats (238 ± 11 g body weight at SE induction; Envigo, The Netherlands) were included in this study. All animals were treated according to European guidelines (directive 2010/63/EU), and the protocol was approved by the local Ethical Committee on Animal Experiments of Ghent University (ECD 16/31). The animals were housed under controlled laboratory conditions (12 h normal light/dark cycles, 20–23°C and 40–60% relative humidity) with food (Rats and Mice Maintenance, Carfil, Belgium) and water ad libitum. The animals were housed individually in type III H cages (Tecniplast, Australia) on wood-based bedding (Carfil, Belgium). Paper nesting material (Nesting, Carfil, Belgium) and a gnawing wood (M-brick, Carfil, Belgium) were added to the cages for enrichment.
Status epilepticus
In nine animals (8 weeks old), kainic acid (KA; Tocris Bioscience, UK) was injected intraperitoneally [5 mg/(kg·h)] according to the protocol of Hellier et al. (1998). KA was injected every hour until motor seizures were induced for 3 h or longer, called SE. On average, 13.6 mg/kg KA (range: 10–20 mg/kg) was administered to the animals. The remaining seven animals were used as control group.
Image acquisition
Anatomical and diffusion-weighted MR images were acquired in nine IPKA animals and seven control animals before the induction of SE, twice during early (1 and 3 weeks post-SE, seizures are rare) and twice during late epileptogenesis (11 and 16 weeks post-SE, frequent seizures). One of the IPKA animals died before the final scanning session. During the scanning sessions, the animals were anesthetized with isoflurane (5% for induction, 2% for maintenance; Isoflo, Zoetis, USA) and O2. If necessary, isoflurane was lowered gradually to a minimum of 0.5% to maintain a respiratory rate of 0.7 to 1 per second. Respiration was monitored by using a pressure sensor, and a circulating-water heating pad and bubble wrap were used to control body temperature. The magnetic resonance imaging (MRI) scans were performed on a 7T system (PharmaScan; Bruker, Germany) by using a transmit-receive volume coil (Bruker). First, a T2-weighted anatomical image was acquired by using a Rapid Acquisition with Refocused Echoes (RARE) sequence with repetition time (TR) 5.5 sec, TE 37 ms, RARE factor 8, field-of-view (FOV) 25 × 25 mm2, in-plane resolution 109 × 109 μm2, slice thickness 600 μm, 45 slices, and acquisition time 12 min. Then, 3 diffusion-weighted MR images were acquired by using spin-echo echo-planar imaging (EPI) with 32, 46, and 64 gradient directions, b values of 800, 1500, and 2000 sec/mm2, and 5, 5, and 7 b0 images, respectively, with TR 6.250 sec, TE 24 ms, 4 EPI segments, FOV 30 × 30 mm2, in-plane resolution 333 × 333 μm2, slice thickness 500 μm, interslice distance 600 μm, 25 slices, and total acquisition time 65 min.
Electrode implantation and electroencephalography recording
To record electroencephalography (EEG), electrodes were implanted in both hippocampi on average 22 weeks post-SE (range 21–23 weeks) in the IPKA group (n = 8). Bipolar recording electrodes were placed stereotactically in both hippocampi (anterior-posterior −5.3 mm, medial-lateral ±3.2 mm relative to bregma, dorsal-ventral about −3.0 mm relative to brain surface). The Rat Brain Atlas by Paxinos and Watson (2013) was used to select the coordinates.
To ensure that all animals in the IPKA group had spontaneous seizures, EEG was recorded for 8 consecutive days in awake and freely moving animals. The IPKA animals were connected to the EEG setup 2–3 weeks after surgery. Electrographic seizures, defined as a repetitive pattern (>2 Hz) of complex, high-amplitude EEG spikes, longer than 5 sec, were annotated by an experienced investigator. The first 36 h of EEG recording were considered an acclimatization period and were not included in further analysis. The average number of seizures/day was calculated based on the last 6 days of the EEG recording.
Image preprocessing
Diffusion images were preprocessed by using MRtrix3 (Tournier et al., 2019) and the ExploreDTI toolbox version 4.8.6. (Leemans et al., 2009). First, the three shells were concatenated and noise correction and Gibbs ringing correction were performed by using the dwidenoise and mrdegibbs commands in MRtrix3. Next, the images were corrected for EPI, eddy current, and motion distortion in ExploreDTI. In MRtrix3, response functions were estimated for white matter, gray matter, and cerebrospinal fluid by using the command dwi2response dhollander. Then, fiber orientation distributions (FOD) were estimated by using MSMT-CSD with the MRtrix3 command dwi2fod. Bias field correction and intensity normalization were performed on the FOD images by using the command mtnormalise. Next, the images were registered and warped to an FOD template with reorientation. This template was calculated based on the FOD images of the IPKA animals 3 weeks post-SE.
Structural connectome
Whole-brain tractography was performed with the tckgen command in MRtrix by using the probabilistic iFOD2 algorithm. Streamlines were seeded from 5 million seeds, the FOD cutoff value was set at 0.25, and a step size of 15 μm was used. Then, the command tcksift2 was used to filter out streamlines to obtain a better match between the tractogram and fixel-wise fiber densities.
A structural connectome, or graph, was constructed with 38 predefined regions of interest (ROIs) as nodes and the number of streamlines that cross each pair of ROIs as edges. The ROIs, listed in Table 1, were drawn manually based on T2-weighted anatomical images and FOD template. Each region has a component on the left and right side of the brain. The number of streamlines crossing each pair of ROIs was calculated by using the command tck2connectome in MRtrix3.
Regions of Interest Used for the Construction of the Structural Brain Network
ROIs, regions of interest.
Graph theoretical network metrics were calculated for each graph by using a Graph Theoretical Analysis Toolbox (Wang et al., 2015). First, a threshold was applied to the network to remove the weakest connections. Several thresholds were used to obtain a network density (i.e., the number of remaining connections divided by the maximum number of possible connections) ranging from 20% to 50% with a 5% interval. The following weighted network metrics were then calculated for each network density and averaged: degree, characteristic path length, global efficiency, clustering coefficient, and local efficiency. Degree or connection strength is the sum of the edges linked to a node. It is an indication of centrality or the importance of a region in the structural network. Characteristic path length is the mean number of edges between two nodes in the network, and global efficiency is the mean inverse path length between two regions. These are measures of integration in the network or the overall efficiency of the network. Clustering coefficient is the ratio of neighbors of a node that are also linked to one another and local efficiency is the average inverse path length within the neighborhood of a node, that is, the nodes linked to that node. These are measures of segregation or local interconnectivity (Rubinov and Sporns, 2010; Wang et al., 2010).
Fixel-based analysis
For the FBA, a new FOD template was constructed based on the baseline images of all animals. To obtain an isotropic resolution, voxel size of the template was changed to 0.3 × 0.3 × 0.3 mm3. The individual normalized FOD images were registered and warped to the template without reorientation by using the mrregister and mrtransform commands in MRtrix3. Then, a fixel mask was constructed by using the fod2fixel command. For each scan, FD was calculated by using the fod2fixel command and FC was calculated based on the warp that was computed during the image registration by using the warp2metric command. In addition, the combined metric FD and cross-section was calculated. These metrics were analyzed at two levels: using FBA and using ROI-based analysis. For FBA, whole-brain tractography was performed on the baseline template by using an FOD cutoff value of 0.325 and a step size of 15 μm, leading to 2 million streamlines. The tractogram was filtered by using the command tcksift. For the ROI-based analysis, six white matter tracts were extracted from the tractogram by using the tck2connectome command: anterior commissure, corpus callosum, cingulum, internal and external capsule, and fimbria. These tracts were selected, because they were the most prominent white matter bundles in the whole-brain tractography. The tracts were converted to ROIs by using the tckmap command and manually corrected for stray streamlines and enlarged ventricles at later time points. Then, average FD, FC, and FDC were calculated for each ROI.
Volume of enlarged ventricles
On the T2-weighted images, it was clear that the size of the ventricles increased during epileptogenesis. To measure the change in ventricular volume, ventricles were manually delineated on the T2-weighted images by using mrview in MRtrix3.
Statistical analysis
The global and nodal network metrics and the fixel-based metrics in white matter tracts were analyzed by using the MIXED procedure (linear mixed-effects model) in IBM SPSS Statistics for Windows, version 26 (IBM Corp., NY) using the protocol of Duricki et al. (2016). The covariance structure was “compound symmetry,” group (IPKA and control animals), time (baseline, 1, 3, 11, and 16 weeks post-SE) and group-by-time interaction were fixed factors. Ventricular volume was used as a covariate. Significant effects and interactions were investigated by using least-significant-difference tests, and to correct for multiple comparisons, the Bonferroni correction was used. A significance level of 0.05 was used for main effects and interactions for the analysis of the global metrics; for nodal degree, a significance level of 0.0026 was used to correct for multiple comparisons between nodes; and for the fixel metrics in white matter tracts, a significance level of 0.0083 was used to correct for multiple comparisons between tracts. Ventricular volume was analyzed in the same way, but without covariate and with a significance level of 0.05.
For FBA, differences in fixel metrics between groups were analyzed at each time point by using the fixelcfestats command in MRtrix3, which uses connectivity-based fixel enhancement and non-parametric permutation testing. The significance level after family-wise error rate correction was 0.05.
Correlations between global degree, global and local efficiency post-SE on the one hand and FD, FC, and FDC post-SE, averaged over the white matter tracts, on the other hand were analyzed by using the Pearson correlation coefficient. A significance level of 0.008 was used to correct for multiple comparisons between parameters. Correlations of global network metrics, nodal network metrics, and fixel metrics with seizure frequency were assessed by using Spearman's rank correlation coefficient.
Results
Ventricular volume
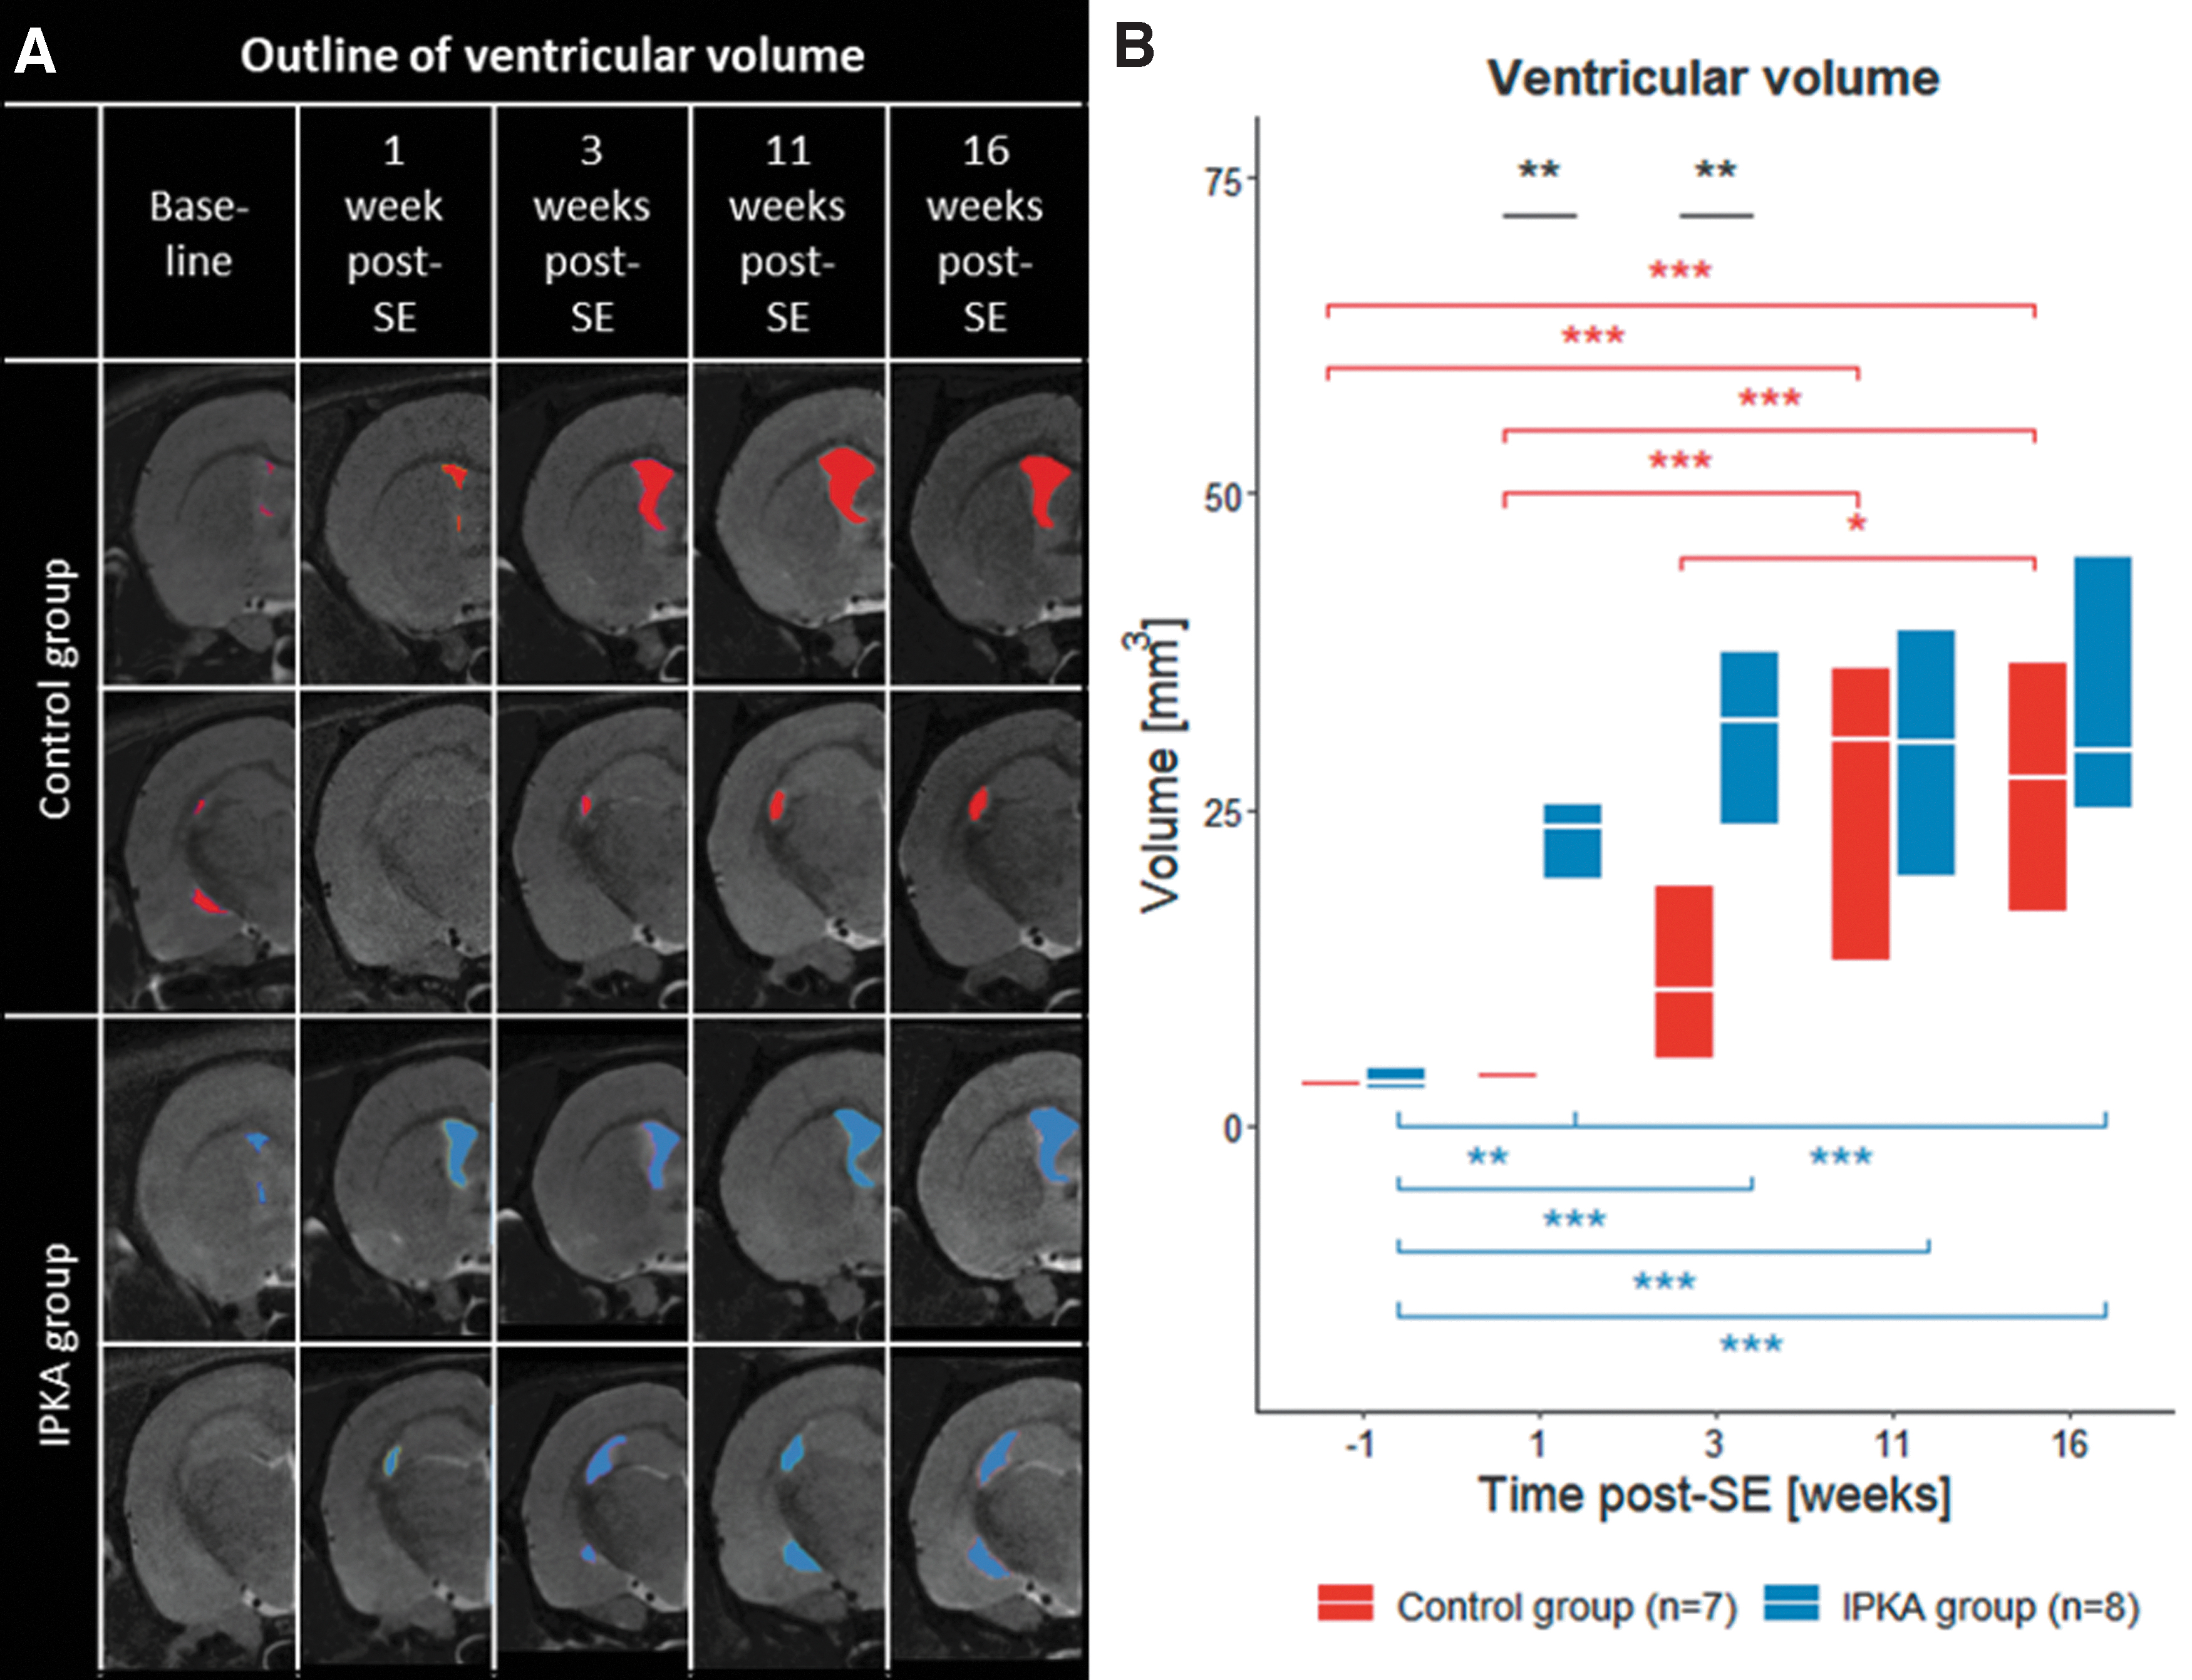
In Figure 2A, a T2 scan of a representative animal of each group at each time point is shown with delineation of the ventricles. Statistical analysis of the ventricular volume showed a significant group-by-time interaction (F 4,57.835 = 4.426, p = 0.003). Ventricular volume was significantly higher in the IPKA group compared with the control group during early epileptogenesis (1 and 3 weeks post-SE). During late epileptogenesis (11 and 16 weeks post-SE), ventricular volume was still increased in the IPKA group. In addition, there was a significant increase in ventricular volume in the control group (Fig. 2B).
Global network metrics
Changes in global network metrics during epileptogenesis are visualized in Figure 3. A significant group-by-time interaction was found for global degree, characteristic path length, global and local efficiency (F 4,47.315 = 7.919, p < 0.001; F 4,46.555 = 9.196, p < 0.001; F 4,46.808 = 6.840, p < 0.001; F 4,47.264 = 7.086, p < 0.001, respectively), but not for clustering coefficient (F 4,47.779 = 0.978, p = 0.429). Degree, global and local efficiency were significantly lower and characteristic path length was significantly higher in the IPKA group compared with the control group 1, 3, and 16 weeks post-SE.

Changes in global network metrics during epileptogenesis in IPKA group and control group: global degree, characteristic path length, global efficiency, and local efficiency. Data are visualized as a boxplot with median and interquartile range (*p < 0.05, **p < 0.01, ***p < 0.001).
Nodal degree
A significant group-by-time interaction was found for nodal degree in the hippocampus, subiculum, thalamus, septum, dorsolateral orbitofrontal cortex, globus pallidus, nucleus accumbens, somatosensory cortex, cingulate cortex, and caudate putamen (Table 2). In the hippocampus, subiculum, thalamus, septum, dorsolateral orbitofrontal cortex, globus pallidus, and nucleus accumbens (Fig. 4A), nodal degree was significantly lower in the IPKA group compared with the control group during early epileptogenesis. During late epileptogenesis, degree increased significantly in these regions in the IPKA group compared with early epileptogenesis. In the somatosensory cortex, cingulate cortex, and caudate putamen (Fig. 4B), degree was significantly lower in the IPKA group compared with the control group or significantly decreased during both early and late epileptogenesis.
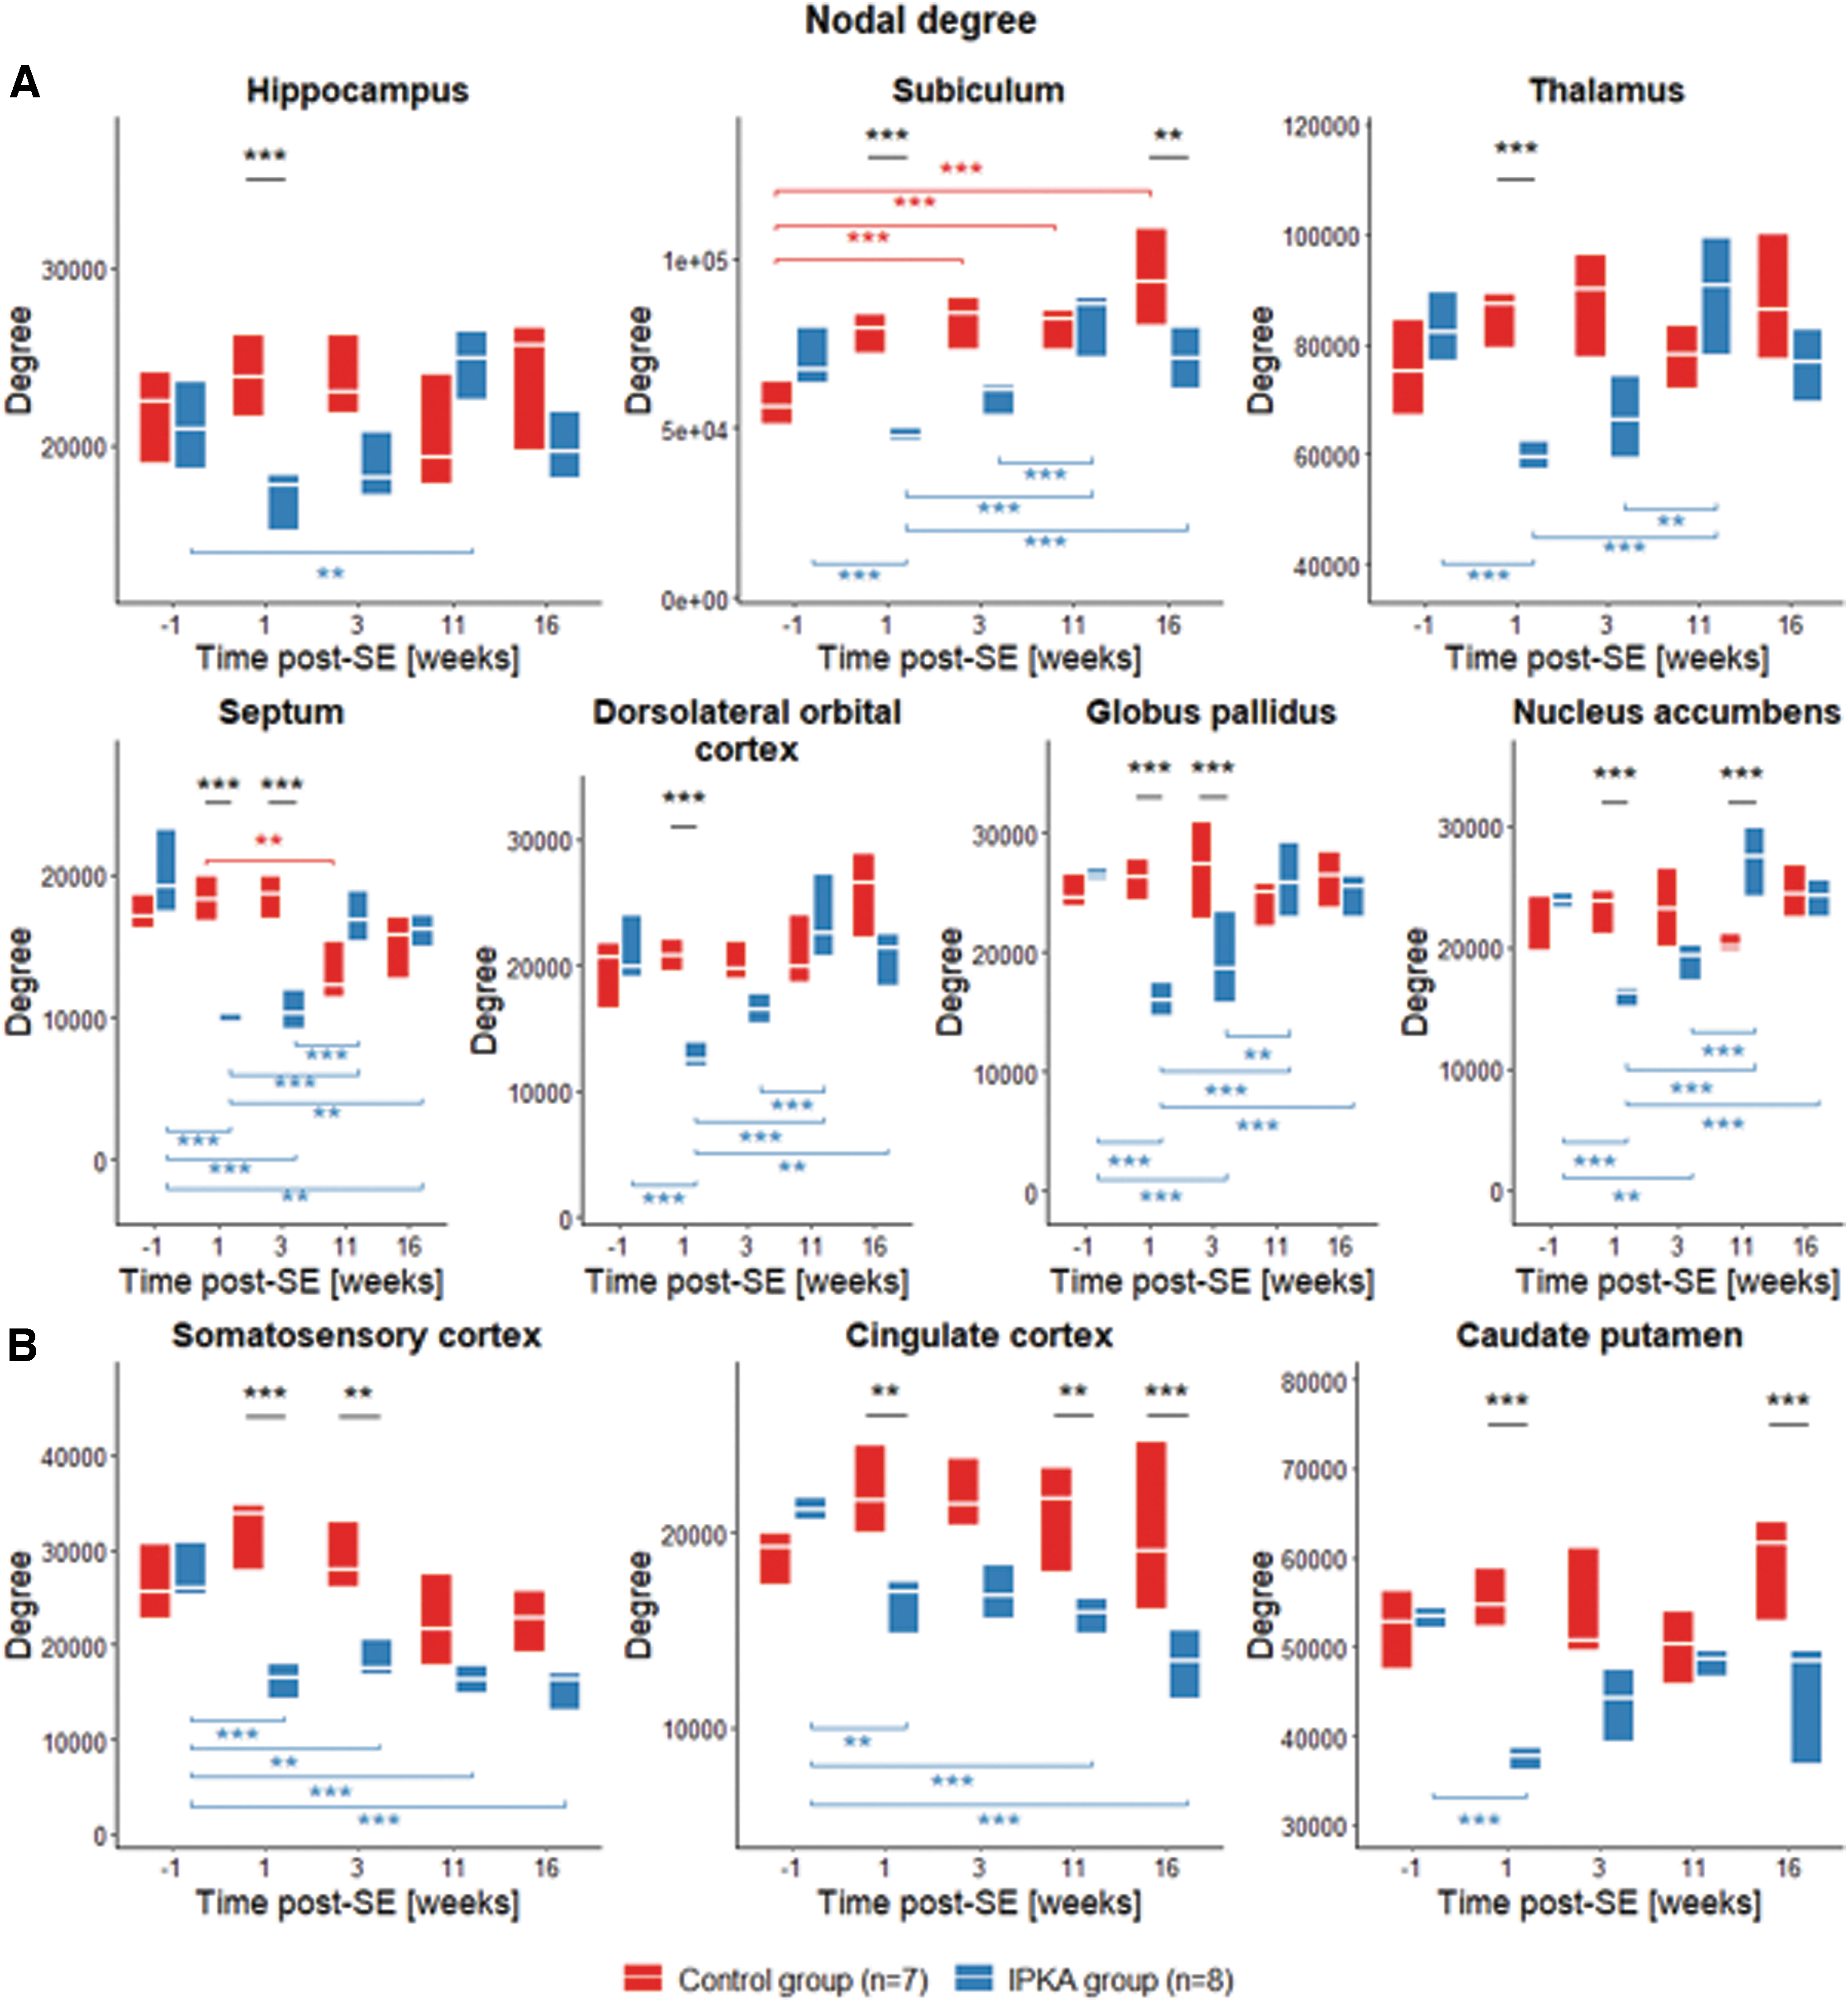
Changes in nodal degree during epileptogenesis in IPKA group and control group in
Results of Statistical Analysis Using Linear Mixed-Effects Model of Nodal Degree
Fixel metrics in white matter tracts
Fixel metrics were analyzed by using FBA and ROI-based analysis. The white matter tracts under investigation are visualized in Figure 5, overlaid on the template FOD image. Using FBA, fixels in which FD, FC, and FDC were significantly different between IPKA animals and controls during early (1 and/or 3 weeks post-SE) and late epileptogenesis (11 and/or 16 weeks post-SE) were identified. The white matter tracts containing these fixels are visualized in Figure 6. Changes in fixel metrics in white matter tracts over time were assessed by using an ROI-based analysis. Average FD, FC, and FDC were calculated for each tract and significant differences were identified by using a linear mixed-effects model. In Figure 7, changes in FDC during epileptogenesis in anterior commissure, corpus callosum, and fimbria are visualized.
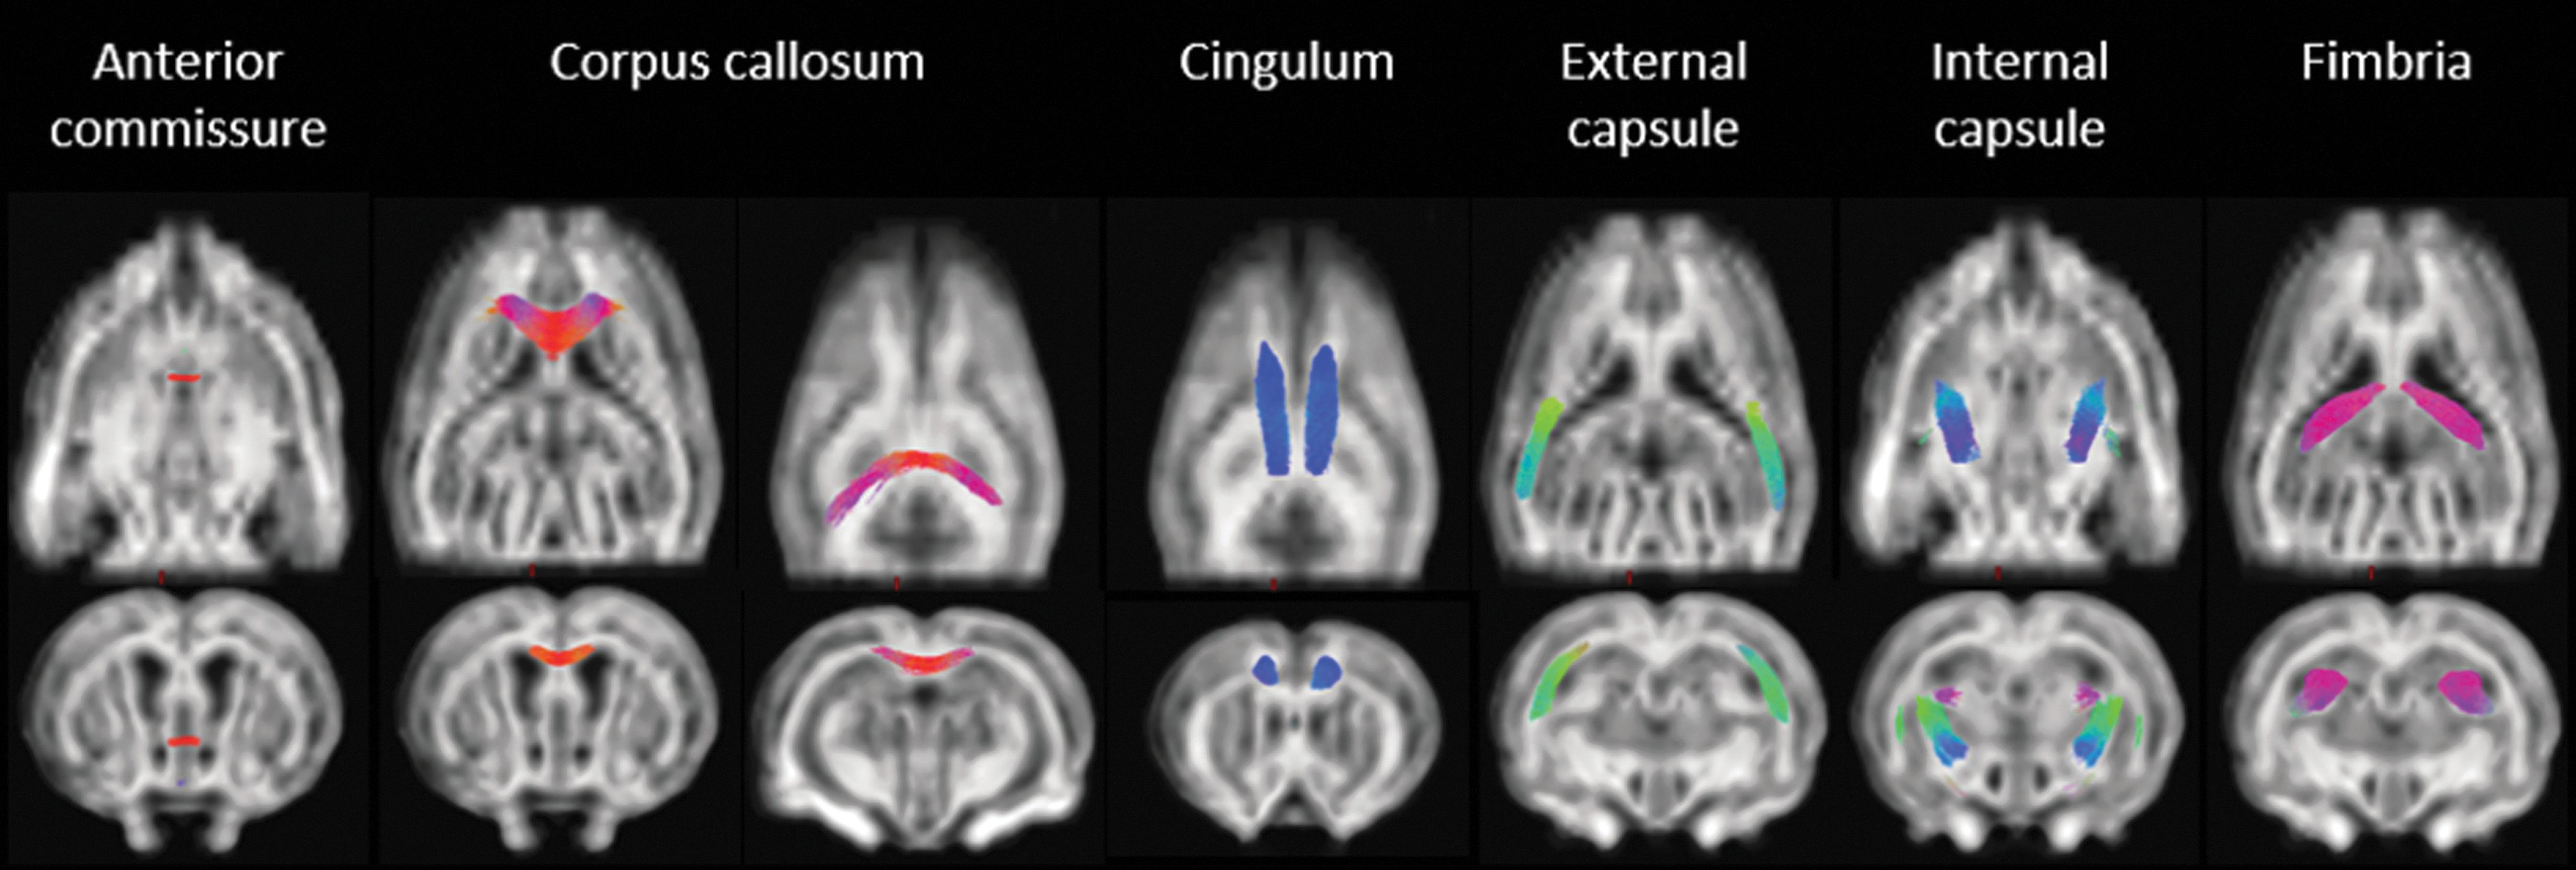
White matter tracts overlaid on FOD image of template: anterior commissure, corpus callosum, cingulum, external capsule, internal capsule, and fimbria.
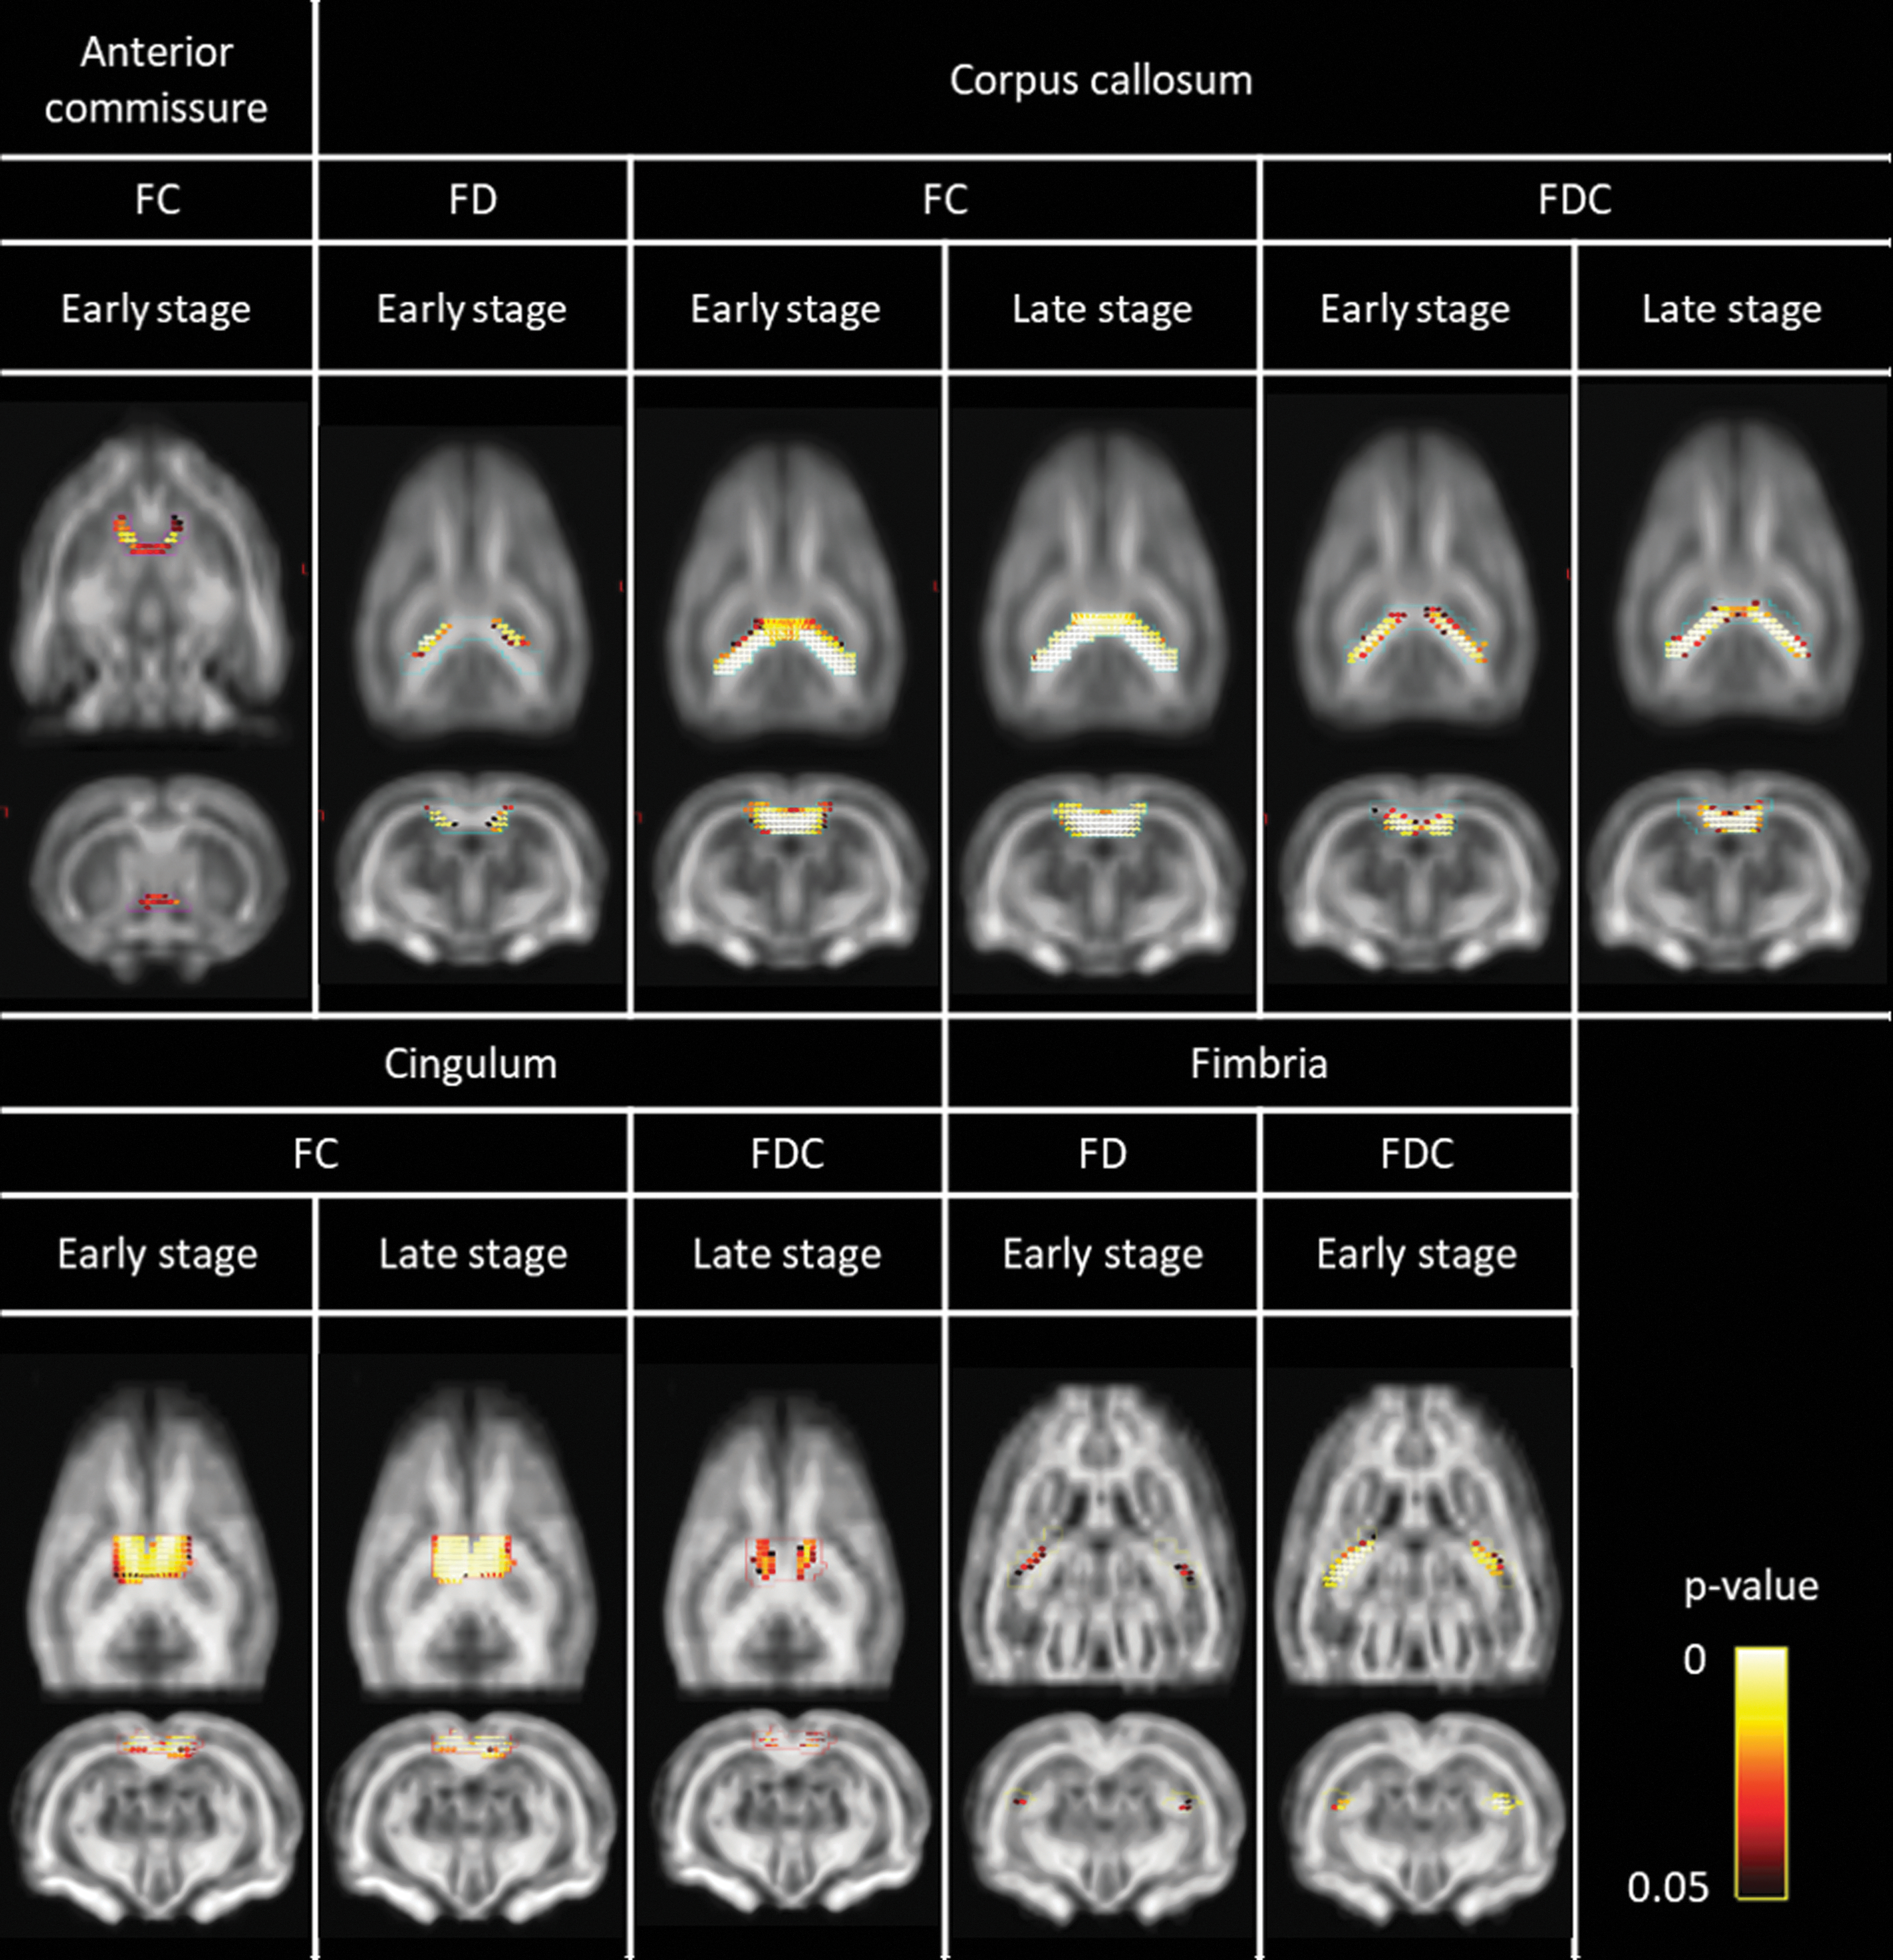
White matter tracts containing fixels in which FD, FC, and FDC are significantly lower in the IPKA group compared with controls during early (1 and/or 3 weeks post-SE) and late epileptogenesis (11 and/or 16 weeks post-SE), identified by using FBA. Colors represent FWE-corrected p values. FBA, fixel-based analysis; FWE, family-wise error rate.

Changes in FDC during epileptogenesis in anterior commissure, corpus callosum, and fimbria. Data are visualized as a boxplot with median and interquartile range (**p < 0.01, ***p < 0.001).
The FBA revealed a significantly lower FC in the IPKA group in anterior commissure during early epileptogenesis (Fig. 6). Using ROI-based analysis, a significant group-by-time interaction was found for FC and FDC (F 4,49.6 = 4.76, p = 0.002 and F 4,49.6 = 4.44, p = 0.004, respectively). The FC and FDC were significantly lower in the IPKA group compared with the control group during early epileptogenesis (Fig. 7).
In corpus callosum, FBA showed that FD was significantly lower in the IPKA group compared with the control group during early epileptogenesis, whereas FDC was significantly lower in the IPKA group during both early and late epileptogenesis (Fig. 6). This was also observed by using ROI-based analysis, as there was a significant group-by-time interaction for FD and FDC (F 4,49.4 = 7.45, p < 0.001 and F 4,50.3 = 5.69, p = 0.001, respectively; Fig. 7).
In cingulum, FBA revealed that FC was significantly lower in the IPKA group compared with the control group during early and late epileptogenesis, and that FDC was significantly lower in the IPKA group during late epileptogenesis (Fig. 6). No significant group-by-time interaction was found for cingulum by using ROI-based analysis.
Neither FBA nor ROI-based analysis revealed any significant differences or changes in the external capsule.
In the internal capsule, no significant differences in fixel metrics could be demonstrated by using FBA. However, a significant group-by-time interaction was found for FD (F 4,48.6 = 0.007) by using ROI-based analysis. The FD was significantly lower in the IPKA group compared with the control group during late epileptogenesis.
The FBA revealed that in fimbria, FD and FDC were significantly lower in the IPKA group compared with the control group during early epileptogenesis (Fig. 6). This was also demonstrated using ROI-based analysis, where a significant group-by-time interaction was found for FD and FDC (F 4,49.9 = 7.55, p < 0.001 and F 4,50.1 = 4.43, p = 0.003, respectively; Fig. 7).
Correlations between network metrics and fixel metrics
In Figure 8, correlations between the network metrics global degree, global and local efficiency post-SE and the fixel metrics FD, FC, and FDC are visualized. Degree, global and local efficiency were positively correlated with FC and FDC in the IPKA group and with FD and FDC in the control group. In both groups, the correlation between network metrics and FDC was strongest.
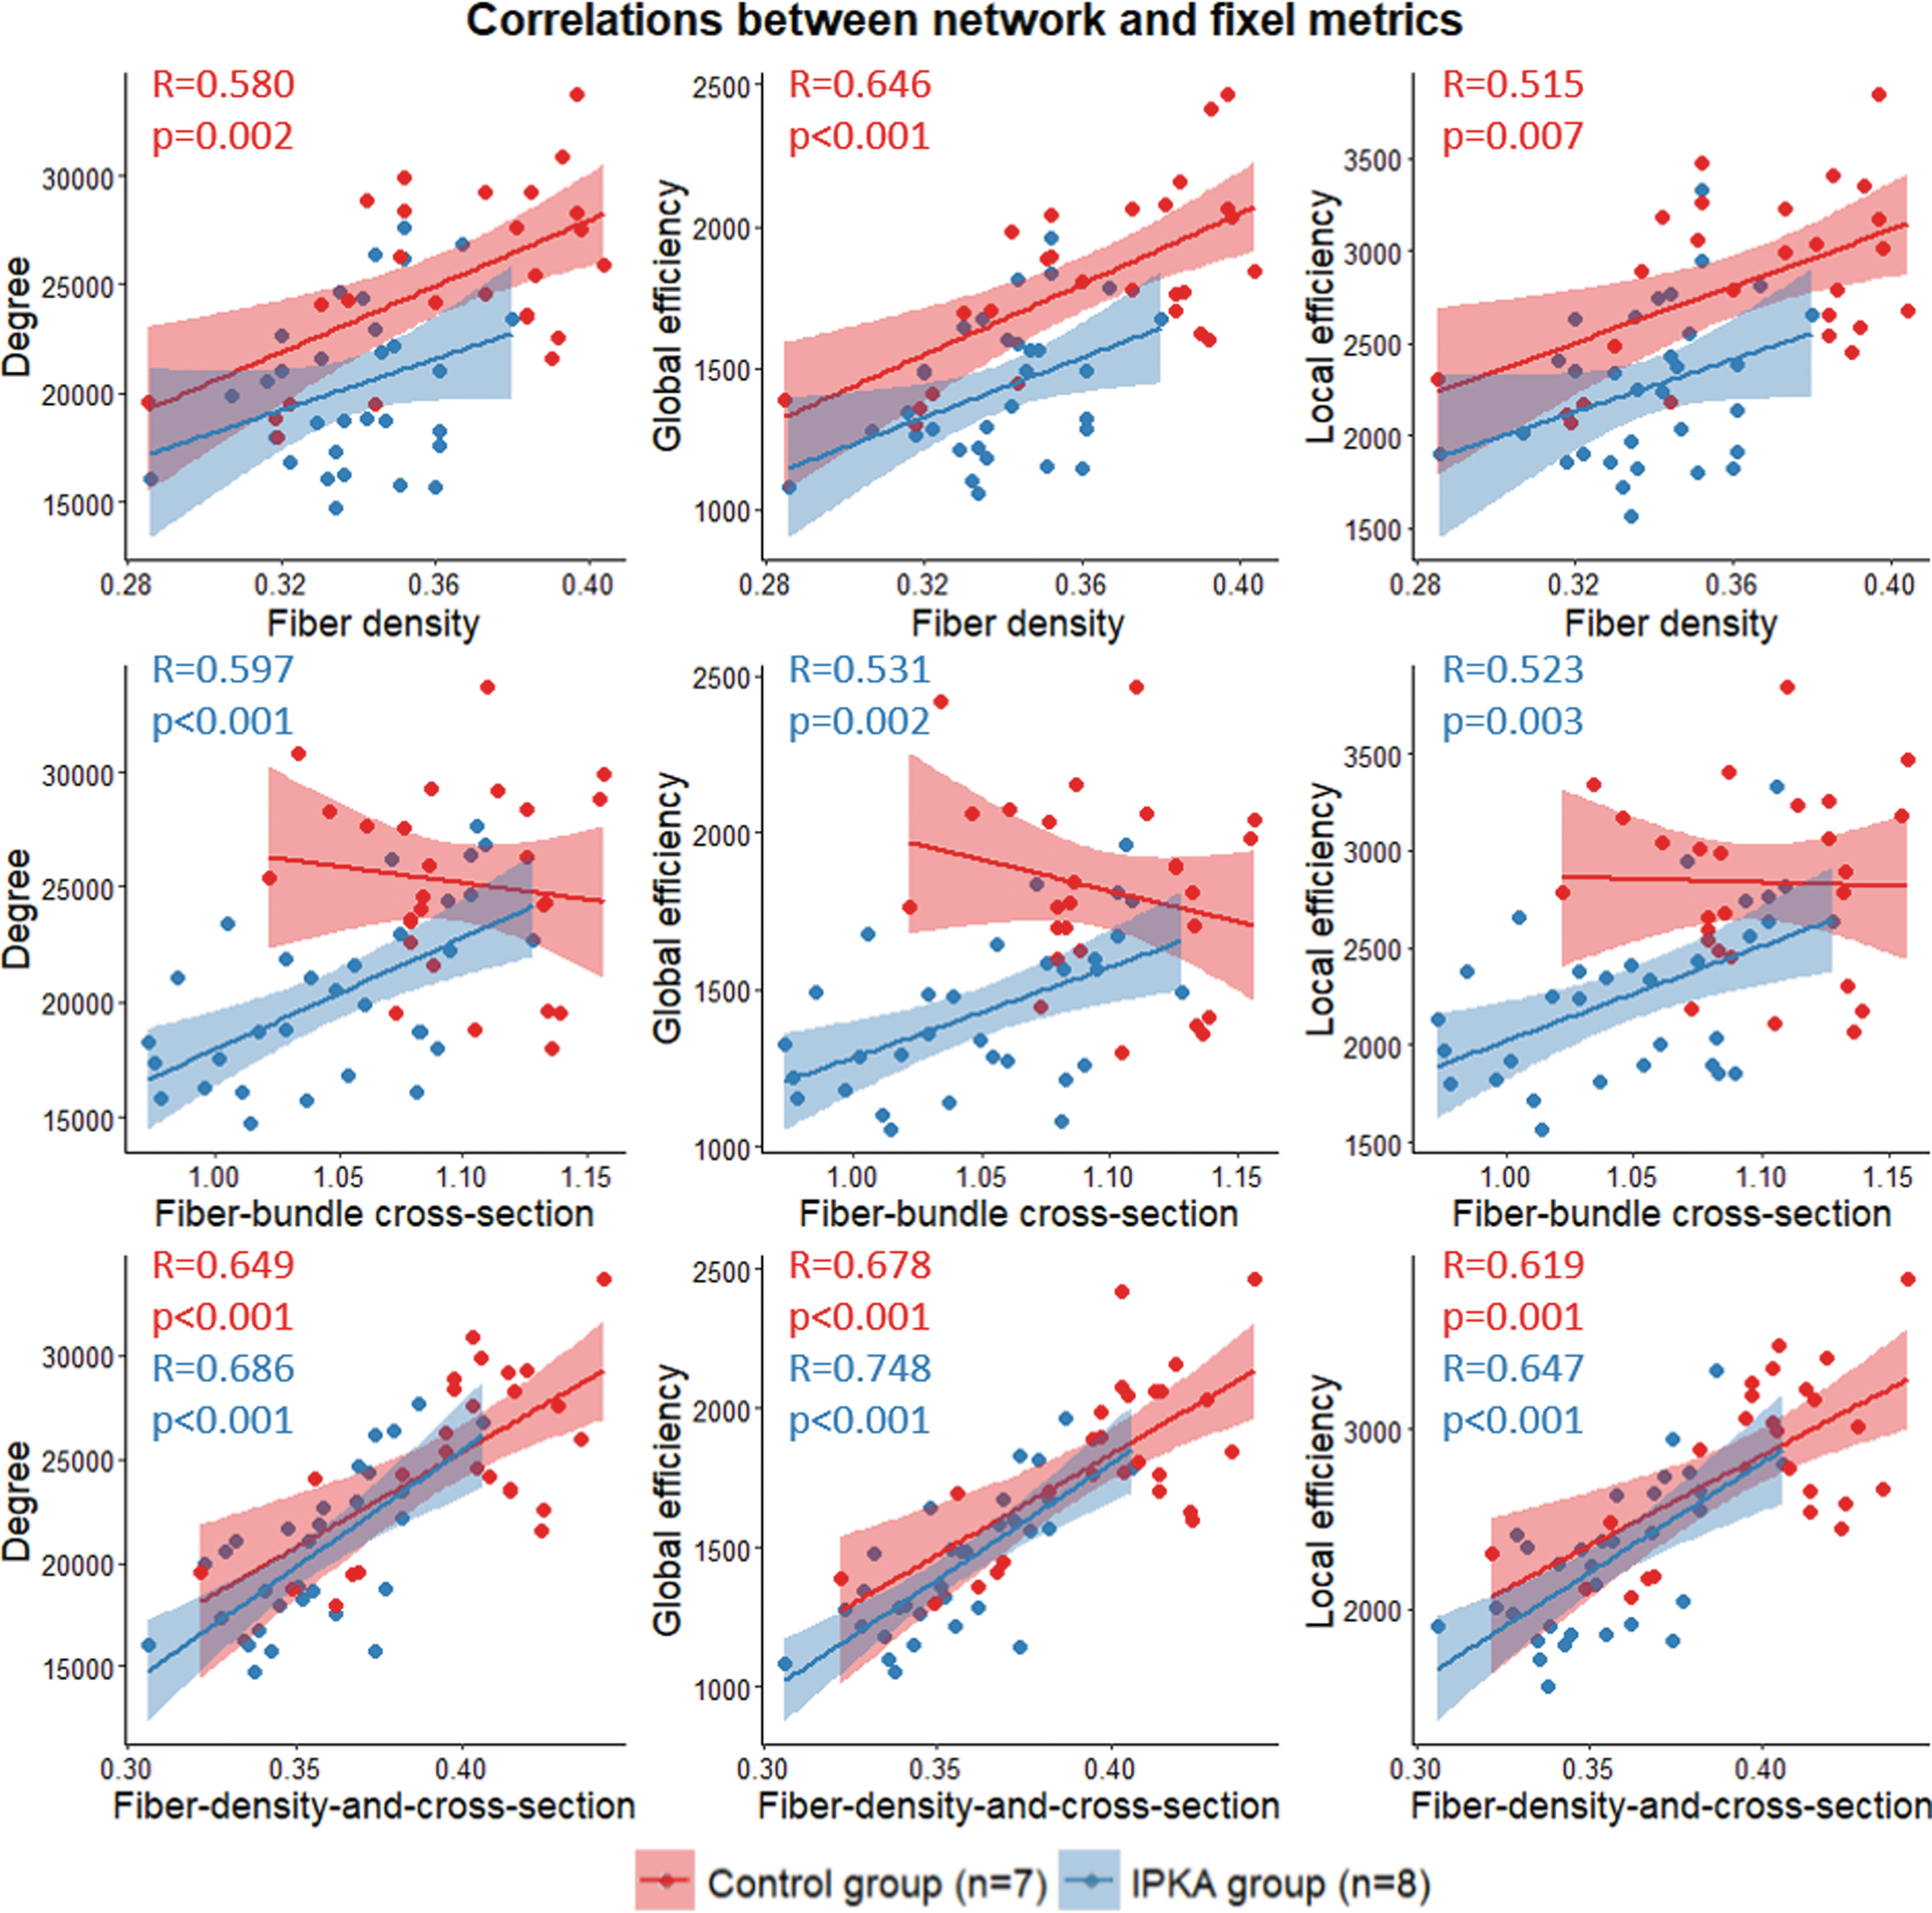
Correlations between network metrics (degree, global efficiency, and local efficiency) and fixel metrics (FD, FC, and FDC) at all time points post-SE. Data are visualized as a scatter plot with regression line and 95% confidence interval. When significant correlations were observed, R- and p values were added to the scatter plot. FC and FDC were significantly correlated with network metrics in the IPKA group, and FD and FDC were significantly correlated with network metrics in the control group.
EEG recording
The EEG was recorded in eight IPKA animals for 6 consecutive days. All animals displayed epilepsy with spontaneous seizures. On average, the animals had a total of 127 seizures (range: 31–218) during the entire recording period, or 23 seizures per day. However, we could not demonstrate any significant correlations between seizure frequency and global or nodal network metrics, nor with any fixel metric or ventricular volume.
Discussion
The objectives of this study were twofold: (1) to investigate how the structural brain network changes during epileptogenesis in the IPKA rat model, and which brain areas are most affected and (2) whether the changes in network topology are related to changes in the integrity of the white matter assessed by using FBA.
Disruption of the structural brain network during epileptogenesis
Using diffusion-weighted MRI in combination with the MSMT-CSD model, we found that global degree and local efficiency, measures of structural connectivity and segregation or local interconnectivity, respectively, significantly decreased in the IPKA group. In addition, global efficiency decreased and characteristic path length increased, which points to a decrease in integration or overall communication efficiency.
Nodal degree decreased significantly during early epileptogenesis in the hippocampus, subiculum, thalamus, septum, dorsolateral orbitofrontal cortex, globus pallidus, and nucleus accumbens. In the cingulate cortex, caudate putamen, and somatosensory cortex, nodal degree decreased during early epileptogenesis and remained decreased during late epileptogenesis. Many of these regions (hippocampus, thalamus, septum, dorsolateral orbitofrontal cortex, cingulate cortex, and somatosensory cortex) are also part of the rat default-mode network (DMN; Lu et al., 2012; Sierakowiak et al., 2015). This indicates that mainly regions of the limbic system and the DMN are affected during epileptogenesis.
Our results are in line with most patient studies investigating structural connectivity in TLE using DTI-based tractography, where TLE patients are compared with controls at one specific time point. Kamiya et al. (2016) found network alterations in the ipsilateral temporoparietal lobe, including regions of the DMN, in patients with TLE. They reported decreased local efficiency and degree in multiple brain regions, including posterior cingulate gyrus, cuneus, and hippocampus (Kamiya et al., 2016). Bernhardt et al. (2019) reported decreased global and local efficiency in TLE patients, suggesting decreased connectivity, mainly within temporolimbic networks that are strongly connected to the hippocampus. Liao et al. (2011) found decreased structural connectivity in the DMN in TLE. DeSalvo et al. (2014) reported decreased structural connectivity in the orbitofrontal, temporal and posterior cingulate cortex, and precuneus, but increased local efficiency in the frontal, insular, posterior cingulate and occipital cortex, and precuneus, in patients with TLE. Bonilha et al. (2012) found decreased FD in patients with TLE, but increased clustering in the limbic network and increased local efficiency, degree, and clustering coefficient in the insula, superior temporal regions, and thalamus. In the hippocampus, clustering coefficient and local efficiency were decreased, whereas nodal degree was increased (Bonilha et al., 2012). To the best of our knowledge, the study of Besson et al. (2014) is the only one using probabilistic tractography based on FOD to investigate structural connectivity in TLE. They reported decreased connectivity in left TLE patients compared with controls and found that mainly the inferolateral cortex, temporal pole, and perisylvian cortex were affected in these patients. In patients with right TLE, connectivity was decreased to a lesser extent, only affecting limbic structures and the ipsilateral temporal cortex (Besson et al., 2014).
Our study is the first to investigate structural network topology in a rat model of TLE using longitudinal multi-shell dMRI and FOD-based tractography. However, several studies have investigated functional network topology in this model. Pirttimäki et al. (2016) found altered functional connectivity in several brain regions 1 week post-SE in the IPKA rat model for TLE. One or 2 months post-SE, functional connectivity was decreased, mainly between the somatosensory cortex and thalamus, and perirhinal and piriform cortices (Pirttimäki et al., 2016). In the same model, Gill et al. (2017) reported increased functional connectivity within the temporal regions, limbic network, and DMN, 4–5 weeks post-SE. In the pilocarpine rat model of TLE, Jiang et al. (2018) found decreased functional connectivity within the hippocampal network, mainly in the hippocampus, amygdala, thalamus, motor cortex, and somatosensory cortex, and increased functional connectivity in the visual cortex, mesencephalon, and insula. Bertoglio et al. (2019) reported that functional connectivity was altered in several regions of the DMN and found widespread network connectivity hyposynchrony 2 weeks post-SE in the IPKA rat model for TLE. In the same model, we previously reported that functional connectivity, segregation, and integration decreased 3 weeks post-SE and remained decreased during epileptogenesis. Regions of the DMN were affected most, retrosplenial cortex in particular (Christiaen et al., 2019). Using dynamic functional connectivity analysis, we demonstrated that functional connectivity states with a lower mean functional connectivity, integration, and segregation occurred more often in IPKA animals compared with controls (Christiaen et al., 2020).
Overall, our findings are in line with studies investigating structural connectivity in patients with TLE where structural connectivity, global efficiency or integration, and local efficiency or segregation are decreased in TLE patients and that mainly regions of the DMN and the limbic network are affected. In addition, our results correspond with findings of reduced functional connectivity in animal models of TLE. Our longitudinal study design also demonstrates that changes in structural connectivity are dynamic and therefore vary with time. In most regions that are part of the DMN, structural connectivity is decreased in early epileptogenesis. During late epileptogenesis, structural connectivity remains low in some brain regions (somatosensory cortex, cingulate cortex, and caudate putamen), whereas it increases again in other brain regions (hippocampus, subiculum, thalamus, septum, dorsolateral orbitofrontal cortex, globus pallidus, and nucleus accumbens).
Whether these changes in network topology are related to changes in white matter integrity was the second objective of our study. Our hypothesis is that these changes might be related to neuronal degeneration and gliosis, the two main neuropathological changes during epileptogenesis in the IPKA model (Bertoglio et al., 2017), which could be further clarified by FBA as explained later.
Decrease in FD and FDC in white matter tracts during epileptogenesis
The analysis of the fixel metrics revealed that FD was decreased during early and late epileptogenesis in the IPKA group in the corpus callosum, internal capsule, and fimbria. The FDC was decreased during early epileptogenesis in anterior commissure, corpus callosum, and fimbria, and in corpus callosum and cingulum during late epileptogenesis. This indicates that there is a decrease in intra-axonal volume fraction. This is in line with the neuropathological changes that are known to occur after SE in the IPKA model. After the initial insult, it has been shown that neuronal loss occurs not only in the hippocampus, entorhinal cortex, subiculum, and amygdala, but also in some extratemporal regions including the thalamus, caudate putamen, and cerebral cortex, and especially the piriform cortex. During this early phase, gliosis also takes place in the hippocampus, piriform cortex, entorhinal cortex, olfactory bulb, substantia nigra, thalamus, and mesencephalon (Bertoglio et al., 2017; Drexel et al., 2012; Lévesque and Avoli, 2013). Both neuronal loss and gliosis will be reflected as a decrease in intra-axonal volume fraction.
During late epileptogenesis, there is less (micro)gliosis compared with the early phase (Bertoglio et al., 2017; Drexel et al., 2012). In this study, we have observed that in fimbria, and to a lesser extent in corpus callosum, FDC seems to increase during late epileptogenesis, which may be related to reduced gliosis. On the other hand, it could also be associated with the occurrence of spontaneous seizures during this stage. The animals had on average 23 seizures per day, meaning it is likely that they had a seizure within hours before the scanning session. During the periictal period, cerebral edema and cell swelling can cause a temporary decrease in diffusivity (Kim et al., 2001; Yogarajah and Duncan, 2008), which may be reflected in an increase in FDC.
These findings are also in line with those of Vaughan et al. (2017), who investigated tract-specific atrophy in focal epilepsy and reported decreased FDC in fornix, uncinate, inferior longitudinal, inferior fronto-occipital and arcuate fasciculus, cingulum, anterior commissure, tapetum, and corpus callosum in patients with TLE. The decrease in FDC was accompanied by a decrease in both FD and FC and was most pronounced in the temporal pole, inferior temporal white matter, and anterior commissure (Vaughan et al., 2017). Feshki et al. (2018) reported decreased FD and FDC in white matter in both hemispheres in TLE patients.
Moreover, we also found that global degree and global and local efficiency in the structural brain network were positively correlated with FC and FDC in IPKA animals. This further indicates that decreased degree, integration, and segregation post-SE are likely related to decreased axonal density or decreased white matter integrity in the main white matter tracts in the rat brain.
Decreased FD in control group: related to social isolation?
Fixel metrics also seemed to change over time in the control group. During the later time points, FD was decreased in the corpus callosum, internal capsule, and fimbria and FC was increased in the corpus callosum, internal capsule, and fimbria. This indicates that the intra-axonal volume fraction decreases, whereas the total intra-axonal volume remains stable. During these later time points, we also see an increase in ventricular volume in this group. Since the animals were first scanned when they were only 6 weeks old, brain maturation might play a role. However, this would lead to a decrease in diffusivity, related to myelination, which does not correspond with our findings (Mengler et al., 2014). Another reason for these changes could be social isolation. To match the housing situation of the IPKA animals, control animals were housed separately. In the later phase of the experiment, the animals have therefore been housed separately for more than 10 weeks. Social isolation is known to cause depression in rats and is even used to create a rat model for depression (Djordjevic et al., 2012; Fox et al., 2015; Wallace et al., 2009). In the chronic mild stress model, another rat model for depression, a dMRI study found increased mean and radial diffusivity and decreased FA, which could be related to demyelination and possibly edema or inflammation (Hemanth Kumar et al., 2014; Rossetti et al., 2016). Several other studies reported alterations in diffusion tensor and kurtosis metrics and in neurite density in this model, mainly in the hippocampus, amygdala, and caudate putamen, which were believed to be related to atrophy in the hippocampus and hypertrophy or arborization in amygdala (Khan et al., 2019; Palacios et al., 2014; Vestergaard-Poulsen et al., 2011). This indicates that social isolation and/or depression might be related to the changes in fixel metrics in the control group in the late stage of the experiment.
Limitation
A possible limitation of this study is the small sample size that was used for data analysis. Future studies with larger sample sizes are required to validate the results.
Conclusion
In this longitudinal multi-shell dMRI study, changes in structural network topology and white matter integrity during epileptogenesis in the IPKA rat model for TLE were assessed by using a combination of whole-brain tractography, graph theory, and FBA. We found a decrease in structural connectivity, integration, and segregation in IPKA animals compared with controls during both early and late epileptogenesis. Structural connectivity was predominantly decreased in regions of the limbic system and DMN, mainly during early epileptogenesis. In addition, FD and FDC decreased post-SE in several white matter tracts, including anterior commissure, corpus callosum, cingulum, internal capsule, and fimbria, indicating that intra-axonal volume fraction decreased, which may be related to neuronal degeneration and gliosis.
Footnotes
Authors' Contributions
E.C., C.V., R.R., and B.D. designed the study and analyzed and interpreted the data. E.C., B.D., and M.G. collected the data. E.C. drafted the article. All authors provided critical feedback on the data analysis, interpretation of the results, and the article. All authors have reviewed and approved of the article.
Disclaimer
This article has been submitted solely to this journal and is not published, in press, or submitted elsewhere.
Author Disclosure Statement
The authors have no competing interests to declare.
Funding Information
This research was financially supported by a PhD grant from the Special Research Fund (BOF) of Ghent University (project number BOF16/IOP/018). Emma Christiaen and Marie-Gabrielle Goossens are SB PhD fellows at Research Foundation – Flanders (project numbers 1S90218N and 1S30017N).