
Abstract
Introduction:
Idiopathic generalized epilepsy (IGE) is a collection of generalized nonlesional epileptic network disorders. Around 20–40% of patients with IGE are refractory to antiseizure medication, and mechanisms underlying refractoriness are poorly understood. Here, we characterize structural brain network alterations and determine whether network alterations differ between patients with refractory and nonrefractory IGE.
Methods:
Thirty-three patients with IGE (10 nonrefractory and 23 refractory) and 39 age- and sex-matched healthy controls were studied. Network nodes were segmented from T1-weighted images, while connections between these nodes (edges) were reconstructed from diffusion magnetic resonance imaging (MRI). Diffusion networks of fractional anisotropy (FA), mean diffusivity (MD), radial diffusivity (RD), and streamline count (Count) were studied. Differences between all patients, refractory, nonrefractory, and control groups were computed using network-based statistics. Nodal volume differences between groups were computed using Cohen's d effect size calculation.
Results:
Patients had significantly decreased bihemispheric FA and Count networks and increased MD and RD networks compared with controls. Alterations in network architecture, with respect to controls, differed depending on treatment outcome, including predominant FA network alterations in refractory IGE and increased nodal volume in nonrefractory IGE. Diffusion MRI networks were not influenced by nodal volume.
Discussion:
Although a nonlesional disorder, patients with IGE have bihemispheric structural network alterations that may differ between patients with refractory and nonrefractory IGE. Given that distinct nodal volume and FA network alterations were observed between treatment outcome groups, a multifaceted network analysis may be useful for identifying imaging biomarkers of refractory IGE.
Impact statement
Although it is accepted that epilepsy is a network disorder, few studies have prospectively recruited patients with clear refractory and nonrefractory idiopathic generalized epilepsy (IGE) with a goal to identify magnetic resonance imaging (MRI) markers of pharmacoresistance. By showing that patients with refractory and nonrefractory IGE have different patterns of diffusion MRI networks and nodal volume alterations with respect to controls, we suggest that imaging analysis of structural networks may have the potential to identify unique biomarkers of treatment outcome. Reliable imaging markers of pharmacoresistance could inform the treatment pathway for many patients with epilepsy.
Introduction
Idiopathic generalized epilepsy (IGE), also referred to as genetic generalized epilepsy (Scheffer et al., 2017), is a collection of presumably genetically based generalized epileptic disorders (Berg et al., 2010; Scheffer et al., 2017) that account for 15 − 20% of all epilepsies (Jallon and Latour, 2005). The disorder is characterized clinically by generalized seizures, spike-, and polyspike-wave discharges on electroencephalography (EEG) (Seneviratne et al., 2012) and no visible anatomical brain lesions on magnetic resonance imaging (MRI). Despite available antiseizure medication (ASM) treatment, 20–40% of patients with IGE are refractory to medication and continue to have debilitating seizures (Baykan et al., 2008; Cockerell et al., 1995; Semah et al., 1998). The mechanisms underlying refractoriness after ASM remain unknown and currently there are no reliable biomarkers of treatment outcome.
Although, by definition, patients with IGE are nonlesional, advanced quantitative MRI techniques have identified volumetric and microstructural brain alterations in patients relative to healthy controls in group comparison studies. A meta-analysis of 12 voxel-based morphometry IGE studies reported structural alterations showing gray matter atrophy in the thalamus and increased gray matter volume in the right medial frontal gyrus and cingulate cortex in patients with IGE (Bin et al., 2017). Reduced cortical thickness has also been reported in frontal lobe regions in patients with IGE (Bernhardt et al., 2009). Using a graph theory approach on structural covariance networks, studies have found widespread altered topological organization of gray matter (Liao et al., 2013; Sone et al., 2019). Diffusion tensor imaging (DTI) alterations in white matter tracts have also been reported. Reduced fractional anisotropy (FA) (Focke et al., 2014; Liu et al., 2011; Lobato et al., 2018; Vulliemoz et al., 2011) and increased mean diffusivity (MD) (Focke et al., 2014; Lobato et al., 2018) and radial diffusivity (RD) (Focke et al., 2014) have been found in major white matter tract bundles. Affected tracts include the corpus callosum, superior and inferior longitudinal fasciculi, and the uncinate fasciculi.
Epilepsy is a network disorder with aberrant alterations of interactions between brain regions, which can cause functional impairments leading to epileptic seizures (Bernhardt et al., 2015; Kramer and Cash, 2012; Spencer, 2002; van Diessen et al., 2013). Brain networks can be reconstructed from DTI, a clinically feasible neuroimaging method that models water diffusion properties within brain tissue (Qi et al., 2015). Increased streamline count connectivity has been found in the primary motor, parietal, and subcortical regions in patients with IGE relative to controls (Caeyenberghs et al., 2014). Furthermore, altered topological network properties have been found in DTI-based networks of patients with IGE using graph theoretical approaches (Qiu et al., 2017; Xue et al., 2014; Zhang et al., 2011). These altered structural brain networks could provide new insights into functional impairments leading to epileptic seizures and could translate into potential biomarkers for treatment outcome in patients with IGE.
Despite an increasing number of published studies on brain networks in IGE, there are limited insights into potential network biomarkers of pharmacoresistence of the disorder. The aim of this study was to identify biomarkers of pharmacoresistant seizures in IGE by comparing structural network alterations in pharmacologically well-controlled (nonrefractory) and uncontrolled (refractory) patients with IGE relative to healthy controls using a network-based statistics (NBS) approach (Zalesky et al., 2010). Given that many studies report singular diffusion network parameter alterations in IGE (Caeyenberghs et al., 2014; O'Muircheartaigh et al., 2012), we analyzed diffusion network alterations with respect to streamline count (Count; the number of streamlines within a voxel), FA (the measurement of anisotropic diffusion inferring directionality), MD (measuring the average magnitude of diffusion in all directions), axial diffusivity (AD; the magnitude of diffusion parallel to the principal direction of diffusion), and RD (the magnitude of diffusion radially to the principal direction of diffusion in every voxel). By analyzing multiple diffusion measures, we increase the probability of understanding disruptions to the microstructural environment in IGE. We supplemented our NBS diffusion network approach with volumetric analysis of cortical nodes to determine whether diffusion networks were related to morphometric alterations in cortical and subcortical gray matter structure.
Methods
Participants
We recruited 33 patients with a diagnosis of IGE (mean age 32 ± 15 years, 18 females, 15 males). All patients were recruited from the Walton Centre NHS Foundation Trust, and informed written consent was obtained for all participants (local research ethics committee reference 14/NW/0332). All patients were diagnosed with IGE by a consultant neurologist based on the ILAE classification of seizure semiology (Fisher et al., 2017), patient history, and EEG findings (generalized spike/polyspike-wave changes). IGE subsyndromes were classified as absence epilepsy (childhood or juvenile), juvenile myoclonic epilepsy, or generalized epilepsy with tonic/clonic seizure on waking. There were no potentially epileptogenic or incidental brain lesions on diagnostic MRI. Twenty-three patients had refractory IGE despite ASM treatment and 10 were nonrefractory. Patients were recruited prospectively and classified as nonrefractory if they had no seizure activity over a 1-year period before scanning (Kwan et al., 2010). Patients who presented with two or more seizures 1 year before scanning were termed refractory (Kwan et al., 2010). A comparison of demographic and clinical data between refractory and nonrefractory patients is shown in Table 1. We additionally recruited 39 age- and sex-matched healthy controls (Table 1). Furthermore, detailed clinical characteristics of patients recruited with IGE, including specific subsyndromes and medication regimens, are included in Table 2.
Demographics and Clinical Characteristics
Sex significance calculated using Fisher's exact test and age/onset/duration significance using Mann–Whitney U test. Age, onset, and duration in years.
Significant p < 0.05.
HC, healthy controls; MRI, magnetic resonance imaging; Ref, refractory; nonref, nonrefractory; SD, standard deviation.
Clinical Characteristics of Patients
AS, absence seizures; ASM, antiseizure medication; CBZ, carbamazepine; Clob, clobazam; Clon, clonazepam; Duration, duration of epilepsy in years; ETX, ethosuximide; F, female; FH, family history; GTCS, primary generalized tonic/clonic seizures; LEV, levetiracetam; LTG, lamotrigine; M, male; MS, myoclonic seizures; N, no; Nonref, nonrefractory; onset, age at onset of epilepsy in years; PB, phenobarbital; PS, photosensitive; Ref, refractory; TOP, topiramate; VPA, valproic acid; Y, yes; ZON, zonisamide.
MRI acquisition
Participants were scanned at the Department of Neuroradiology at the Walton Centre NHS Foundation Trust on a 3T GE Discovery MR 750 MRI scanner with a 32-channel head coil. Structural 3D T1-weighted (T1w) and diffusion-weighted (DW) images were acquired. The specifications were as follows: T1w fast-spin-gradient images with Phased Array Uniformity Enhancement signal inhomogeneity correction (140 slices, TR = 8.2 ms, TI = 450 ms, TE = 3.22 ms, flip angle = 12, with 1 mm isotropic voxel size, acquisition time: 3:48 min). DW imaging included a 60-direction spin-echo pulse sequence (66 slices, TR = 8000 ms, TI = N/A, TE = 82 ms, flip angle = 90, voxel size = 1 × 1 × 2 mm, no cardiac gating, with ASSET, b-value = 1000 s/mm2, FOV = 256 mm, with 6 b0 images without diffusion weighting, acquisition time: 8:56 min).
Image preprocessing
The T1w images were preprocessed using FreeSurfer (v6.0) recon-all function for cortical and subcortical reconstruction, which includes preprocessing (motion correction, image inhomogeneity correction, skull stripping), tissue-specific segmentation, subcortical and cortical labeling, surface reconstruction, and cortical parcellation. The Desikan/Killiany atlas (Desikan et al., 2006) was used to parcellate images into 82 regions of interest across the entire brain. The parcellated regions underwent quality control inspection and were manually corrected if necessary.
DW images were corrected for artifacts using FMRIBs (Oxford Centre for Functional MRI of the Brain) FSL (v6.0) software (Smith et al., 2004) according to the diffusion MRI preprocessing steps of the ENIGMA pipeline, which included TOPUP for echo-planar image distortion correction and EDDY for motion and eddy current correction. Image reconstruction and deterministic tractography of DTI were performed in DSI studio (Build 27-02-2019). The diffusion data were reconstructed using generalized q-sampling imaging (Yeh et al., 2010) with a diffusion sampling length ratio of 1.25. We chose a deterministic fiber tracking algorithm (Yeh et al., 2013) as there is an increased likelihood of false-positive connections from probabilistic approaches (Sarwar et al., 2019). The whole brain was used as a seed region. The quantitative anisotropy threshold was 0.1, the angular threshold was 60°, and the step size was 1 mm. Streamlines with length shorter than 10 or longer than 300 mm were discarded and a total of 1,000,000 streamlines were calculated. Topology-informed pruning (Yeh et al., 2019) was applied to the tractography with one iteration to reduce the number of false connections.
Structural networks
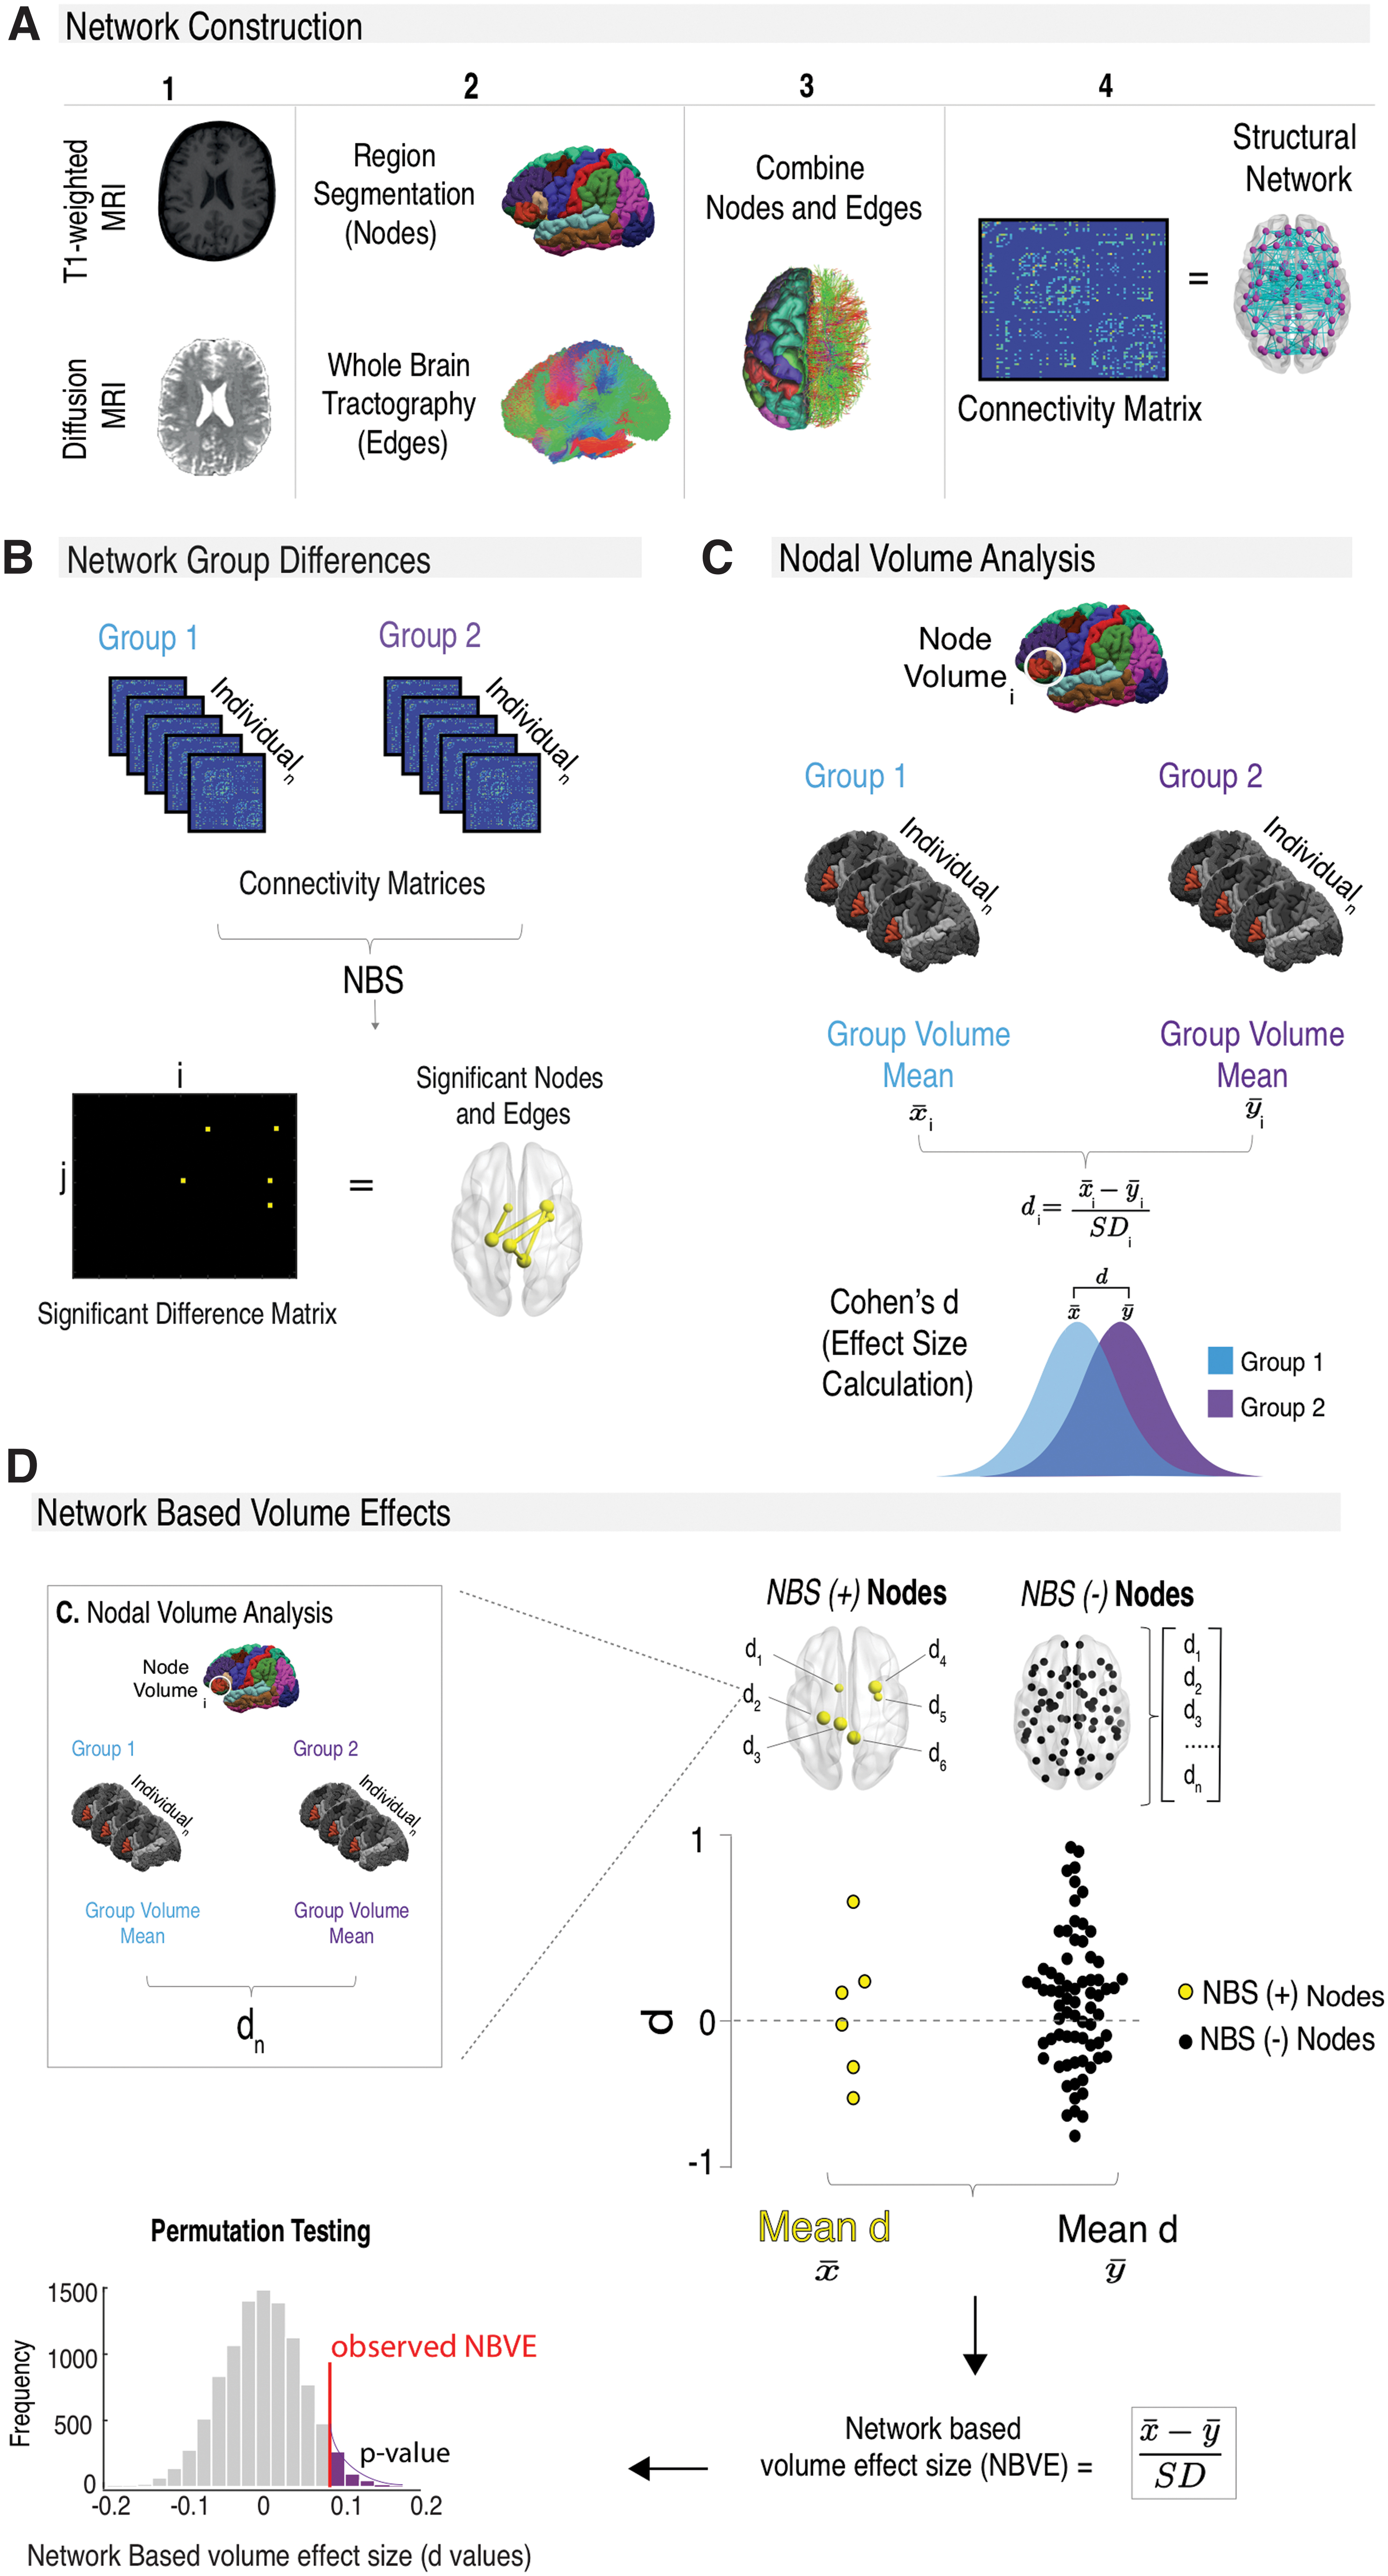
Structural connectivity networks were built from T1w and DW scans (Fig. 1A) in native space using DSI studio (Build 27-02-2019). A structural brain network can be mathematically described as a graph with nodes representing brain regions and edges forming connections between those regions. For our analysis, network nodes consisted of the 82 segmented T1w regions as used in previous connectivity analysis (Munsell et al., 2015; Taylor et al., 2015, 2018). Network edges consisted of connection weights between nodes, which were reconstructed using the diffusion MRI data for Count, FA, MD, AD, and RD. For two patients, gray matter dilation of one node was performed to prevent the disconnection of that node caused by premature tracking termination (Wei et al., 2017).
Structural network analysis method.
DSI studio outputs a weighted connectivity matrix representing the structural network. Connectivity matrices were constructed with matrix entries (C ij ) representing a connection between two nodes (i and j). Network edges were retained if one or more streamlines terminated between the two corresponding nodes. Connectivity matrices were thresholded to ensure matrix inputs contained connections present in at least 75% of all participants in all groups and were common to every group (Besson et al., 2014). We used an absolute threshold method that applies a uniform threshold to keep connections above a fixed connection strength, which has been found to be advantageous for removing spurious connections in structural networks (Buchanan et al., 2020).
Statistical network analysis
Network differences between patient and control groups were compared using NBS (Zalesky et al., 2010) (Fig. 1B). Global unpaired NBS t-tests were performed between patient and control groups. Age and sex were added as covariates for all metrics, and intracranial volume (ICV) obtained from FreeSurfer segmentation was added as an additional covariate for streamline count. NBS uses T-score thresholding to control for type I errors. We therefore validated the stability of significant findings at multiple thresholds (range = 1.5–4.0, with increments of 0.1). NBS then clustered significantly different edges into networks and provided a family-wise error rate-corrected p-value for each network cluster using 10,000 permutations. For more details on the NBS method, see Zalesky and colleagues (2010). Results are shown at an intermediate threshold of |T| > 2.7. p-Values associated with this T-score are p = 0.008 (all patients and controls, n = 72; refractory and controls, n = 62) and p = 0.009 (nonrefractory and controls, n = 49), considered a stringent statistical threshold.
Along with NBS, network differences between patients with refractory and nonrefractory IGE were compared using Cohen's d effect-size calculation due to the small sample size of the patient groups (n = 33). Effect-size small sample size correction (n < 50) as previously described (Durlak, 2009) was also applied. Effect sizes can provide important information on whether legitimate differences exist between groups of participants despite the lack of significant differences using conventional statistical analysis (Sullivan and Feinn, 2012). A post hoc power analysis was not used to determine the sample size needed to detect significant effects between networks of patients with refractory and nonrefractory IGE as post hoc analysis is misrepresentative as it does not indicate true power (Zhang et al., 2019).
Nodal volume analysis
FreeSurfer segmented volumes were used to compare each of the 82 network nodes for volume differences between subject groups using Cohen's d effect-size calculation with small sample size correction (n < 50), where
Network versus nodal volumes
To determine if NBS-derived network alterations and nodal volume changes are linked, network-based volume effects are computed (Fig. 1D). The 82 network nodes were split into nodes part of a significant NBS-altered network (Fig. 1B) (NBS +) and unpertubed nodes (NBS −). Previously calculated volume differences (effect sizes) for the NBS (+) and NBS (−) nodes are compared using a Cohen's d calculation, and significance (p < 0.05) was determined using permutation testing (10,000 permutations). The resulting p-values were corrected for multiple comparisons using false discovery rate (FDR) correction; significance was set at p < 0.05FDR.
Results
NBS: diffusion networks
Compared with controls, all patient groups had networks with significantly decreased Count and FA, and increased MD and RD metrics across a range of T-scores (p < 0.05, |T| = 1.5–4.0). No AD alterations were found. The extent of network alterations differed in the patient groups relative to controls, with nonrefractory patients having the fewest alterations across FA, MD, and RD networks (Table 3, |T| > 2.7). Analysis of FA networks revealed the most extensive network alterations across both cerebral hemispheres in the all-patient group and refractory IGE group relative to controls (Fig. 2), with 54 significant edge alterations for all patients and 38 for patients with refractory IGE (Table 3, |T| > 2.7). The most significant edges for each patient group for the FA networks were found bilaterally in the limbic and temporal lobes. Count, MD, and RD network differences are presented in Supplementary Figures S1–S3. There were no statistically significant network alterations found between patients with refractory and nonrefractory IGE, although large and very large effect-size differences were found between the treatment outcome groups (Supplementary Fig. S4).

Significant network FA differences between subject groups relative to controls (decreased FA; p < 0.05; threshold of T = 2.7). Graphs represent the number of significantly altered network edges over a range of NBS thresholds. The glass brains visually show the altered networks at T ≥ 2.7 with edge color representing the t-statistic. Boxplots of the most significant edge and the corresponding node names are also found. Color images are available online.
Summary Table of Altered Network-Based Statistics Networks
Summary table of NBS results of altered networks for each metric for all significant subgroups [threshold T = 2.7; metric (+) = increased connectivity; metric (−) = decreased connectivity]. The table includes the number of significant edges found for each network (degree) and the names and t-statistic values for the most significant edges per network.
FA, fractional anisotropy; MD, mean diffusivity; NBS, network-based statistics; RD, radial diffusivity.
Nodal volume analysis
The direction and magnitude of nodal volume differences (effect size) were dependent on group comparison and individual node (Fig. 3). Patients with refractory IGE had decreased volumes, whereas patients with nonrefractory IGE had increased volumes compared with controls. Larger effect sizes were found for nodes in patients with nonrefractory IGE relative to refractory IGE and controls. Volumetric differences between patients with IGE and controls were difficult to capture, compared with more robust differences found when separating out IGE patients into refractory and nonrefractory groups.

Network node gray matter volume differences between subject group pairs using Cohen's d effect-size calculation. Boxplots show Cohen's d values for individual nodes between subject group pairs. Legend colors represent the levels of effect-size differences. Glass brains visually show nodal volume differences with nodal size corresponding to effect size and color representing the effect size level. Color images are available online.
Network versus nodal volumes
There were no statistically significant differences in the volume changes of NBS (+) and NBS (−) nodes for FA (Fig. 4), Count (Supplementary Fig. S5), MD (Supplementary Fig. S6), or RD (Supplementary Fig. S7) structural networks for subject groups relative to controls, suggesting that the alterations in diffusion-based networks were not driven by nodal volume.

FA NBVE. Comparisons of the volume differences (effect sizes) between NBS (+) (nodes from significantly altered FA network) and NBS (−) nodes (unperturbed FA nodes) of subject groups relative to controls. Cohen's d calculation is applied to compute an NBVE value, and significance (p < 0.05) is determined using permutation testing (10,000 permutations). Color images are available online.
Discussion
In the present study, we sought to determine diffusion-based structural network alterations in patients with refractory and nonrefractory IGE using NBS. We report that patients with IGE show evidence of bihemispheric structural network alterations and that altered networks are manifest across a range of DTI metrics. The extent of network alterations depended on the network metric used; FA networks were predominantly affected. Patients who were nonrefractory had reduced diffusion network alterations. We additionally sought to determine whether morphometric alterations in gray matter nodes were related to diffusion network alterations. We found no evidence to support this; nevertheless, patients with refractory IGE showed evidence of reduced gray matter volume, and patients with nonrefractory IGE showed evidence of increased gray matter volume, relative to healthy controls.
Our results suggest widespread changes in white matter organization in patients with IGE. We considered multiple diffusion metrics for network connection weights (edges), given that different metrics characterize various aspects of microscopic tissue alterations. Our network analysis is consistent with previous DTI tractography studies that have reported decreased FA and increased MD (Focke et al., 2014; Knake et al., 2017; Liang et al., 2016; Lobato et al., 2018; Qiu et al., 2016; Yang et al., 2012) and increased RD (Focke et al., 2014; Knake et al., 2017; Qiu et al., 2016), and no differences in AD (Knake et al., 2017) in patients with IGE relative to controls. Decreased FA and increased MD suggest decreased isotropic diffusion, which may be driven by a number of pathological processes affecting white matter tracts, such as demyelination (Alexander et al., 2007; Winklewski et al., 2018), a reduction in axonal density (Alexander et al., 2007; Concha et al., 2010; Garbelli et al., 2012), or an increase in inflammation (Alexander et al., 2007; Najjar et al., 2011). Demyelination can also cause increased RD with minimal influence on AD (Winklewski et al., 2018), which is equivalent to the pattern of findings we report. A literature review of 42 epilepsy and myelin studies (21 histological and 21 in vivo imaging) reported an association between epilepsy and reduced myelin content (Drenthen et al., 2020). However, these studies concentrate on focal epilepsies, having a different pathophysiology than IGE, and therefore, the underlying histopathology may be different. A histological human study of the healthy brain has found significant correlations between histological features of myelin and DTI metrics (Concha et al., 2010; Seehaus et al., 2015), which may suggest that our results could reflect altered myelin in IGE. However, as of yet, the exact underlying neurobiological alterations that drive DTI-derived changes are not well understood in IGE.
Despite the existence of DTI studies of IGE, few have examined structural connectivity on an edge-by-edge global network perspective. NBS has previously been used to analyze structural connectivity in IGE (Caeyenberghs et al., 2014). The authors reported a significantly increased streamline count in patients compared with controls. On the contrary, we report a decreased streamline count in similar regions (bilateral parietal and subcortical) in all patients relative to controls. In addition, we found further streamline count changes in the cingulate and frontal regions. A combination of methodological discrepancies could potentially account for the differences, including composite of patient groups (refractory, nonrefractory; IGE subsyndromes) and inclusion of ICV (Smith et al., 2020). Streamline count should be used with caution due to the nature of deterministic tracking algorithms (Jones and Cercignani, 2010) and it is easy to overinterpret results as tracking models contain many assumptions (Calamante, 2019). To reduce the likelihood of overinterpretation, we chose to assess multiple DTI metrics.
Previous DTI research has failed to show a clear biomarker of IGE drug resistance (Jiang et al., 2017; Lobato et al., 2018; Szaflarski et al., 2016). Uncovering biomarkers of treatment outcome is important to provide better therapeutic management of patients (Gleichgerrcht and Bonilha, 2017), preventing seizures and reducing the morbidity of ineffective ASM side effects. To our knowledge, we are the first to compare whole-brain structural networks between patients with refractory and nonrefractory IGE, mirroring similar studies in temporal lobe epilepsy (TLE), which show that preoperative network analysis is predictive of postsurgical outcomes using various network features (Bonilha et al., 2013, 2015; Gleichgerrcht et al., 2018; Hutchings et al., 2015; Munsell et al., 2015; Taylor et al., 2018). Our results suggest that network architecture differs between patients with refractory and nonrefractory IGE relative to controls, given that patients with nonrefractory IGE had fewer network alterations than patients with refractory IGE and had increased nodal volumes. Gray matter volume increases have commonly been found in IGE (Betting et al., 2006; Bin et al., 2017; Kim et al., 2007; Woermann et al., 1999). In addition, studies have found similar results of increased gray matter volumes specific to patients with nonrefractory TLE relative to controls (Doucet et al., 2015; Yasuda et al., 2010). Volumetric node differences were more robust, and the directionality of volume results was in opposite directions when separating patients into groups based on their response to ASM, highlighting the distinct network architecture unique to each patient outcome group. Both network alterations and nodal volume alterations individually differ and do not appear to be related given that there was no significant difference between volumes of NBS (+) and NBS (−) nodes for all diffusion networks. This suggests a multifaceted difference in network architecture of refractory and nonrefractory patients, which may potentially make one network phenotype inherently less responsive to ASM. These complex network changes may potentially suggest a more advanced disease state in refractory epilepsy as described by the intrinsic disease severity hypothesis (Rogawski and Johnson, 2008). Alternatively, the increases in nodal gray matter volume found may be an indication of axonal sprouting and neuronal growth (Taupin, 2006; Tzarouchi et al., 2009), both neuroplastic factors that occur during brain reorganization (Bütefisch, 2006; Carmichael, 2003; Stroemer et al., 1995). This suggests the possibility that network architecture differences are less complex in patients with nonrefractory IGE and they are potentially achieving seizure freedom through a form of neuroplasticity, a theory suggested previously in patients with TLE (Doucet et al., 2015). However, other studies have suggested that increased gray matter in IGE may be due to other neuropathological factors such as microdysgenesis (Woermann et al., 1999). Overall, there is a necessity for further research into the pathophysiological mechanisms underpinning seizure freedom.
Limitations
There are some limitations to our study. Our cohort of patients with IGE was composed of different subsyndromes, which may have different ictogenic mechanisms. However, these syndromes have many similarities, including clinical features (Reutens and Berkovic, 1995), underlying pathophysiological mechanisms including altered functional thalamic connectivity (Benuzzi et al., 2012; Kim et al., 2019; Masterton et al., 2012), and common genetic influences (de Kovel et al., 2010). Therefore, similar network features may be found in mixed population subsyndromes and understanding these shared similarities is important. Furthermore, the refractory group was defined as having had seizures in the 12 months before recruitment and despite being homogenous in terms of being pharmacoresistant, it is possible that multifactorial molecular and other biological mechanisms underlie refractoriness that may be different between patients (Tang, Hartz, and Bauer, 2017). In cohort clinical studies such as ours, dichotomous groupings of refractory and nonrefractory patients are frequently studied and may be helpful in identifying signatures of refractoriness using biological (Pollard et al., 2013; Wang et al., 2015), genetic (Gallek et al., 2016; Sun et al., 2016), and neuroimaging (Labate et al., 2015; Reddy et al., 2019) approaches.
One limitation of the study is the inconsistency of ASM regimens between patients, however, studies have found that refractoriness in IGE does not depend on the type of ASM treatment (Marson et al., 2007a,b). Also, network alterations may precede the onset of IGE as suggested by studies of newly diagnosed epilepsy (Kreilkamp et al., 2021; Lee and Park, 2019), or be a consequence of brain degeneration and/or remodeling in response to continued seizures. Longitudinal studies of newly diagnosed epilepsy are needed to determine if network alterations are a cause or effect of the disorder. Lastly, due to the small sample size and uneven subgroups used in our study, no significant group differences between patients with refractory and nonrefractory IGE were found using NBS. However, a Cohen's d effect-size analysis for each edge in the diffusion networks between these subgroups showed small, medium, large, and very large effect sizes depending on the edge (Supplementary Fig. S4). Future studies, including a larger sample size of these subgroups, may show edge differences to be significant.
Conclusions
Patients with IGE have widespread bihemispheric network alterations that differ between patients with refractory and nonrefractory IGE relative to controls. The analysis of FA networks and nodal volumes yields the greatest differences between patient groups and provides evidence that network alterations are multilevel (node and edge). Future work should prospectively examine the use of FA networks and node volumes as predictors of treatment outcome in newly diagnosed IGE.
Footnotes
Acknowledgments
S.S.K. acknowledges support from the U.K. Medical Research Council (Grant Nos. MR/S00355X/1 and MR/ K023152/1) and Epilepsy Research UK (grant number 1085). P.N.T. acknowledges support from the Wellcome Trust (105617/Z/14/Z and 210109/Z/18/Z) and is supported by a UKRI Future Leaders Fellowship (MR/T04294X/1).
Authors' Contributions
A.M.: Conceptualization, methodology, data curation, software, original draft preparation, writing, reviewing, editing, and validation.
B.A.K.K.: Conceptualization, methodology, data curation, software, writing, reviewing, and editing.
Y.C.: Conceptualization, methodology, and data curation.
C.D.: Conceptualization, data curation, and methodology.
M.B.: Conceptualization, data curation, and methodology.
K.D.: Conceptualization, data curation, and methodology.
C.D.B.: Data curation and methodology.
A.G.M.: Conceptualization, data curation, and methodology.
P.N.T.: Conceptualization, methodology, software, writing, reviewing, editing, and supervision.
S.S.K.: Conceptualization, methodology, writing, reviewing, editing, validation, and supervision.
Author Disclosure Statement
No competing financial interests exist.
Funding Information
This work was supported by a U.K. Medical Research Council DiMeN DTP studentship awarded to Andrea McKavanagh and an ERUK project grant (Grant No. 1085) awarded to Simon S. Keller and Peter N. Taylor.
Supplementary Material
Supplementary Figure S1
Supplementary Figure S2
Supplementary Figure S3
Supplementary Figure S4
Supplementary Figure S5
Supplementary Figure S6
Supplementary Figure S7
References
Supplementary Material
Please find the following supplemental material available below.
For Open Access articles published under a Creative Commons License, all supplemental material carries the same license as the article it is associated with.
For non-Open Access articles published, all supplemental material carries a non-exclusive license, and permission requests for re-use of supplemental material or any part of supplemental material shall be sent directly to the copyright owner as specified in the copyright notice associated with the article.