
Abstract
Background:
Patients with breast cancer frequently report cognitive impairment both during and after completion of therapy. Evidence suggests that cancer-related cognitive impairments are related to widespread neural network dysfunction. The default mode network (DMN) is a large conserved network that plays a critical role in integrating the functions of various neural systems. Disruption of the network may play a key role in the development of cognitive impairment.
Methods:
We compared neuroimaging and neurocognitive data from 43 newly diagnosed primary breast cancer patients (mean age = 48, standard deviation [SD] = 8.9 years) and 50 frequency-matched healthy female controls (mean age = 50, SD = 10 years) before treatment and 1 year after treatment completion. Functional and effective connectivity measures of the DMN were obtained using graph theory and Bayesian network analysis methods, respectively.
Results:
Compared with healthy females, the breast cancer group displayed higher global efficiency and path length post-treatment (p < 0.03, corrected). Breast cancer survivors showed significantly lower performance on measures of verbal memory, attention, and verbal fluency (p < 0.05) at both time points. Within the DMN, local brain network organization, as measured by edge-betweenness centralities, was significantly altered in the breast cancer group compared with controls at both time points (p < 0.0001, corrected), with several connections showing a significant group-by-time effect (p < 0.003, corrected). Effective connectivity demonstrated significantly altered patterns of neuronal coupling in patients with breast cancer (p < 0.05). Significant correlations were seen between hormone blockade therapy, radiation therapy, chemotherapy cycles, memory, and verbal fluency test and edge-betweenness centralities.
Discussion:
This pattern of altered network organization in the default mode is believed to result in reduced network efficiency and disrupted communication. Subregions of the DMN, the orbital prefrontal cortex and posterior memory network, appear to be at the center of this disruption and this could inform future interventions.
Impact statement
This prospective study is the first to investigate how post-treatment changes in functional and effective connectivity in the regions of default mode network are related to cancer therapy and measures of memory and verbal learning in breast cancer patients. We demonstrate that the interactions between treatment, brain connectivity, and neurocognitive outcomes coalesce around a subgroup of brain structures in the orbital frontal and parietal lobe. This would suggest that interventions that target these regions may improve neurocognitive outcomes in breast cancer survivors.
Introduction
Cancer-related cognitive impairment (CRCI) is a common adverse effect of cancer pathogenesis and its treatments. We have previously demonstrated that, even a year after completing chemotherapy treatment, 55% of patients with breast cancer have cognitive impairment (Henneghan et al., 2020b; Kesler et al., 2017b). Others have shown cognitive deficit in patients who completed chemotherapy decades earlier (Koppelmans et al., 2012), suggesting that CRCI is a persistent, long-term symptom. CRCI has been associated both acutely and chronically with widespread brain injury, including all cerebral lobes as well as subcortical areas (Conroy et al., 2013; Deprez et al., 2014; Lepage et al., 2014; Menning et al., 2017; Mo et al., 2017; Nudelman et al., 2014; Stouten-Kemperman et al., 2015), suggesting the involvement of large-scale, distributed networks.
The default mode network (DMN) is one of the most commonly observed functional brain networks and includes the precuneus, posterior cingulate, medial frontal, middle temporal, and lateral parietal regions, as well as the hippocampus (Damoiseaux et al., 2006). DMN is believed to support processes such as implicit learning, autobiographical memory, prospection, monitoring the external environment, creativity, and self-reflection (Abraham, 2013; Agnati et al., 2013; Qin and Northoff, 2011; Raichle, 2011; Takeuchi et al., 2012).
DMN has been shown to represent the brain's structural core, playing a critical role in integrating the functions of various neural systems (Hagmann et al., 2008). It requires a large percentage of cerebral metabolic resources, and, as a result, may be more vulnerable to the effects of aging, injury, and disease (Tomasi et al., 2013; Zhou et al., 2012). Accordingly, altered DMN connectivity is a consistent biomarker across neurologic conditions associated with cognitive dysfunction and decline (Santhanam et al., 2019; van Oort et al., 2020; Zhou and Seeley, 2014).
The DMN may be preferentially vulnerable to chemotherapy treatment. Specifically, Dumas and colleagues (2013) demonstrated that while connectivity of prefrontal-executive networks improved over time after chemotherapy, DMN impairment remained unchanged. Miao and colleagues (2016) observed that the DMN tends to become disconnected to other functional networks following breast cancer chemotherapy. Cheng and colleagues (2017) demonstrated abnormal connectivity between multiple brain regions within the DMN among chemotherapy-treated patients with breast cancer.
We previously demonstrated that DMN connectivity can be used to automatically distinguish chemotherapy-treated breast cancer survivors from chemotherapy-naive survivors and noncancer female controls (Kesler et al., 2013). We also conducted a meta-analysis of task-based functional magnetic resonance imaging (fMRI) studies and demonstrated that DMN regions were among the most commonly affected in breast cancer patients and survivors (Kesler, 2014). Certain DMN regions show subtle dysconnectivity before onset of breast cancer treatment (Kesler et al., 2017a), which tends to predict which patients are at highest risk for postchemotherapy cognitive impairment (Kesler et al., 2017b).
Resting-state fMRI (rsfMRI) is a noninvasive neuroimaging method for measuring the connectivity of functional brain networks. Existing studies, such as those mentioned above, have focused on functional connectivity, which is based on correlations among regional rsfMRI signals and therefore undirected. Functional connectivity measures are computationally simple and yield important information regarding brain network organization. However, brain networks are actually directed, in which there are causal interactions among brain regions known as effective connectivity (Friston, 2011). Directed networks provide novel mechanistic insights by revealing the trajectories of neural systems and information exchange (Stephan et al., 2017). Evaluating effective connectivity is much more complex, traditionally requiring a known or putative anatomical model.
However, Bayesian learning algorithms can infer directed networks in a data-driven manner (Rajapakse and Zhou, 2007; Zheng and Rajapakse, 2006). Previous studies have applied Bayesian network analysis to rsfMRI data to examine DMN effective connectivity in conditions related to CRCI, including age-related mild cognitive impairment (Li et al., 2013; Wu et al., 2016). No studies to date have evaluated effective connectivity associated with CRCI. We therefore aimed to measure changes in both functional and effective connectivity of the DMN in patients with breast cancer to provide novel insights regarding the mechanisms of post-treatment CRCI.
Materials and Methods
Participants
As part of our ongoing, prospective longitudinal study of breast cancer and cognition, we enrolled 43 newly diagnosed patients with primary breast cancer (stage I–III), age 34–65 years, and 50 frequency-matched healthy control females (Table 1). Exclusion criteria included death before long-term follow-up, stage IV disease or distant metastasis, secondary cancers or relapse requiring cranial radiation or central nervous system-directed chemotherapy, unrelated central nervous system injury/disease, or nonproficient in English. Patients were assessed before initiation of any treatment (including surgery with general anesthesia), 1 month after completing chemotherapy (not used in the current study), and again 1 year later. Controls were assessed at yoked intervals. For this study, we focused on the 1-year follow-up assessment to examine the neural mechanisms of chronic CRCI. The Stanford University Institutional Review Board approved this study and all procedures performed were in accordance with the ethical standards of the Declaration of Helsinki. Written informed consent was obtained from all participants included in the study.
Participant Characteristics at Baseline
Data are shown as mean (SD) unless otherwise noted.
SD, standard deviation.
Neuroimaging acquisitions
RsMRI data were obtained while participants rested with eyes closed using a T2*-weighted (Glover and Lai, 1998) gradient echo spiral pulse sequence: repetition time (TR) = 2000 ms, echo time (TE) = 30 ms, flip angle = 80° and 1 interleave, field of view (FOV) = 22 cm, matrix = 64 × 64, in-plane resolution = 3.4375, and number of volumes = 216 at 3 Tesla. T1-weighted MRI: TR = 8.5, TE = minimum, flip = 15°, TI = 400 ms, BW = ±31.25 kHz, FOV = 22 cm, phase FOV: 0.75, slice thickness: 1.5 mm, 124 slices, 256 × 256 @ 1 NEX, and scan time: 4:33. Diffusion tensor imaging (DTI) was added later in the study protocol, and thus, data were collected for a subset of participants at Time 2 (16 breast cancer and 22 controls). DTI was acquired from 40 contiguous axial slices (thickness = 3 mm) using a single-shot echo planar imaging (EPI) sequence (TE = min, TR = 5000), FOV = 240 mm, and matrix size = 128 × 128 mm. Data included 2 images without diffusion weighting (b = 0 s/mm2) and diffusion-weighted images along 23 orthogonal directions (b = 850 s/mm2). The EPI sequence was repeated four times.
Identifying the DMN
RsfMRI data were preprocessed in CONN Toolbox v17 (Whitfield-Gabrieli and Nieto-Castanon, 2012) implemented in MATLAB v2019b (MathWorks, Inc., Natick, MA). Briefly, this involved realignment, coregistration with the segmented anatomic volume, spatial normalization, artifact detection, and smoothing (full-width-at-half-maximum = 8 mm) followed by bandpass filtering (0.008–0.09 Hz). The CompCor correction method was used to reduce physiological and other non-neuronal noise artifacts (Behzadi et al., 2007). Motion parameters from realignment were included as regressors and images identified as motion or signal outliers were excluded. Exclusion criteria included motion cutoffs of 1 mm translation, 0.05 radian rotation, and 3 SD (standard deviation) for global signal. We planned to discard data that had more than 10% volumes exceeding these thresholds in the time series. However, no participants in our study exceeded this criterion.
Temporal correlations between all possible pairs of 90 regions (Tzourio-Mazoyer et al., 2002) were computed and normalized resulting in a 90 × 90 functional connectivity matrix (network) for each participant and each time point (baseline = Time 1, 1-year follow-up = Time 2). We identified subnetworks by decomposing the functional network into nonoverlapping groups of regions (modules) that have maximal within-group connections and minimal between-group connections (Sporns and Betzel, 2016). We selected the DMN from among the modules as the one with the closest match to the known DMN configuration (Grayson and Fair, 2017; Meunier et al., 2009; Power et al., 2011). Being a data-driven process, DMN module configurations differed for each group at each time point. To facilitate comparisons, we selected the 11 regions that were common across groups and time points as the final DMN module (Supplementary Table S1).
Functional connectivity
We modeled the DMN for each participant as a system of nodes and edges representing regions and their normalized temporal correlations, respectively. Graphs were constructed with N = 11 nodes, network degree of E = number of edges, and a network density of D = E/[(N × (N − 1))/2] representing the fraction of present connections to all possible connections.
We measured the mean clustering coefficient, path length, transitivity, local and global efficiency of the DMN using Brain Connectivity Toolbox (Rubinov and Sporns, 2010) implemented in MATLAB v2019b (MathWorks, Inc.). These are commonly measured properties that provide insight regarding a network's specialization (clustering, transitivity, and local efficiency) and integration (path length and global efficiency) (Bullmore and Sporns, 2009; Schank and Wagner, 2005). We have previously shown that these properties are altered by chemotherapy in both humans and rodents (Bruno et al., 2012; Chiu et al., 2018; Kesler et al., 2017a, 2018b; Tang et al., 2019).
These properties were measured globally for the entire DMN. We also evaluated local DMN connectivity by measuring edge centrality (i.e., centrality), which indicates the importance of each edge for the network's integration (Kaiser, 2011). This resulted in an 11 × 11 matrix of edge centrality values for each participant.
As in prior studies by our group and others (Bassett et al., 2006, 2012; Kesler et al., 2018a), connectivity properties were measured across connection densities (thresholds) from minimum connection density to the maximum biologically plausible density of 50% (Kaiser and Hilgetag, 2006) at intervals of 1% connection density. The area under the curve across densities was computed and compared between groups at each time point and within groups across time using nonparametric permutation testing.
Specifically, we first calculated mean differences between the groups for each property, using the slope (Time 2 − Time 1) for longitudinal analyses. A permutation distribution of difference scores for each property was created by resampling participant data into two random groups of equal size to the original groups 5000 times. We then calculated the network properties for each random group. The differences between the randomized groups comprised the permutation distributions. The significance of the permutation test (p) was determined by calculating the mean number of instances that the permutation difference scores were greater than the original difference score, with false discovery rate (FDR) correction for multiple comparisons (Benjamini and Yekutieli, 2001). Permutation testing was conducted in MATLAB v2019b.
Effective connectivity
We performed a Bayesian network analysis, which learns the conditional dependencies between brain regions. This method characterizes the effective connectivity of the network without any prior assumptions (Rajapakse and Zhou, 2007). We implemented a hill-climbing approach (Gámez et al., 2011) in which the model that optimized the Bayesian information criterion score was considered the best fit network. Briefly, the conditional independence/dependence relationships among random variables were encoded with a directed acyclic graph: if a random node A directly depends on another random node B, even given all the other random nodes, then the dependence is encoded as an edge between nodes A and B (Li et al., 2008). The edges can be considered a set of linear regression models, and therefore, each edge is associated with a beta-coefficient. An edge was defined as having a significant coefficient (p < 0.05) after FDR correction.
Effective connectivity was compared graphically between groups at each time point and within groups across time points to indicate false-positive, false-negative, and true-positive edges. We used permutation testing as described above to determine if the number of false-negative/false-positive edges was significantly greater than that of random groups. We also compared the coefficients for true-positive edges (those that were common between groups at each time point or within groups across time points) using permutation testing. In this case, we calculated the original linear regression model for each edge for each of the 5000 random groups (Wu et al., 2011). The differences between the randomized groups in edge coefficients comprised the permutation distributions. Bayesian network analyses, including graphical comparisons and permutation testing, were conducted in the R Statistical Package v3.6.2 (R Foundation, Vienna, Austria), including the “bnlearn” library (Scutari, 2009).
Gray matter volumes
Gray matter maps were obtained using voxel-based morphometry (VBM) (Kurth et al., 2015). Images were first manually reoriented to the anterior and posterior commissures, then realigned, segmented into tissue compartments, spatially normalized to a template using diffeomorphic anatomical registration through exponentiated lie algebra (DARTEL), modulated, and smoothed using the VBM8 Toolbox (Kurth et al., 2015). We then measured gray matter volume from each of the 11 DMN regions in mm3 using the “fslstats” function of the FMRIB Software Library (FSL) v6.0 (Jenkinson et al., 2012). We compared DMN gray matter volumes between groups at each time point and within groups across time using independent or paired t-tests, respectively, with FDR correction, in the R Statistical Package.
White matter integrity
DTI data were processed as in our prior studies (Kesler et al., 2015, 2016, 2018b). Briefly, eddy current correction was performed in FSL. A binary brain mask of the B0 image was created using FSL Brain Extraction Tool and applied to corrected DTI volumes to constrain tensor fitting and tractography to brain tissue. Tensor reconstruction and deterministic tractography were performed in Diffusion Toolkit v0.6.4.1 and TrackVis v0.6.1 (Feigl et al., 2014; Wang et al., 2007), respectively. Tractography used the fiber assignment by continuous tracking algorithm (Mori and van Zijl, 2002). We used a curvature threshold of 60° and streamlines were smoothed using a spline filter.
Virtual fibers were mapped between each pair of 11 DMN regions. Mean fractional anisotropy (FA), apparent diffusion coefficient (ADC), and length of virtual fibers (edges) were measured using the UCLA Multimodal Connectivity Package (Brown, 2014) resulting in an 11 × 11 matrix for each metric for each participant. These were compared at Time 2 (the only available time point) using nonparametric permutation testing as described above for functional connectivity, with FDR correction.
Cognitive outcomes and imaging correlates
Verbal learning, interference, and retention were measured using the Rey Auditory Verbal Learning Test (RAVLT) Immediate, Interference, and Delayed Recall tests, respectively (Schmidt, 2012). Attention and processing speed were measured using Trail 1 of the Comprehensive Trail Making Test (CTMT), and attention, processing speed, and cognitive flexibility using Trail 5 of the CTMT (Moses, 2004). Verbal fluency was assessed using the Controlled Oral Word Association (COWA) (Ruff et al., 1996). In addition, we measured depression, anxiety, and fatigue using the total score from the clinical assessment of depression (CAD) (Aghakhani and Chan, 2007).
Test scores were compared between groups at each time point using independent t-tests and across time using linear mixed modeling. Two-tailed Pearson or spearman correlations, as appropriate, were conducted to explore relationships between DMN measures and test scores that were significantly different between groups. We also examined relationships between DMN, cognitive performance, and clinical variables in the breast cancer group. Given that longitudinal analyses were not significant, correlations were conducted at Time 2 within each group to focus on associations of chronic CRCI and to reduce the number of comparisons.
For each comparison for a given hypothesis (i.e., edge centrality in survivor's vs. controls or global efficiency in survivor's vs. controls), the FDR method was used to correct for the multiple comparison problem. However, analyses of cognitive tests were not corrected for multiple comparisons given the known limited sensitivity to CRCI of these tests compared with neuroimaging metrics (Horowitz et al., 2018; Kesler et al., 2020). Statistical tests were performed in the R Statistical Package including the “lmerTest” library for linear mixed modeling (Kuznetsova et al., 2017).
Results
Functional connectivity
At Time 1, there were no between-group differences in global DMN properties (Table 2). However, there were multiple local differences in which the breast cancer group showed significantly (p < 0.013, FDR corrected) higher or lower edge centrality compared with controls (Fig. 1). At Time 2, the breast cancer group showed significantly higher global efficiency and path length compared with controls (p < 0.03, FDR corrected, Table 2). At Time 2, centrality was significantly lower for multiple edges in the breast cancer group compared with controls (p < 0.0001, FDR corrected), with several edges showing a significant group-by-time effect (p < 0.003, FDR corrected, Fig. 1).
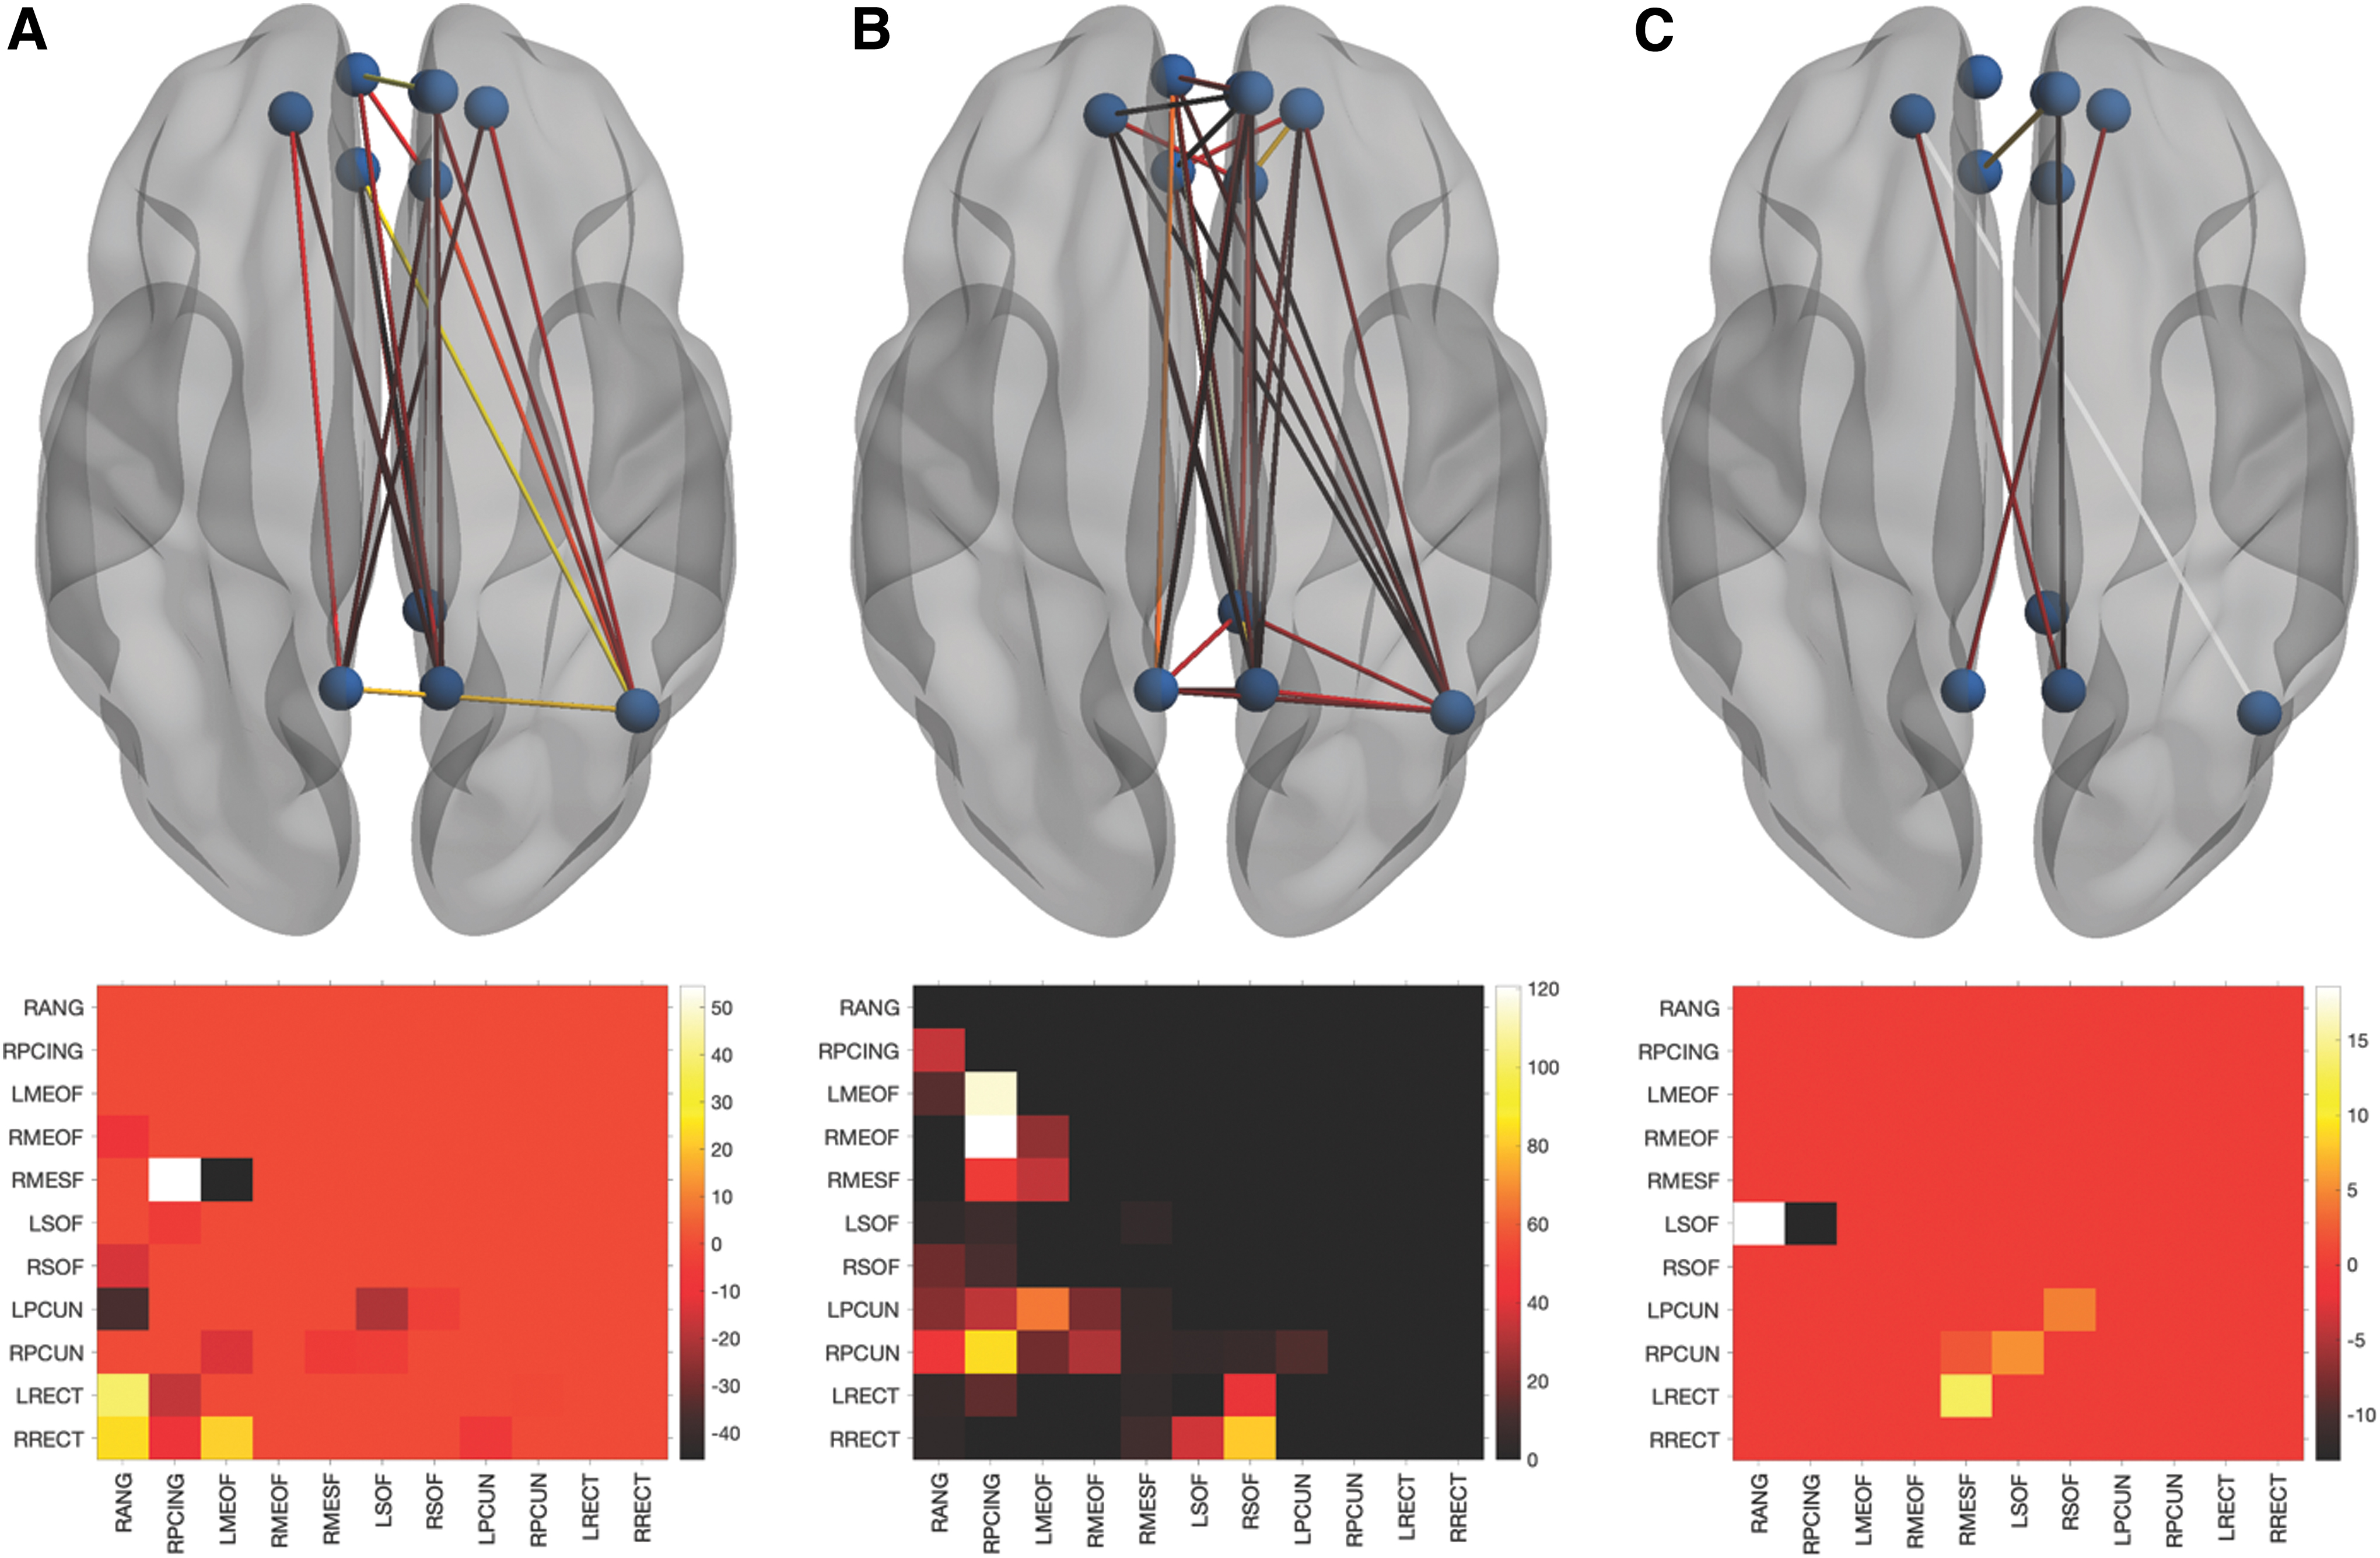
Local DMN functional connectivity. Differences in edge centrality represented in the upper row by ball and stick models with all 11 nodes as spheres and significant edges as lines. The bottom row presents the corresponding lower triangle heatmap representing the mean difference (control minus breast cancer). At Time 1
Global Default Mode Network Functional Connectivity Properties
Data are shown as mean (SD).
Control minus breast cancer.
Significantly higher in breast cancer compared with controls at Time 2 (p < 0.03, FDR corrected).
CI, confidence interval; FDR, false discovery rate.
Effective connectivity
Patterns of effective connectivity among DMN regions for each group are shown in Supplementary Figure S1. In this analysis, false positive is a connection between two regions, which, either connects where there is no true connection, or connects two regions where there is a true connection but takes a pathway that is not true to the underlying anatomy. A false negative is the failure to generate a connection between regions for which there is a true connection (Drakesmith et al., 2015).
As shown in Figure 2, at Time 1, the breast cancer group, compared with controls, showed 6 true-positive-, 10 false-positive-, and 7 false-negative-directed edges. At Time 2, there were nine false positives (two common with Time 1), seven false negatives (one common with Time 1 but reversed direction), and three true positives (two common with Time 1). The number of false-positive (p = 0.05)- and false-negative (p = 0.02)-directed edges in the breast cancer group were significantly greater than that of random groups at T2, but not at T1 (p > 0.10). The true-positive edges did not differ significantly in terms of edge coefficients at Time 1 (p > 0.235, FDR corrected) or at Time 2 (p > 0.53, FDR corrected).
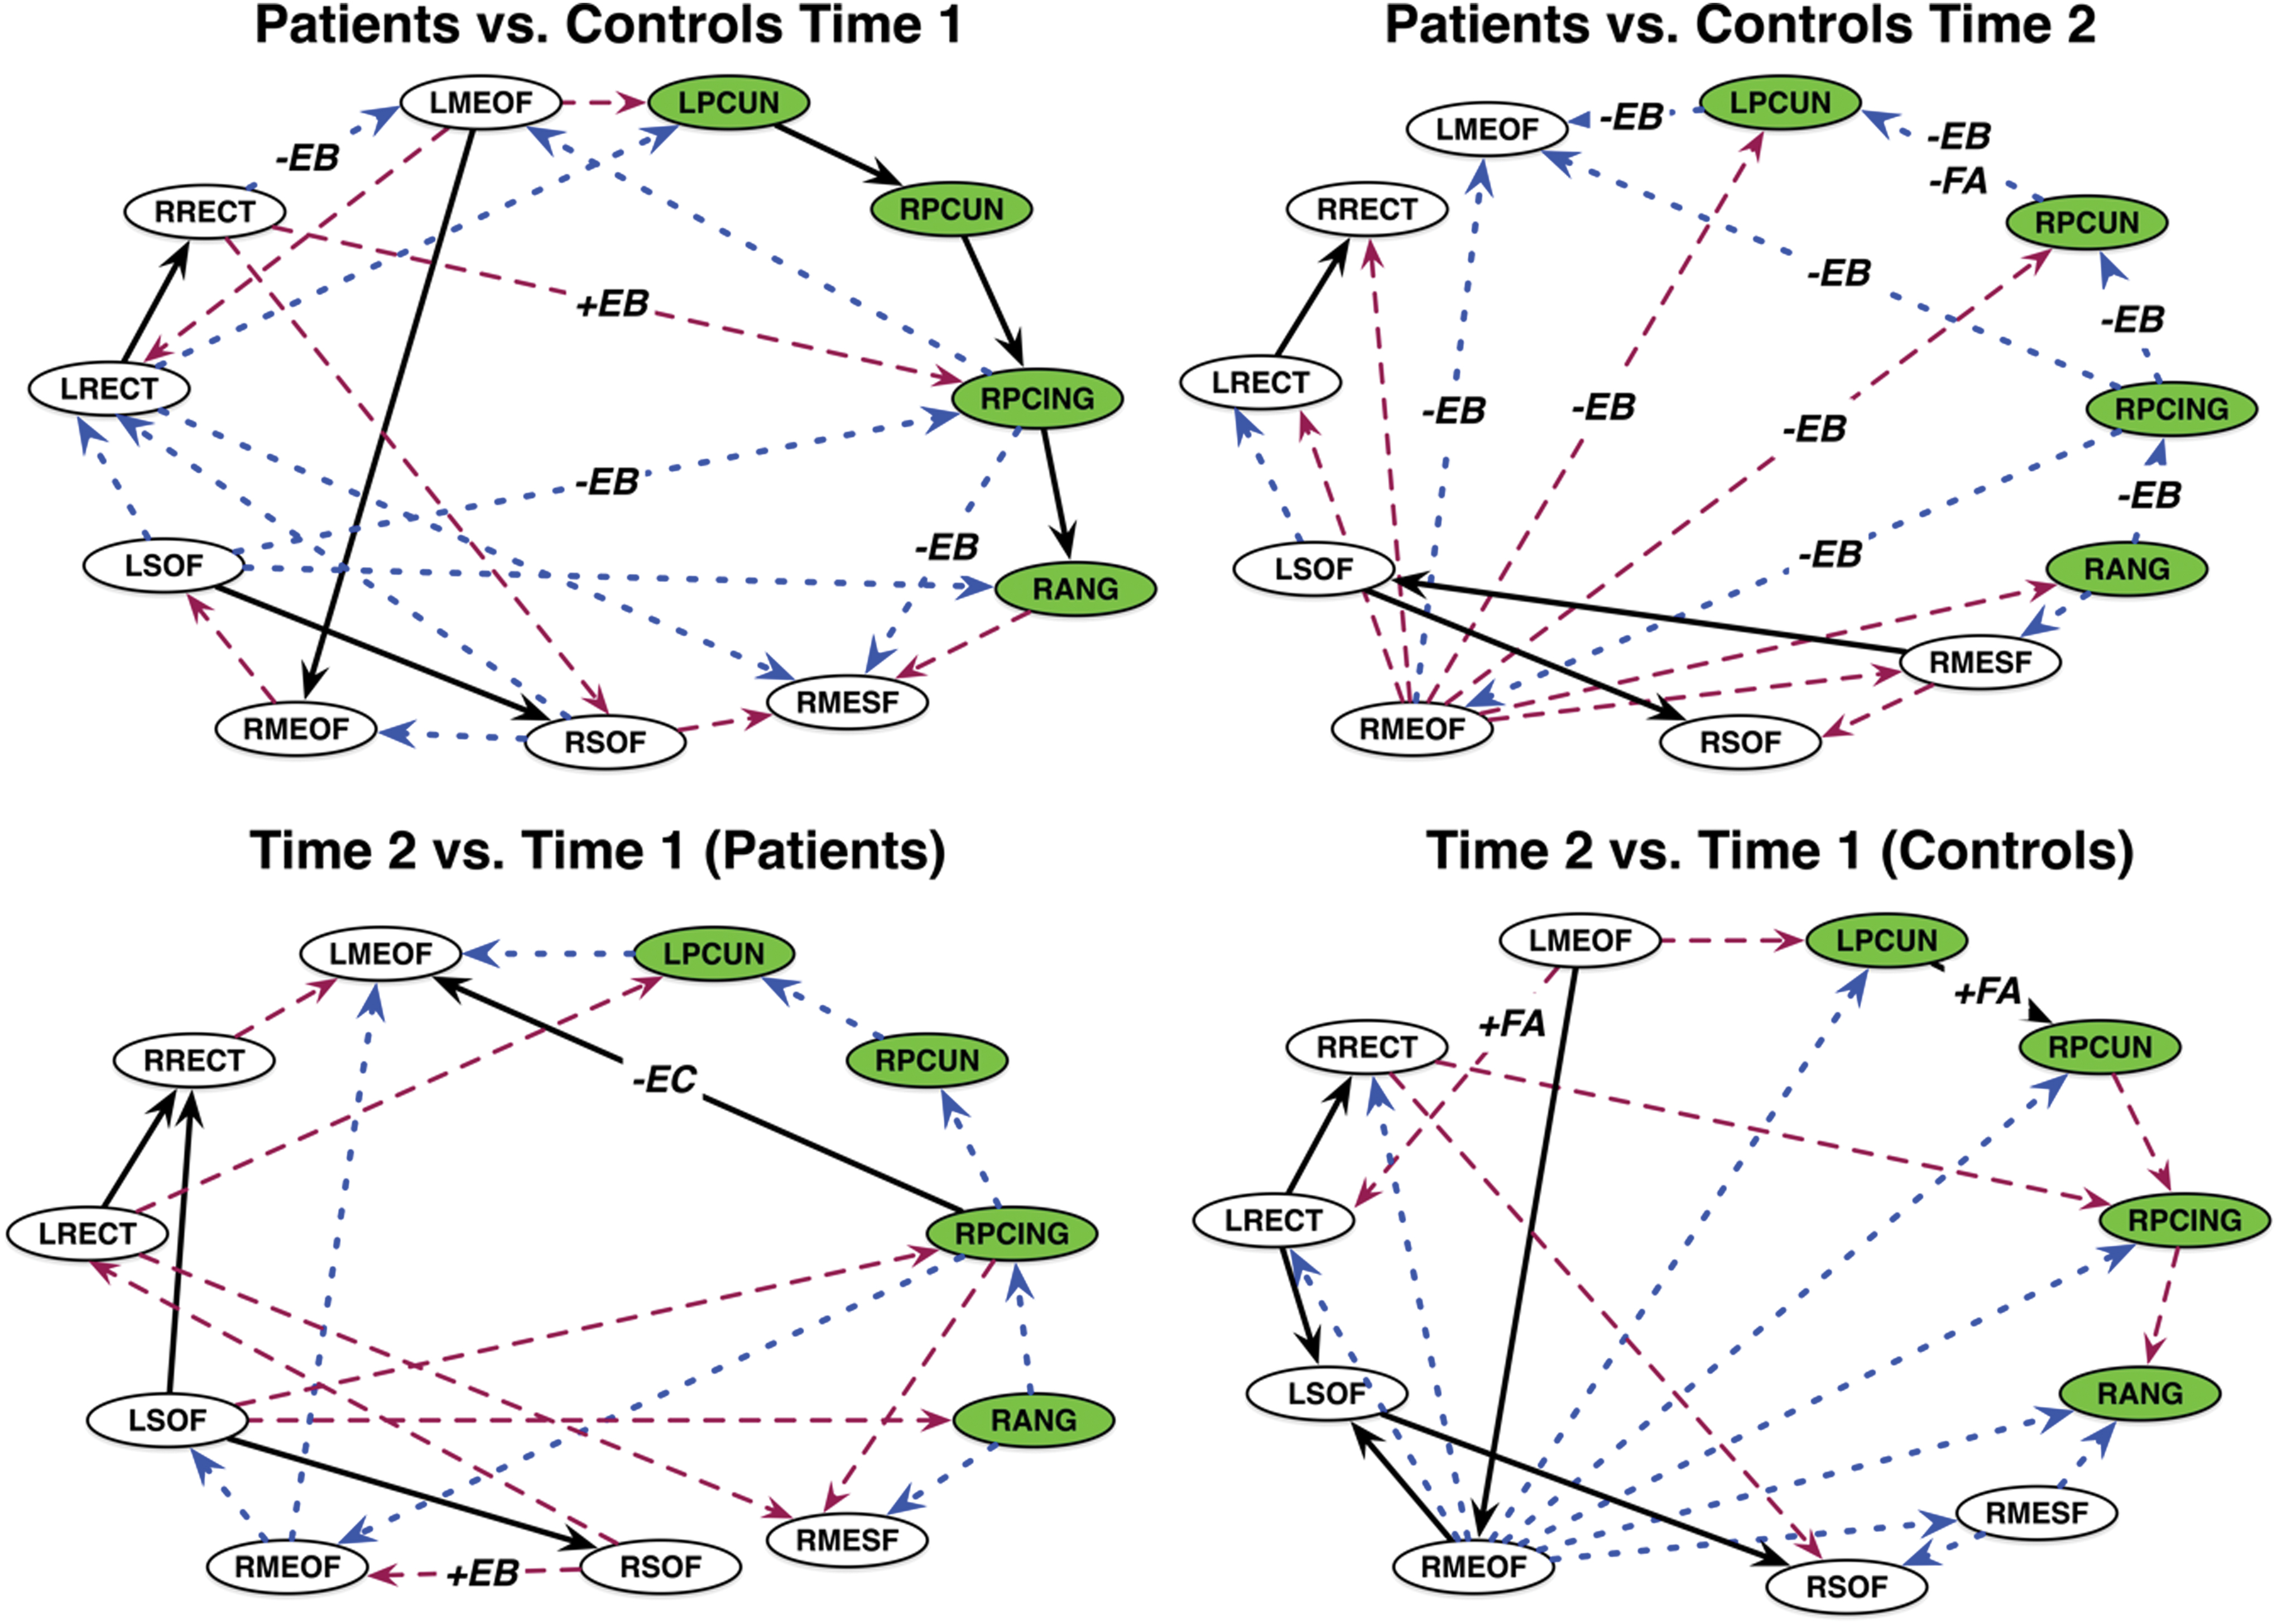
Graphical comparisons of DMN effective connectivity. Between-group (top row) and within-group (bottom row) comparisons based on graphical comparison. Black lines denote true positives, blue are false positives, and maroon are false negatives for patients compared with controls, or Time 2 compared with Time 1. Edge labels indicate overlap with functional connectivity and/or white matter integrity comparisons: +/−EB = higher/lower edge centrality +/−FA = higher/lower fractional anisotropy. The +/−EC edge label indicates a significant difference in edge coefficient (p = 0.03, FDR corrected). Nodes in the PMN are colored green. PMN, posterior memory network. Color images are available online.
For the breast cancer group, there were eight false-positive, eight false-negative, and four true-positive edges at Time 2 compared with Time 1 (Fig. 2). The true-positive edge from the right posterior cingulate to left medial orbital frontal gyrus showed decreased connectivity strength over time as indicated by the change in edge coefficient (p = 0.03, FDR corrected, Fig. 2). In controls, there were nine false-positive and six false-negative and six true-positive edges at Time 2 compared with Time 1 (Fig. 2). None of the true-positive edges changed significantly across time in terms of connectivity strength for controls.
Gray matter volumes
There were no significant cross-sectional or longitudinal differences in gray matter volume for any DMN nodes (p > 0.28, FDR corrected, Supplementary Table S2).
White matter integrity
The mean FA of several DMN edges was significantly lower in patients with breast cancer compared with controls (p < 0.008, FDR corrected, Supplementary Fig. S2) at Time 2. ADC and length were not significant (p > 0.126, FDR corrected).
Cognitive outcomes and imaging correlates
At Time 1, Immediate Recall, Trail 1, and COWA scores were significantly lower in the breast cancer group compared with controls (p < 0.02, Table 3). CAD score was significantly higher in patients with breast cancer (p < 0.001). At Time 2, the breast cancer group demonstrated significantly lower Interference Recall, Trail 1, and COWA performance (p < 0.048), and the CAD score was significantly higher (p = 0.011). Both groups tended to improve in cognitive performance over time, but there were no group-by-time effects (Table 3). CAD score also remained unchanged over time (Table 3).
Cognitive-Behavioral Assessment Scores
Data are shown as mean (SD).
Significantly different between groups at Time 1 (p < 0.02, uncorrected).
Significantly different between groups at Time 2 (p < 0.048, uncorrected).
CAD, clinical assessment of depression; COWA, Controlled Oral Word Association; LMM, linear mixed model.
As shown in Table 4, in general, cognitive performance showed both negative and positive correlations with edge centrality and FA in both groups. In the breast cancer group, hormone blockade therapy (yes/no) was negatively correlated with centrality of three edges. Radiation therapy (yes/no) was positively correlated with centrality for one edge and negatively correlated with two others, as well as negatively correlated with the FA of one edge. The number of chemotherapy cycles was positively correlated with centrality for four different edges. CAD was not significantly correlated with DMN measures or cognitive testing scores in either group.
Time 2 Correlations Between Default Mode Network Connectivity, Cognitive Function, and Clinical Variables
Only significant (p < 0.05) correlations are shown.
DMN, default mode network; FA, fractional anisotropy; L/RMEOF, left/right medial orbital frontal; L/RPCUN, left/right precuneus; L/RRECT, left/right rectus gyrus; L/RSOF, left/right superior orbital frontal; RANG, right angular gyrus; RMESF, right medial superior frontal; RPCING, right posterior cingulate.
Discussion
Global efficiency and path length, indicating the overall functional connectivity of the DMN, were significantly higher post-treatment in the breast cancer group compared with controls. These are measures of network integration and suggest that regions have higher direct information exchange (Latora and Marchiori, 2001). However, greater network integration comes at an increased wiring and metabolic cost (Achard and Bullmore, 2007). The brain network shows a small-world organization characterized by high local connectivity and economical long-range connectivity to balance the opposing demands of specialization and integration (Bassett and Bullmore, 2017). Accordingly, we have previously demonstrated that too much, as well as too little, connectivity is associated with CRCI (Kesler et al., 2016). Above normal integration has also been noted previously in other cognitive disorders, including Alzheimer's disease (Kesler et al., 2018a; Wang et al., 2013).
Locally, DMN functional connectivity was altered in patients with breast cancer at baseline, characterized by some DMN edges showing higher connectivity, while others showed lower connectivity compared with controls. This is consistent with previous studies (Kaiser et al., 2019; Patel et al., 2015) and suggests potential effects of tumor pathogenesis, inflammation, and/or patient-related factors on CRCI. Post-treatment, alterations in local connectivity among patients with breast cancer were more widespread throughout the DMN. A summary of correlations between functional connectivity and cognitive performance as it relates to therapy is presented in Figure 3. Local connectivity was measured using edge-betweenness centrality, which provides insights regarding the importance, or centrality, of a particular edge to the network (Girvan and Newman, 2002; Newman and Girvan, 2004). Even though the centrality of certain edges actually increased over time in patients with breast cancer, all remained significantly lower compared with controls at Time 2. This suggests that several DMN connections may become damaged after breast cancer treatments and show insufficient recovery over time such that they play a diminished role in information exchange.
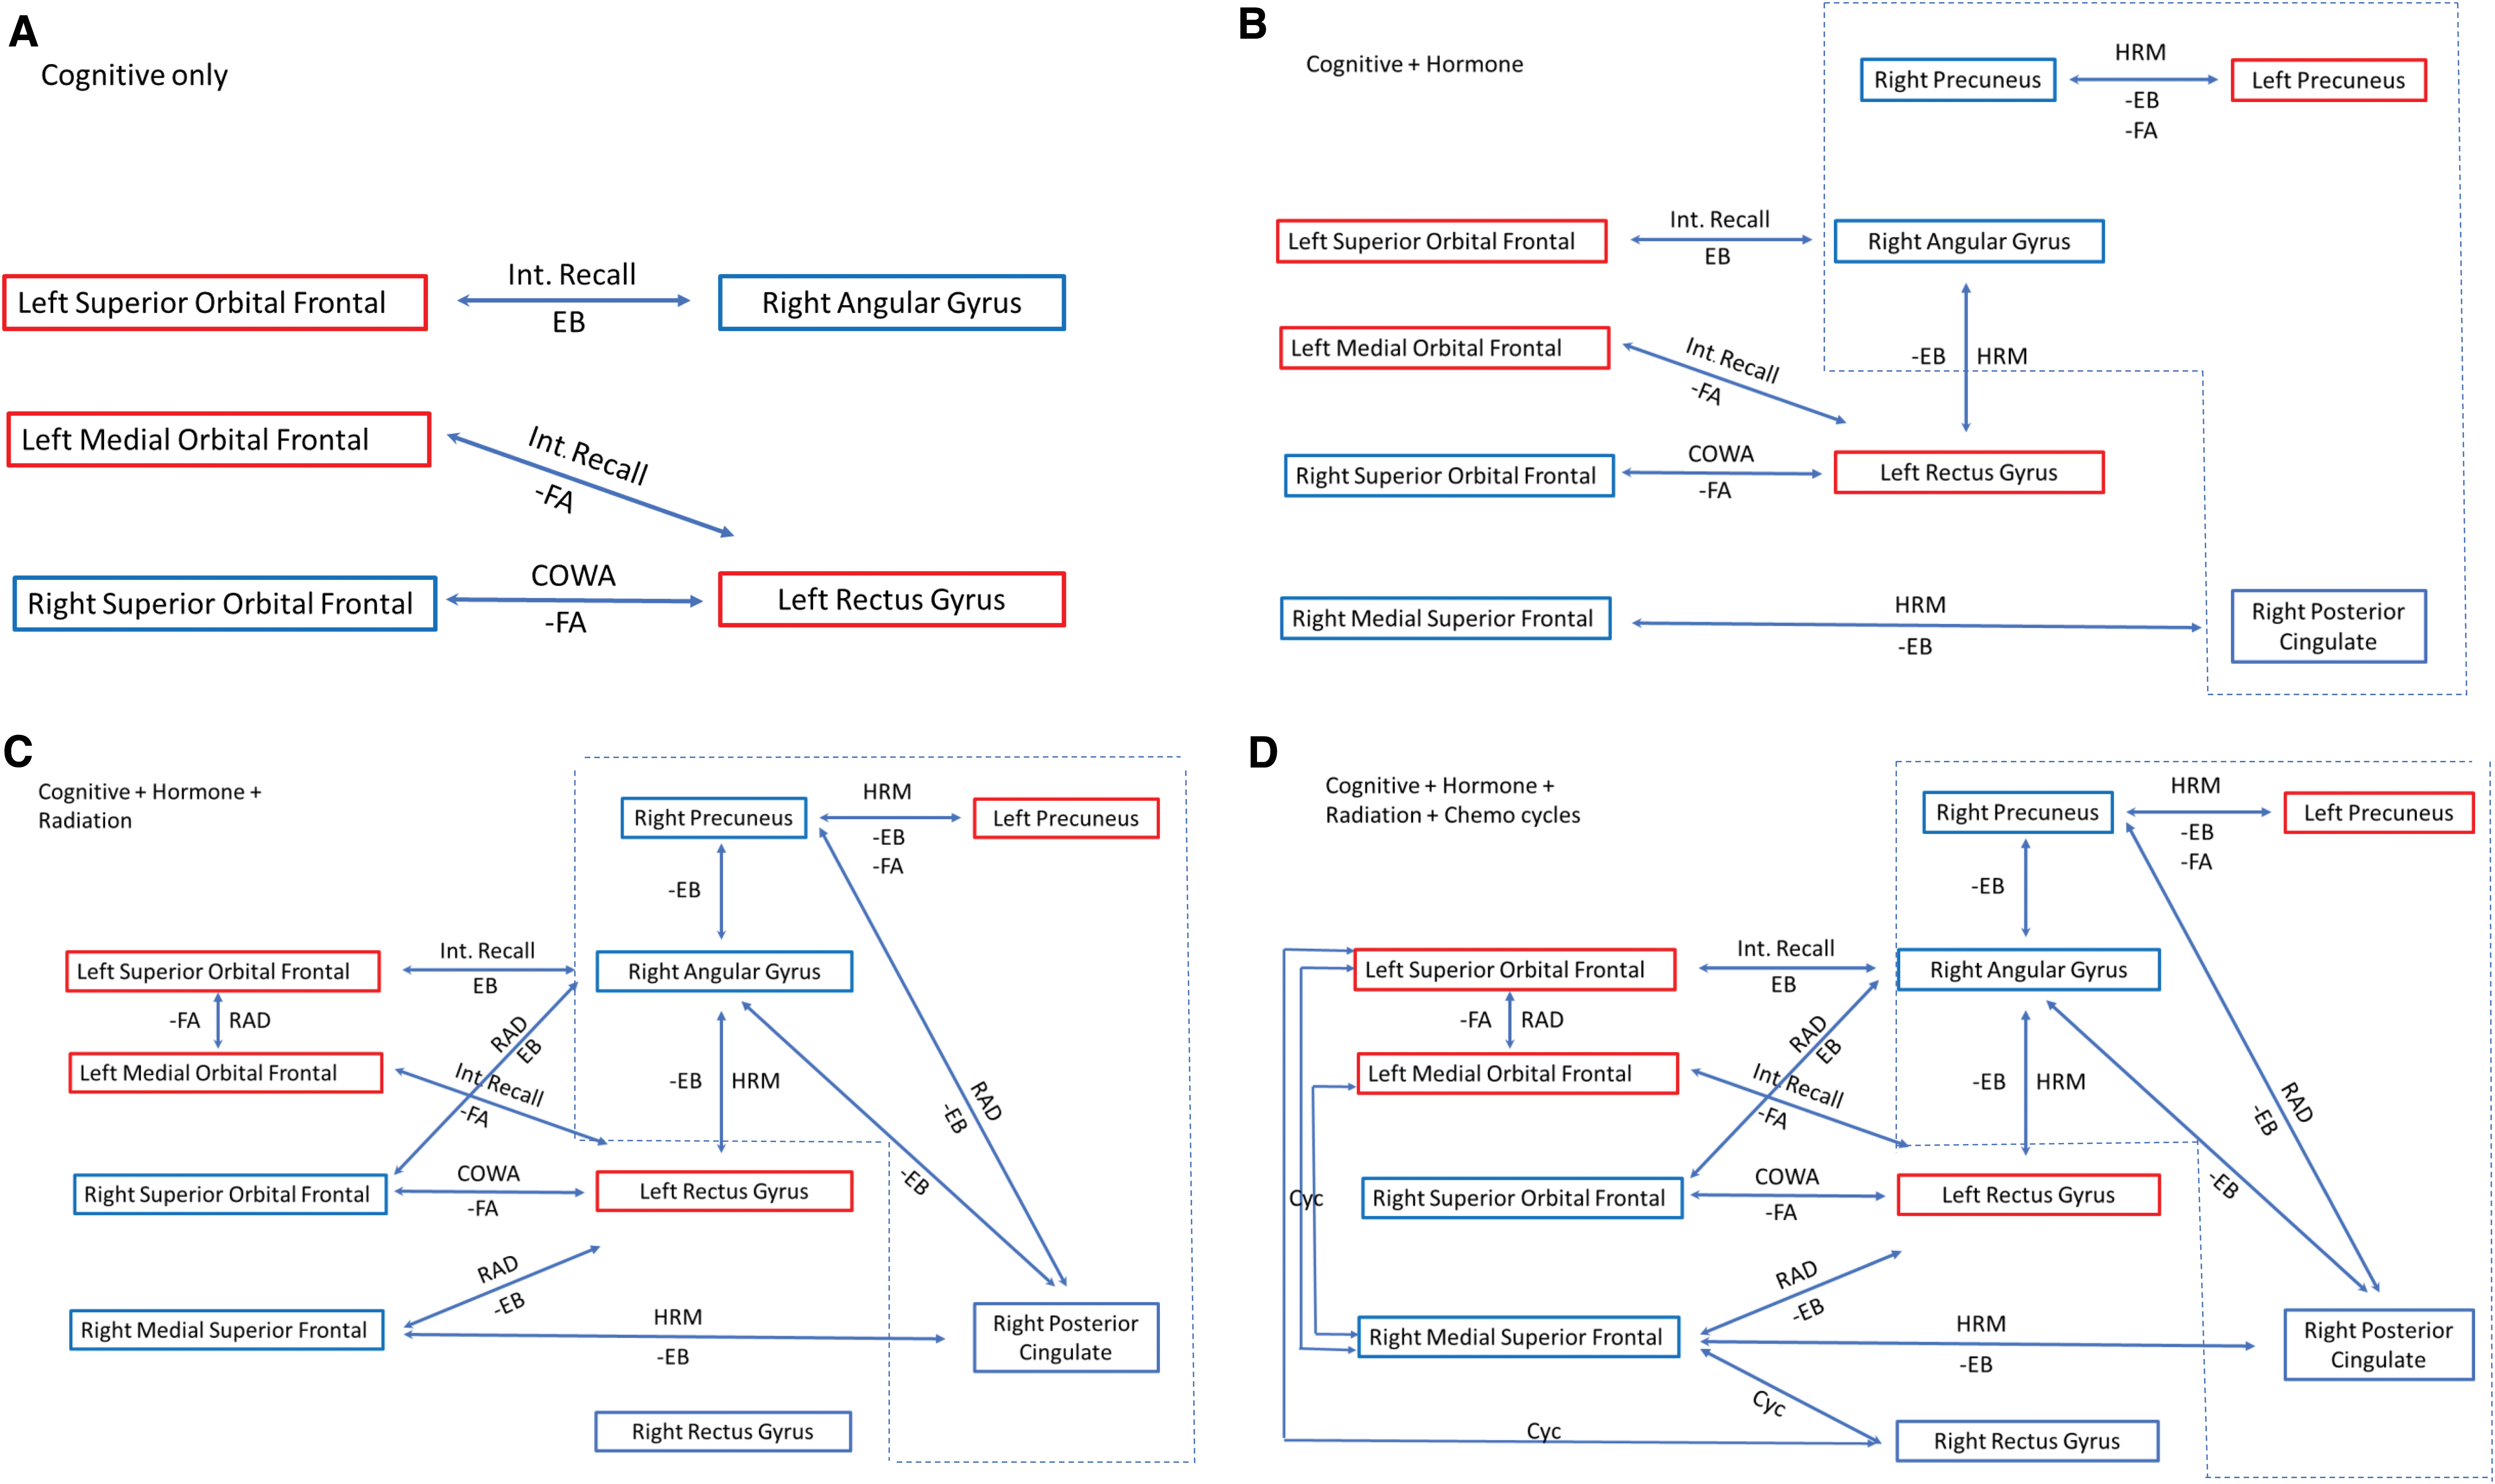
Summary of correlations between cognitive testing, treatment, structural, functional, and effective connectivity at Time 2. Correlations for the breast cancer group for FA and EB, therapy, and cognitive deficits are linked to form a network that may inform future interventions. Negative correlations are denoted by the minus (−) sign. Bilateral superior and left medial orbital frontal are part of the OPFC. Red box denotes left hemisphere and blue denotes right hemisphere structures. Dash line box demotes structures associated with the PMN.
Our results indicated significant differences in effective connectivity for patients with breast cancer post-treatment, but not pretreatment. Post-treatment differences included several false-positive- and false-negative-directed edges compared with controls, indicating significantly altered patterns of efferent and afferent projections. Lower edge-betweenness centralities overlapped with 29% of the false-negative- and 78% of the false-positive-directed edges (Fig. 2), suggesting that the direction of information exchange may alter or be altered by edge importance.
Interestingly, many of the effective connectivity differences involved a purported subnetwork called the posterior memory network (PMN), which sits adjacent to and may be separate from the DMN (Gilmore et al., 2015). This incidental finding is important for a number of reasons. At Time 1, the PMN was seen in both controls and patients. However, at Time 2, this network in patients shifted to a false positive (i.e., connections were missing or had different directions than those in the control network). The PMN has been associated with memory encoding and retrieval, which patients showed difficulties at both time points.
Both groups demonstrated longitudinal changes in effective DMN (and PMN) connectivity. The stability of the PMN over time is unknown, although there is evidence of longitudinal change in DMN functional connectivity (Staffaroni et al., 2018). Since the stability of PMN is unknown, future studies should be conducted to determine if it is a good target for interventions in this cohort. Brain connectivity in general is very dynamic and appears to be modulated by the DMN (Betzel et al., 2016; Fukushima et al., 2018).
Greater number of chemotherapy cycles was correlated with higher betweenness centralities, especially for edges involving the right medial superior frontal (RMESF) cortex. We previously noted higher functional connectivity in this region among long-term breast cancer survivors who had received anthracycline chemotherapies compared with chemotherapy-naive survivors (Kesler and Blayney, 2016), and most patients in the present study received anthracycline chemotherapies. Increased connectivity of RMESF has also been associated with increased cerebrospinal fluid amyloid-beta levels (Canuet et al., 2015). Increased RMESF connectivity is also present in cognitively normal adults with an apolipoprotein e4 genotype, which is associated with increased amyloid-beta aggregation (Yang et al., 2014). Interestingly, anthracyclines are used as a treatment for amyloidosis and are believed to work by binding to and dissolving amyloid (Gianni et al., 1995). If RMESF tends to have a relatively higher amyloid concentration normally, anthracycline chemotherapies may be preferentially drawn to it. We have shown in vitro that even very small amounts of doxorubicin can cause significant, long-term neuron death in cortical tissue, and importantly, this damage was reduced by levetiracetam (Manchon et al., 2016).
Radiation therapy was also associated with altered local functional connectivity as well as lower white matter integrity. The relationships between radiation therapy and edge-betweenness centralities were both positive and negative. The clinical significance of the positive correlations between breast cancer treatments and edge centralities is difficult to interpret given that some edges significantly increased in centrality over time. Since edge centralities in the patient group post-treatment were significantly lower than controls, this might suggest that chemotherapy and/or radiation have a positive effect on certain aspects of local functional connectivity.
However, the only correlation between local connectivity and cognitive function was inverse; lower interference memory was associated with higher centrality for the edge between left superior orbital frontal and right angular gyri. The brain network is a very complex system, and thus, alterations in connectivity by treatments in certain regions may propagate changes in other areas that result in cognitive impairment. Previous studies have suggested that pathology spreads through the brain networks from targeted epicenters (Crossley et al., 2014; Zhou et al., 2012). We previously demonstrated that physical exercise can protect large-scale white matter organization from radiation damage, including damage resulting in higher path length (Sahnoune et al., 2018).
The impact of hormone modulation therapy on targeted brain regions demonstrated in our study could be driven by estrogen receptor (ER) blockade or aromatase-regulated estradiol 2 (E2) production. A previous study demonstrated that postmenopausal women taking tamoxifen showed lower metabolic rates of glucose metabolism in the orbital frontal and dorsolateral prefrontal cortices compared with woman taking estrogen (Eberling et al., 2004). Interestingly, the nucleus accumbens is ER-beta (ER-β) rich and protrudes into the posterior rectus gyrus, which lies adjacent to the medial orbital gyrus. This could indicate that ER activity in this region may play some role in connectivity changes since tamoxifen is known to bind with equal affinity to the ER-β receptor (Kuiper et al., 1997). Both E2 and tamoxifen have been reported to negatively affect glutamate binding to N-methyl-
Interestingly, all the interlinkages between connectivity, treatment, and neurocognitive outcomes center around the orbital prefrontal cortex (OPFC) and PMN. This would suggest that interventions that target the OPFC or PMN may be beneficial. Animal studies have shown that oxytocin receptors are in higher concentrations in the nucleus accumbens and OPFC (Insel and Shapiro, 1992; Jurek and Neumann, 2018). Studies in noncancer female participants have shown that oxytocin improves memory performance when tied to an emotional stimulus (Brambilla et al., 2016). The OPFC processes the physical, chemical, and emotional properties of sensory information and has been associated with learning and memory and evaluation of positive and negative enforcers (Kringelbach, 2005). This aligns with neuroimaging studies that demonstrated, when synced with an emotional cue, oxytocin significantly enhanced connectivity between the orbital frontal cortex, precuneus, and angular gyrus (Riem et al., 2012).
These results have been reproduced in multiple studies and, in females, suggest that brain network changes may be context dependent (Bethlehem et al., 2013). In addition, oxytocin has been shown to mediate the beneficial effects of exercise training on improved memory outcomes in breast cancer survivors who engage in a formal exercise program during chemotherapy (Alizadeh et al., 2018; Salerno et al., 2019). Finally, no study has investigated the use of intranasal delivered oxytocin during therapy, although studies in noncancer populations have shown mixed effects on long-term memory (Brambilla et al., 2016).
Limitations of this study include missing data for Time 2 and no DTI for Time 1. Our cognitive testing battery was very limited to reduce participant burden. It also relied on neuropsychological tests that are known to have limited sensitivity and specificity for CRCI (Horowitz et al., 2018). These factors likely increased our false-negative rate regarding cognitive effects and correlations. Previous studies have demonstrated evidence of microbleed and altered cerebral perfusion post-treatment in breast cancer survivors, which may impact MRI signal detection or neurovascular coupling (Koppelmans et al., 2015; Nudelman et al., 2014). However, a growing body of evidence has demonstrated the reliability and reproducibility of detecting DMN abnormalities in breast cancer survivors (Conroy et al., 2013; de Ruiter et al., 2011; Kesler et al., 2009, 2011). Measures of estrogen levels, and amyloid or NMDA activity were not acquired during this study, and so, our potential intervention targets require further study. Finally, there are many different options for conducting functional and effective connectivity analyses that may yield different findings.
However, this is a comprehensive, multimodal, longitudinal study demonstrating novel neural mechanisms underlying CRCI that point to potential intervention targets. This is the first investigation of effective connectivity associated with CRCI and our findings provided unique insights regarding the PMN, a specific subnetwork within the DMN that may be affected by breast cancer and its treatments. We have initiated much larger studies that will include cognitive neuroscience-based tasks to provide greater insight into component cognitive processes. We will also compare alternate methods for functional and effective connectivity measurement. We have implemented an innovative assay for measuring amyloid-beta and tau (Henneghan et al., 2020a), and we will collect data pertaining to estrogen levels in future studies.
Conclusion
In this prospective cohort study, we show differences between survivors and healthy community controls. We demonstrate associations between treatment and survivors' effective and functional brain connectivity, and neurocognitive outcomes. The novelty of this study includes the identification of subregions of the DMN whose disruption is associated with cognitive impairment in breast cancer patients. Our findings highlight that the orbital frontal cortex is a suitable target for an intervention study that may prevent or manage CRCI in female breast cancer patients.
Footnotes
Acknowledgments
The content is solely the responsibility of the authors and does not necessarily represent the official views of the National Institutes of Health.
Authors' Contributions
This study was developed by the principal investigator (S.R.K.). Data preparation was conducted by V.R., L.K., S.M., R.V., and S.R.K. Neuroimaging analysis was conducted by V.R. and S.R.K. Statistical analysis was conducted by V.R., L.K., and S.R.K. The article was prepared and edited by N.S.P., K.K., and S.R.K. All authors approved the article for submission. V.R., L.K., R.V., S.M., and S.R.K. had access to the raw data.
Author Disclosure Statement
No competing financial interests exist.
Funding Information
This study was funded by the National Institutes of Health (R01CA172145 and R01CA226080 to Shelli R. Kesler, and T32CA225590 to Kevin Krull).
Supplementary Material
Supplementary Figure S1
Supplementary Figure S2
Supplementary Table S1
Supplementary Table S2
References
Supplementary Material
Please find the following supplemental material available below.
For Open Access articles published under a Creative Commons License, all supplemental material carries the same license as the article it is associated with.
For non-Open Access articles published, all supplemental material carries a non-exclusive license, and permission requests for re-use of supplemental material or any part of supplemental material shall be sent directly to the copyright owner as specified in the copyright notice associated with the article.