
Abstract
Introduction:
The human brain shows modest traits of sexual dimorphism, with the female brain, on average, 10% smaller than the male brain. These differences do not imply a lowered cognitive performance, but suggest a more optimal brain organization in women. Here we evaluate the patterns of functional connectivity (FC) in women and men from the Connectomics of Brain Aging and Dementia sample.
Methods:
We used phase locking values to calculate FC from the magnetoencephalography time series in a sample of 138 old adults (87 females and 51 males). We compared the FC patterns between sexes, with the intention of detecting regions with different levels of connectivity.
Results:
We found a frontal cluster, involving anterior cingulate and the medial frontal lobe, where women showed higher FC values than men. Involved connections included the following: (1) medial parietal areas, such as posterior cingulate cortices and precunei; (2) right insula; and (3) medium cingulate and paracingulate cortices. Moreover, these differences persisted when considering only cognitively intact individuals, but not when considering only cognitively impaired individuals.
Discussion:
Increased anteroposterior FC has been identified as a biomarker for increased risk of developing cognitive impairment or dementia. In our study, cognitively intact women showed higher levels of FC than their male counterparts. This result suggests that neurodegenerative processes could be taking place in these women, but the changes are undetected by current diagnosis tools. FC, as measured here, might be valuable for early identification of this neurodegeneration.
Impact statement
Functional connectivity is a promising tool to detect brain functional changes that may lead to age-associated cognitive impairment. Here we studied networks in the alpha band, which are affected during the asymptomatic phase of neurodegenerative disorders. We found that the older females had greater phase locking values in these networks than men, similar to what is found in people with mild cognitive impairment. This suggests the possibilities that women may have brain functional changes earlier in life than men, which might explain the higher prevalence of dementias among women than men.
Introduction
The human brain shows modest traits of sexual dimorphism, with the female brain, on average, 10% smaller than the male brain (Ruigrok et al., 2014), and many of the differences persist after correcting for body mass (Cosgrove et al., 2007) and intracranial volume (Ritchie et al., 2018); nevertheless, this difference does not affect cognitive capacity. Indeed, perhaps as a compensatory adaptation, the cortex of the female brain is thicker (Luders et al., 2006; Ritchie et al., 2018; Sowell et al., 2007) and has more complex (Luders et al., 2004) cortical folding than those of men. Female brains have lower white matter volume (Cosgrove et al., 2007; Shin et al., 2005), but, in general, higher levels of anatomical connectivity (Gong et al., 2009) than males.
Nevertheless, these differences are strongly dependent on the brain area (Lebel et al., 2019; Lotze et al., 2019; Ritchie et al., 2018), ever reversing in some locations. These characteristics have led to the suggestion that the female brain may be more efficient at information processing (Christova et al., 2008; Keller and Menon, 2009). Nevertheless, it is important to show that the existence of these differences is currently challenged in the literature (Eliot et al., 2021; Tan et al., 2016).
While sex differences in brain anatomy have been broadly studied in the last several decades, functional differences have been less well studied. However, given the differences in brain structure, a relationship between brain function—as measured with a physiological tool—and sex is to be expected. Under the model of the human connectome (Friston, 1994), some studies have found different network expressions using functional MRI (fMRI), especially in task-free paradigms (Liu et al., 2009; Ritchie et al., 2018; Satterthwaite et al., 2015; Scheinost et al., 2015; Tian et al., 2011) and less often during cognitive tasks (Aleman and Swart, 2008; Koscik et al., 2010).
Electroencephalography (EEG) and magnetoencephalography (MEG) measure the activity of neurons (Murakami and Okada, 2006), without relying on the blood-oxygen-level dependent response, which may be sensitive to factors affecting the neurovascular unit (Birn et al., 2006; Shmueli et al., 2007). These tools allow a more direct measurement of brain function at the millisecond scale, but at the expense of a lower spatial resolution. Despite the fact that EEG and MEG allow for a temporal precision that is at least one to two orders of magnitude greater than fMRI, there have been few studies of sex differences in brain functional organization using these techniques (Fernández et al., 2012; Shumbayawonda et al., 2019; Tomescu et al., 2018). This is also true for studies of functional connectivity (FC) (Jalili, 2015; Miraglia et al., 2015), which is particularly unfortunate in the case of MEG, as it may provide the best mechanism for studying brain networks at physiologically meaningful timescales (Hall et al., 2014).
Alzheimer's disease (AD) is the most common neurodegenerative disease in late age, accounting for 60% of the cases of dementia (Alzheimer's Association, 2020). Its prevalence is higher in women, representing approximately two-thirds of the total number of cases (Alzheimer's Association, 2020). While this disequilibrium can be partly explained by the longer life expectancy of women (Chêne et al., 2015; Seshadri et al., 1997), many large studies report that the incidence of AD is also higher among women than men, even after controlling for age [e.g., Fisher et al. (2018)], suggesting a predisposition that may be related to sex, the balance of sexual hormones (as estradiol or progesterone), and other genetic characteristics (Dumitrescu et al., 2019; Fisher et al., 2018).
We report here the FC profiles in the alpha band of women and men, both in participants who are cognitively normal and those in the prodromal stages of the AD dementia continuum. Alpha oscillations represent the dominant oscillatory activity in the brain (Buzsáki, 2006), and are also the most reliable (Garcés et al., 2016). Using data obtained through the Connectomics of Brain Aging and Dementia project (Cohen et al., 2021), we studied the differences in phase synchronization as a function of sex, and the relationships between these biomagnetic differences and objective and subjective measures of cognitive status.
Our goal in this study was to investigate sex differences in brain function that might relate to the women:men imbalance in AD cases. We hypothesize that the patterns of FC seen in the women in the study sample will display signs of a predisposition to the disease, similar to what was found in presymptomatic individuals with a family history of AD (Ramírez-Toraño et al., 2021). This is, we expect women to have increased values of FC between the frontal region and posterior areas of the brain, indicating increased vulnerability to AD (Pusil et al., 2019).
Materials and Methods
Participants
The study was reviewed and approved by the University of Pittsburgh Human Research Protection Office, and all participants provided written informed consent before participation.
The original sample consisted of 227 individuals, of whom 187 provided task-free MEG data. Data from several participants were discarded because of lack of a valid MRI image for image alignment (1), poor MEG data (32, mostly due to magnetic noise introduced by dental implants), or bad head positioning inside the MEG scanner (3). We did not include the 10 individuals classified with AD or nonamnestic mild cognitive impairment (MCI), and the three who were of Asian descent; there were not enough of these individuals to form a group for comparison. Therefore, in the sample used for the current study, neither of the participants was diagnosed with, or undergoing treatment for, AD.
The final sample consisted of 138 individuals, 87 women (39 white and 48 black) and 51 men (28 white and 23 black). The clinical and demographic characteristics of the individuals in each group are shown in Table 1.
Sociodemographic Description of the Sample
Binomial variables (cognitive status) are reported as affirmative/negative cases, compared using Fisher's exact test, and the effect size is reported as Cramer's V. Continuous variables (age, education years, and MCA scores) are reported as mean ± standard deviation, compared using Student's t-test, and the effect size is reported as Cohen's d.
MoCA, Montreal Cognitive Assessment.
Diagnostic evaluation
Each participant underwent a brief neuropsychological test battery for group classification purposes. The test battery was based on that of the University of Pittsburgh Alzherimer's Disease Research Center and included the Montreal Cognitive Assessment (MoCA) (Nasreddine et al., 2005), verbal fluency, a 30-item version of the Boston Naming Test (Saxton et al., 2000), Trailmaking Test A & B (Reitan and Wolfson, 1994; Reitan, 1958), Consortium to Establish a Registry for Alzheimer's Diseaes World List Memory test, measuring verbal free recall (Welsh et al., 1991, 1994), and a 24-point modified Rey–Osterreith Complex Figure, measuring visuospatial construction and visual memory (Rey, 1941). Classification decisions were made independently by J.T.B. and B.E.S. and any differences were resolved in a group discussion. We used the ADRC classifications (Lopez et al., 2000) for AD, MCI (both amnestic and nonamnestic), and subjective cognitive decline (SCD).
Neuropsychological tests and questionnaires
The individual tests and questionnaires completed by the participants included items from the NIH Toolbox (Gershon et al., 2010), the PROMIS Applied Cognition scales (Howland et al., 2017), and additional paper-and-pencil questionnaires, covering symptomatology, personality, diet, and exercise.
Brain imaging
MRI scanning
We used Siemens Prisma 3-Tesla 64-channel systems equipped with connectome-level gradients operating at 80 mT/m. The scan sequences included the following: T1-weighted MP-RAGE, T2-SPACE image, FLAIR, susceptibility-weighted imaging, diffusion tensor imaging, task-free fMRI, task-based fMRI, and arterial spin labeling.
MEG recording
MEG studies were completed at the UPMC Brain Mapping Center on an Elekta-Neuromag Vectorview 306 MEG system with 306 channels (102 magnetometers and 204 gradiometers) covering the whole head. Before the data acquisition, the subject was prepared by placing two sets of bipolar electrodes around their eyes, to capture vertical and horizontal electro-oculogram; one set across their chest, to capture the electrocardiogram; and four head position indicator (HPI) coils, two on the forehead and two on the mastoid processes. To finish the preparation, we used an ISOTRAK 3D digitizer (Polhemus, Inc., Colchester, VT, USA) to acquire the position of the HPI coils, together with the anatomical landmarks (nasion and both the preauricular points) and a set of 30–50 head shape points.
From each participant, we acquired a minimum of 5 min of task-free data with eyes open at a 1000 Hz sampling rate, using an online anti-alias filter between 0.1 and 330 Hz. To monitor the head movements of the participants, we read the HPI coils continuously during the acquisition. We processed the raw MEG data using the spatiotemporal extension of the signal space separation (tSSS) method (Taulu and Simola, 2006) by means of MaxFilter software (window length of 10 sec and correlation limit of 0.90), using the MaxMove extension to correct for any participant movement during the acquisition. We removed any eye movements, cardiac, and noise-related independent components using second order blind identification (Belouchrani et al., 1997) and marked the remaining artifacts using FieldTrip toolbox (Oostenveld et al., 2011). Finally, we segmented the artifact-free data into nonoverlapping segments of 4 sec. Due to the high redundancy of data after tSSS (Garcés et al., 2017), only data from magnetometers were used for the subsequent analyses.
Source reconstruction
The anatomical T1-weighted MR image was segmented, using the unified segmentation algorithm (Ashburner and Friston, 2005) in SPM12, into gray matter and white matter tissues, cerebrospinal fluid, skull, and soft tissue. The union of the white and gray matter and the cerebrospinal fluid defined the brain–skull interface, and we used this interface to define an individual single-shell head model. For the source model, we defined a homogeneous three-dimensional grid in Montreal Neurological Institute space, with 10 mm of spacing, and marked as valid sources those falling into a cortical region according to the automated anatomical labeling atlas (Tzourio-Mazoyer et al., 2002). This resulted in 1210 cortical source positions. This grid was linearly transformed to match the participant's brain anatomy, and this transformed version was used as the individual's source model.
Finally, the sensor model was aligned to the individual anatomy by means of a manual coregistration, using the anatomical landmarks and the head shape points as an aid. The source model, head model, and sensor model were then combined to build an individual lead field using a modified spherical solution (Nolte, 2003).
The MEG data were filtered into the alpha band (8–12 Hz) using a 1800th order finite impulse response filter designed using a Hamming window. To avoid edge artifacts, we added 2 sec of real data at each side of the 4-sec segment as padding. We used these data to calculate a per-trial covariance matrix, and these matrices were averaged into a single covariance matrix per participant. Finally, we used a linearly constrained minimum variance beamformer (van Veen et al., 1997) to combine the lead field and the data covariance matrix, using a regularization factor of 5% of the average power. The result was a vector beamformer spatial filter for each cortical source, which was then used to map the sensor-space data into source space.
Functional connectivity
We estimated FC under the hypothesis of phase synchronization (Rosenblum et al., 1996) and used the phase locking value (PLV) (Mormann et al., 2000). PLV is a bivariate metric that takes the instantaneous phase of two signals and estimates the degree of phase locking from their difference: if the difference between signal phases is random, the signals are not locked, and the value of PLV is close to 0; if the difference of phases is constant, the signals are perfectly locked, and the PLV is close to 1; any other case lies in between both extremes. The mathematical definition of PLV is as follows:
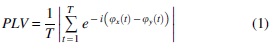
In Equation (1),
Statistical analysis
The FC analysis was undertaken in two steps. First, we calculated the nodal strength for each source position, equal to the average FC of each source position with the rest of the brain. This resulted in a set of 1210 values per participant that could be identified with a spatial label (i.e., the corresponding source position). We used this information to look for differences in nodal strength between women and men using a cluster-based permutation approach [(Maris and Oostenveld, 2007); see Appendix A1 for details]. The result is a set of significant clusters of brain patches whose activity shows differences in their nodal strength between both groups.
The clusters identified in the first step indicate brain areas showing different levels of FC, in general, between sexes. However, from this analysis alone it is not possible to determine whether these clusters have different spatial patterns of connectivity. Therefore, we then performed a seed-based connectivity analysis, using the cluster identified in the first step as the seed. This results in a set of seed-based connectivity values for each of the source positions outside the seed. Again, we used a cluster-based permutation test to identify for differences in these values between women and men. The result is a set of significant clusters of brain areas showing differences in their level of FC with the seed region.
We also evaluated the relationship between FC and sex by extracting a single FC value for each seed–target pair. We did this by averaging the PLV matrix for all links connecting one source position in the seed with one source position in the target. Then, we introduced these values in a set of analysis of variance (ANOVA) models, including subjective and objective cognitive status, as well as their interaction with sex.
Results
We found a single cluster of significant source positions (p = 0.0256) in the medial frontal cortex where the nodal strength values varied as a function of the sex, as can be seen in Figure 1a. In these source positions (colors denote the size of the t statistic testing differences between sexes), women had higher levels of global FC than men. The differences appeared in the medial frontal areas, including bilaterar superior frontal gyri, middle frontal gyri, gyri recta, and anterior cingulate cortices.

Clusters of source positions showing significant differences between women and men.
To better characterize these differences, we studied the seed-based connectivity of these sources with the rest of the brain, using a single-side contrast for higher levels of FC in women than in men. The result was a set of three clusters of source positions showing statistically significant differences, as shown in Figure 1b (again, the colors denote the size of the t statistic). The first area (p = 0.0016) included the medial parietal (both posterior cingulate cortices and both precunei) and posterior temporal (superior temporal gyri) cortices. The second group of sources (p = 0.0019) covered mainly the right insula and surrounding areas (right dorsal frontal cortex and superior temporal gyrus). The third cluster (p = 0.0056) included portions of both the cingulate and paracingulate cortices. All these areas showed significantly higher levels of FC with medial frontal areas in women than in men.
We defined one single FC value for each of the three seed-target pairs and used a full analysis of covariance (ANCOVA) model to evaluate possible confounds, including age as the covariate. The results are depicted in full in Supplementary Tables S1 to S3. When including the subjective (i.e., perception of cognitive impairment) or objective (i.e., performance-based cognitive impairment) cognitive status, the effect of sex remained significant, and there was no main effect of cognitive status (either subjective or objective impairment; these effects were also tested without taking into account the interaction term).
However, we found a significant interaction between sex and objective cognitive status in all the clusters (F 1,130 = 7.954, p = 0.0056, η 2 = 0.058; F 1,130 = 6.904, p = 0.0096, η 2 = 0.050; and F 1,130 = 4.032, p = 0.0497, η 2 = 0.030; respectively); only the unimpaired individuals showed significant differences (p < 0.0001) between women and men. The stratified data for the three clusters are shown in Figure 2 and Tables 2 and 3. According to these data, unimpaired men show lower FC values than women, both unimpaired or impaired, in all three clusters. Moreover, unimpaired women also showed higher FC than impaired men. There were no differences between both sexes when considering only impaired individuals.

Average FC in each significant cluster stratified by sex and objective cognitive status. Left: first cluster (F = 17.681, p < 0.0001 for sex; F = 5.469, p = 0.0209 for sex by cognitive status interaction). Middle: second cluster (F = 14.027, p = 0.0002 for sex; F = 5.486, p = 0.0207 for sex by cognitive status interaction). Right: third cluster (F = 12.162, p = 0.0006 for sex; F = 3.257, p = 0.0734 for sex by cognitive status interaction). M, men; W, women; Unimpaired, healthy controls or individuals with subjective cognitive decline; Impaired, impaired without complaints individuals or patients with MCI. MCI, mild cognitive impairment. Color images are available online.
Statistical Results for the Analysis of Variance for Sex with Age As Covariate over the Sample Stratified by Objective Cognitive Status
Effect size is reported as partial η 2. Statistically significant effects are marked in bold font.
CS, cognitive status.
Statistical Results for the ANOVA for Objective Cognitive Status with Age as Covariate over the Sample Stratified by Sex
Effect size is reported as partial η2. Statistically significant effects are marked in bold font.
Finally, we performed a correlation analysis between the mean FC of each cluster and measures of objective (MoCA) cognitive performance and subjective (PROMIS) ratings of cognitive abilities. The results of these tests, stratified by sex and objective cognitive status, are depicted in Supplementary Tables S4 to S6. Unimpaired men had a significant negative correlation between their perception of their cognitive abilities and FC. This indicates that increased FC in these three clusters is related to a poorer perception of their cognitive abilities, which is a known risk factor of conversion to MCI and AD (Gallassi et al., 2010).
Discussion
There are three major findings of our study comparing alpha band FC between women and men. First, women show higher levels of FC overall between the frontal medial areas and three brain clusters, including (1) medial parietal, (2) right insula, and (3) posterior medial frontal areas, when compared with age-matched men. Second, neither subjective nor objective cognitive status was directly associated with FC in these three networks. Third, there was a significant interaction between objective cognitive status and sex that was significant in all three clusters. Specifically, the level of FC was significantly higher among women than men, but only for those individuals who perform normally on the objective measures of cognitive function.
AD has been extensively described as a disconnection syndrome (Delbeuck et al., 2003; Engels et al., 2017; Hof, 1997), and recent data describe a more complex, nonlinear trajectory of neuropathological change (Harris et al., 2020). An increasing number of studies indicate that an increase in FC, at least as measured by EEG and MEG, is one of the first signs of neurodegeneration (Bajo et al., 2010; Bonanni et al., 2020; Busche and Konnerth, 2016; Canuet et al., 2015; López et al., 2014; Nakamura et al., 2017; Pusil et al., 2019; Ramírez-Toraño et al., 2021). Histological examination of brain tissue in AD patients has shown that the area surrounding a senile plaque is usually characterized by a lack of gamma-aminobutyric acid (GABAergic) neurons (Garcia-Marin et al., 2009).
Moreover, soluble amyloid composites have also been shown to be toxic to GABAergic neurons (Busche et al., 2012; Harris et al., 2020; Keskin et al., 2017; Liu et al., 2009). In this framework, the presence of either soluble or aggregated forms of amyloid protein would be toxic to inhibitory neurons, and as result would unleash an excitatory/inhibitory imbalance characterized by increased neuronal excitability. However, soluble or aggregated forms of amyloid protein are toxic to both excitatory and inhibitory neurons (Liu et al., 2009; Palop and Mucke, 2010) and inhibitory interneurons represent a smaller proportion of the population of all interneurons than do excitatory interneurons. Thus, the impact of the loss of cellular inhibition results in a neural overactivity (Mongillo et al., 2018). This overactivity itself increases amyloid burden (Bero et al., 2011; Cirrito et al., 2005), resulting in the vicious cycle of amyloid causing increased excitability and increased excitability causing increased amyloid burden.
The increase in neuronal excitability leads to hypersynchrony (Keskin et al., 2017), which explains the increases in FC in the first stages of the disease. This dual pattern of increased and decreased brain synchronization has recently been related to different stages of the AD continuum (Pusil et al., 2019). According to this interpretation, the hypersynchronization is one of the first signs of synaptic malfunction. The extent of synchronization would increase steadily with the evolution of the disease through the prodromal stage, and may be able to serve as an individual biomarker of pathological severity of the AD (López et al., 2014). Once the dementia phase of AD is reached, the functional network collapses (Pusil et al., 2019), resulting in the hyposynchronization typically observed in AD (Briels et al., 2020; Gili et al., 2011; Vecchio and Babiloni, 2011). Due to the increase–decrease evolution of these profiles, it was termed the “X” model (Pusil et al., 2019).
This pattern seems to appear particularly in frontal and frontoposterior networks, where an increase in synchronization can be used to distinguish progressive from stable MCI patients (Bajo et al., 2012; López et al., 2014). A similar pattern was observed in individuals with SCD (López-Sanz et al., 2017), and recently in healthy adults with a family history of AD (Ramírez-Toraño et al., 2021), both when compared with age-matched controls. As in our case, these results were in many cases found under task-free paradigms and in the alpha band (López et al., 2014; López-Sanz et al., 2017; Ramírez-Toraño et al., 2021), and usually between frontal and posterior areas of the brain (López et al., 2014; Ramírez-Toraño et al., 2021).
It is unclear whether this pattern of hyperconnectivity in the initial stages of the disease is a marker of vulnerability or early neurodegeneration. The stratification of the sample by an objective cognitive state seems to support the hypothesis of neurodegeneration: both cognitively impaired women and men show higher levels of FC in all three networks, similar to those in the cognitively intact women. This suggests that the cognitively normal older women are not, in fact, neurologically intact, but that some neurodegenerative mechanisms are already taking place.
Indeed, many studies have shown that women have a larger cognitive reserve than men in the cognitive domains classically evaluated for the diagnosis of AD, specifically verbal memory (Sundermann et al., 2016a,b) and verbal fluency (Ferretti et al., 2018). This higher cognitive reserve has been proposed as one of the reasons of the lower prevalence of MCI in women than in men; many women with neurodegeneration “leak” through the diagnosis system, as their behavior on the tests falls within normal limits (Fisher et al., 2018; Sundermann et al., 2019). If this is the case, our results would mean that FC, as measured with MEG, can be a valuable tool to identify these individuals neglected by current diagnosis procedures. However, more information and a follow-up of these participants are required to validate this hypothesis.
If this interpretation is correct, we would expect some correlation between cognitive abilities and the FC in these clusters. We evaluated the correlation with cognitive complaints, partly from the idea that these individuals might perceive a worsening of their cognitive abilities, even when the diagnostic tools were unable to detect it. This was not the case, as the group of cognitive intact women did not show significant correlations, but the group of cognitively intact men did. This, however, could still support our interpretation, as the existence of cognitive complaints shares neurophysiological signs, at least in terms of FC, with MCI (López-Sanz et al., 2017). According to this interpretation, the cognitively intact women could potentially be in a relatively more advanced stage of the AD continuum, although technically in the pre-clinical phase, and the progression of the neurodegeneration observed in the cognitive intact men would no longer be present. This interpretation, however, must be confirmed by a longitudinal follow-up of our sample.
One of the possible reasons for the difference in FC found in women might be the hormonal changes taking place during menopause. 17β-estradiol, the major female sex hormone, is known to reduce β-amyloid levels, both preemptively by upregulating APP processing through α-secretase (Gandy, 2003; Xu et al., 1998), and a posteriori by degrading amyloid clearance through the action of neprilysin (Liang et al., 2010). After menopause, the amount of circulating estradiol dramatically decreases (Vest and Pike, 2013), and with it the neuroprotective effects. In this same line, Mosconi and colleagues (2017) found increased depositions of β-amyloid in post- and perimenopausal women, when compared with age-matched premenopausal women and male controls. In this work, the increased amyloid deposition was observed in the posterior cingulate cortex, fusiform gyrus, and frontal areas, locations highly overlapping with our results, and a similar effect could be the cause of the increased synchronization found in our sample.
On the contrary, the levels of progesterone have also been linked to brain activity, particularly by mediating the sensitivity of the GABAA receptors (Kapur and Joshi, 2021), which could cause, by compensation, a downregulation of these receptors. After menopause, the levels of circulating progesterone are reduced, therefore reducing the sensitivity to inhibitory GABA. The excitatory–inhibitory imbalance in the AD contiuum (Ramírez-Toraño et al., 2021) could be related to the loss of GABAergic neurons (Garcia-Marin et al., 2009), and a lower sensitivity of postmenopausal women to GABA could explain their increased vulnerability to the disease. Early hormone replacement therapy seems to counteract these effects (Vest and Pike, 2013; Yaffe et al., 2000), and its use should be registered for future studies. However, our current sample lacks this information, and it is thus impossible to check for differences between users and nonusers of this therapy. Nevertheless, progesterone is also synthesized in the brain, both by men and women (Avallone et al., 2020; Stoffel-Wagner, 2001), and the decrease of the circulating levels of this hormone during menopause might have a lower, but not negligible, effect than that of estradiol.
While the findings of this work are interesting, there are some limitations that should be addressed. First, although the project from where these data come from includes a longitudinal follow-up, this work only reports finding from the first evaluation. Data from the second evaluation are currently being acquired, and we hope we can use them in the future to validate some of our hypotheses. Second, we have evaluated FC using PLV, a metric well known to be affected by volume conduction and source leakage. This can be avoided using derived metrics that remove zero-lag synchronization (Bruña et al., 2018; Stam et al., 2007; Vinck et al., 2011), but these techniques have shown low test–retest reliability (Colclough et al., 2016; Garcés et al., 2016), and cannot thus be used to consistently estimate FC.
In addition, volume conduction and source leakage are interferences of local nature, and our results mostly describe long-range connections, especially for the first, more significant cluster. This renders it unlikely that the observed effects are driven by volume conduction. Last, our hypothesis for a differential pattern of FC in men was based in previous works (López et al., 2014; López-Sanz et al., 2017; Pusil et al., 2019; Ramírez-Toraño et al., 2021) using PLV, and we thus decided to follow a similar methodology. As a last, but important limitation, we need to address the high ratio of participants discarded due to high metallic noise. Out of the initial 187 individuals, 32 (17%) were discarded for this reason. MEG is an extremely sensitive technique, and dental appliances, common in older adults, are an important source of magnetic noise. If this noise cannot be avoided (e.g., by means of degaussing of the metallic parts), this limitation could affect severely the applicability of our findings.
A final remark is needed regarding the interpretation of the data in this work. There is an open debate regarding the difference between sex and gender, and which of the two (related, but different) features is responsible for the brain difference between women and men. For this work, we have used the more extended definition of sex and gender: sex is the biological feature that differentiates biological women from biological men, including the genetic information, the manifestation of the reproductive organs, and the balance of sex hormones; gender, on the contrary, is the social trait of what is considered being a woman or a man, related to behavior, social roles, or appereance.
While both sex and gender can influence how the brain is shaped, we focused our discussion on the effect of sex, as the effect of sexual hormones in the brain is extensively documented, and is one of the main suspects of the higher vulnerability of women to AD (Ferretti et al., 2018). In our case, there was no difference in education between women and men, one of the main gender-related differences, and therefore, we expect the majority of the differences between women and men to be sex related. Nevertheless, the effect of gender on this cannot be disregarded, and effort should be put into acquiring larger and more diverse databases able to allow the separation of both effects.
Conclusion
In this work, we have identified a set of brain networks showing increased synchronization in older adult women than in men. When stratifying by cognitive state, the results showed that the effect was only observable in cognitively intact women. A similar pattern has previously been observed in individuals at risk of developing AD, both SCD population and healthy individuals with a family history of AD, suggesting that the cognitively intact women in our sample would constitute an at-risk group, when compared with cognitively intact men. This would indicate that the neurodegenerative mechanism could already be taking place in the brain of these women, still undetectable to classical diagnosis tools.
Footnotes
Acknowledgments
The CoBRA Study team includes the following: Ann D. Cohen, Beth E. Snitz, Ted Huppert, Tae Kim, Yue-Fang Chang, Yu Cheng, Jack Doman, Ricardo Bruña, Fernando Maestú, Avniel Ghuman, Anto Bagic, Ilyas Kamboh, Anne Newman, Steven Reis, Rebecca Roush, Lara Fatukasi, Leslie Kovach, Katey Potopenko, Howard J. Aizenstein, Lewis H. Kuller, William E. Klunk, Caterina Rosano, Oscar L. Lopez, and James T. Becker.
Authors' Contributions
J.T.B., A.D.C., A.B., and F.M. designed the study; J.T.B., R.E.R., and B.E.S. acquired the data; R.B. and D.L.-S. analyzed the data; all authors collaborated on the interpretation of the results; R.B., D.L.-S., J.T.B., and A.D.C. wrote the first version of the article; all authors contributed to the finalized version of the article.
Author Disclosure Statement
No competing financial interests exist.
Funding Information
This research and the preparation of this article were supported by funds from the National Institute on Aging (UF1-AG051197), as well as the Neuroimaging Core of the Alzheimer's Disease Research Center (P50-AG005133, P30-AG066468). We are grateful for the support from the Heart Strategies Concentrating on Risk Evaluation (Heart SCORE) study (R01-HL089292) and the Long Life Family Study (U01-AG23744), and the Clinical and Translational Science Institute at the University of Pittsburgh (UL1-TR001857) for managing Pitt+Me.
Supplementary Material
Supplementary Table S1
Supplementary Table S2
Supplementary Table S3
Supplementary Table S4
Supplementary Table S5
Supplementary Table S6
Appendix
References
Supplementary Material
Please find the following supplemental material available below.
For Open Access articles published under a Creative Commons License, all supplemental material carries the same license as the article it is associated with.
For non-Open Access articles published, all supplemental material carries a non-exclusive license, and permission requests for re-use of supplemental material or any part of supplemental material shall be sent directly to the copyright owner as specified in the copyright notice associated with the article.