
Abstract
Introduction:
Music tempo has strong clinical maneuverability and positive emotional effect in music therapy, which can directly evoke multiple emotions and dynamic neural changes in the whole brain. However, the precise relationship between music tempo and its emotional effects remains unclear. The present study aimed to investigate the dynamic network connectivity (dFNC) associated with emotions elicited by music at different tempi.
Materials and Methods:
We obtained emotion ratings of fast-tempo (155–170 beats per minute [bpm]), middle-tempo (90 bpm), and slow-tempo (50–60 bpm) piano music from 40 participants both during and after functional magnetic resonance imaging (fMRI). Group independent component analysis (ICA), sliding time window correlations, and k-means clustering were used to assess the dFNC of fMRI data. Paired t-tests were conducted to compare the difference of neural networks.
Results:
(1) Fast music was associated with higher ratings of emotional valence and arousal, which were accompanied with increasing dFNC between somatomotor (SM) and cingulo-opercular (CO) networks and decreasing dFNC between frontoparietal and SM networks. (2) Even with stronger activation in auditory (AUD) networks, slow music was associated with weaker emotion than fast music, with decreasing functional network connectivity across the brain and the participation of default mode (DM). (3) Middle-tempo music elicited moderate emotional activation with the most stable dFNC in the whole brain.
Conclusion:
Faster music increases neural activity in the SM and CO regions, increasing the intensity of the emotional experience. In contrast, slower music was associated with decreasing engagement of AUD and stable engagement of DM, resulting in a weak emotional experience. These findings suggested that the time-varying aspects of functional connectivity can help to uncover the dynamic neural substrates of tempo-evoked emotion while listening to music.
Impact statement
Music tempo is helpful in clarifying the neural process of music-evoked emotional processes with the activation of multiple neural networks. By investigating the dynamic network connectivity (dFNC) associated with emotions elicited by music at different tempi, this study found that faster music increased neural activity in the somatomotor and cingulo-opercular regions with increasing emotional experience. Slower music was associated with decreasing engagement of auditory and stable engagement of default mode with calm emotion. The time-varying aspects of dFNC in musical emotion evoked by three typical tempi provided the first whole-brain characterization of regional differences in functional connectivity (FC) variability and distinction of discrete FC states.
Introduction
Music serves as an important social bond not only by facilitating group cohesion but also by enriching listeners' emotional world (Savage et al., 2020). Music emotion is affected by melody, rhythm, tempo, dynamics, and pitch (Juslin, 2019; Kamenetsky et al., 1997). Studies have increasingly focused on the role of tempo in eliciting specific emotions and associated activity across multiple functional neural networks, including auditory (AUD) networks, sensorimotor networks, and default networks (Liu et al., 2018; Trochidis and Bigand, 2013). Tempo, which is defined as the speed of composition and is measured in beats per minute (bpm), is not only helpful in clarifying the neural process of music-evoked emotional processes, but it is also one of the most significant moderators in the emotion regulation of music therapy (De Witte et al., 2020a, b; Fernández-Sotos et al., 2016).
Generally, music with a fast tempo evokes excitement, happiness, or tension with neural changes in the superior temporal gyrus (STG) and sensorimotor cortex (Liu et al., 2018; Nicolaou et al., 2017), which is due to its high-density and high-energy acoustic properties. In contrast, music with a slow tempo evokes sadness, melancholy, or relaxation while activating the default mode (DM) network (Taruffi et al., 2017). However, the precise relationship between music tempo and emotion remains controversial. One controversy is the basic emotional effects of fast or slow music. Conventional wisdom holds that listening to fast music leads to positive emotions, whereas listening to slow music leads to negative ones. However, studies have found that slow-tempo and middle-tempo music can give a positive emotional calming effect that enhances the depth of thinking and complex cognitive processing ability of listeners (De Witte et al., 2020; Li et al., 2019). Another controversy is the effects of tempo on valence and arousal. Some researchers have indicated that tempo manipulations affect emotion arousal, but not valence (Balch and Lewis, 1996; Husain et al., 2002). Meanwhile, Karageorghis and colleagues (2018) reported that fast-tempo music only enhanced affective valence, but not arousal. Fernández-Sotos and colleagues (2016) analyzed the musical emotion by using meaningful words, reporting that tempo modulated both valence and arousal. These indicated that the emotional effects of music tempo do not occur in a one-to-one manner. Rather, they are the product of multifunctional neural activities in the whole brain (Koelsch and Skouras, 2014; Zhu et al., 2019).
The emotional effects of tempo have been found to be connected with cognitive regulation and sensorimotor processes. Music of different tempi not only activated the regions of the brain that regulated emotion, such as the cingulate gyrus and insula (Liu et al., 2018; Thaut et al., 2014), but also engaged multiple functional regions involving the sensorimotor area (SMA), AUD cortex, and structures integral to visual perception (Bishop et al., 2014; Koelsch and Skouras, 2014; Zhu et al., 2019). When comparing the emotional effects of music on cognition processing, researchers also found that happy music with a fast tempo engaged more metacognition, whereas happy music with a slow tempo engaged more mind-wandering, associating with different activations in the default module network (Taruffi et al., 2017). Music of middle tempo may be the one of the most overlooked due to its atypical emotional characteristics. However, researchers found that middle-tempo music showed the most effective influence on maintaining drivers' attention and reducing fatigue compared with having no music, slow tempo, middle tempo, or fast tempo (Li et al., 2019), which indicated some uncovered neural processes for emotions evoked by different tempi.
Furthermore, music-evoked emotion is not constant during music playing, especially when affected by tempo, an important feature of music temporal information. The dynamic nature of emotional processing must be considered when investigating the emotional effects of music tempo to describe its inherent neural activities; there are time-varying patterns of communication between brain regions (Grootswagers et al., 2017; Raz et al., 2016). A study by Koelsch and associates (2006) found that there was a significant difference in the activation of the limbic system and AUD cortex between the participants' emotional responses to the first and the second 30-sec sections of each 1-min excerpt of pleasant and unpleasant music. Even the music with a steady tempo can evoke different emotions at different time points, suggesting a tight connection among music-evoked emotions, sensorimotor synchronization, and subcortical processing (Repp, 2001; Van der Steen et al., 2015; Zuk et al., 2018). However, current functional magnetic resonance imaging (fMRI) investigations of musical emotion have largely neglected the presence and potential of temporal variability during music listening (Bashwiner et al., 2020; Singer et al., 2016).
To gain a more complete picture of the various emotional brain networks engaged when music is presented at different tempi, this study aimed to investigate time-varying patterns of the fMRI signal in response to music presented at three tempi. In this study, untrained adults listened to unadapted piano music at these three tempi, allowing us to maintain higher ecological validity and more effective emotional processing than music with artificial tempo changes (Kaneshiro et al., 2020; Yuan et al., 2009). Emotion ratings were collected both during and after fMRI scanning. Dynamic network connectivity (dFNC) was analyzed in a data-driven approach using group independent component analysis (ICA), sliding time window correlations, and k-means clustering. In addition, the paired t-test was adopted to compare neural differences in the emotions evoked by music presented at each tempo. The current study is exploratory in investigating any significant dynamic functional connectivity (FC) between tempo and music-evoked emotion. It is hypothesized that different tempi would elicit differences in neural activation in the sensorimotor cortex and AUD cortex (Harvey, 2020; Lin et al., 2014; Sachs et al., 2020) based on the adaptability of the human AUD system and the dynamic nature of emotion (Dean et al., 2008; McAuley and Miller, 2007). It is further hypothesized that the functional connections may show significant time-varying changes in intensity and region, based on the whole-brain connectivity dynamics in emotions (Ghahari et al., 2020) and the dynamically increasing electroencephalography evidence in music-evoked emotion (Balasubramanian et al., 2018).
Materials and Methods
Participants and recruitment
Forty student volunteers from Southwest University (China) participated in this experiment. Participants were recruited using a university website and by word of mouth. All participants were right-handed native Chinese speakers with normal or corrected-to-normal vision, and none reported a history of neurological disorders, cognitive disability, or use of medications that affected the central nervous system. At the recruitment stage, each participant completed the Hamilton Depression Scale. Only those who scored <8 were invited to participate in the fMRI procedure. Finally, 40 participants took part in the current study. No participants had received professional music training except for that provided in a general music course. This study was carried out in accordance with the recommendations of the Southwest University Research Ethics Committee guidelines. All participants provided written informed consent in accordance with the Declaration of Helsinki and were compensated 100 Yuan for their time.
Music used in the study
Eighteen pieces of piano music without lyrics were selected as the experimental materials, whereas three other pieces of piano music were selected as training materials (Supplementary Table S1). The tempo of the six fast musical pieces ranged from 155 to 170 bpm. The tempo of the six middle musical pieces was ∼90 bpm. The tempo of the six slow musical pieces ranged from 50 to 60 bpm. Each musical piece was truncated to a length of 60 sec; the duration was long enough to evoke the desired emotion. The first 2 sec of each musical piece were faded in, whereas the last 2 sec were faded out, to ensure a gentle transition during each session.
Procedure
In the fMRI experiment, participants were asked to rate the valence and arousal of music-evoked emotions from 1 (negative emotion) to 4 (positive emotion) at the end of each song. Before scanning, each participant completed a training procedure to familiarize themselves with the emotion rating system. The three songs used in the training procedure did not appear in the formal experiment. After the training session, participants entered the scanner to complete pleasure ratings for the six fast-tempo songs, six middle-tempo songs, and six slow-tempo songs. Participants were allowed to rate valence and arousal for 2 sec each after each music session. A rest period of 10 sec was included between songs, whereas a rest period of 1 min was included between runs. The entire procedure for fMRI scanning is shown in Figure 1.
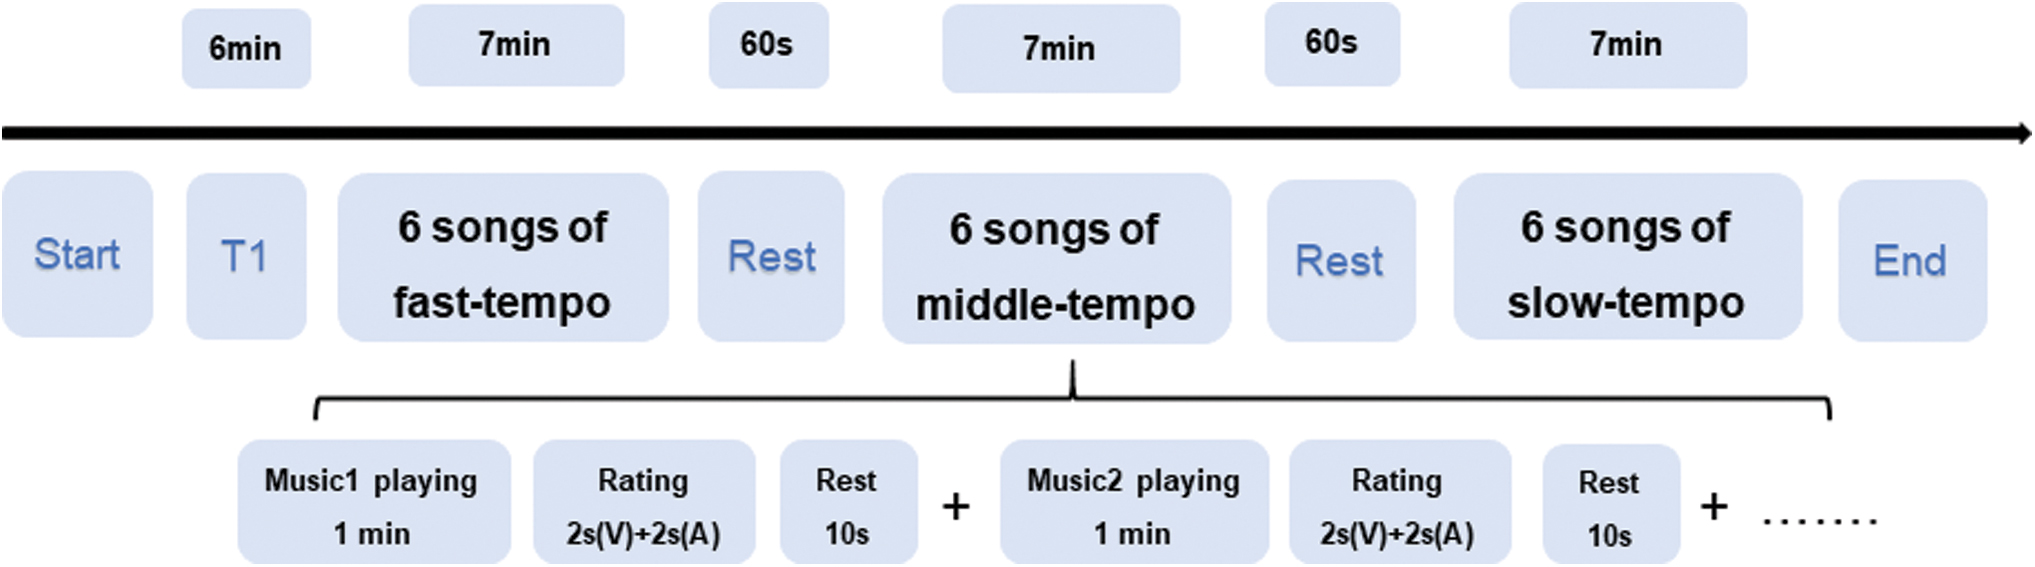
Procedure of fMRI scanning. V, valence; A, arousal; fMRI, functional magnetic resonance imaging. Color images are available online.
After scanning, all participants completed a second rating of emotional valence and arousal for the same 18 musical pieces. The post-scanning assessments were completed in a quiet and separate room. The listening procedure was the same as that used in the scanner.
Data analysis
One-way analysis of variance was used to compare the emotional ratings collected both during and after fMRI scanning. Paired t-tests were used to compare the valence and arousal differences between the scanning and post-scanning assessments by SPSS 20.0.
Scanning parameters, data preprocessing, and further analyses
Images were acquired using a Siemens 3T scanner (Siemens Medical Systems, Erlangen, Germany). An echo-planar imaging sequence was used for image collection, and T2-weighted images were recorded in each run. T1-weighted images were collected to yield a total of 176 slices at 1 mm thickness and an in-plane resolution of 0.98 × 0.98 mm.
Functional images were preprocessed using SPM8. The preprocessing included the removal of the first three volatile image volumes, realignment, slice-timing correction, spatial normalization, reslicing, and smoothing with a Gaussian kernel. The full width at half maximum was specified as 4 mm. Then, we obtained six direction parameters for head movement. We deleted the data of participants with head movement of more than 2.5 mm in any direction. After the preprocessing, fast-tempo data were deleted for four participants, whereas slow-tempo and middle-tempo data were deleted for two participants each.
The three key steps of functional network connectivity (FNC), namely ICA, sliding time window correlations, and k-means clustering were all performed using the fMRI toolbox (GIFT) software. ICA was used to extract spatially independent but temporally coherent components. In the session of each music group, data sets were temporally concatenated through participants. The data dimensions were reduced to the independent component (IC) number using principal component analysis (PCA). The Infomax ICA algorithm (Bell and Sejnowski, 1995) was used to compute the optimal numbers of ICs in the data set of all subjects, which were 29 for fast music, 31 for middle music, and 32 for slow music by referring the minimum description length (MDL) criterion (Li et al., 2006; Rachakonda et al., 2007) over all subjects in each group. Accordingly, the Infomax algorithm and spatial maps were used to decompose the modes of the component clusters from all participants. To determine the repeatability of the ICs, 150 IC iterations were performed using ICASSO (Allen et al., 2014; Himberg and Hyvarinen, 2003). The individual IC maps and time courses were computed via backward reconstruction using both aggregate components and the results from the data reduction step. The main steps of computing FNC matrices were to group the ICs into definitive functional networks and compute the correlations between networks with a one-sample t-test. The network groupings were based on the parameter information including the coordinate information and intensity of all ICs in the three groups after regression. In each group, seven networks were defined by their IC coordinate information to compute FNC correlations based on the Dosenbach-160 regional atlas. (Allen et al., 2014; Cohen et al., 2008). p-Value significance threshold was 0.001. One sample t-tests were used to test the correlation distribution of FNC (Z = 1).
Subsequently, dynamic FC was estimated using a sliding window approach (Allen et al., 2014; Smith et al., 2011). For each participant i, FC was estimated by the time course matrix Ri as the C × C sample covariance matrix ∑ i . A sliding window approach was applied to estimate dynamic FC. The covariance matrices ∑ i (w), w = 1 … W, were computed from windowed Ri segments. We used a tapered window created by convolving a rectangle (width = 60 sec = 30 TRs [time of repetition]) with a Gaussian (σ = 3 TRs) and sliding in steps of 2 sec = 1 TR. Then, it results in 148 windows. This is based on the short time window segments that may have incomplete information to describe the full covariance matrix (Smith et al., 2011). In accordance with the graphical least absolute shrinkage and selection operator method of Friedman and associates (2008), we penalized the L1 norm of the precision matrix to promote sparsity. The final estimation of dynamic FC for each window, ∑ i L1 (w), were concatenated to form ∑ i L1, a C × C × W array representing the covariance changes between components as a function of time. The Fisher transformation was used to estimate the dynamic FC for further analysis (Allen et al., 2014).
The k-means clustering algorithm (Lloyd, 1982) was then applied to evaluate the FC patterns' frequency of occurrence and structure of connectivity to windowed covariance matrices by the square Euclidean distance. The clustering algorithm was repeated 500 times to increase the opportunities of avoiding local minima. The maximum iterations was 1000. The resulting centroids were used to initialize a clustering of the data of all time windows. The repeated clustering was used by different distance functions (correlation, city-block, and cosine) and showed extremely similar results. The number of clusters (k) of group clustering was determined using the elbow criterion of the cluster validity index. This index was computed as the ratio of within-cluster distance to between-cluster distance.
After the dFNC analysis, paired t-tests were used to analyze the neural differences associated with the emotions evoked by the three types of music. According to the head movement data of three scan runs, 36 pairs were compared in both fast–middle and fast–slow conditions. Thirty-eight pairs were compared in the slow–middle condition. The threshold was false discovery rate (FDR)-corrected (p < 0.05) in univariate analyses.
Results
One-way analysis of variance was used to compare valence and arousal ratings obtained during and after fMRI scanning. This analysis revealed significant main effects of valence and arousal both during and after fMRI. The difference in fMRI valence was significant [p < 0.01, F(2,699) = 28.60, Eta = 0.28], and the least significant difference (LSD) test revealed a p < 0.01 for the fast > slow and middle > slow contrasts. The difference in fMRI arousal was also significant [p < 0.05, F(2,699) = 4.03, Eta = 0.11], and the LSD test revealed a p < 0.01 for the fast > slow contrast and p < 0.05 for the middle > slow contrast. The difference in post-scanning valence was also significant [p < 0.01, F(2,699) = 18.49, Eta = 0.24], and the LSD revealed a p < 0.05 for the fast > middle contrast and p < 0.01 for the middle > slow contrast. The difference in post-scanning arousal was significant [p < 0.05, F(2,699) = 3.53, Eta = 0.10], and the LSD test revealed a p < 0.01 for the fast > slow contrast. When comparing the ratings obtained during and after fMRI scanning, we observed significant differences in the valence of emotions elicited by the three tempi and in the arousal elicited by the middle tempo (Fig. 2). A stronger valence was found in post-rating than in fMRI-rating among three kinds of music, whereas a stronger arousal of post-rating was found in middle tempo than in the fMRI-rating.

Valence and arousal scores during fMRI and post-fMRI. Blue represents post-rating; green represents fMRI-rating. *p ≤ 0.05; **p ≤ 0.01. Color images are available online.
dFNC results
Data from 36 participants were included in the fast-tempo analysis, whereas data from 38 participants each were included in the analysis for middle-tempo and slow-tempo music. For the fast-tempo condition, PCA identified 29 ICs. PCA also identified 31 ICs in the middle-tempo condition and 32 ICs in the slow-tempo condition. However, for the slow-tempo condition, IC1 and IC32 were removed because of their scattered and weak activation, resulting in a total of 30 ICs for further analysis. Based on their anatomical and presumed functional properties, ICs were arranged into the following groups: DM, frontoparietal (FP), cingulo-opercular (CO), somatomotor (SM), visual (VIS), cerebellar (CB), and AUD. The coordinate information of ICs is presented in Supplementary Table S2.
We observed three notable FNC features that differed among the emotions evoked by the music presented at different tempi. First, fast music evoked the strongest FNC, especially when referring to the averaged connections of the seven networks. Second, from fast to slow music, the FNC correlations decreased within the FP, CO, and SM regions. Third, the connectivity between VIS and CB was significant for emotions evoked by slow music (Fig. 3).

Group ICA in the three kinds of music. At each level, the left matrix displays the FNC correlations averaged over subjects. In the upper right corner, the small matrix presents the correlations averaged in each network. In the bottom right, the connectogram displays the significant effects when p < 0.001, and the distribution of the color bar represents the T score. AG, angular gyrus; FNC, functional network connectivity; IFG, inferior frontal gyrus; PFC, prefrontal cortex; dlPFC, dorsal lateral prefrontal cortex; MFG, middle frontal gyrus; IPL, inferior parietal lobe; SPL, superior parietal lobe; PoCG, postcentral gyrus; PreCG, precentral gyrus; SMA, sensorimotor area; IOG, inferior occipital gyrus; MOG, middle occipital gyrus; LG, lingual gyrus; PCC, posterior cingulate cortex; CB, cerebellum; STG, superior temporal gyrus; MTG, middle temporal gyrus; SAA, somatosensory association area; SFG, superior frontal gyrus; TTG, transverse temporal gyrus; TL, temporal lobe; ICA, independent component analysis. Color images are available online.
The k-means clustering was used to explore the certain connectivity patterns reoccurring over time and presenting in numerous participants. Figure 4 shows the clustering results with k = 4 in the three groups. The cluster centroids and the connectograms of the emotions evoked by fast-tempo, middle-tempo, and slow-tempo music are separately shown in Figures 5 –7. In the three figures, β indicates the slope of the best linear fit (black) expressed in units of percentage per minute relative to the occurrence trend (blue).
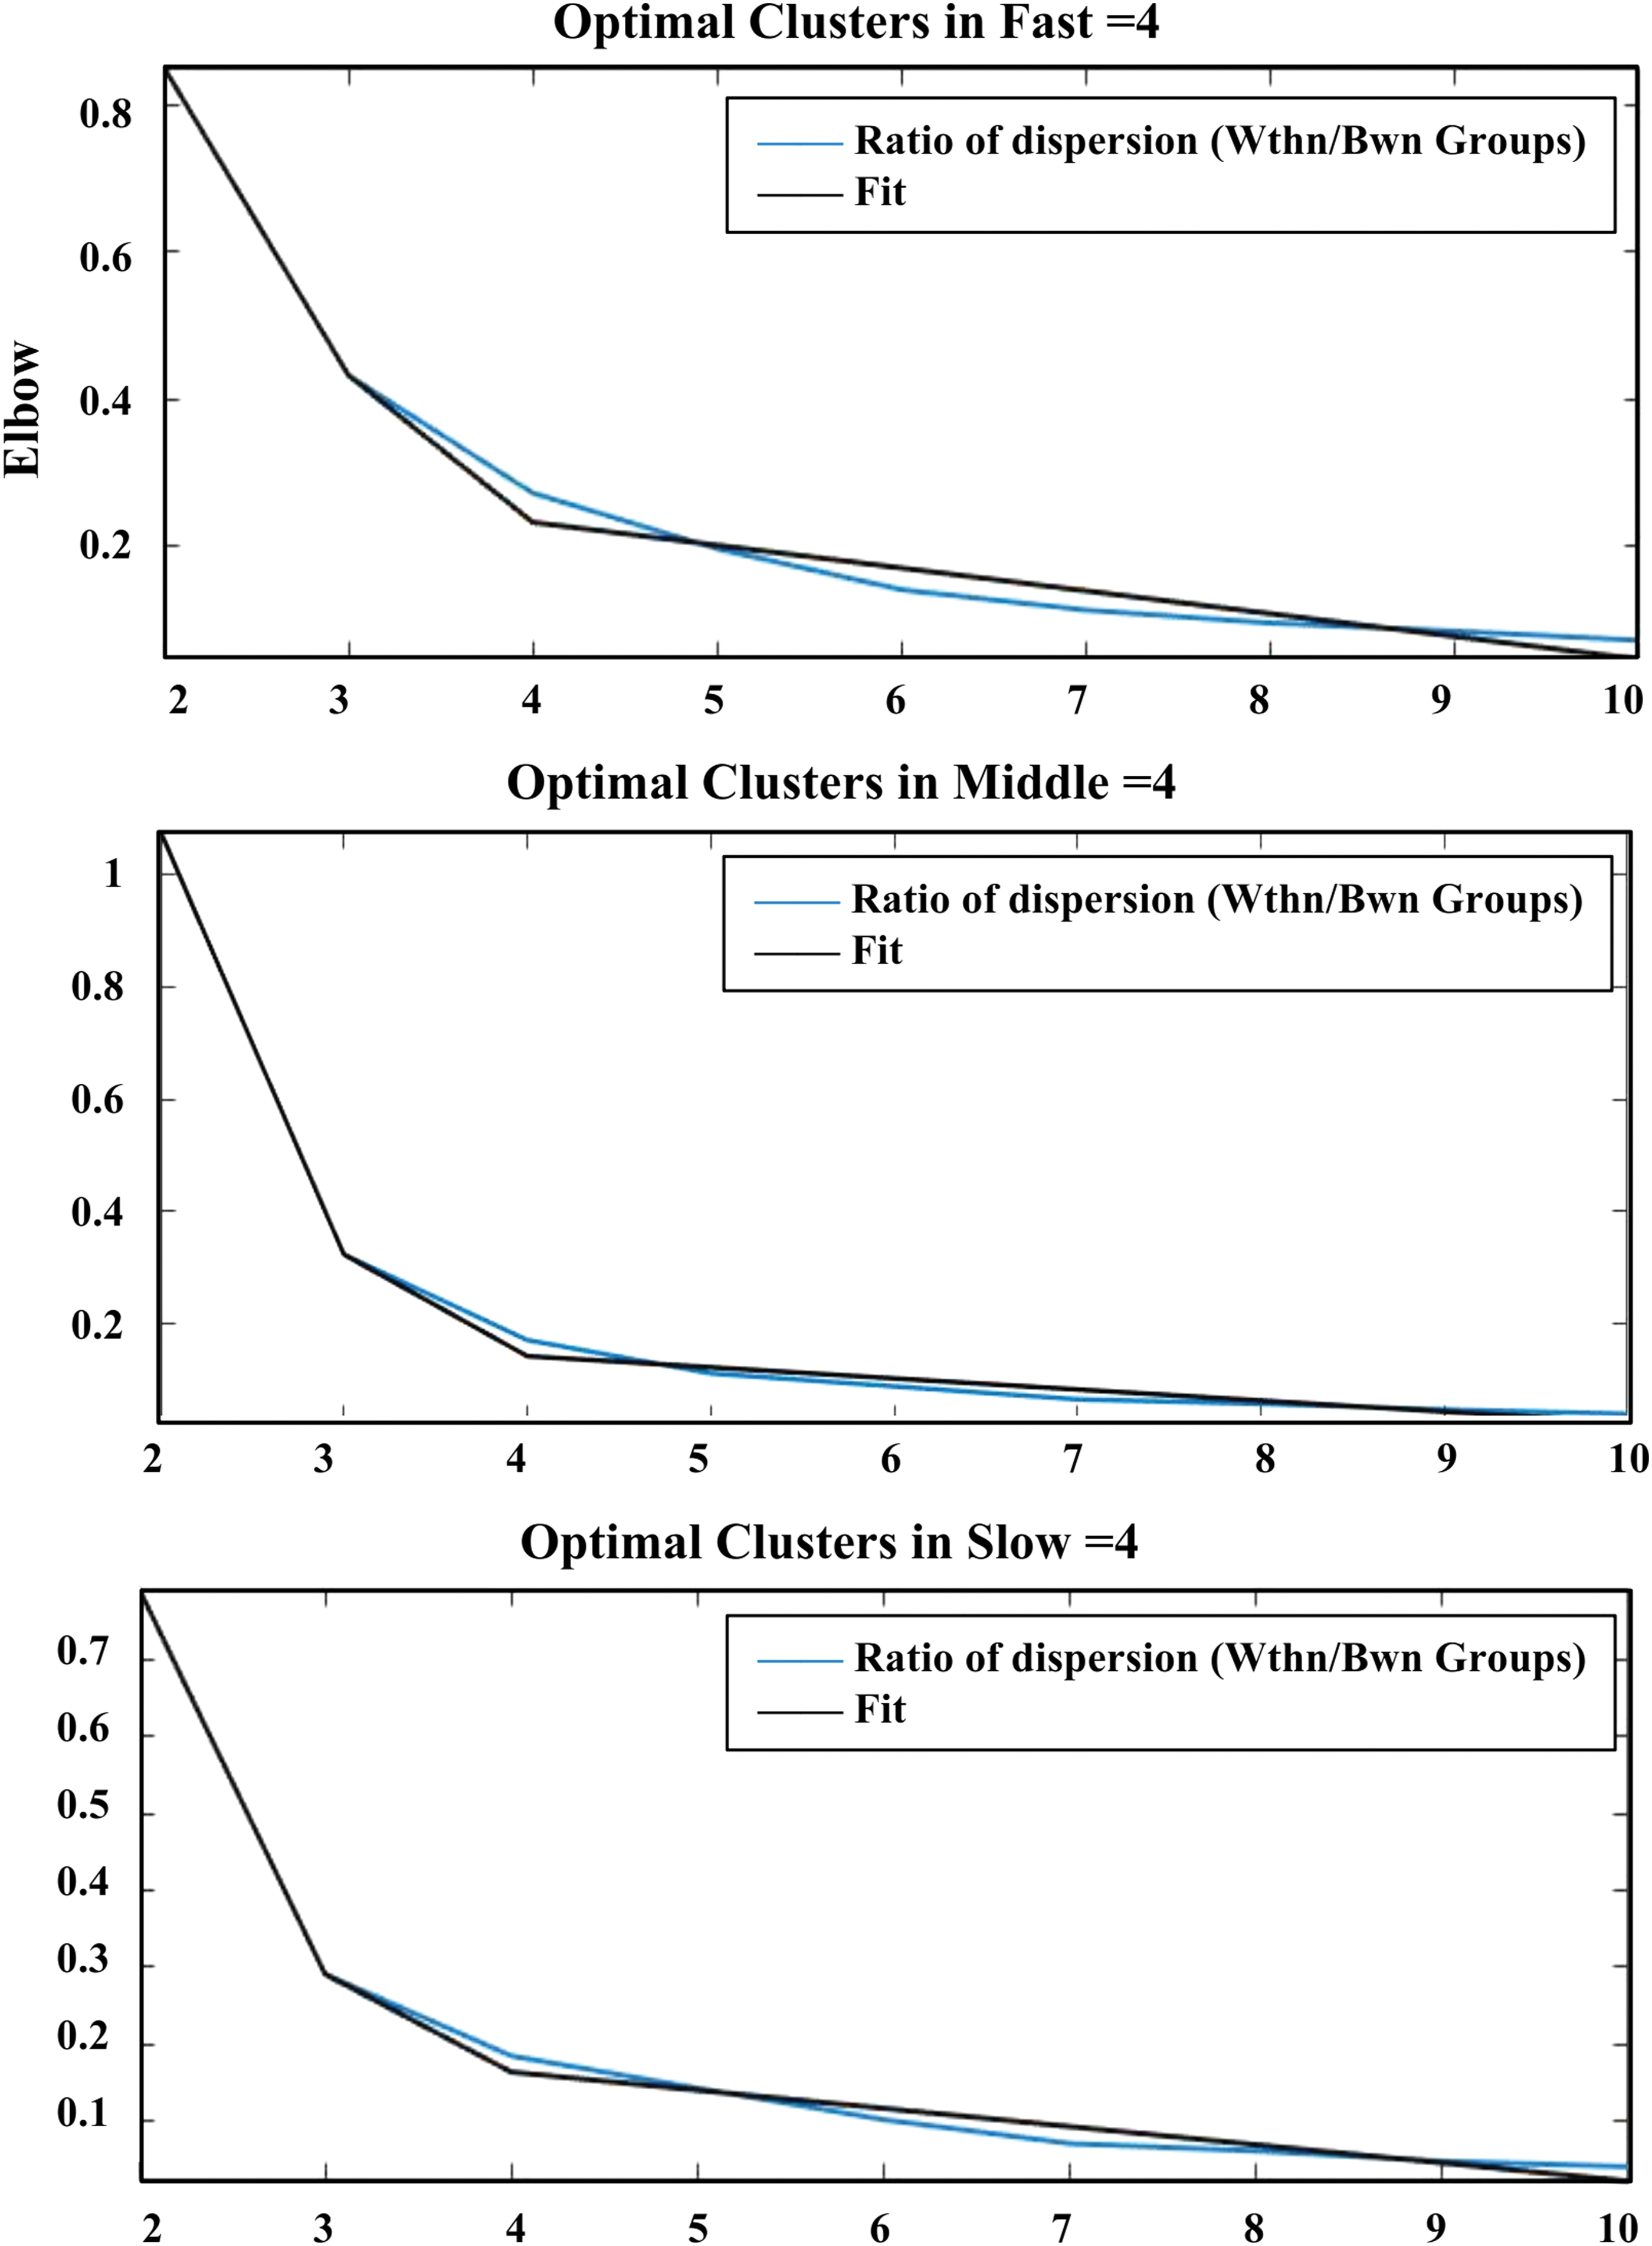
Optimal clusters of FNCs of musical emotions in fast, middle, and slow music. Color images are available online.
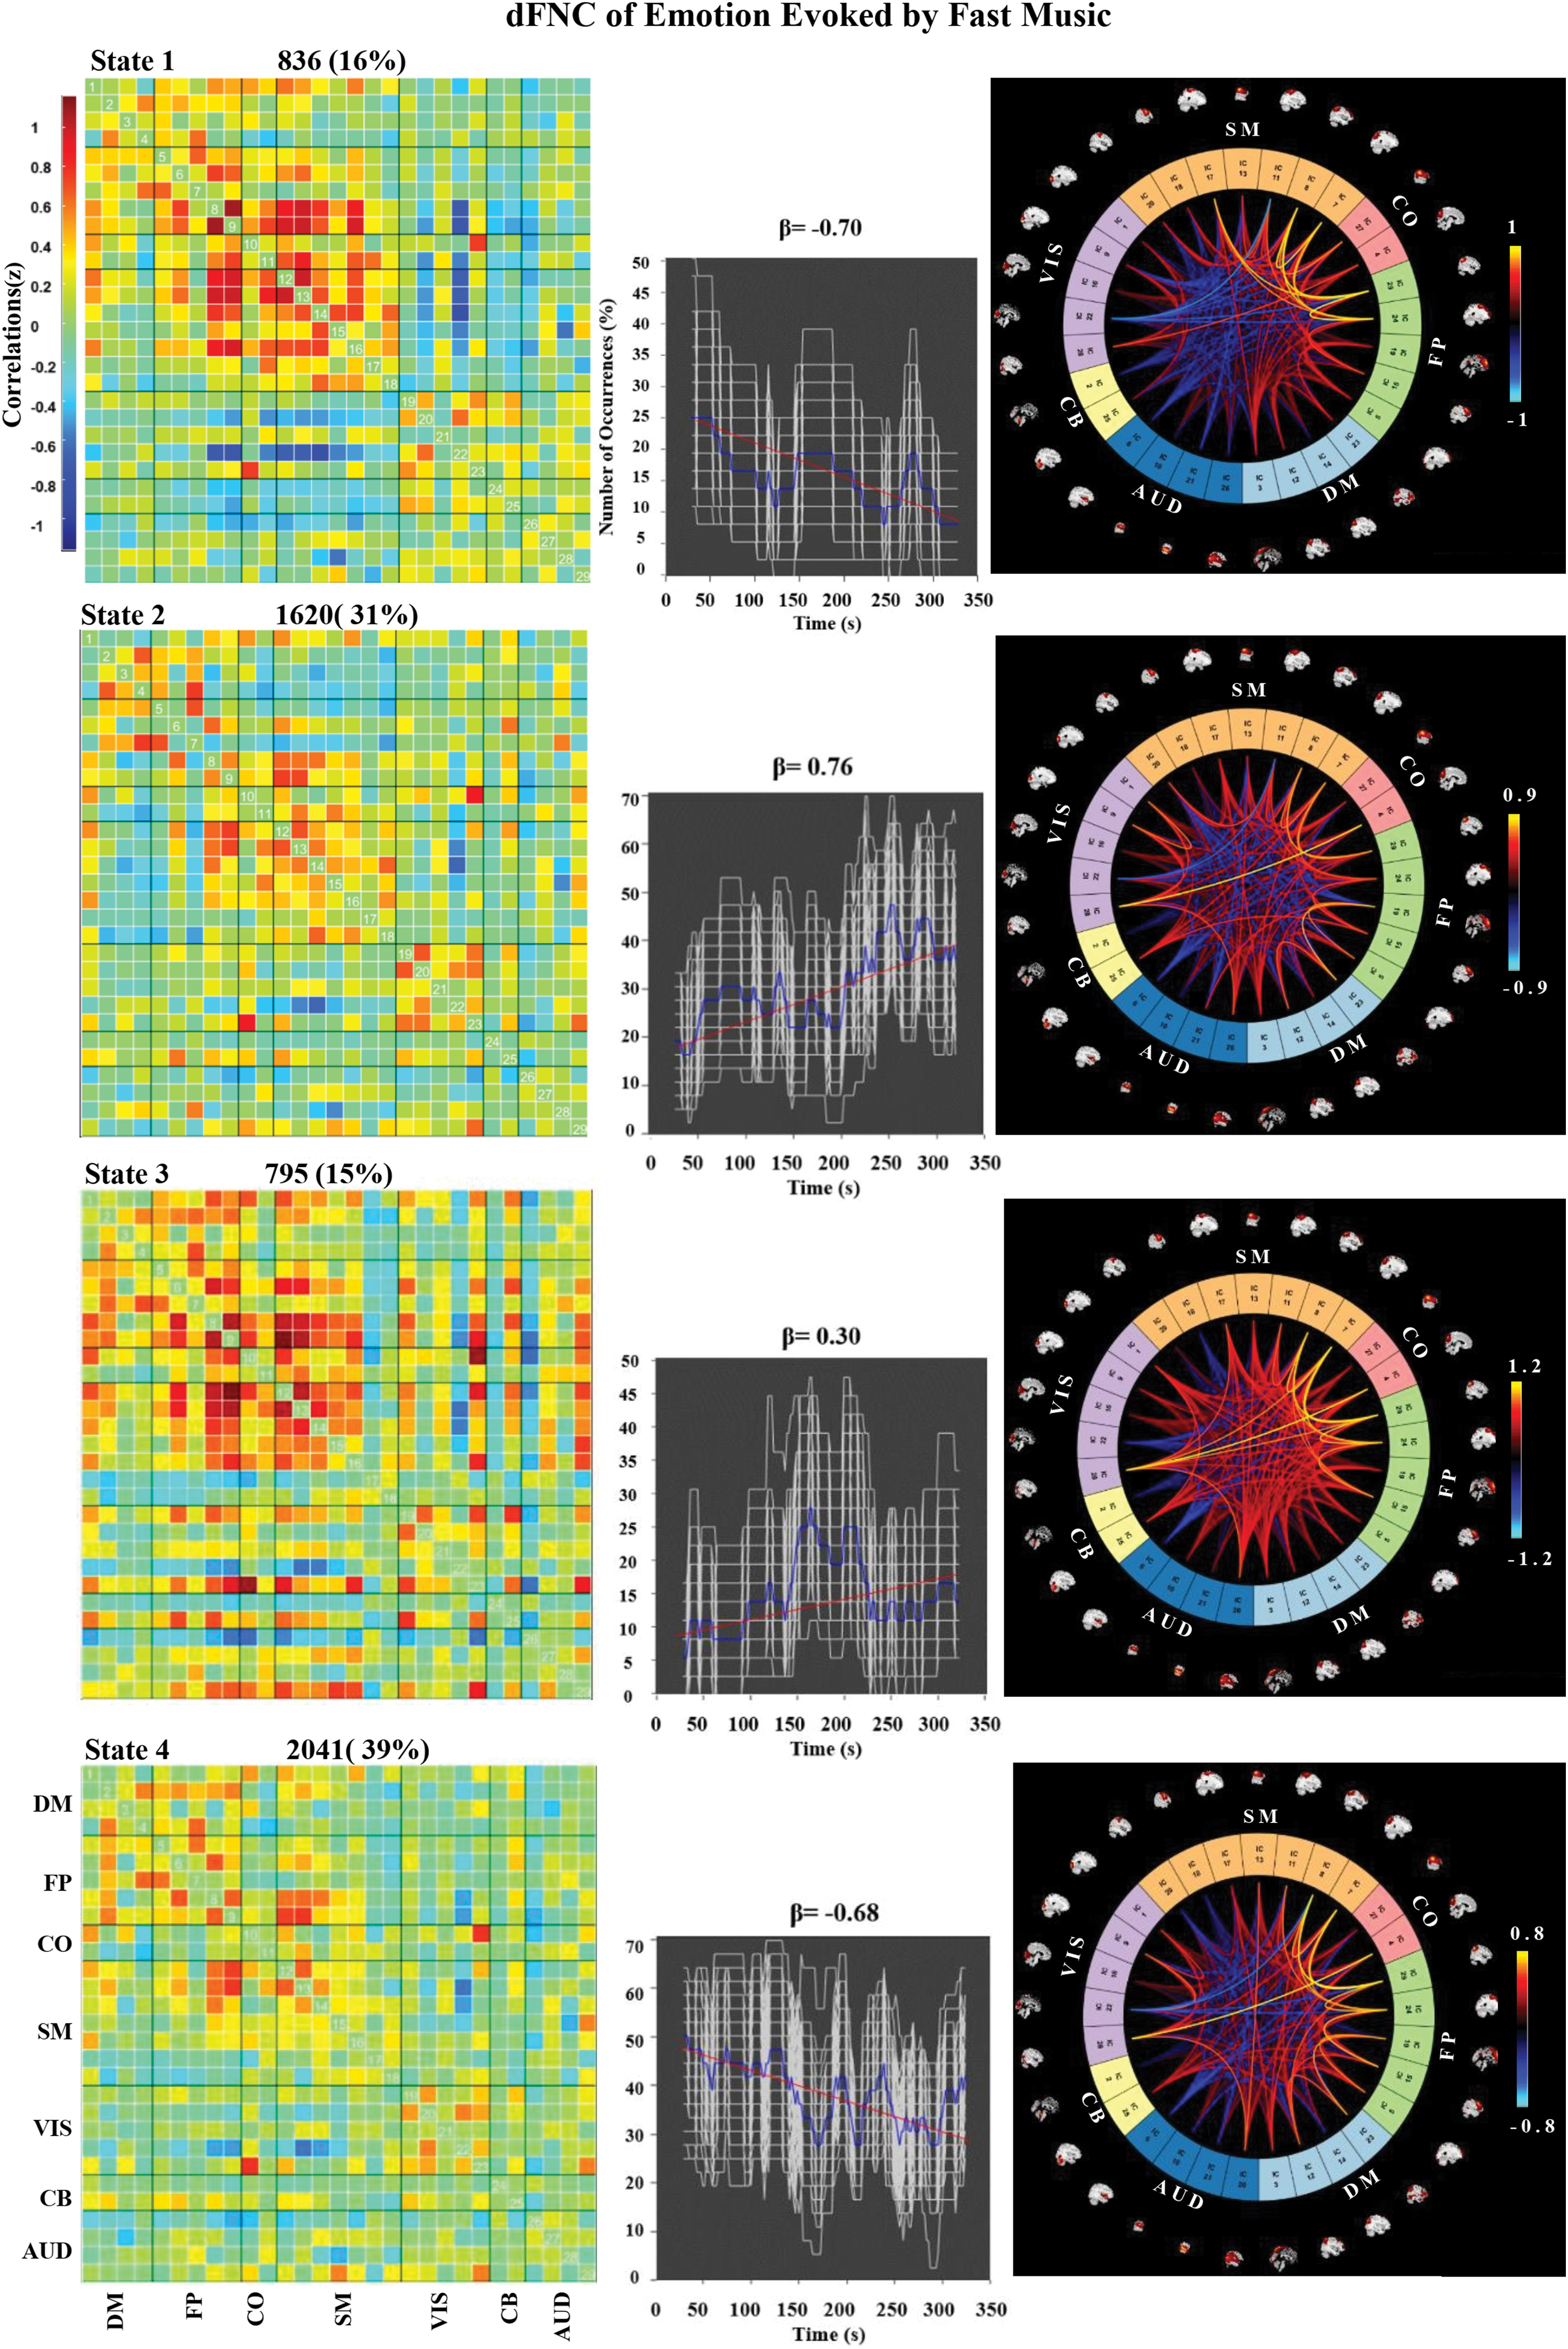
Correlation matrix, number of occurrences, and connectograms of the four clusters of evoked emotion by fast-tempo music. Color images are available online.
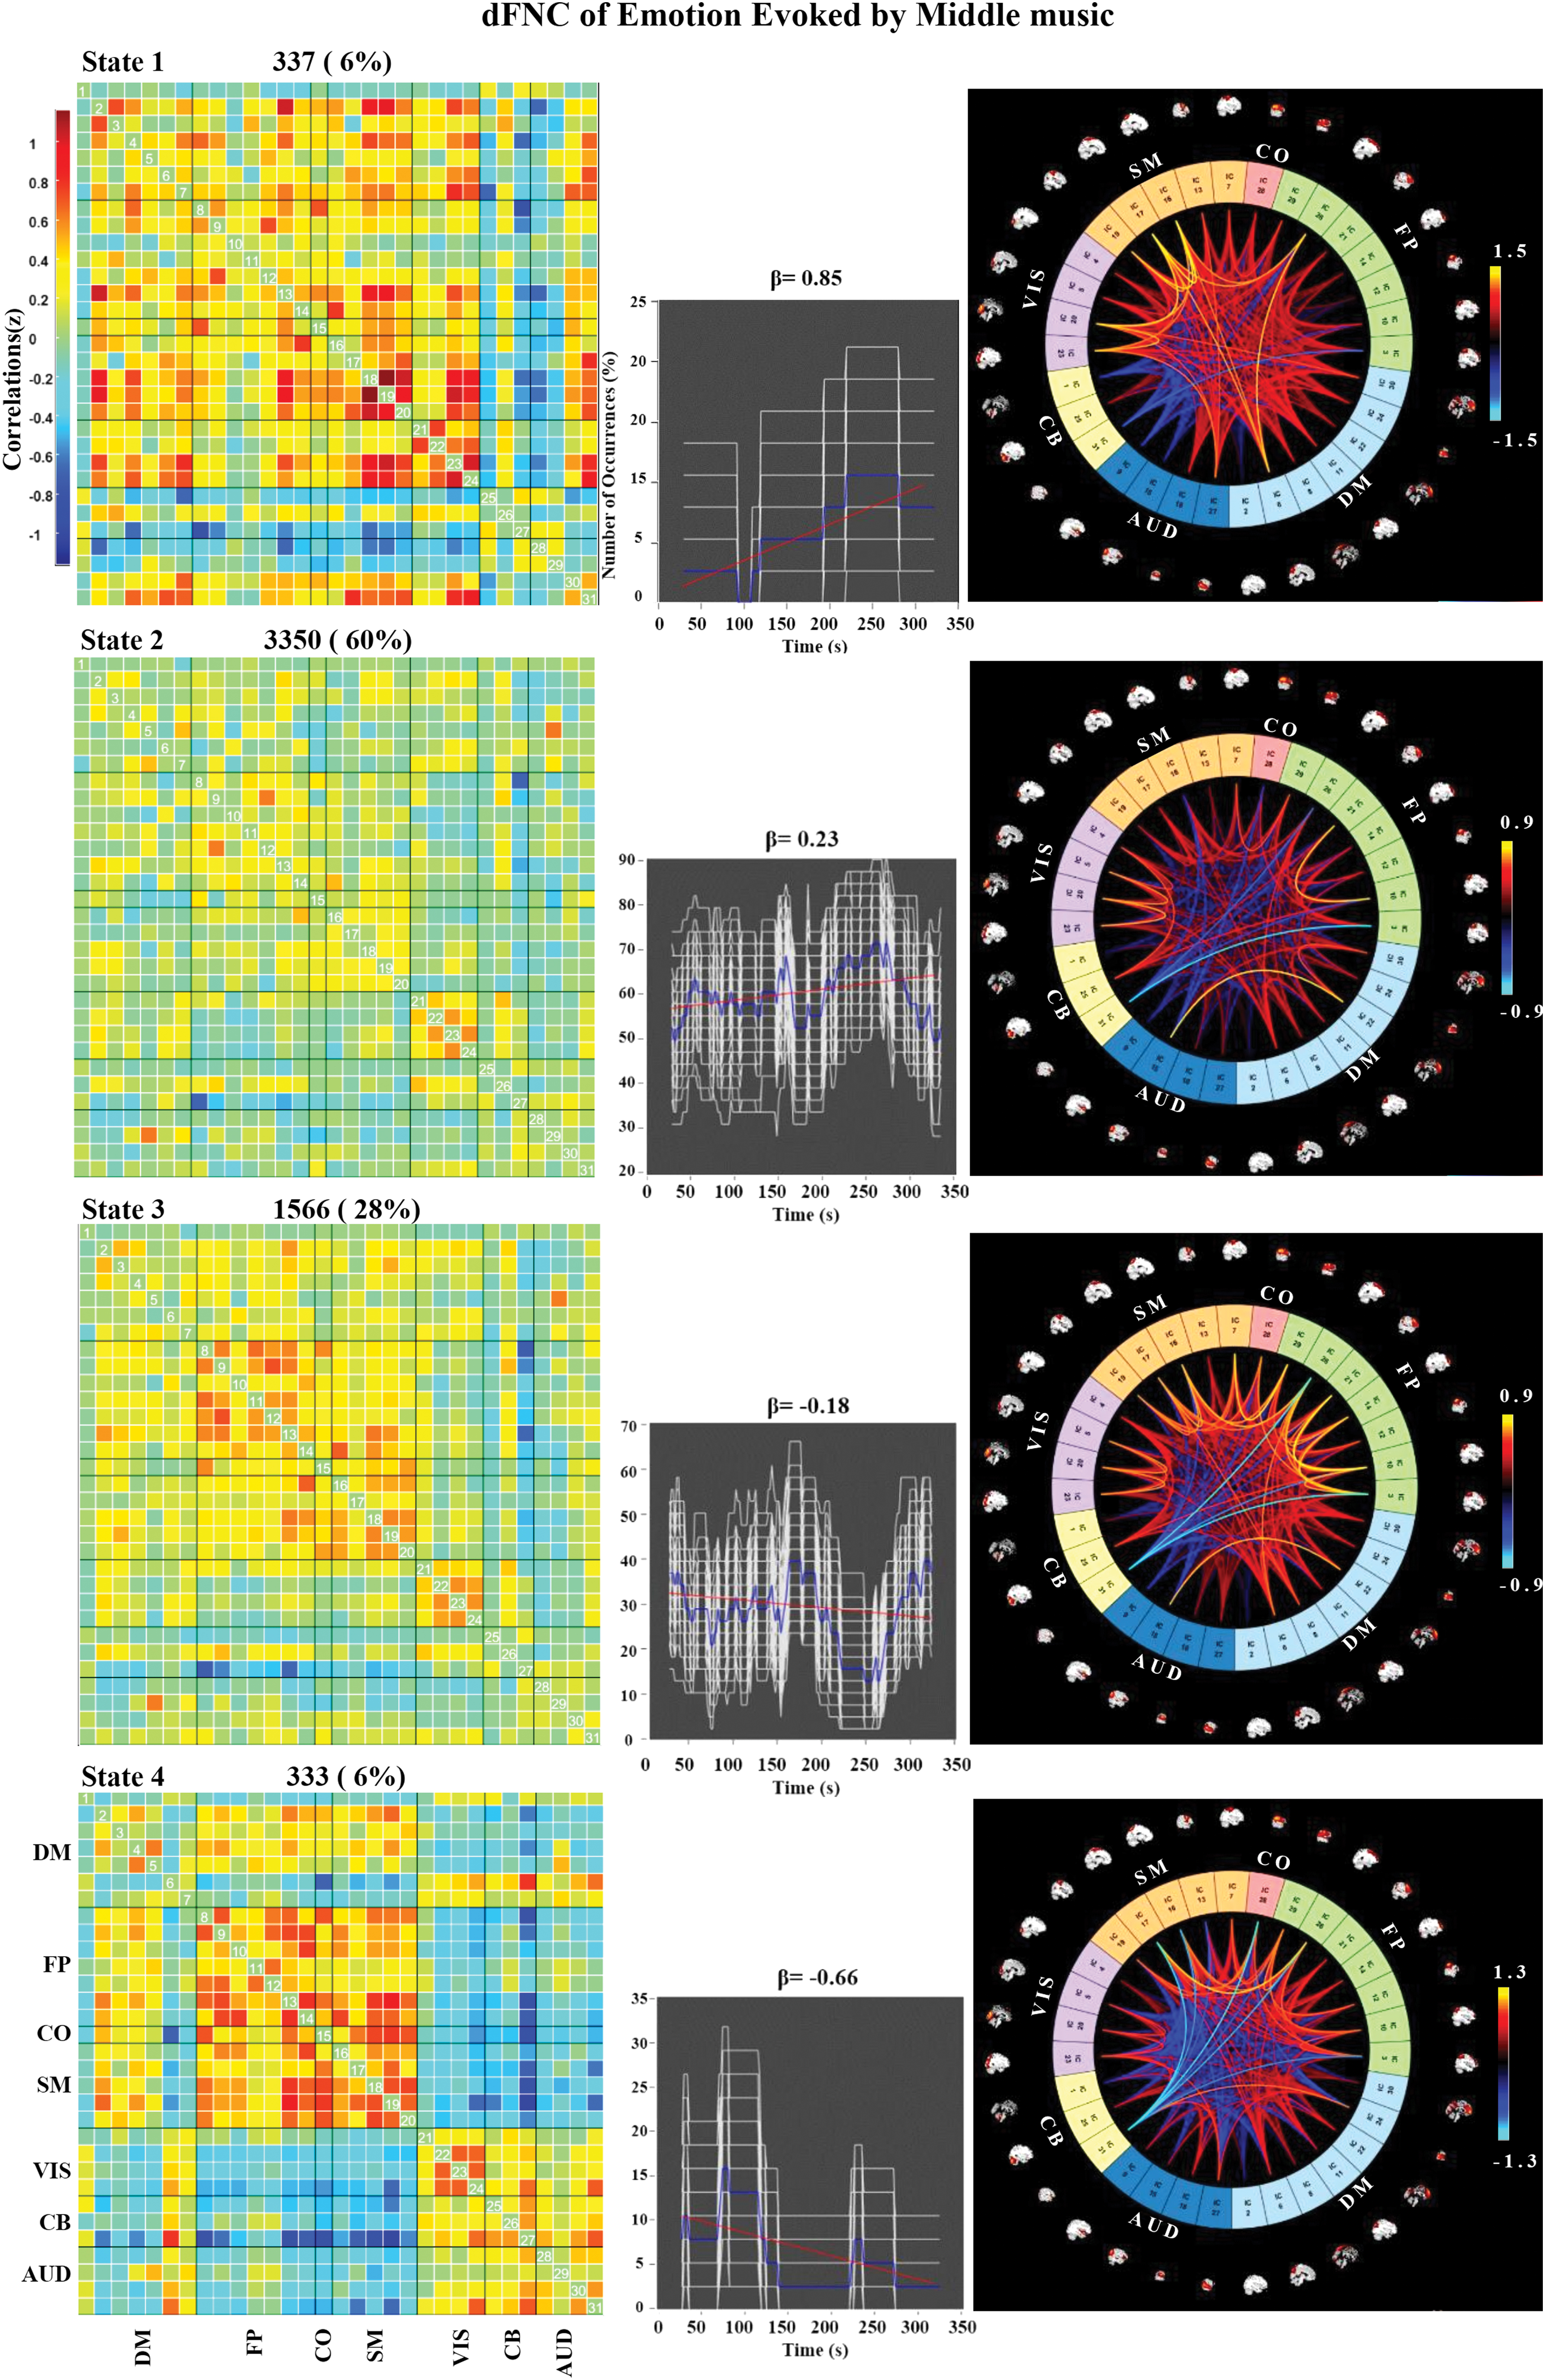
Correlation matrix, number of occurrences, and connectograms of the four clusters of evoked emotion by middle-tempo music. Color images are available online.
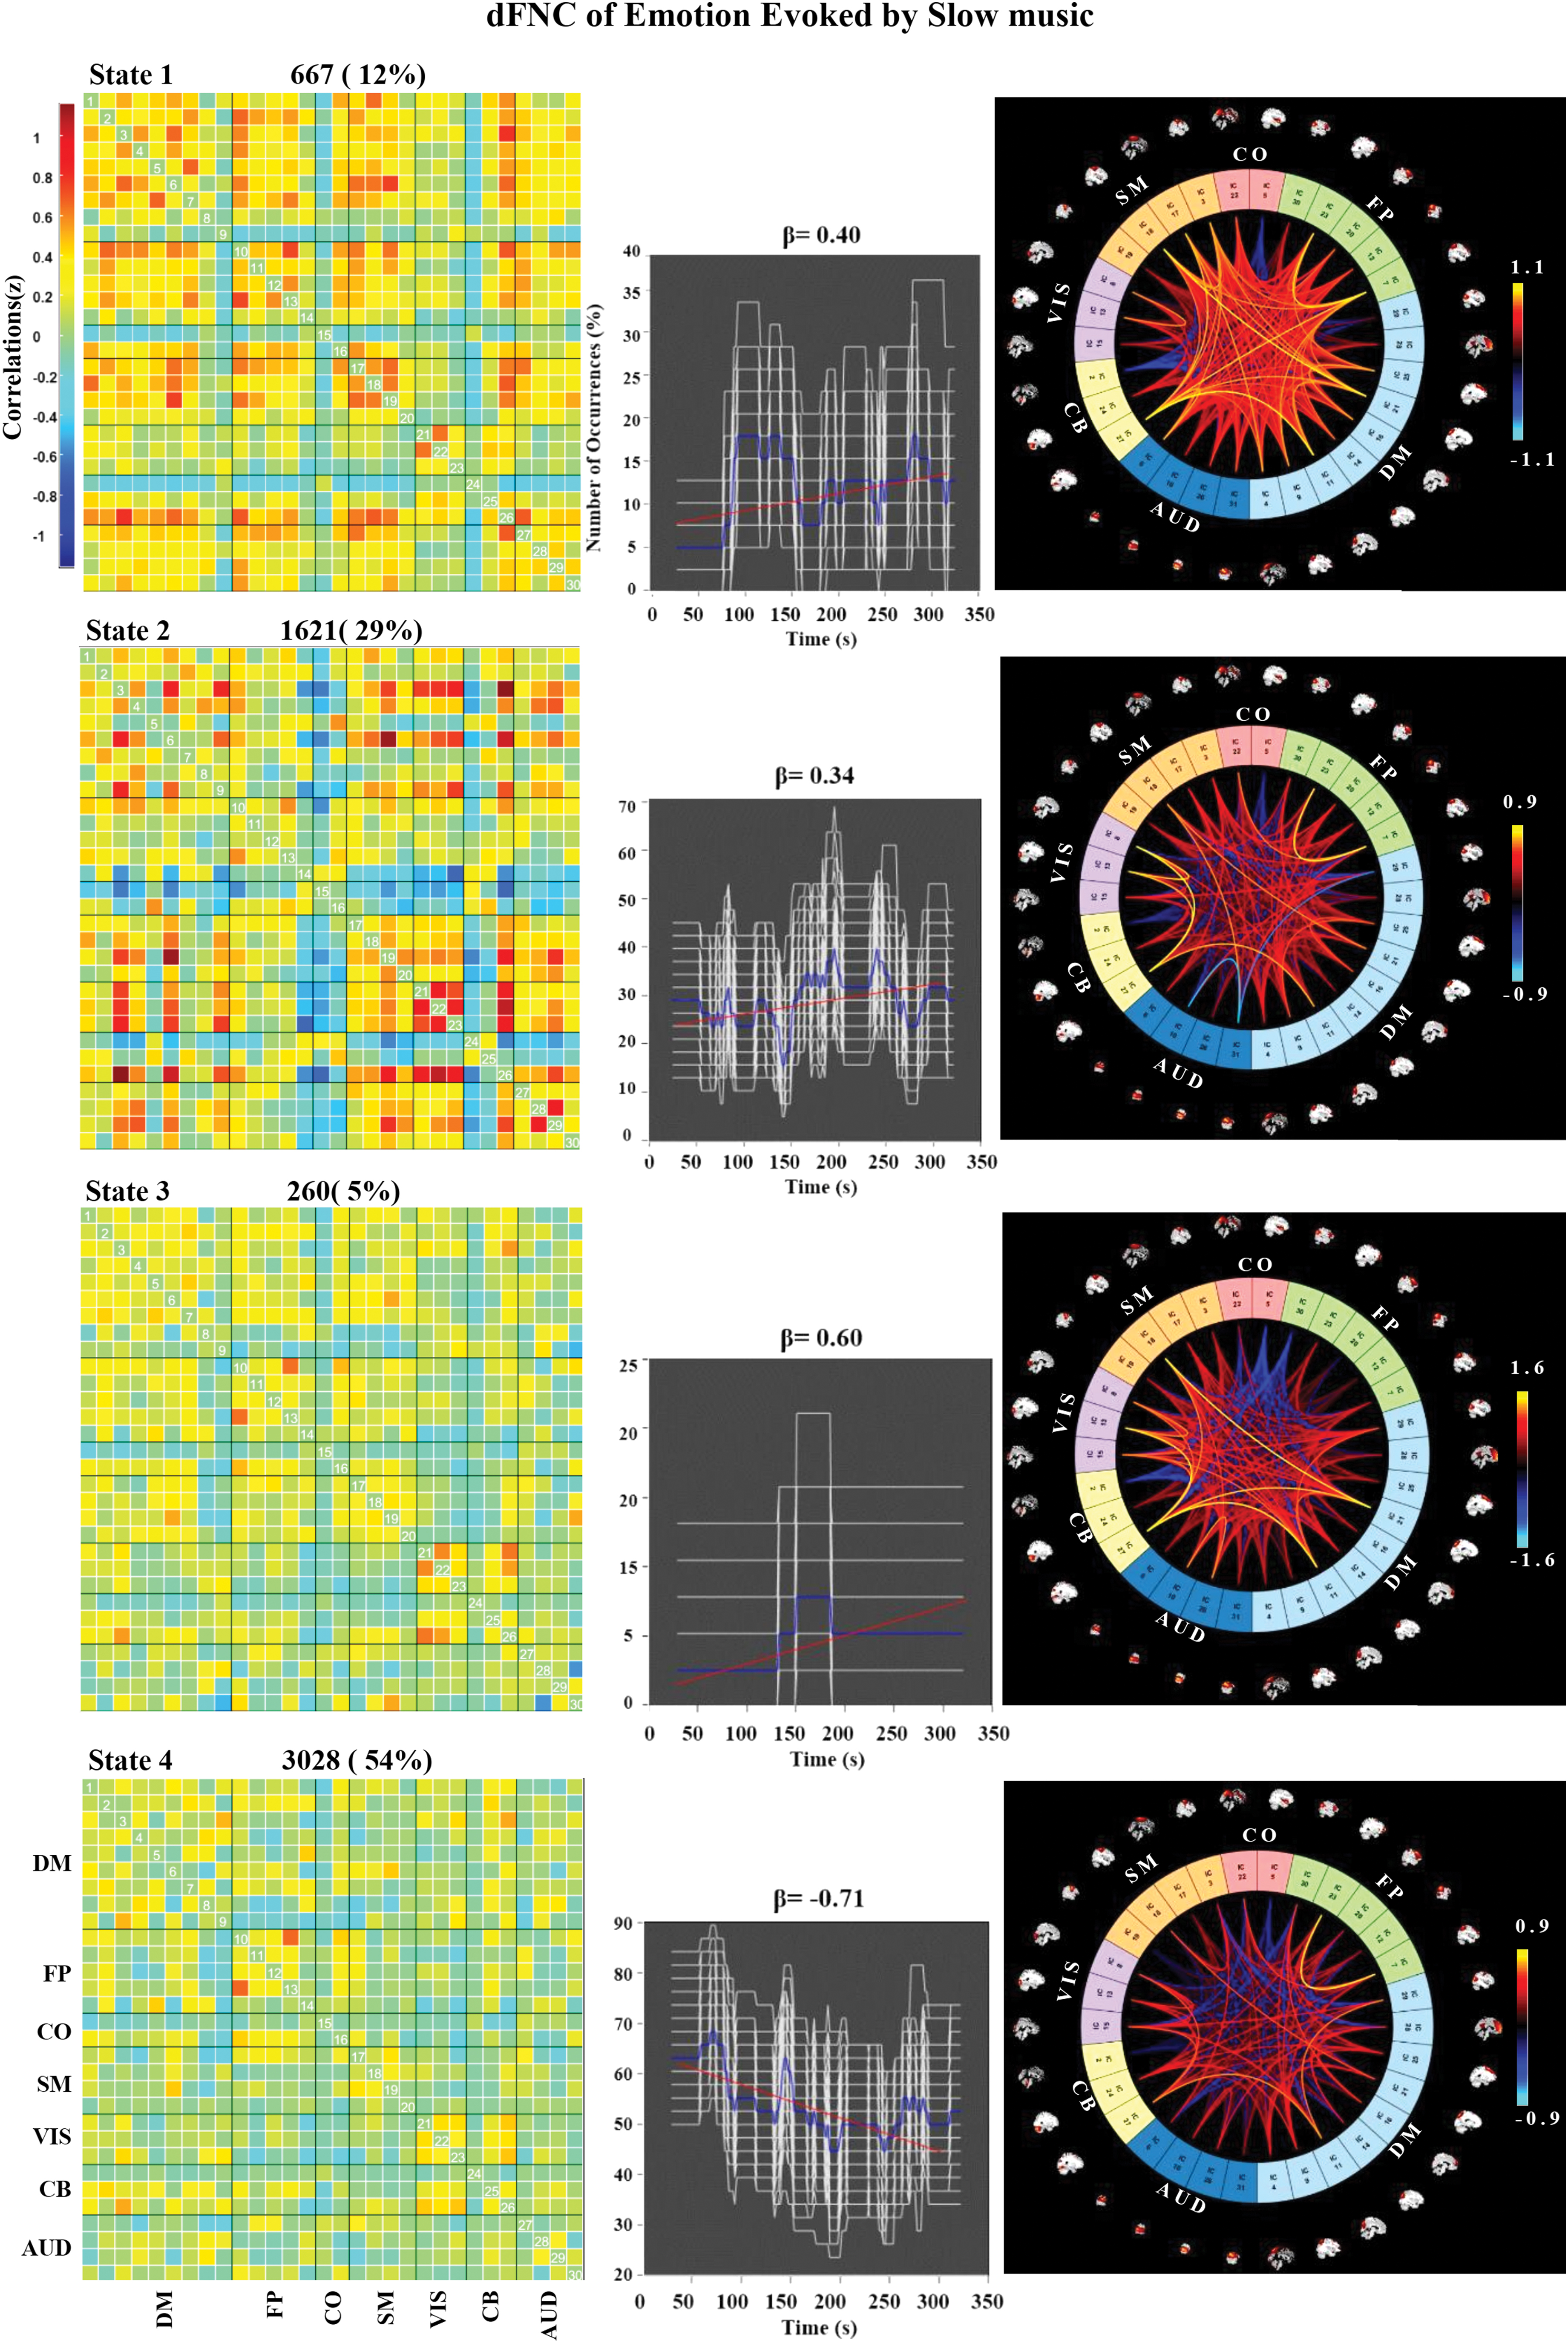
Correlation matrix, number of occurrences, and connectograms of the four clusters of evoked emotion by slow-tempo music. Color images are available online.
In the fast-tempo condition (Fig. 5), State 2 and State 4, which both accounting for >30% of all windows. FC patterns in State 1 and State 3 were observed less frequently with range between 15% and 16%; however, they represent connectivity diverging substantially from the mean. We observed two notable features that differed between FC states in the fast-tempo condition, although many additional distinctions were also present. First, the opposite trends were found for the main connectivity in State 2 and State 4. State 2 was associated with increasing connectivity between CO and SM (β = 0.76), representing the synchronization of emotional and sensorimotor processing. In contrast, State 4 was associated with decreasing connectivity between FP and SM (β = −0.68), indicating that cognitive control had a negative effect on the SMA. Second, in most states, SM, FP, and VIS exhibited stronger internal positive correlations than other systems, often forming a large sensorimotor module.
In the middle-tempo condition, State 2 accounted for 60% of all windows, with an increasing tendency among FP, SM, and VIS (β = 0.23). State 3 accounted for 28% of all windows, with a decreasing tendency (β = −0.18). Compared with the FNC of fast-tempo and slow-tempo music, the dFNC of middle-tempo music exhibited a gently changing tendency with the smallest absolute β values, indicative of a stable whole-brain functional activity.
In the slow-tempo condition, State 4 accounted for 54% of all windows, centered in a positive connection between DM and CB. We also observed a decreasing tendency among FP, SM, and VIS (β = −0.71), indicating that the effects of music on most brain regions were subdued in the slow condition when compared with the other conditions. State 2 accounted for 29% of all windows, showing a negative connection between CO and the other six ICNs with a slowly increasing tendency (β = 0.34). This finding indicates that, at some moment of listening to slow music, emotional processing in the CO region may be restrained by other ICNs.
All the state transitions are presented in Supplementary Figure S1.
Paired t-test of the group ICs
Paired t-tests were executed under FDR correction (p < 0.05). When examining the difference between fast-tempo and middle-tempo music, we identified 29 ICs and observed significant effects in superior parietal lobule (SPL) and STG. When examining the difference between slow-tempo and fast-tempo music, we identified 30 ICs and observed significant effects in left middle temporal gyrus and CB. When examining the difference between middle-tempo and slow-tempo music, we identified 31 ICs and observed significant effects in precentral gyrus (PreCG) and postcentral gyrus (PoCG), which are important ICs of the SMA network.
Discussion
In this study, we explored the dFNC associated with emotions evoked by music presented at different tempi using group ICA, sliding windows, k-means clustering, and paired t-tests. The dFNC analysis in musical emotion evoked by three typical tempi provided the first FNC evidence of regional differences in spatial collaborative relationship and a dynamic change in time. The three kinds of tempi have their corresponding neural implications.
dFNC of SM, CO, and FP for emotions evoked by fast music
Fast music was associated with more positive and exciting emotions than slower music both during fMRI scanning and post-scanning. Conventionally, researchers have explained this phenomenon based on stronger blood oxygenation level-dependent activation in the bilateral STG, right posterior cingulate cortex (PCC), and right precuneus (Liu et al., 2018). However, this evidence is insufficient for explaining the intricate relationship between music tempi and emotion. Our data-driven analysis in well-recognized networks revealed strong connections both between and within SM, FP, and CO when participants listened to fast music. Paired t-tests revealed that fast music also evoked stronger activation in the SPL, which is an important IC of the SM network (Fig. 8a). Similarly, increased activation of the PreCG and PoCG during middle-tempo and slow-tempo music provides evidence that faster music can more strongly activate the SMA, which explains the higher level of arousal for faster music. Faster music was also associated with stronger activation of CO than slower music (Fig. 3). During the presentation of happy music, increased activation has been observed in a neural network involving the CO, including the ventral and dorsal striatum, anterior cingulate, and parahippocampal gyrus (Matsunaga et al., 2016; Mitterschiffthaler et al., 2007). The stronger influence of CO here explained the higher pleasure in faster music.
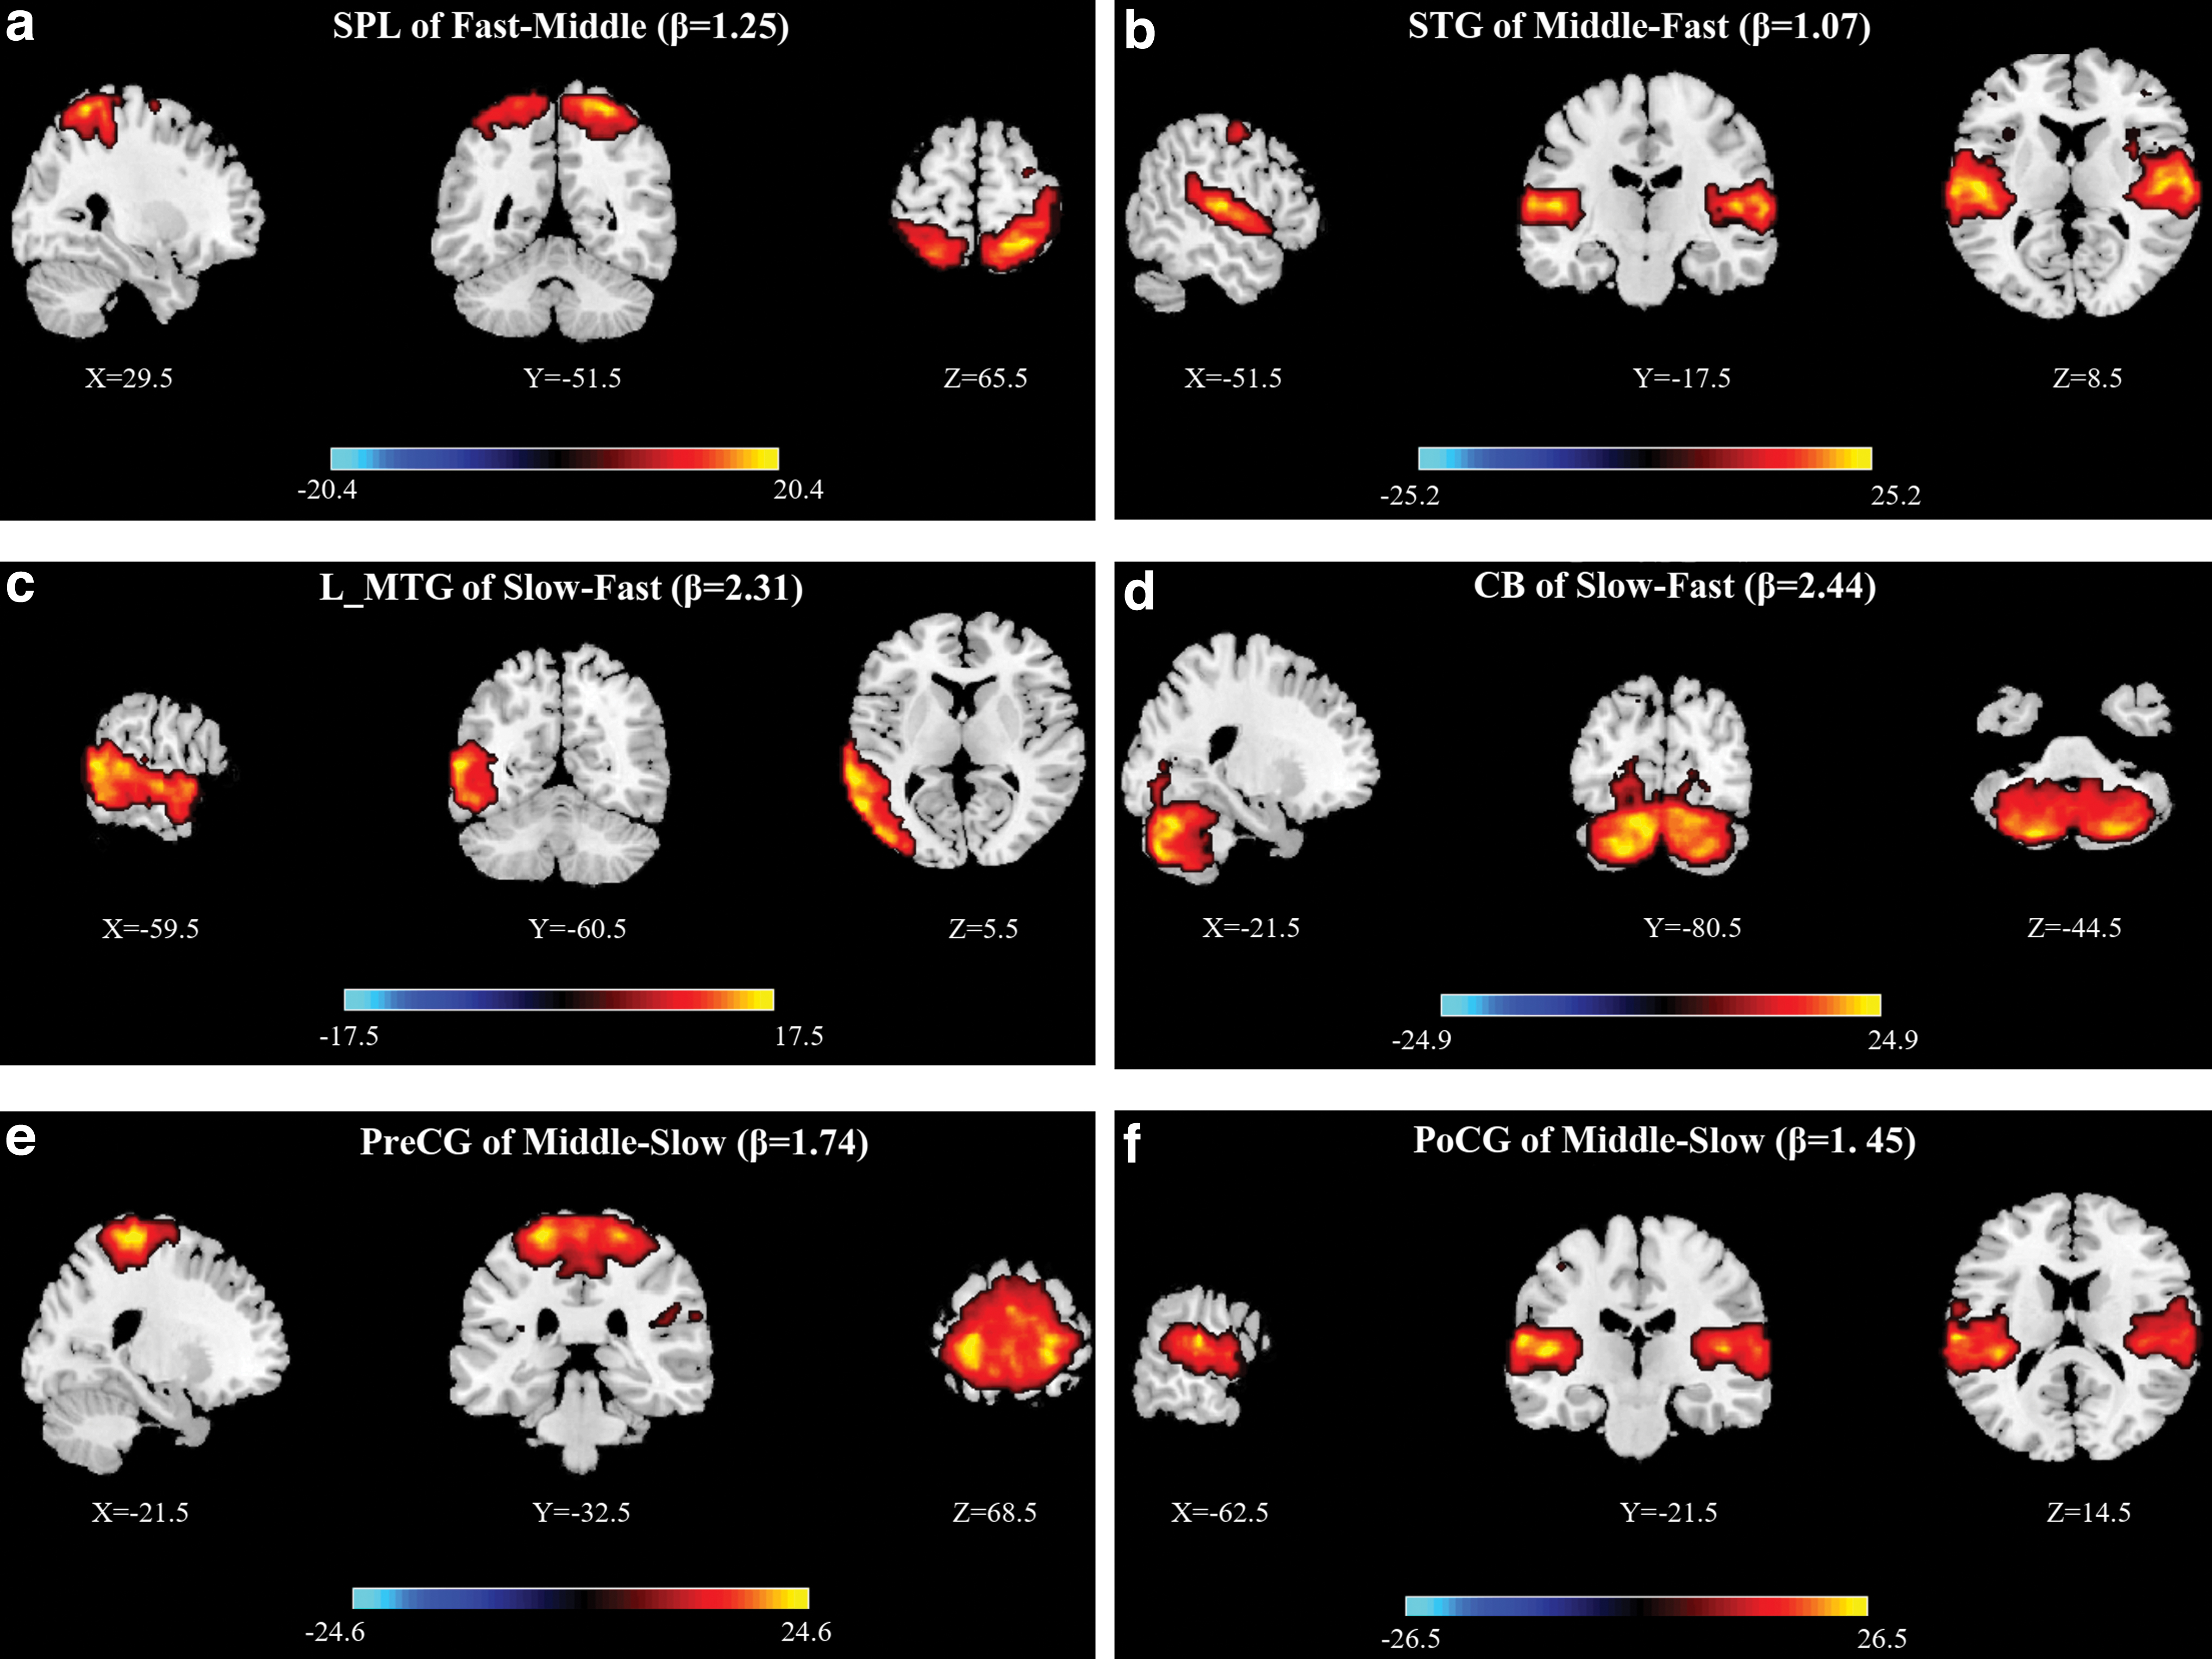
Significant effects of paired t-test among the three groups.
In addition to evoking positive emotions, fast music increased FNC between the SM and CO (Fig. 5, State 2). Meanwhile, the connections between the SM and FP decreased during music presentation (Fig. 5, State 4), indicating that the brain may lose some capacity for cognitive control after one period of listening and become more emotionally driven. This was consistent with the finding that faster tempi have been associated with happiness and the brain areas associated with processing emotion and motor control (Bishop et al., 2014; Webster and Weir, 2005). Overall, the dFNC among the SM, CO, and FP regions provides a temporal neural explanation for the high valence and arousal observed when participants listened to fast music.
dFNC of AUD and DM for emotions evoked by slow music
Slower music usually evoked softer and deeper emotions, some of which exhibited negative valence (Sloboda and Juslin, 2001). In accordance with the traditional view, it is speculated that slower music may activate weaker neural responses than fast music in the AUD or limbic system than faster music (Liu et al., 2018). Actually, by comparing the neural activity in the current study, we found that music with a slower tempo was associated with stronger activation in AUD cortex than music with a faster one. The FNC results of paired t-test showed that middle-tempo music activated the STG more strongly than fast music. Slow-tempo music activated the left middle temporal gyrus (MTG) more strongly than fast-tempo music. As two important areas of AUD networks, the activated STG and MTG here suggested the neural advantages of slow music in AUD information processing and emotion processing (Liu et al., 2020; Park et al., 2014; Thomas et al., 2015). Their activation here may explain the increasingly positive emotion value of sad music that is usually with a slow tempo (Vuoskoski et al., 2011; Yoon et al., 2020). However, it cannot explain the lowest emotional ratings of slow music among the three kinds of music.
The dynamic analysis of the emotions evoked by slow music revealed that the primary state of neural connectivity showed a significant decrease during music listening (Fig. 5, State 4). Meanwhile, FNC analysis indicated strong involvement of the DM network during slow music presentation, with the largest IC number in the three conditions and stable positive activation within and between the four clustering stations. Taruffi and colleagues (2017) found that music of slower tempo was associated with greater mind-wandering and greater centrality of DM nodes than faster tempo. Interestingly, Garza-Villarreal and associates (2015) demonstrated that slow music, with the participation of DM network, can function in a top-down manner to reduce pain in patients with fibromyalgia. As shown in Figure 3, average whole-brain FNC was weakest for slow music. In total, the observed effects of slow music on FNC in AUD and DM provide internal neural evidence of its calming and relaxing attributes.
dFNC for emotions evoked by middle-tempo music
Middle-tempo music has been found to have the most effective influence on maintaining drivers' attention and reducing fatigue among several different kinds of music tempo (Li et al., 2019). In the current study, its effects on listeners' arousal suggested that it may be of some uncovered value in emotion regulation. When comparing the emotion ratings obtained during and after fMRI scanning, we observed a significant difference in arousal for middle-tempo music only, indicating that middle-tempo music may exert stronger effects on emotional arousal than on valence. In our previous study, we observed that music with a middle tempo (76–122 bpm) was associated with greater arousal than that presented at a fast/slow tempo with a large range of neural activation in the AUD cortex, PCC, precuneus, and inferior parietal lobe (IPL) (Liu et al., 2018). We speculated that middle-tempo music would be more readily available in terms of acoustic perception given its similar tempo to human physiological rhythms, such as the rhythm of the heart (Iwanaga, 1995). Current, middle-tempo music evoked more stable dFNC (Fig. 6, State 2 and State 3), indicating that this type of music may create a more peaceful, steady-state experience of emotional intensity, which is also consistent with its mitigative effects on the fatigue associated with long-distance driving.
Limitations
The current study addressed the dFNC associated with emotions evoked by music presented at different tempi, providing valuable neural evidence to explain the relationship between music tempo and emotion. However, the main limitation of this study is the multiple signal synchronization in music stimuli, emotional ratings, and neural responses. In future studies, music of accelerating or decelerating tempo may be used to provide more direct dynamic evidence if an effective method for synchronously locating the key moments of emotional transition in both subjective ratings and neural responses can be identified. If this limitation can be overcome, the dynamic covariant relations between music tempi and their emotional effects can provide more effective and instructive evidence in neurological music therapy (Feiss et al., 2020; Husain et al., 2002).
Conclusion
Using a data-driven approach, this study explored the dFNC associated with the emotions evoked by music presented at different tempi. The present study is the first to provide the FNC evidence of regional differences in spatial collaborative relationship and a dynamic change in time to explain the different emotional effects of fast-tempo, middle-tempo, and slow-tempo music. The findings indicated that faster music increases neural activity in the SM and CO regions, increasing the intensity of the emotional experience. In contrast, slower music was associated with decreasing engagement of AUD and stable engagement of DM, resulting in a calm emotional experience.
Data Availability
The original data to this article can be found online at
Footnotes
Authors' Contributions
Y.L. and G.L. designed the research. Y.L. and W.L. performed the experiment. Y.L. wrote the first draft. X.Z., Q.T., and G.L. reviewed and edited the article.
Author Disclosure Statement
No competing financial interests exist.
Funding Information
This research was supported by the National Natural Science Foundation of China (61872301), China Postdoctoral Science Foundation (2019M663882XB), Chongqing Postdoctoral Natural Science Foundation, China (cstc2020jcyj-bshX0049), and Chongqing Postdoctoral Innovative Talents Support Program, China.
Supplementary Material
Supplementary Figure S1
Supplementary Table S1
Supplementary Table S2
References
Supplementary Material
Please find the following supplemental material available below.
For Open Access articles published under a Creative Commons License, all supplemental material carries the same license as the article it is associated with.
For non-Open Access articles published, all supplemental material carries a non-exclusive license, and permission requests for re-use of supplemental material or any part of supplemental material shall be sent directly to the copyright owner as specified in the copyright notice associated with the article.