




Abstract
Background:
Impaired movement after stroke is closely associated with altered brain functions, and thus the investigation on neural substrates of patients with stroke can pave a way for not only understanding the underlying mechanisms of neuropathological traits, but also providing an innovative solution for stroke rehabilitation. The objective of this study was to precisely investigate altered brain functions in terms of power spectral and brain network analyses.
Methods:
Altered brain function was investigated by using electroencephalography (EEG) measured while 34 patients with chronic stroke performed movement tasks with the affected and unaffected hands. The relationships between functional brain network indices and Fugl-Meyer Assessment (FMA) scores were also investigated.
Results:
A stronger low-beta event-related desynchronization was found in the contralesional hemisphere for both affected and unaffected movement tasks compared with that of the ipsilesional hemisphere. More efficient whole-brain networks (increased strength and clustering coefficient, and prolonged path length) in the low-beta frequency band were revealed when moving the unaffected hand compared with when moving the affected hand. In addition, the brain network indices of the contralesional hemisphere indicated higher efficiency and cost-effectiveness than those of the ipsilesional hemisphere in both the alpha and low-beta frequency bands. Moreover, the alpha network indices (strength, clustering coefficient, path length, and small-worldness) were significantly correlated with the FMA scores.
Conclusions:
Efficient functional brain network indices are associated with better motor outcomes in patients with stroke and could be useful biomarkers to monitor stroke recovery during rehabilitation.
Impact statement
Even though understanding neuropathological mechanisms in patients with stroke can assist motor rehabilitation, their neuropathological traits have not been fully explored in previous studies. The present study discovered the distinct disruptions of functional brain networks by using electroencephalography data measured during the affected hand movement, and the altered functional networks were significantly correlated with Fugl-Meyer Assessment scores. Our experimental results can provide an in-depth understanding of the neuropathology for patients with stroke, implying that the distinct functional network indices can be potentially used as biomarkers to objectively monitor the degree of motor impairments for patients with stroke during motor rehabilitation.
Introduction
Upper limb impairment is one the most common impairments after stroke (Feigin et al., 2014; Nakayama et al., 1994). Interestingly, upper limb impairments are related to abnormal neuronal activities, which have been revealed by electroencephalography (EEG)-based studies. Abnormal power spectral densities (PSDs) of alpha (8–12 Hz) and low-beta (12–20 Hz) frequency bands when moving the impaired body parts are a typical biomarker of patients with stroke with upper limb impairments (Achard et al., 2006; Babiloni et al., 1999; Wilson et al., 2014). According to previous studies, patients with stroke showed weaker alpha and low-beta event-related desynchronization (ERD) patterns in the primary sensorimotor and supplementary motor areas when moving their affected upper limbs than healthy controls (Alegre et al., 2004; Babiloni et al., 1999; Wilson et al., 2014). In addition, patients with stroke showed stronger ERD patterns in the undamaged contralesional hemisphere than in the damaged ipsilesional hemisphere when moving the affected body part (Stępień et al., 2011), indicating that the contralesional hemisphere is more involved with the affected upper limb movement than the ipsilesional hemisphere. Such altered neural activities of patients with stroke have been described by power spectra-based features of task-specific EEGs. However, due to the complex communications between different brain regions, the fragmentary PSDs obtained at individual brain areas are not sufficient to fully explain abnormal brain mechanisms of patients with stroke.
Quantifying functional connectivity between brain regions could provide more in-depth information to understand the brain mechanism when moving their affected body parts in patients with stroke (Gerloff et al., 2006; Serrien et al., 2004; Wu et al., 2015). According to a previous functional connectivity study (Wu et al., 2015), patients with stroke showed weaker interactions over the whole brain in the beta frequency band than healthy controls. Another study found distinct information flow in patients with stroke between motor areas (C3 and C4 in the international 10–20 system) by using directional functional connectivity (Serrien et al., 2004); patients with stroke showed higher strength of directional functional connectivity flow from the contralesional hemisphere to the ipsilesional hemisphere when moving the affected hand, whereas healthy controls showed the opposite tendency. These results indicate that the contralesional hemisphere of patients with stroke is, as a compensatory mechanism, more involved with the organization of the affected hand movement than the ipsilesional hemisphere (López-Larraz et al., 2018; Murphy and Corbett, 2009). However, since previous EEG-based connectivity studies have focused only on the presence or absence of connections between brain regions, it is not sufficient to investigate information processing of brain network structures, for example, how strongly brain regions are connected to each other (wiring cost), how fast the brain network processes related information (integration), how brain regions processing the same information are interrelated (segregation), or how efficiently the brain network processes the information (small-worldness) (Bassett and Bullmore, 2006; de Haan et al., 2009; Rubinov and Sporns, 2010; Shim et al., 2014).
Network analysis based on the graph theory can address how brain information is processed with respect to the brain network in patients with stroke during impaired body movements (Bullmore and Sporns, 2009; Rubinov and Sporns, 2010). Some previous studies employed binary network analysis using resting-state EEG and found altered brain network properties in patients with stroke, in comparison to those of healthy controls (Caliandro et al., 2017; Saes et al., 2020; Vecchio et al., 2019a; Wang et al., 2012). However, as previous studies have focused on the resting-state condition rather than on the task condition regarding moving the affected body parts, those studies were unable to investigate the manner in which information is processed between the ipsilesional and the contralesional hemispheres during motor execution. More importantly, these studies have employed binary network analysis, for which the original functional connectivity patterns having continuous values between 0 and 1 were converted into discrete values of 0 or 1 (Vecchio et al., 2019b; Wang et al., 2012). In addition, because the conversion was performed by using an arbitrary threshold without a standard method that determines which interactions are less informative than others, significant information was lost when constructing the binary brain network (Shim et al., 2014).
In this study, to gain a better understanding of the brain network mechanism in patients with stroke, we investigated their abnormal functional brain networks during the affected hand-movement task as compared with the unaffected hand-movement task using weighted network analysis based on the graph theory. In particular, we focused on the functional characteristics of the alpha and low-beta frequency bands because these two frequency bands are mainly associated with movement-related brain activation. To this end, we defined individually optimized alpha and low-beta frequency bands based on individual alpha peak frequency (IAF) because it can describe the individualized specific neurophysiological traits better than fixed frequency bands (Klimesch, 1999; Pichiorri et al., 2015). Four weighted network indices (strength, clustering coefficient, path length, and small-worldness) were quantified in the individually defined alpha and low-beta bands. The ERD patterns modulated by movements of both hands were also investigated in the two frequency bands in terms of PSD. In addition, we computed the correlation coefficients between EEG-based functional indices (ERD patterns and networks) and the degree of motor impairments measured by the Fugl-Meyer Assessment (FMA) score.
Materials and Methods
Subjects
Patients were recruited from two rehabilitation hospitals from June to December 2019. Thirty-four patients suffering from chronic stroke were included in this study (15 males; mean age, 60.9; range, 29–80). The baseline characteristics of the patients are presented in Table 1. The inclusion criteria were: (1) 18–85 years of age; (2) a first-ever ischemic or hemorrhagic stroke confirmed with brain computed tomography (CT) or magnetic resonance imaging (MRI); (3) unilateral upper limb weakness; (4) ≥6 months poststroke; and (5) ability to provide written informed consent. Exclusion criteria were: (1) previous diseases involving the central nervous system (e.g., traumatic brain injury, brain tumor, Parkinson's disease); (2) cannot wear the EEG cap; and (3) cannot follow the instructions for clinical assessment and EEG study. All subjects received detailed information regarding the trial and provided their written consent. This study was approved by the Seoul National University Bundang Hospital Institutional Review Board (Registration No.: B-1809/493-303) and conducted in accordance with The Code of Ethics of the World Medical Association (Declaration of Helsinki).
Subject Characteristics (n = 34)
FMA, Fugl Meyer Assessment; IQR, interquartile range; SD, standard deviation.
Clinical data acquisition
For evaluating motor function in patients with stroke, the FMA score was obtained, which is a comprehensive motor impairment index consisting of five domains; the upper limb motor domain (0–66) was used (Fugl-Meyer et al., 1975). The patients' structural images (e.g., CT or MRI) were reviewed by the clinician, and the stroke location was categorized as cortical, subcortical (corona radiata, internal capsule, or basal ganglia), or cortical/subcortical.
Experimental paradigm
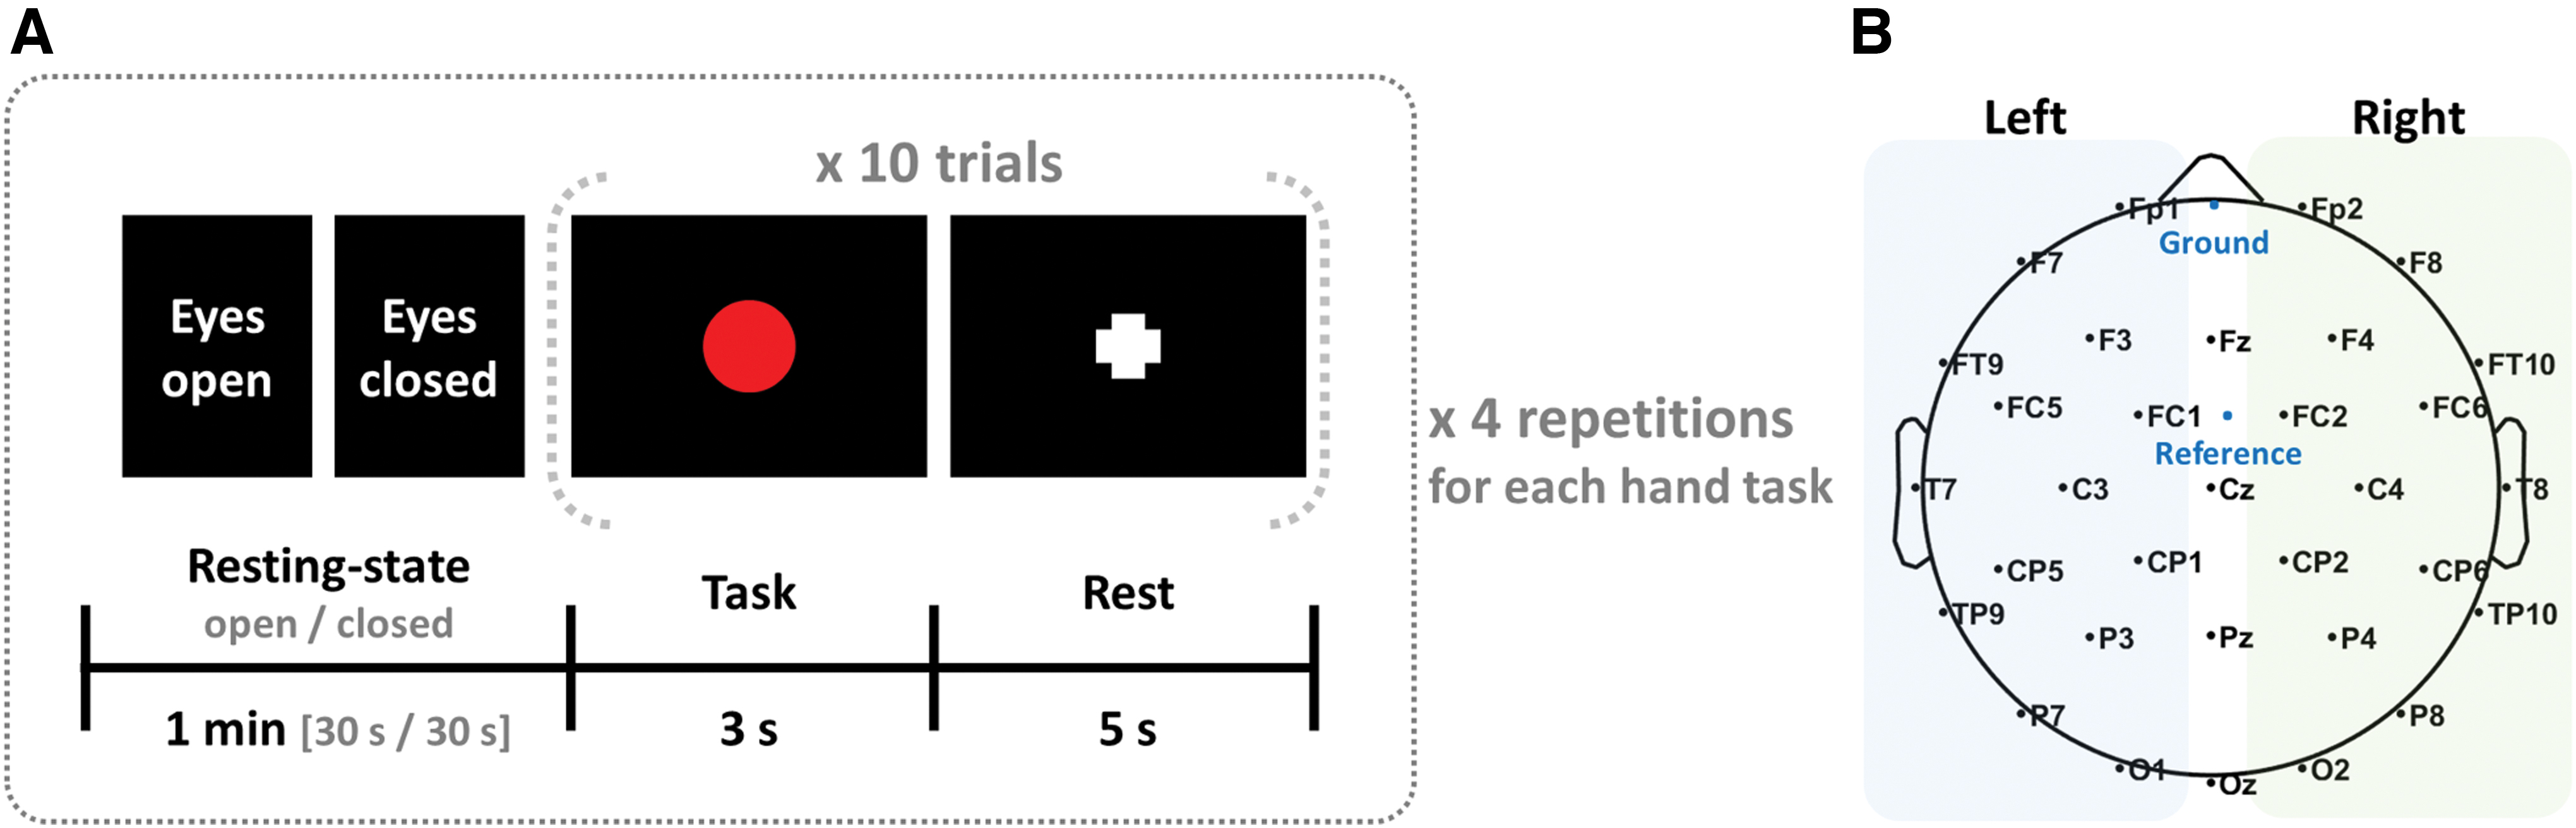
The hand-extension movement was performed repeatedly in the present study, during which movement-related EEGs were recorded. Patients sat on a comfortable armchair in front of a monitor. Before the hand movement task was performed, resting-state EEGs were recorded for periods of 1 min (eyes open—30 sec, eyes closed—30 sec). A single trial involving 3 sec of hand-extension movement, and 5 sec of relaxation subsequently, was repeated 10 times in a single session (Fig. 1A). A total of eight sessions were sequentially performed, that is, four sessions targeting the affected hand movement, followed by the other four sessions targeting the unaffected hand movement. During the hand-extension task, patients were asked to look at a fixation mark cross displayed on the screen to minimize electrooculography (EOG) artifacts.
EEG recording and preprocessing
The EEG data were recorded at a sampling rate of 1000 Hz from 32 Ag/AgCl scalp electrodes evenly mounted on the scalp according to the extended international 10–10 system (Brain Products, GmbH Ltd., Gilching, Germany) (Fig. 1B). The ground and reference electrodes were attached at Fpz and FCz (Choi et al., 2019; Kim and Lee, 2014). The location of the ground electrode is free from physiological artifacts, such as EOG, when measuring EEG because they are measured based on the reference electrode (Hu and Zhang, 2019). The location of the reference electrode (FCz) used in this study is relatively less sensitive to EOG, because it was located around the central area (Cz) of the scalp. However, EEG inherently contains EOG artifacts regardless of the reference location; eye-related artifacts were removed by using mathematical procedures based on principal component analysis (PCA) using the first PCA component of an averaged ocular movement implemented in Curry 7 (Compumedics, USA) software (Bidelman and Lee, 2015; Han et al., 2017; Wallstrom et al., 2004). The EEG data were band-pass filtered from 0.1 to 55 Hz and segmented from −1 to 3.5 sec based on the task onset to include the baseline period, which was used to correct inter- and intra-subject EEG variability when computing event-related spectral perturbation (ERSP) (Delorme and Makeig, 2004). If an epoch showed gross artifacts (±100 μV) in any of the electrodes, they were rejected from further analysis; the averages and standard deviations of the rejected epochs were only 3.69 ± 7.15 for the affected hand-movement task, and 1.62 ± 3.95 for the unaffected hand-movement task. Only artifact-free EEG data were used for PSD and functional network analyses.
Individually optimized frequency bands based on IAF
To quantify brain functional metrics, we used individually optimized frequency bands defined based on IAF for alpha and low-beta bands, respectively (Klimesch, 1999; Pichiorri et al., 2015). To this end, PSD was computed by using Fast Fourier Transform method using 30 sec of eyes closed resting-state EEG data recorded before movement tasks (Fig. 1A). The frequency showing a maximum PSD peak was detected between 7 and 12 Hz at Oz electrode, and it was used as IAF. Based on IAF, alpha and low-beta frequency bands were defined; from IAF −2 to IAF +2 Hz for alpha band and from IAF +2 to IAF +11 Hz for low-beta band. The mean alpha and low-beta frequency bands were 7.12–11.12 and 11.12–20.12 Hz, respectively.
ERSP analysis
Since alpha and low-beta frequency bands are closely associated with motor tasks (Alegre et al., 2004; Babiloni et al., 1999; Wilson et al., 2014), both alpha and low-beta ERDs were quantified by using the ERSP method for all EEG electrodes (Delorme and Makeig, 2004). Short-time Fourier transform with a Hanning window size of 250 msec was performed for each trial to compute spectral powers with time. The power spectrum of each trial was then normalized with respect to the average power of the baseline period (−1 to 0 sec) to probe for changes in the spectral power values before and after the hand-extension movement onset. The normalized power spectra were then averaged over trials, which resulted in baseline-normalized ERSP maps for each patient. Negative values of spectral powers were extracted to quantify ERDs for the two frequency bands of alpha and low-beta bands (Bartur et al., 2019; Salmelin et al., 1995). The electrodes were grouped in two regions of interest (ROIs), according to the hemisphere, to investigate the effects of brain lesion on the ERD amplitude in each of the affected and unaffected hand-movement tasks (Fig. 1B) (left hemisphere: Fp1, F3, F7, FT9, FC5, FC1, C3, T7, TP9, CP5, CP1, P3, P7, and O1; right hemisphere: Fp2, F8, F4, FC2, FC6, FT10, T8, C4, CP2, CP6, TP10, P8, P4, and O2). The midline electrodes were not used for data analysis, that is, Fz, Cz, Pz, and Oz. The representative ERD value for each hemisphere was quantified by averaging over the corresponding electrodes and times for each patient.
Functional network analysis
Functional network analysis was performed to investigate the changes in brain activity from the brain network point of view. To compute weighted whole-brain network indices based on the graph theory, a functional connectivity matrix was computed as an essential prerequisite. Among various functional connectivity indices, in this study, phase locking value (PLV) based on the Hilbert Transform was computed for the alpha and low-beta bands by using an in-house Matlab function (Lachaux et al., 1999). The PLVs were evaluated between all possible pairs of the 32 EEG electrodes at each time point during the task periods only (0–3.5 sec), and a PLV matrix was created by averaging over time. The PLVs have values from 0 to 1; a higher PLV means that the connection strength between two electrodes is stronger than the other electrode pairs and vice versa.
Four different weighted network indices were evaluated in this study based on the graph theory (Rubinov and Sporns, 2010): (1) strength, (2) clustering coefficient, (3) path length, and (4) small-worldness. A PLV matrix was identically used as a graph (G) consisting of sensor (V) and edge (E), and a PLV presents the weight (w) of an edge between two sensors. Strength represents how strongly brain regions are connected to each other (wiring cost), estimated by the sum of weights of edges connected to sensors. Strength for a specific sensor (local-level) is defined:
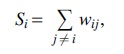
where i indicates a specific sensor and
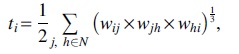
where N represents all the sensors included in G, and j and h are all possible pairs of neighbor sensors that create triangles with a specific sensor. Local-level clustering coefficient for a specific sensor is defined:
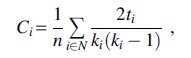
where n is the number of sensors, and ki is the number of all connected sensors for a specific sensor. In this study, n and ki were 32 and 31, respectively, because the number of sensors was 32 and we assumed that each sensor was fully connected with the other sensors. Global-level clustering coefficient (C) is quantified by averaging clustering coefficients for all sensors. Path length represents the overall connectedness of the whole network structure (integration). Path length (L) is defined:
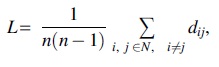
where
Small-worldness indicates how brain networks work cost-effectively when transferring information from one region to another as compared with random networks (Bassett and Bullmore, 2006). To evaluate small-worldness, both clustering coefficient and path length were normalized by each index evaluated using a randomly rewired null functional connectivity matrix, and then small-worldness was evaluated by computing a ratio of the normalized clustering coefficient (gamma) to the normalized path length (lambda) for each subject (
Statistical analysis
Statistical approaches were applied to the ERD and network analysis indices. A two-way repeated-measures analysis of variances (rmANOVA) was performed to evaluate ERD differences with within-subject factors of the task (affected and unaffected hand-movement tasks) and the hemisphere (ipsilesional and contralesional hemispheres). For any significant effect, a post hoc paired t-test analysis was performed with an adjusted two-side p-value by using the false discovery rate (FDR) method. Another two-way rmANOVA was performed to investigate the differences in the hemispheric-level network indices with within-subject factors of the task (affected and unaffected hand-movement tasks) and the hemisphere (ipsilesional and contralesional hemispheres), and then the post hoc paired t-test analysis was performed with an adjusted two-side p-value by using the FDR correction. Further, the relationships between EEG-based functional indices (ERD and network indices) and FMA scores were evaluated. To this end, four different types of EEG-based functional indices were used: (1) the whole brain (both hemispheres); (2) the ipsilesional hemisphere only; (3) the contralesional hemisphere only; and (4) the ratio between ipsilesional and contralesional hemispheres. Since the EEG-based functional indices did not show homoscedasticity, Spearman's rank correlation coefficients were evaluated with 5000 bootstrap resamples (Spearman, 1987). SPSS version 21.0 (IBM Corp., Armonk, NY, USA) and Matlab were used for statistical analyses.
Results
ERD patterns
A significant interaction was observed between the task and hemisphere in terms of the ERD (F = 6.396, p = 0.016), especially in the low-beta frequency band. Significant ERD differences between the hemispheres were revealed during the hand movement. The topographic low-beta ERD maps of each hand-movement task are described in (Fig. 2). A significantly stronger low-beta ERD was observed in the contralesional hemisphere, in comparison with that of the ipsilesional hemisphere for both the affected (−1.619 ± 0.744 vs. −1.480 ± 0.591, FDR adjusted p = 0.046) and unaffected hand-movement task (−1.374 ± 0.513 vs. −1.249 ± 0.434, FDR adjusted p = 0.045).
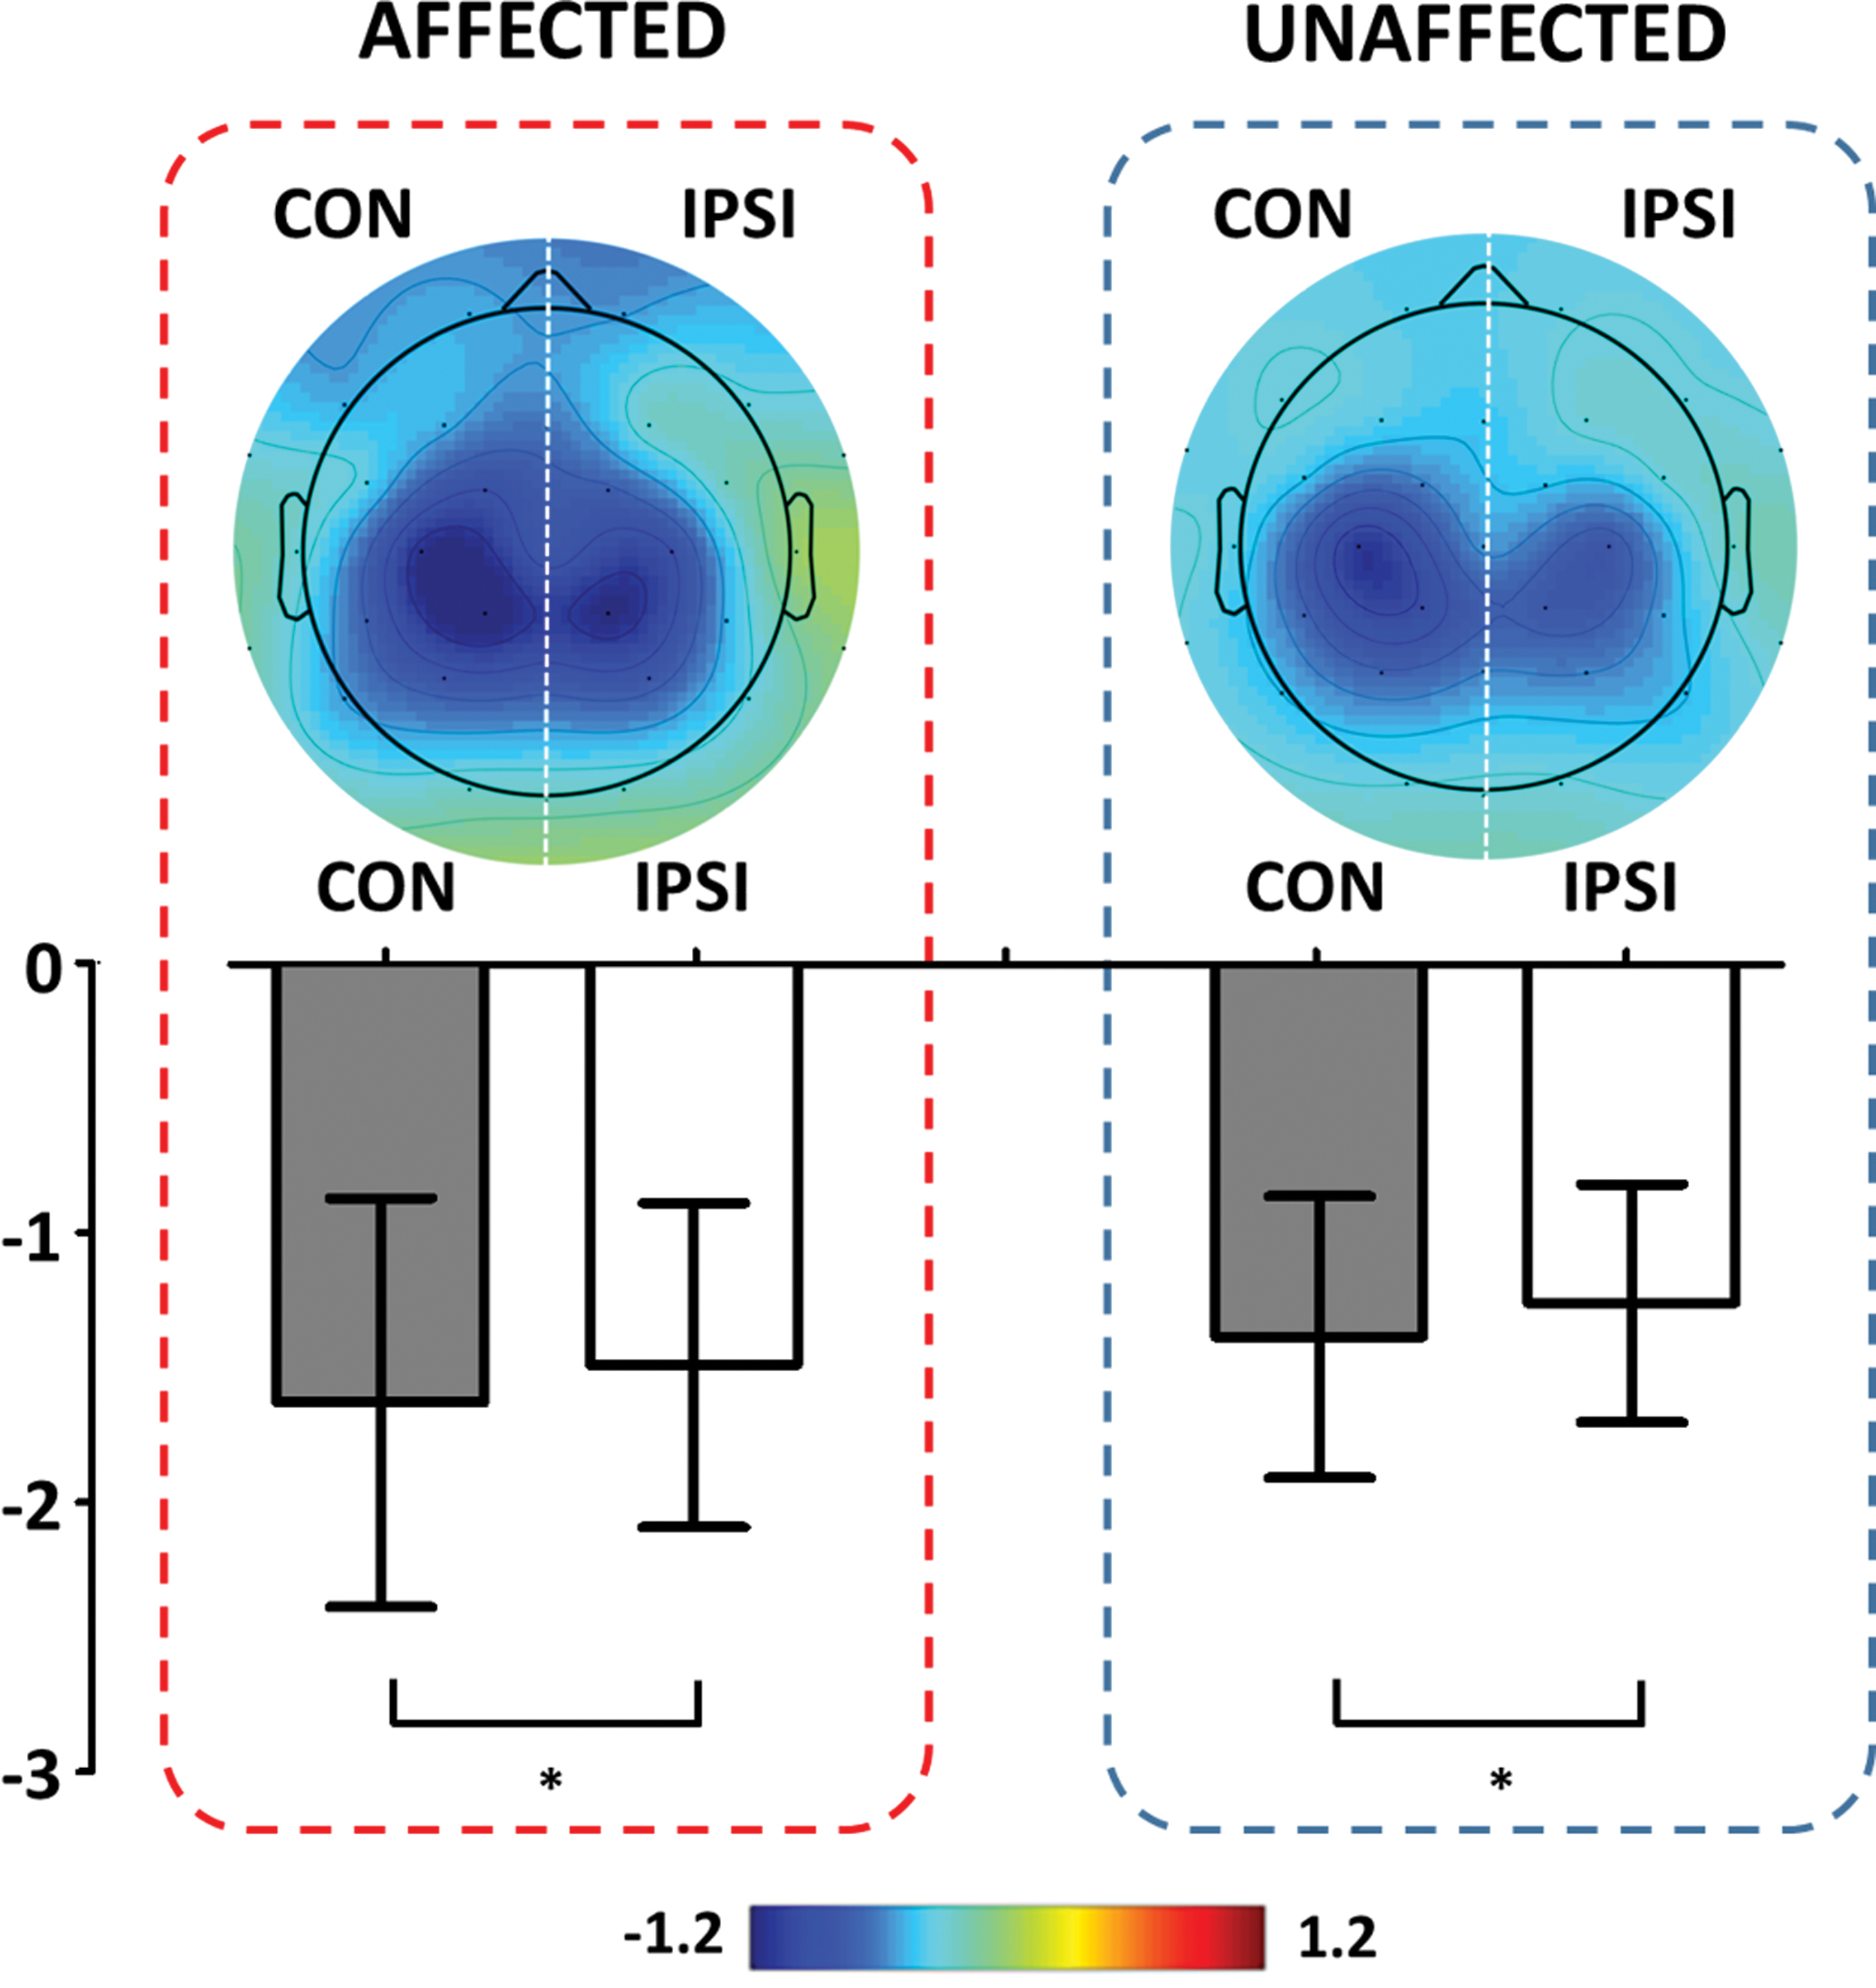
Mean topographic maps and quantified low-beta ERD over all patients when performing the affected and the unaffected hand-movement tasks, respectively. The integrated topographic maps are obtained by inverting the ERD maps of the right hemiplegia group. A darker blue color represents a stronger ERD, meaning that the corresponding brain areas were more activated than other areas. The CON means the intact contralesional hemisphere, and IPSI indicates the damaged ipsilesional hemisphere. *p < 0.05. ERD, event-related desynchronization. Color images are available online.
Global-level network characteristics
Significantly altered whole-brain network indices were found in the low-beta frequency band during the affected hand-movement task, as compared with those found during the unaffected hand-movement task. Both strength and clustering coefficient were significantly reduced during the affected hand-movement task, as compared with those during the unaffected hand-movement task, whereas a significantly enhanced path length was found during the affected hand-movement task. However, there was no significant difference in small-worldness between the two tasks (Table 2).
Mean and Standard Deviation Values of Whole-Brain Network Indices of Strength, Clustering Coefficient, Path Length, and Small-Worldness in the Low-Beta Frequency Band
Strength represents “how strongly brain regions are connected to each other,” the clustering coefficient indicates “how well one brain region is clustered with neighbor regions,” path length represents “the overall connectedness of the whole network structure,” and small-worldness indicates “how efficiently the brain network processes the information.”
p < 0.05.
Hemispheric-level network characteristics
Significant effects of network indices were found between the task and hemisphere in both alpha and low-beta frequency bands (F-statistics, p < 0.001 for all comparisons). During both affected and unaffected hand-movement tasks, the contralesional brain network was more effective than the ipsilesional brain network for the three network indices (strength, clustering coefficient, and path length) in both alpha and low-beta frequency bands (Fig. 3). Both strength and clustering coefficient were significantly increased in the contralesional hemisphere as compared with those of the ipsilesional hemisphere, whereas path length was significantly diminished for the contralesional hemisphere. For small-worldness, a significant difference was observed during only the affected hand-movement task in both alpha and low-beta frequency bands; small-worldness was significantly increased in the contralesional hemisphere as compared with that of the ipsilesional hemisphere.

Comparison of the four network indices (strength, clustering coefficient, path length, and small-worldness) between the intact contralesional hemisphere (CON) and the damaged ipsilesional hemisphere (IPSI) during the affected and unaffected hand-movement tasks, respectively.
Relationships with FMA score
The significant correlation results were revealed when applying ipsilesional functional brain network indices. Alpha ipsilesional brain network indices estimated during the affected hand-movement task were significantly correlated with the FMA scores. The ipsilesional brain network indices of strength (rho = 0.340, p = 0.049), clustering coefficient (rho = 0.342, p = 0.048), and small-worldness (rho = 0.444, p = 0.008) have positive correlation with the FMA scores, whereas path length (rho = −0.350, p = 0.042) has negative correlation with FMA scores, as shown in Fig. 4A.
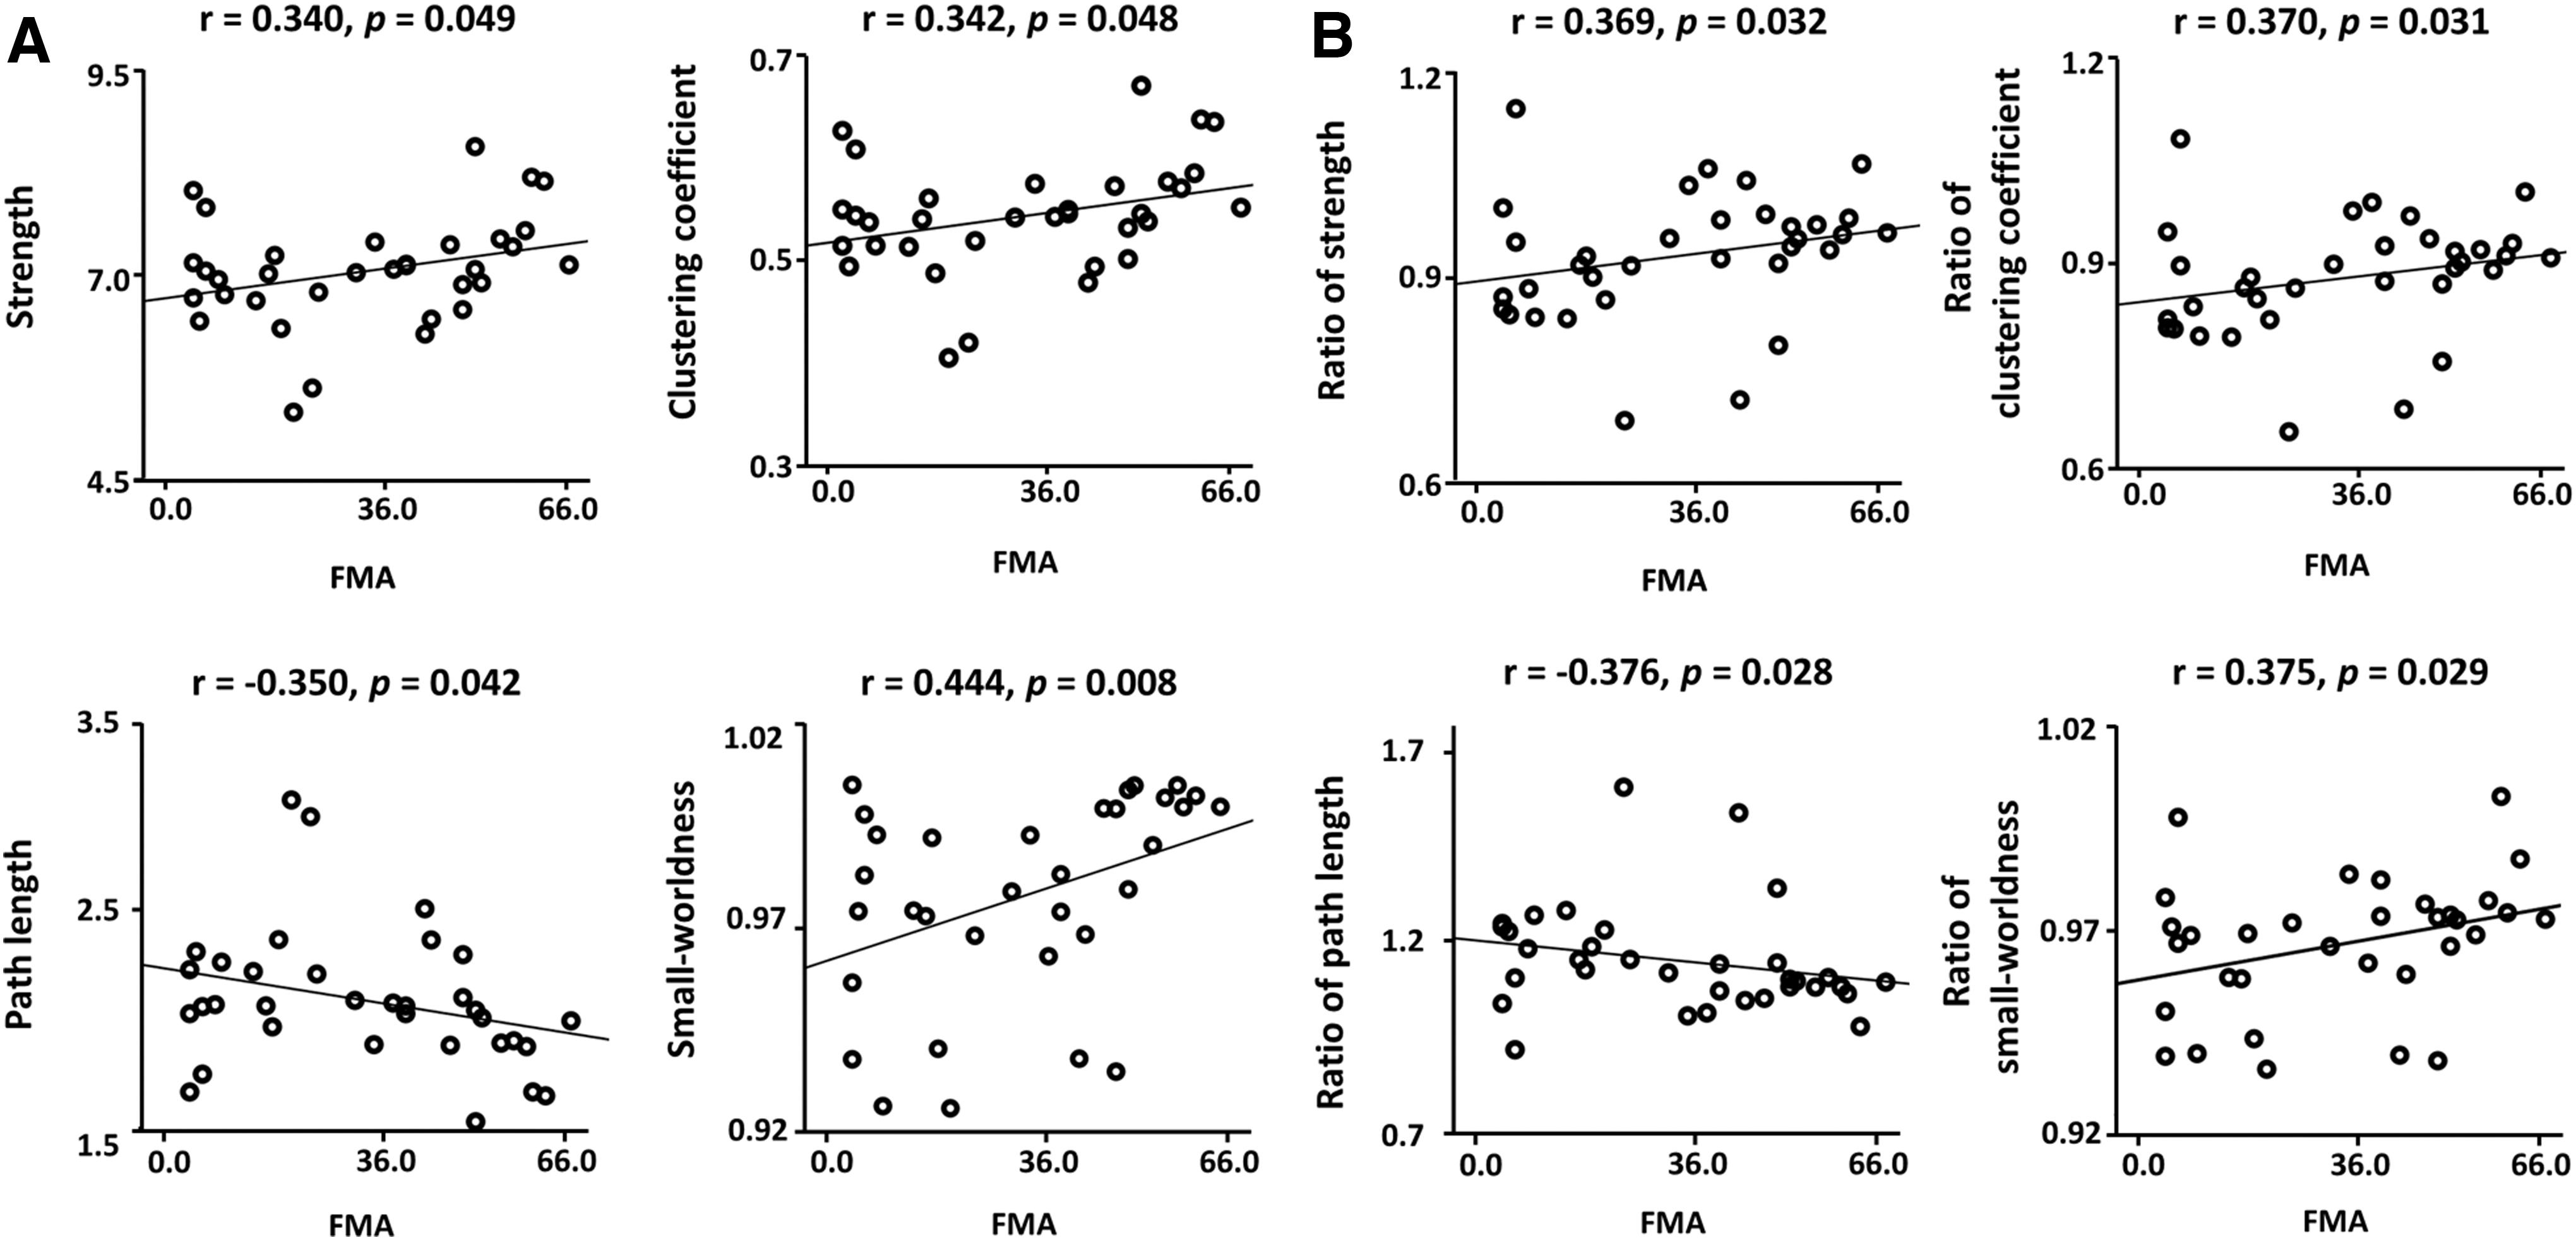
Correlations between the functional network indices (strength, clustering coefficient, path length, and small-worldness) and FMA scores in both the alpha and low-beta frequency bands.
Moreover, the significant correlations were observed when using the ratio of alpha brain network indices between ipsilesional and contralesional hemispheres. The ratio of strength (rho = 0.369, p = 0.032), clustering coefficient (rho = 0.370, p = 0.031), and small-worldness (rho = 0.375, p = 0.029) have positive correlation with the FMA scores, and the ratio of path length (rho = −0.376, p = 0.028) has negative correlation with the FMA scores, as shown in Fig. 4B.
In addition, the marginally significant correlations were revealed in the low-beta frequency band between ipsilesional network indices estimated during the affected hand-movement task and FMA scores. The ipsilesional brain network indices of strength (rho = 0.328, p = 0.058) and clustering coefficient (rho = 0.338, p = 0.051) have positive correlation with the FMA scores, whereas path length (rho = −0.340, p = 0.049) has negative correlation with FMA scores.
Discussion
In the present study, we investigated disrupted functional network characteristics of patients with stroke in individually optimized alpha and low-beta frequency bands defined based on IAF when performing the affected hand-movement task as compared with when performing the unaffected hand-movement task by using weighted network analysis based on the graph theory. The main findings are as follows: (1) when performing both the affected hand-movement task and the unaffected hand-movement task, a stronger low-beta ERD was found in the contralesional hemisphere compared with that in the ipsilesional hemisphere; (2) significantly disrupted whole-brain network indices (reduced strength and clustering coefficient, and prolonged path length) in the low-beta frequency band were found when performing the affected hand-movement task compared with the unaffected hand-movement task; (3) during both the affected and unaffected hand-movement tasks, inefficient ipsilesional brain networks were observed in both alpha and low-beta frequency bands as compared with those in the contralesional brain networks; and (4) significant relationships between the FMA scores and brain network indices of the alpha frequency band were revealed (strength, clustering coefficient, path length, and small-worldness for both ipsilesional hemisphere only and the ratio between ipsilesional and contralesional hemispheres).
Neural oscillation during affected and unaffected hand movement
It is well documented that EEGs in both the alpha and low-beta frequency bands are related to the sensorimotor functions (Alegre et al., 2004; Babiloni et al., 1999; Wilson et al., 2014). In case of healthy people, alpha and low-beta ERDs are strongly activated on both hemispheres when performing movement-related tasks, as compared with a resting state (Alegre et al., 2004; Babiloni et al., 1999; Wilson et al., 2014). However, for patients with stroke, weaker alpha and low-beta ERDs are found over whole motor areas when moving their affected body parts (e.g., hands, arms, and legs), compared with healthy controls (Gerloff et al., 2006; Stępień et al., 2011). In particular, patients with stroke showed weaker alpha and low-beta ERDs in the ipsilesional hemisphere than in the conatralesional hemisphere when moving affected body parts.
Similar to the results of previous studies, the patients with stroke in this study also showed weaker low-beta ERDs in the ipsilesional hemisphere, rather than in the contralesional hemisphere, when performing both the affected and unaffected hand-movement tasks. In particular, when performing the affected hand-movement task, relatively stronger low-beta ERDs were found in the intact contralesional hemisphere as a neuronal compensatory response, instead of appearing at the damaged ipsilesional (contralateral) hemisphere (López-Larraz et al., 2018; Murphy and Corbett, 2009). However, there was no significant difference of alpha ERD between the two tasks, unlike previous studies. A previous study with healthy controls reported that the low-beta frequency band was more modulated than the alpha frequency band in terms of the spectral power when performing movement-related tasks (Özdenizci et al., 2017), which might be the reason why alpha ERD was not significantly different between both hemispheres during the affected and unaffected hand-movement tasks. However, to the best of our knowledge, it has been unable to clarify the mechanism behind the response in the alpha and low-beta frequency bands, which should be further investigated in a further study to comprehend the underlying mechanisms of brain activity in patients with stroke.
Global-level network characteristics
The weighted brain network approach can provide more specific information without loss of information in comparison with the binary brain network approach (Rubinov and Sporns, 2011; Shim et al., 2014). Indeed, a previous study investigated the altered brain networks in a stroke patient by using the binary network approach, simply reporting the different number of connections between the preparation and the execution of finger movement (De Vico Fallani et al., 2009). However, as the previous study used a binary network approach that transforms original network values into two categories (on or off), a precise investigation on brain network was limited due to original data loss during the binary conversion. Further, the results would not be generalized to patients with stroke due to the small sample size (n = 8) (De Vico Fallani et al., 2009). The present study was able to quantitatively probe how inefficiently brain networks work in patients with stroke when moving the impaired body based on the weighted network approach by using a relatively sufficient sample size than the previous one. Strength is a suitable index to reflect the intensity of connections in brain networks, because it is quantified via summation of all functional connectivity values over the whole brain based on the graph theory (Liu et al., 2017). We found a lower strength value in patients with stroke when performing the affected hand-movement task than when performing the unaffected hand-movement task, thus indicating that general connections between brain regions were weakened when moving the impaired hand, as compared with the intact hand. In addition, we found inefficient brain networks in terms of clustering coefficient and path length when moving the affected hand, as compared with the unaffected hand. The reduced clustering coefficient during the affected hand movement indicates that the specific brain regions do not interconnect each other when processing the information (Achard et al., 2006; Bassett and Bullmore, 2006), implying the functional brain network segregation. The enhanced path length represents that the process speed is slowed by redundant connections (Achard et al., 2006; Bassett and Bullmore, 2006), reflecting the functional brain network integration. Overall, the patients with stroke showed inefficient functional brain network structure from both perspectives of segregation and integration in the low-beta frequency band when moving their impaired hand as compared with their intact hand. Interestingly, a previous resting-state EEG-based study has tried to investigate the characteristics of segregation and integration in the brain network of patients with stroke, but it failed to find the difference of resting-state network between patients with stroke and healthy controls (Wang et al., 2012). This result implies that the distinct brain networks in patients with stroke could be clearly investigated by EEGs recorded when moving impaired body parts rather than resting state. Thus, it is worth emphasizing that our results would be clues to improve an understanding of neuropathophysiology in patients with stroke.
Hemispheric-level network characteristics
The hemispherical results are noteworthy, because this is the first study, to our best knowledge, to investigate the different networks between the damaged and undamaged hemispheres and correlation with the FMA scores. The undamaged contralesional hemisphere can more efficiently interact (enhanced strength, clustering coefficient, and small-worldness and reduced path length) in both the alpha and low-beta frequency bands than the damaged ipsilesional hemisphere when performing the affected hand-movement task. These results indicate that the intact contralesional hemisphere would be more functionally and cost-effectively interconnected on its interior to overcome the problems in the damaged ipsilesional hemisphere as neuronal compensatory responses during motor execution of the hemiparetic side (López-Larraz et al., 2018; Murphy and Corbett, 2009). Noticeably, distinct small-world properties were revealed only by hemispheric-based network analysis compared with the whole brain-based network, meaning that the hemispheric-based network analysis should be employed for the more in-depth understanding of the cost-effective neuronal compensatory mechanism in patients with stroke.
Moreover, the significant correlations were revealed between the disrupted alpha network indices (strength, clustering coefficient, path length, and small-worldness for both ipsilesional hemisphere only and the ratio between ipsilesional and contralesional hemispheres) and FMA scores during the affected hand movement. These results indicate that the more severe impairments patients with stroke have, the more disrupted brain network architectures of the damaged ipsilesional hemisphere they have. Based on the correlation results, it would be a reasonable inference that the ratio of two hemispheres of alpha functional network indices could be a potential biomarker to predict stoke states and treatment outcomes.
Further, interestingly, distinct alpha characteristics during movement of the affected hand were revealed via network analysis, unlike in the case of the ERD results. From the result, it can be thought that the simple ERD method might not accurately capture alpha characteristics even though the alpha frequency band is closely associated with movement tasks along with the low-beta frequency band (Alegre et al., 2004; Babiloni et al., 1999; Wilson et al., 2014). Particularly, the relationships between neural characteristics and symptoms of patients with stroke were revealed via only network analysis. That is, our results suggest that brain networks and PSD should be simultaneously investigated to improve the understanding of neurophysiological characteristics of patients with stroke.
Local-level network characteristics and limitation
In the present study, we also investigated local-level network characteristics involved in movement-related functional activities in terms of nodal strength and nodal clustering coefficient, but significant results were not discovered at all. The results seem to have originated from using scalp-level functional metrics based on relatively low spatial resolution, instead of using cortical-level metrics due to both lack of the number of EEG electrodes (n = 32 in this study) and the absence of individual MRI. It should be noted that we could not assume specific brain regions related to task-specific brain activity in terms of both PSD and brain networks, and thus we approximately estimated brain regions by using the location of the EEG electrodes. It is thought that scalp-level functional indices could not sufficiently capture the neurophysiological traits of patients with stroke during movements in terms of specific regional view due to low spatial resolution, leading to statistically insignificant results. Therefore, to more precisely investigate the local-level functional characteristics of patients with stroke, additional investigation is required based on cortical-level network indices via source imaging, which would be an interesting future research topic. Moreover, cortical-level network indices might increase the possibility of using brain network indices as neurophysiological markers to monitor recovery level after rehabilitation in patients with stroke (Amico and Gnoi, 2018; Shen et al., 2017). Even though we obtained significant correlation results between scalp-level network indices and FMA scores (e.g., small-worldness, rho = 0.444, p = 0.008), they do not guarantee high performances of predicting FMA scores by using scalp-level network indices. If cortical-level information was accessible, high predictive performance might be obtained as compared with using only scalp-level network indices (Shim et al., 2014). Therefore, a further study is required to develop a clinically reliable biomarker, thereby predicting recovery level after rehabilitation in advance by using spatially high-resolution cortical-level information based on an enough number of EEG electrodes (e.g., >64) and individual MRI. Another limitation was that neural characteristics related with the dominant hand were not investigated, because the dominant hand of the patients was not registered for the present study.
Potential use of brain network characteristics for different stroke phases
In this study, we explored brain functional metrics of ERSP and network indices for patients with chronic stroke, and we showed the potential possibility of using brain network indices as a useful biomarker to monitor recovery or symptom level. Some previous studies investigated the altered brain network indices of patients with stroke in the acute phase compared with healthy controls using resting-state EEG, and they argued that distinct network traits could be used as a biomarker for predicting patients' recovery level after stroke (Caliandro et al., 2017; Vecchio et al., 2019a, 2019b). It is expected that our results obtained by using task-specific EEG would be also potentially used to investigate the distinct functional characteristics of patients with stroke at different phases, such as acute and subacute phases, along with the previous studies based on resting-state EEG. Moreover, simultaneous use of both resting-state and task-specific EEG might provide more in-depth insights into brain functional networks for patients with stroke at different phases because complementary functional brain information extracted from resting-state and task-specific EEGs might create combinatory synergy to investigate brain functional networks of patients with stroke.
Conclusion
In this study, altered functional brain characteristics of patients with stroke were revealed when the patients performed the affected hand-movement task, compared with those revealed when the patients performed the unaffected hand-movement task, via weighted network analysis based on the graph theory. Reduced ERD and disrupted global-level network indices (reduced strength and clustering coefficient, and enhanced path length) were found in the low-beta frequency band during movement of the affected hand as compared with those found during movement of the unaffected hand. In addition, the undamaged contralesional hemisphere showed a more efficient and cost-effective network architecture in both the alpha and low-beta frequency bands compared with that of the damaged ipsilesional hemisphere, and alpha brain network indices showed significant correlation with the FMA scores, which reflects that the altered network indices measured by EEG can be useful brain biomarkers for motor impairments after stroke. Functional brain metrics can be used as biological recovery markers after stroke. To evaluate the potential of these EEG-based indices as biomarkers of recovery, a longitudinal study at both scalp- and source level should be conducted by using EEG data recorded after the recovery of the symptoms as a further study.
Footnotes
Authors' Contributions
M.S., H.-J.H., and W.-S.K. contributed to the research project conception and the design of the study. N.-J.P., C.L., and W.-S.K. contributed to the acquisition of the data. M.S., G.-Y.C., and H.-J.H. contributed to the analysis of the data and M.S., G.-Y.C., H.-J.H., and W.-S.K. contributed to the interpretation of the data. All authors contributed to the writing and editing of the article.
Author Disclosure Statement
No competing financial interests exist.
Funding Information
This work was supported by the Institute for Information & Communications Technology Planning & Evaluation (IITP) grant funded by the Korea government (No. 2017-0-00451; Development of BCI-based Brain and Cognitive Computing Technology for Recognizing User's Intentions using Deep learning), by the Basic Research Program through the National Research Foundation of Korea (NRF) funded by the MSIT (NRF-2020R1A4A1017775 and NRF-2019R1I1A3A01060732), and by the Seoul National University Bundang Hospital Research Fund (02-2017-024).