
Abstract
Introduction:
Despite the fact that brain rhythms are widely studied and officially classified, there is no consensus on their relationship, which can shed light on the genesis of rhythmic activity, its synchronization, functional role, and the formation of pathological reactions. Using the experimental status epilepticus (SE) as a model of brain in a hypersynchronized state with well-defined rhythms, we aimed to study the relationship between the rhythmic components of the brain electrical activity.
Materials and Methods:
Local field potentials (LFPs) were recorded simultaneously from the hippocampus, entorhinal cortex, medial septum, and amygdala during normal conditions and after kainic acid (KA) administration in waking guinea pigs. The dynamical spectral LFP properties were analyzed with the aid of Fast Fourier transform.
Results:
KA induces prominent SE with periodic combination of epileptiform discharge complexes and relatively quiet interdischarge intervals in the electrical activity of the brain. We have shown that new components appeared in the LFP spectra during the development of SE, representing a sequential doubling of the frequency, which had initially been dominating in the background records.
Discussion:
The phenomenon of frequency doubling can be interpreted as the octave principle of the LFP spectrum rhythmic carcass structure. The spectra of discharge complexes represent an alternation of harmonic spectra, where fundamental frequency coincides with one of the doubled frequencies dominating in the interdischarge activity. Using a nonlinear recurrent operation of rhythm multiplication and the obtained data we propose an operational model of the generation of rhythms and pathological discharges in the brain based on the octave principle.
Impact statement
In this study, we examined the relationship between the rhythmic components of the electrical activity of the limbic structures during the experimental status epilepticus and propose an operational model of brain rhythms generation based on the octave principle. Our study demonstrates that using fundamental principles (nonlinearity and the presence of recurrence), it is possible to explain the genesis and phenomenology of the electrical activity of brain structures in normal and pathological conditions.
Introduction
Rhythmic electrical activity of the mammalian forebrain is characterized by great diversity. This activity is seen across a very broad range of frequencies, from ∼0.05 to 500 Hz, but it does not constitute a continuum (Buzsáki and Watson, 2012). A number of discrete levels on the low-frequency part of the spectrum allowed for their classification. International Federation of Societies for Electroencephalography and Clinical Neurophysiology has adopted the following rhythm divisions: delta (0.5–4 Hz), theta (4–8 Hz), alpha (8–12 Hz), beta1 (12–18 Hz), beta2 (18–30 Hz), and gamma (30–90 Hz) (Buzsáki and Watson, 2012; Buzsáki, 2006; Steriade et al., 1990). In addition, high-frequency oscillations (HFOs; 80–500 Hz) were described in normal and pathological neuronal processes (Chrobak and Buzsáki, 1996; Jiruska and Bragin, 2011; Li et al., 2018).
There were few, and at the same time conflicting, attempts to find a system (a law) in the relationship of the brain rhythms. Three mutually exclusive hypotheses could be singled out. An insightful extrapolation from many observations of brain rhythms suggests that there are finite, discrete frequency bands arranged according to the natural log (“e”) of central frequency (Buzsáki and Draguhn, 2004). In another work (Klimesch, 2012, 2013) addressing the numerical relationship between delta, theta, alpha, beta and gamma rhythms, it is argued that the central frequency of each of them is two times higher than the previous one. This dependence is an exponential function with base 2. The third hypothesis also assumes of an exponential dependence between rhythms (Roopun et al., 2008), but with the base of 1.6. With such a base, all observed bands may be interrelated through concatenation. Gamma and beta2 rhythms concatenate to form a beta1 rhythm, but beta2 and beta1 rhythms may concatenate to form an alpha rhythm and alpha and beta1 rhythms concatenate to form a theta rhythm, and so on (Roopun et al., 2008).
The only difference between these hypotheses is the base of the power function; however, it can be fundamental, because it requires different implementation mechanisms. Without reviewing the works mentioned previously, we would only like to note the main possible causes of these contradictions. First, a statistical approach for detection of local maximums of frequency ranges leads to possible errors in determining the exact rhythm modes. Second, simultaneous identification of local maximums of all frequency ranges in the same spectrum of electrical activity of the brain is difficult owing to the dominance of certain rhythms depending on the functional state.
For accurate detection of the rhythm modes, it is necessary to create conditions under which most brain rhythms with well-defined local maximums would be present in the same spectrum of electrical activity. In this work, such conditions are represented by experimental epileptiform activity at the early stages of epileptogenesis that has not yet led to neurodegenerative changes. It has been shown that neuronal injury in the cortex, hippocampus, endopiriform nucleus, amygdaloid complex, and hypothalamus was observed only at 2.5 h after the pilocarpine-induced status epilepticus (SE) (Covolan and Mello, 2000; Covolan et al., 2000). Before this time, disturbances in the nervous system can be considered as functional (Morimoto et al., 2004). The brain of an experimental animal in this state is hyperexcited and hypersynchronized. The interdischarge rhythms as a result of synchronization are well expressed and are not masked by background activity, making it possible to study their relationships.
In this study, we examined the relationship between the rhythmic components of the electrical activity of the limbic structures in guinea pigs during the development of kainic acid (KA)-induced SE. Such investigation of the relationship between brain rhythms is of great importance for understanding the genesis of rhythmic activity, its synchronization, functional role, and the formation of pathological reactions.
Materials and Methods
Animals and surgery
Experiments were performed in adult guinea pigs (440–620 g, N = 7) obtained from the Experimental Animal Centre of the Institute of Theoretical and Experimental Biophysics (Pushchino, Russia). Animals were housed in pairs with food and water ad libitum. All animal experimentations were approved by the Institutional Bioethics Committee of the Institute of Theoretical and Experimental Biophysics of the Russian Academy of Sciences following guidelines that are in accordance with the Directive (2010/63/EU) of the European Parliament and of the Council.
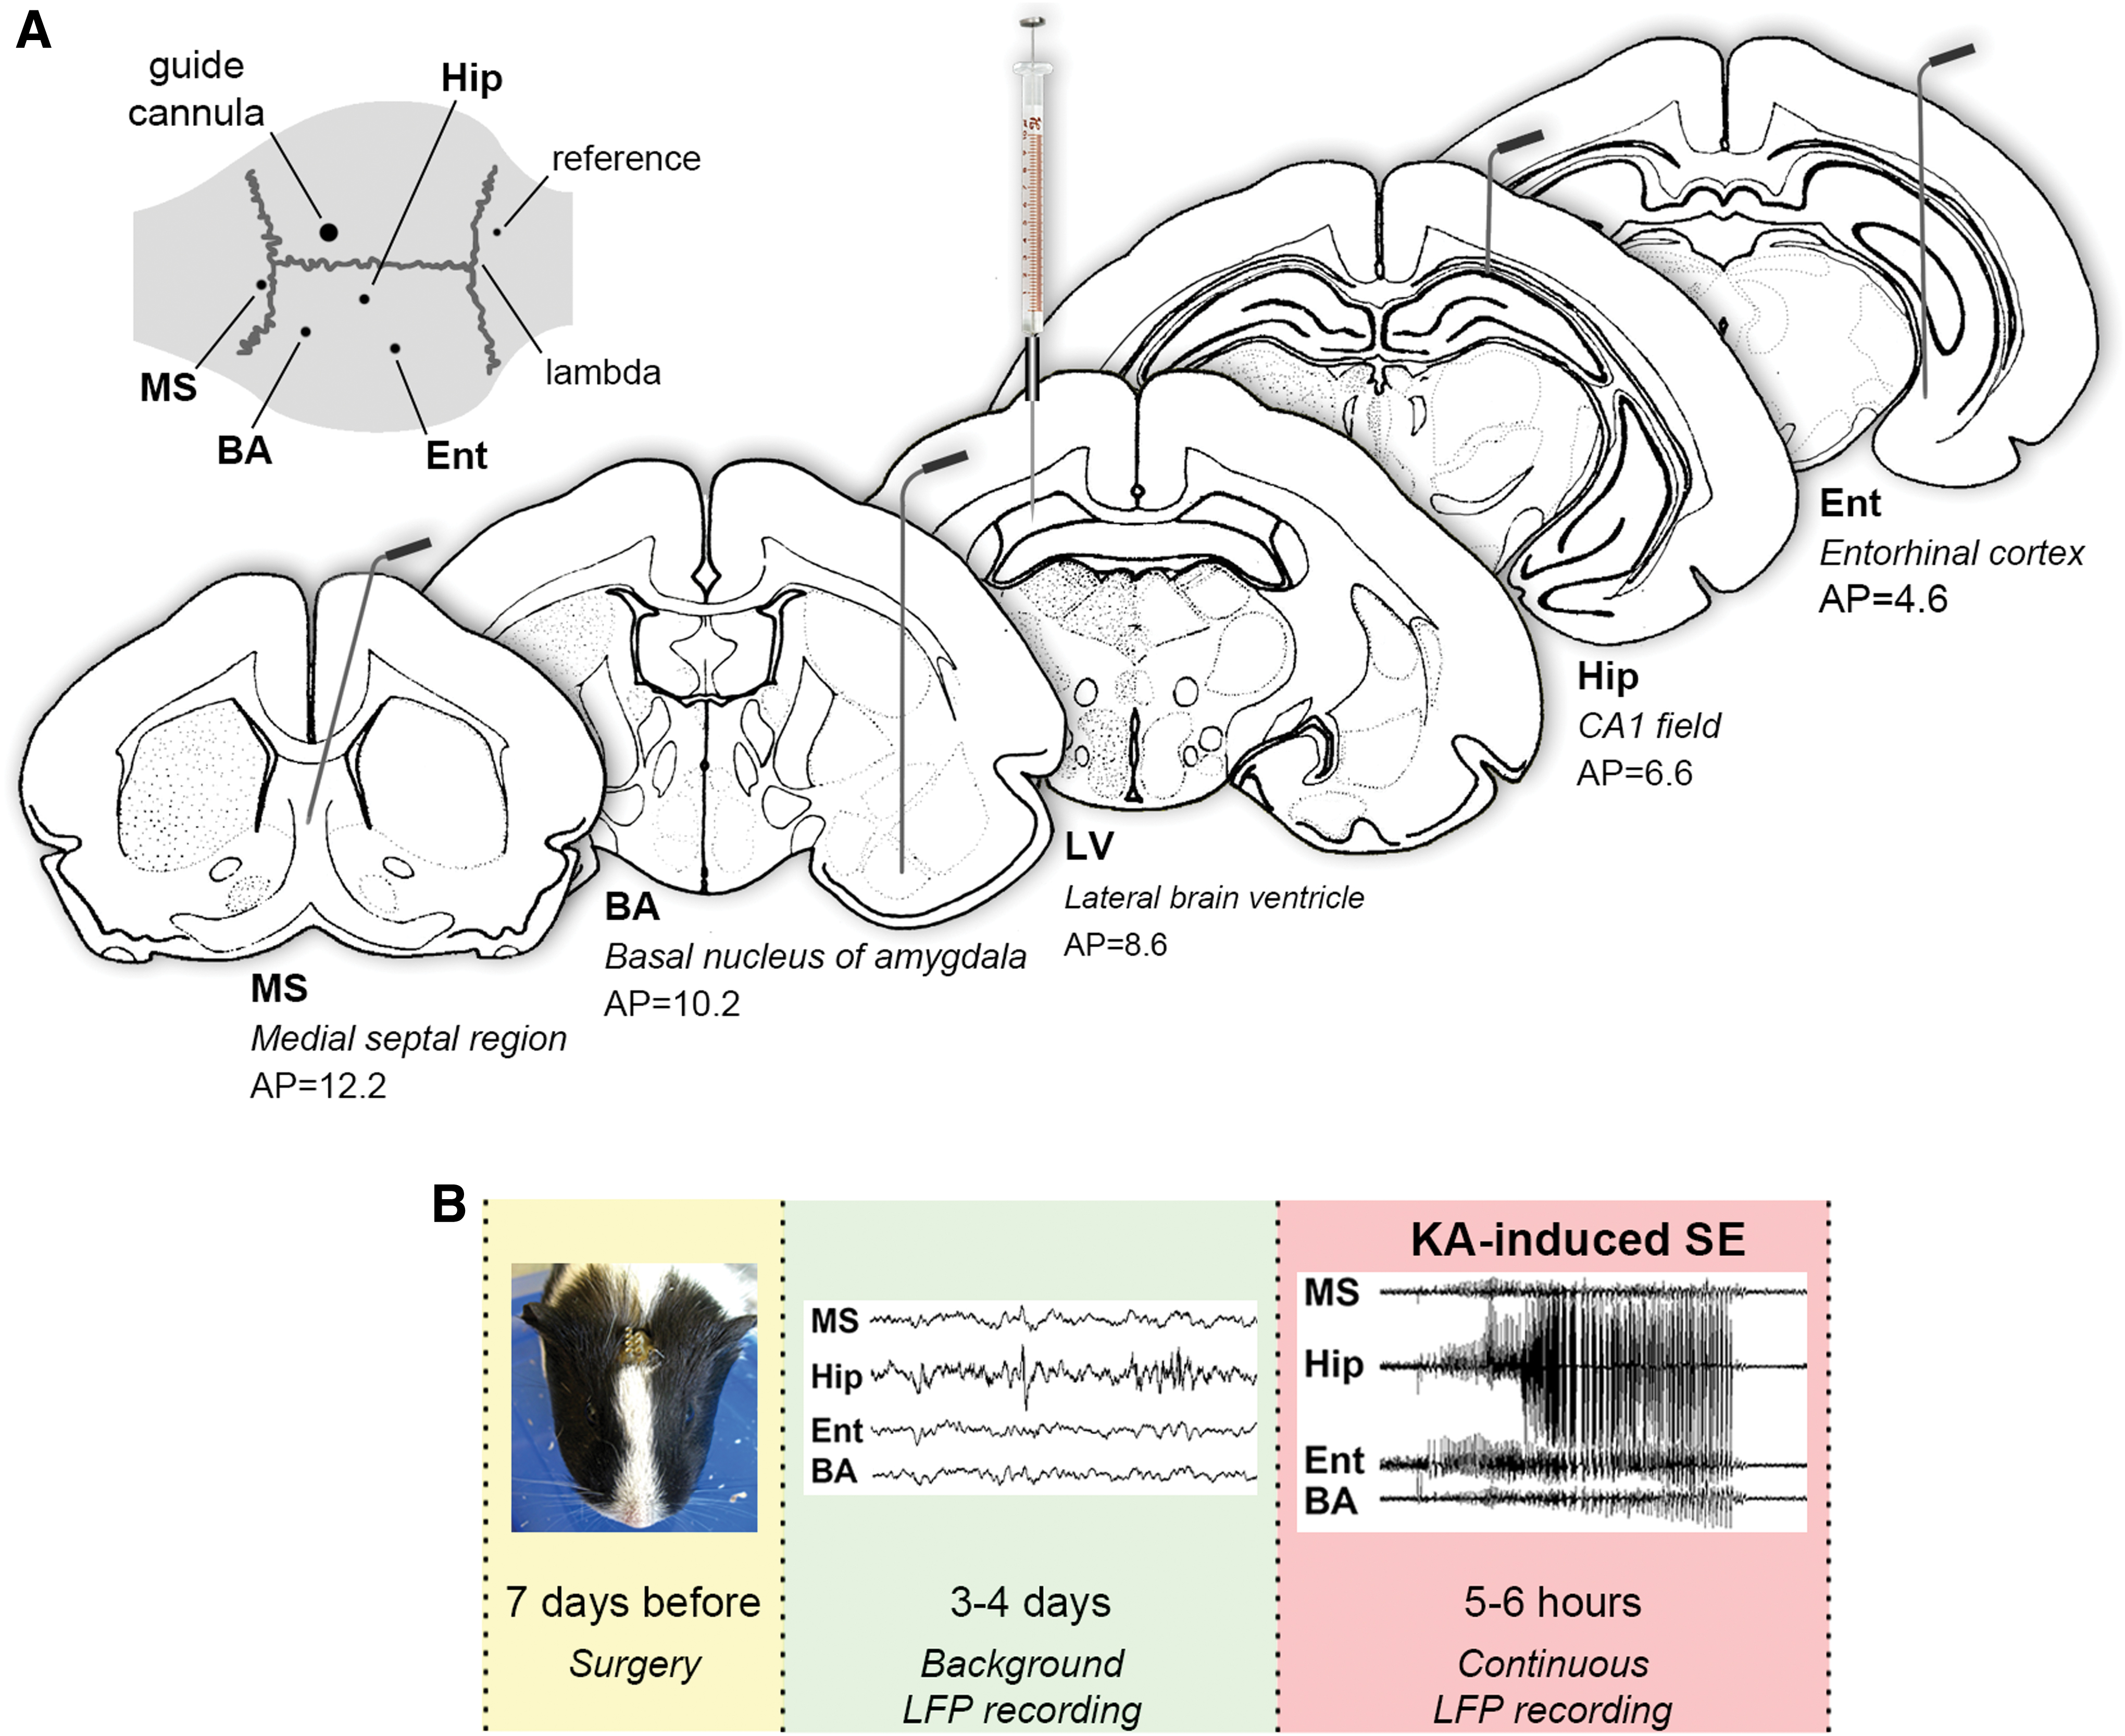
One week before the experiments, animals were exposed to a neurosurgical operation under general anesthesia (18 mg/kg Zoletil +12 mg/kg xylazine, i.m.). Depth recording electrodes (insulated nichrome, 0.1 mm diameter) were implanted unilaterally into the medial septum (MS; AP = 12.2, ML = 2, DV = 7.5, angle 15°), CA1 field of the hippocampus (AP = 6.6, ML = 3, DV = 5), entorhinal cortex (AP = 4.6, ML = 5.5, DV = 10.5), and basal nucleus of the amygdala (BA, AP = 10.2, ML = 5, DV = 12.2) according to Rapisarda and Bacchelli (1977). A reference screw electrode was placed into the bone above the cerebellum. A guide cannula for microinjections was implanted above the right lateral brain ventricle contralaterally to the recording electrodes (AP = 8.6, ML = 2.5, DV = 1.7) (Fig. 1A). The entire assembly was fixed to the skull with dental acrylic resin.
Experimental design.
Local field potential recordings
Local field potentials (LFPs) were recorded in waking guinea pigs during the daytime between 10 a.m. and 6 p.m. Animals were placed into the recording chamber 5 min before each session. Signals were preamplified (LMC7101; National Semiconductor, USA), amplified (Grass Instruments, Model 12 Neurodata Acquisition System, USA), and filtered on-line (low pass at 300 Hz, high pass at 0.1 Hz, with 50 Hz notch filter). Data were digitized (sampling rate 1000 Hz; PCI-DAS 1200JR, USA) and recorded using Datapac 2k2 software (Run Technologies, USA) for off-line analysis. Four channels were recorded simultaneously.
Status epilepticus
The studies were conducted applying the KA-induced SE. To induce the onset of SE, waking guinea pigs were injected with KA (0.4 μg, 0.6 mg/mL; Sigma Aldrich) intracerebroventricularly (i.c.v.). Then animals were continuously monitored for 5–6 h following the KA injection. During the electrical recording, behavior of the animals was controlled visually and monitored with a video system. To identify KA-induced SE, the modified Racine Scale (Racine, 1972) adapted for guinea pigs (Shubina et al., 2015) was used. Stages 4–5 (tonic-clonic seizures, anticlockwise exploration with postural loss and falling) were identified as developed SE.
LFP analysis
Data were analyzed with the help of custom software in LabView 13 (National Instruments, USA). Artifacts owing to animal movements were discarded before the analysis. All records of electrical activity were split into 10 min epochs and detrended by removing the best straight-line fit (MatLab 8.0, USA). Spectral characteristics of spontaneous LFP (background activity) and LFP within KA-induced SE (epileptiform discharge complexes and interdischarge activity) were computed with the aid of Fast Fourier transform using Welch's method (Hann window with 4096 samples segment size, 25% overlap between segments). This approach allowed us to obtain the averaged spectra and dynamics of the spectrum in time. The LFP spectra dynamics were analyzed during the first 240 min after the administration of KA.
The intervals of interdischarge activity and epileptiform discharge complexes in the records of KA-induced SE were identified visually based on the synchronous analysis of spectrograms and LFP recordings.
Experimental design
Animals were allowed to recover for 1 week after surgery, during which they were handled and placed into the recording chamber daily for 4–6 days before the experiments were started. Baseline LFP of MS, CA1 field of the hippocampus, entorhinal cortex, and basal nucleus of the amygdala were recorded for 3–4 days, 30–60 min per day. Then the experimental SE was induced by injection of KA into the right lateral brain ventricle. After the KA administration, animal behavior and electrical activity of investigated brain structures were registered continuously during 5–6 h (Fig. 1B). At the end of the electrophysiological experiments, electrode and cannula placements were verified histologically with Nissl staining.
Statistics
Owing to the variability of the data along the frequency axis in different animals, it does not seem correct to average the spectra for statistical analysis. To assess whether the relations between brain rhythms that we obtained in the present work were different from the theoretical value (2, representing the frequency doubling) a one-sample Wilcoxon signed-rank test (two sided) was computed. For this analysis, ratios between local maximums in the interdischarge LFP spectra in the phase of maximum development of spectral structure were calculated and compared with our proposed theoretical value, equal to 2. Statistical tests were performed using SPSS Statistics software (version 21, IBM Corp., USA); p < 0.05 was considered statistically significant.
Results and Discussion
KA-induced SE in guinea pigs
Microinjection of KA (0.4 μg, i.c.v.) induced prominent convulsive SE lasting several hours (Shubina et al., 2015). Two to three minutes after the KA injection, animals showed freezing, chewing, facial movements accompanied by low-amplitude high-frequency activity in the hippocampus and/or the entorhinal cortex. Sharp-waved seizure activity typically started 10–15 min later with animals showing tremors, isolated twitches, or unilateral forelimb clonus. Usually, guinea pigs developed SE around 20–25 min after the KA injection. SE was characterized by anticlockwise exploration with postural loss and falling, clonic and tonic-clonic seizures. During this phase, repeated epileptiform discharge complexes (seizure events) were observed in all recorded brain structures (Fig. 2). They were characterized by synchronized high-amplitude high-frequency spiking lasting around 2 min (Fig. 2). The earliest change in electrical activity and the highest amplitude and frequency of epileptiform discharges were observed in the hippocampus. This is not surprising, because the hippocampus is extremely susceptible to KA (Ben-Ari and Cossart, 2000). Besides the hippocampus, seizure events were more prominent in the entorhinal cortex, whereas the MS and amygdala exhibited bursts with lower amplitude and frequency. Almost periodically, seizure events were alternated with interdischarge activity (Fig. 2). Behavioral and electrographic seizures were more powerful and frequent in the first 3 h after the KA injection. SE usually lasted for 4–5 h.
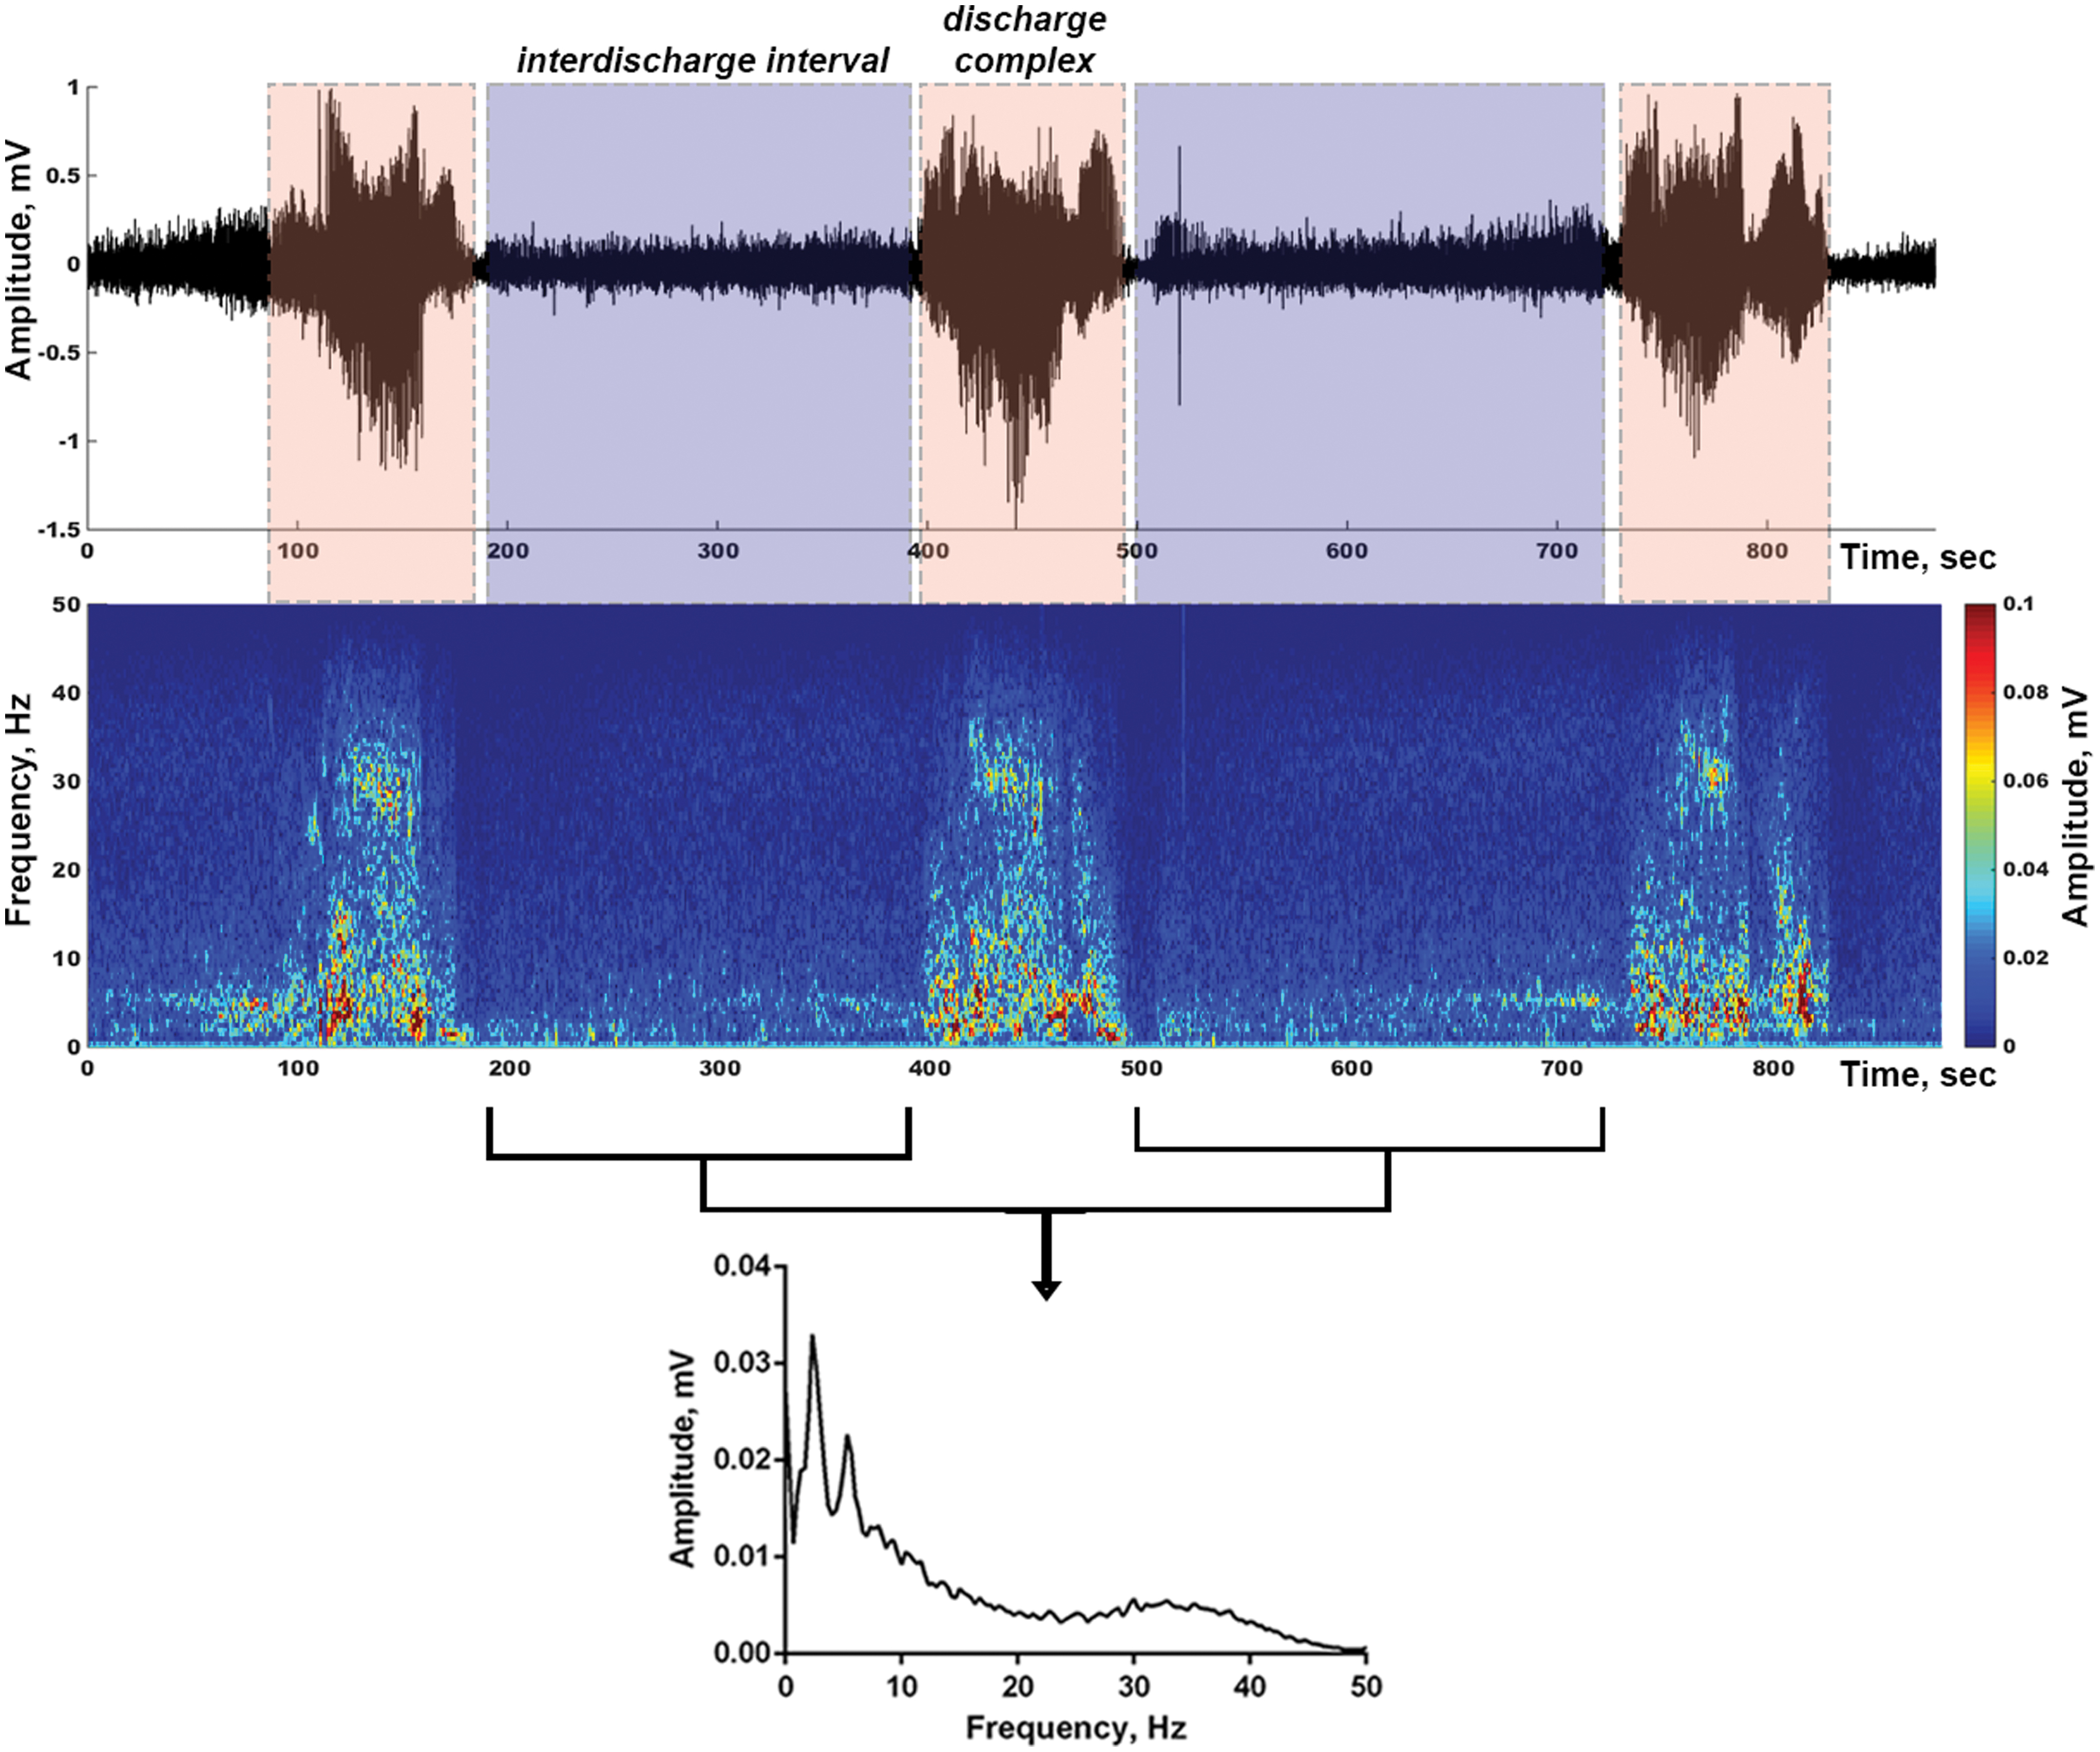
KA-induced electrographic seizures. High-amplitude high-frequency epileptiform discharge complexes (seizure events) alternated with low-amplitude interdischarge activity are seen in the hippocampal LFP record (at the top) and the corresponding spectrogram (in the middle). Averaged spectrum of shown interdischarge intervals (at the bottom). Color images are available online.
Although the behavioral manifestations of SE are not identical in different species (guinea pigs, rats, and mice), KA-induced electrographic seizures have a rather similar pattern, regardless of the animal species or KA administration method (Barnwell et al., 2009; Diehl et al., 1984; Medvedev et al., 2000; Medvedev, 2002). In accordance with our observations, systemic or intrahippocampal administration of KA causes periodic high-amplitude seizure events in rat LFP, characterized initially by HFOs, followed by clusters of epileptiform spikes, and subsequent postictal depression (Barnwell et al., 2009; Medvedev, 2002).
Interdischarge LFP spectra dynamics within the development of SE
In the process of SE development, the excitability and synchronization of both individual neurons and network increase, which leads to hyperexcitability and hypersynchronization of the brain. This state leads to the appearance of high-amplitude seizure episodes (epileptiform discharge complexes) in the LFP, alternating with low-amplitude interdischarge activity (Fig. 2). In this study, we examined the LFP spectra of interdischarge activity at various stages of SE and the spectra of discharge complexes.
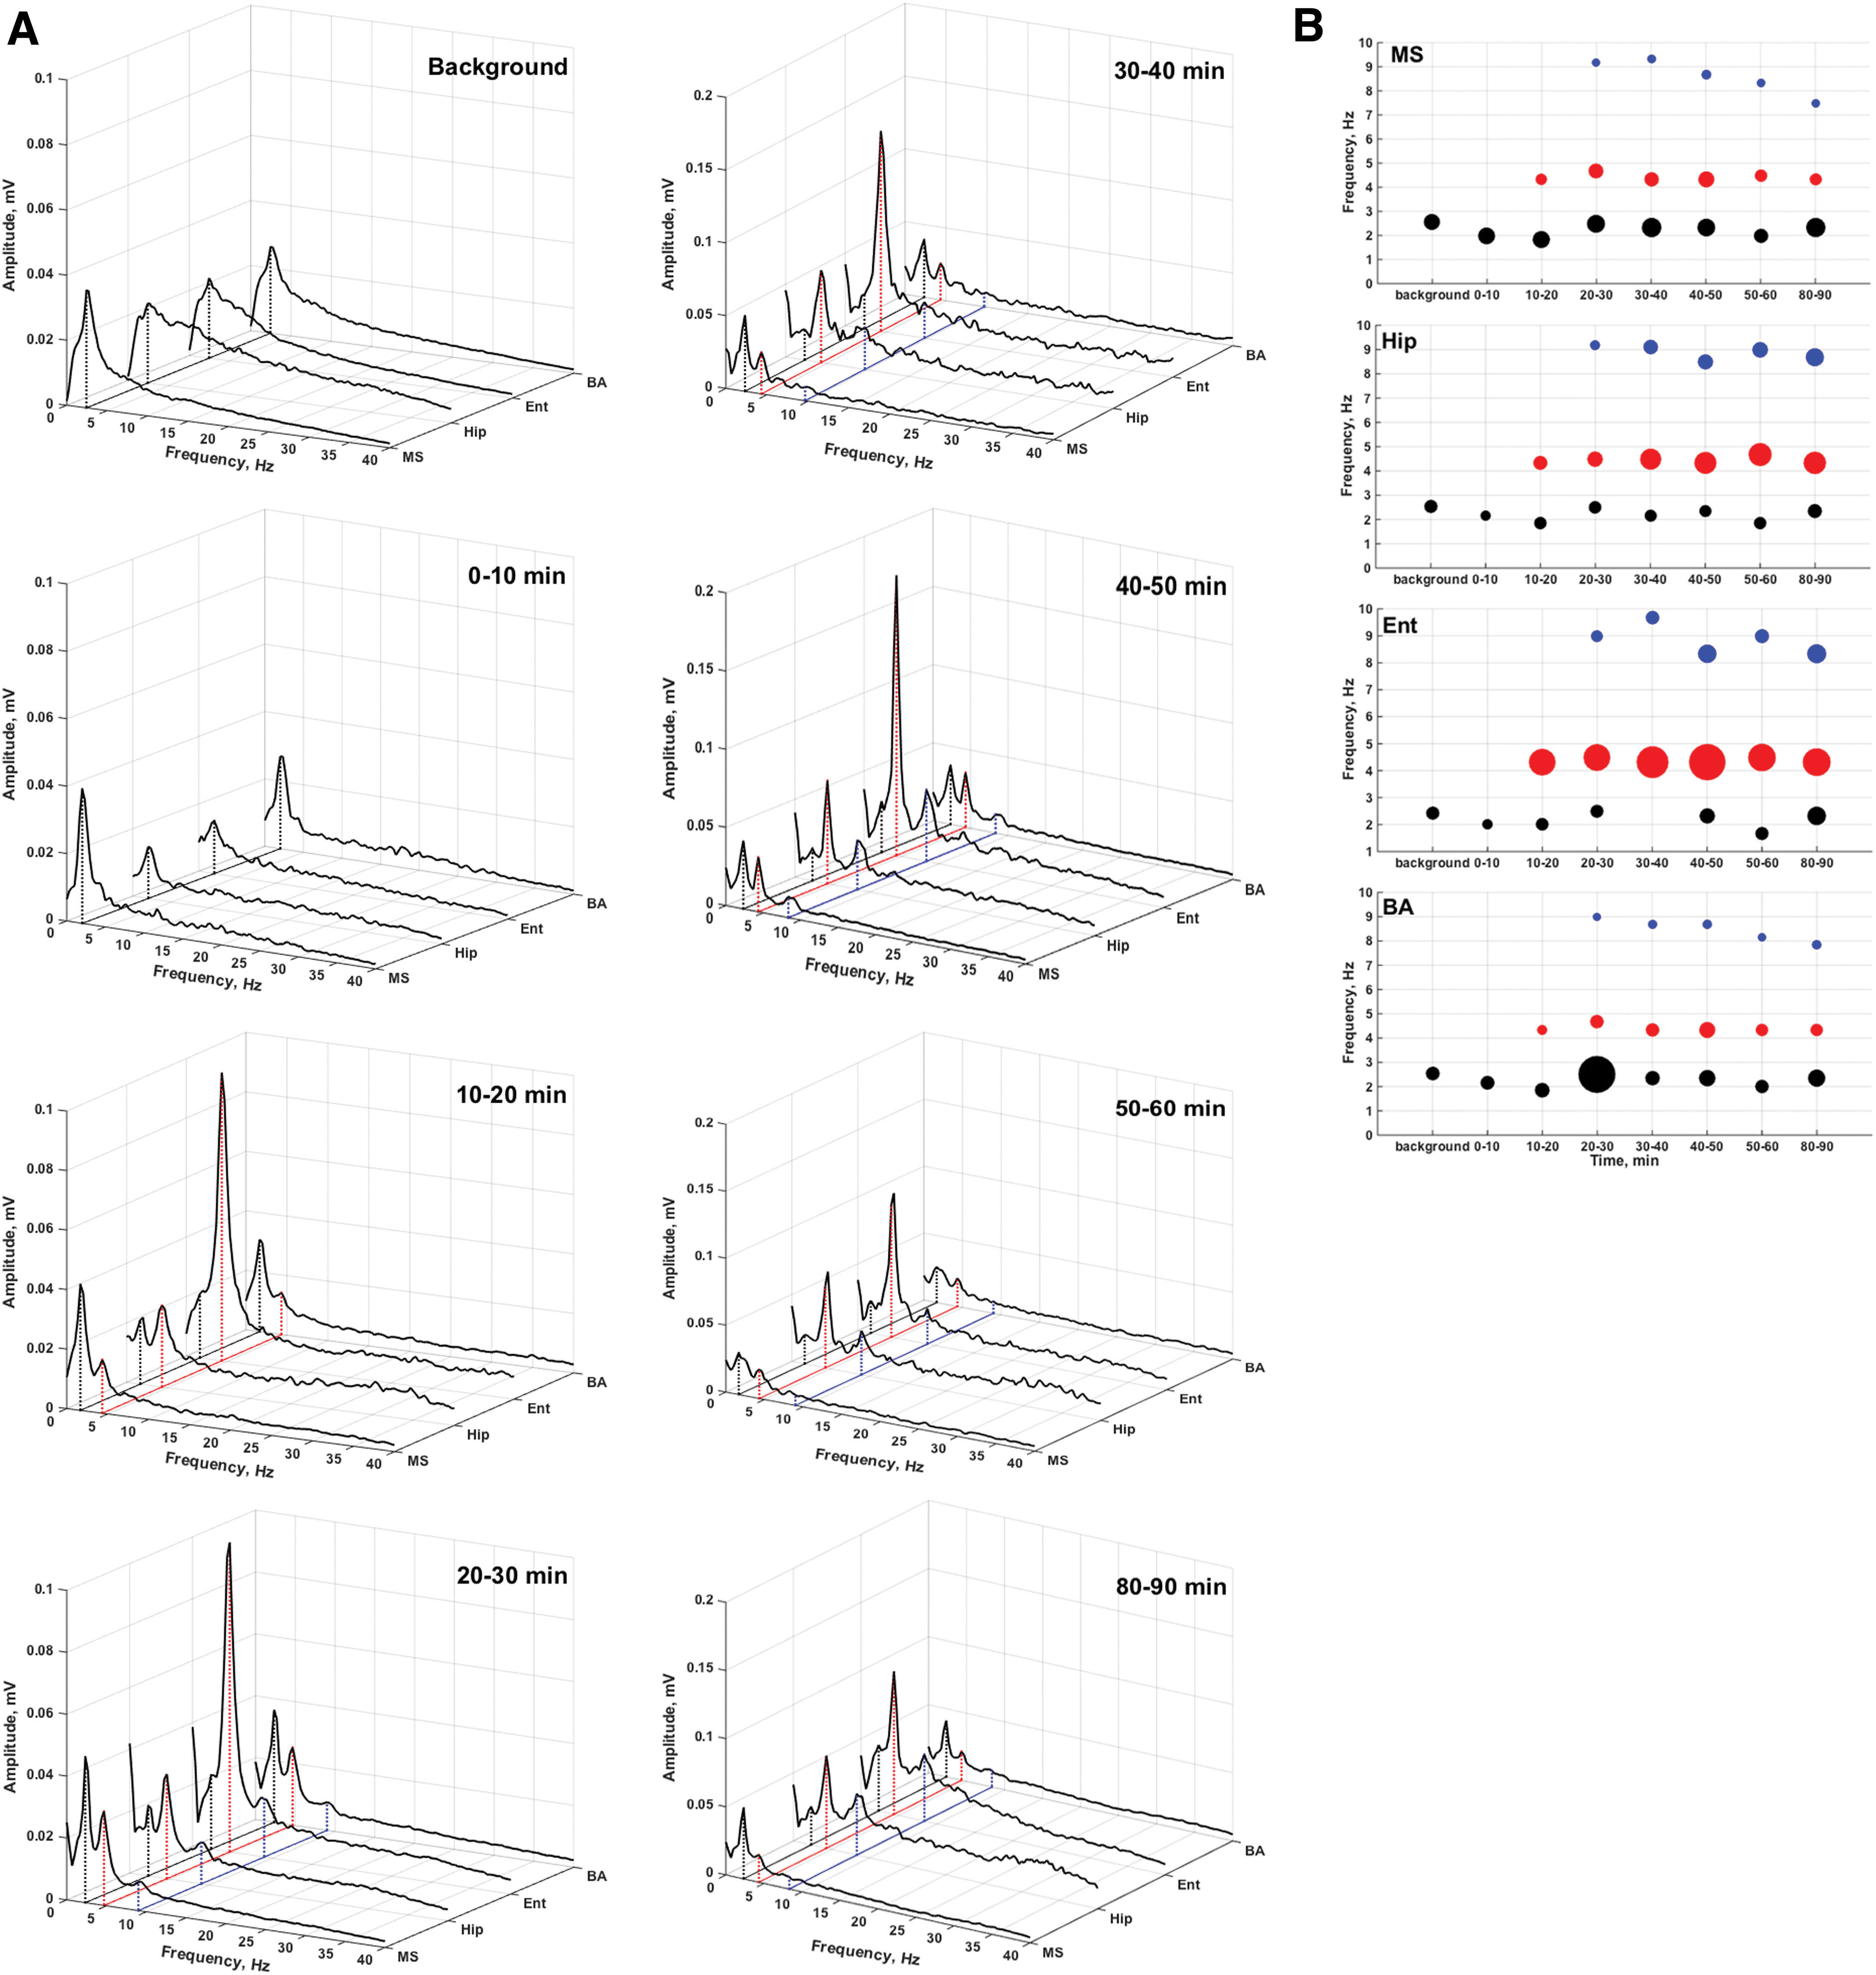
Background LFP of guinea pigs have poorly defined power spectra with one well-defined frequency component in delta band, hereinafter referred as f 0 (Fig. 3). The value varied in the range 1.7–2 Hz among the animals. During the SE development, the interdischarge LFP spectra began defining in all recorded brain areas, which were expressed in the sequential appearance of higher frequency rhythmic components in the spectra (Fig. 3). The rate of development of such defining had significant individual differences. The maximum spectrum definition was already developed by the 10th minute of recording in some animals, whereas in others only by the 60th minute. For this reason, averaging of the dynamic parameters of the spectrum development from different animals would not be correct.
Dynamics of the interdischarge LFP spectra
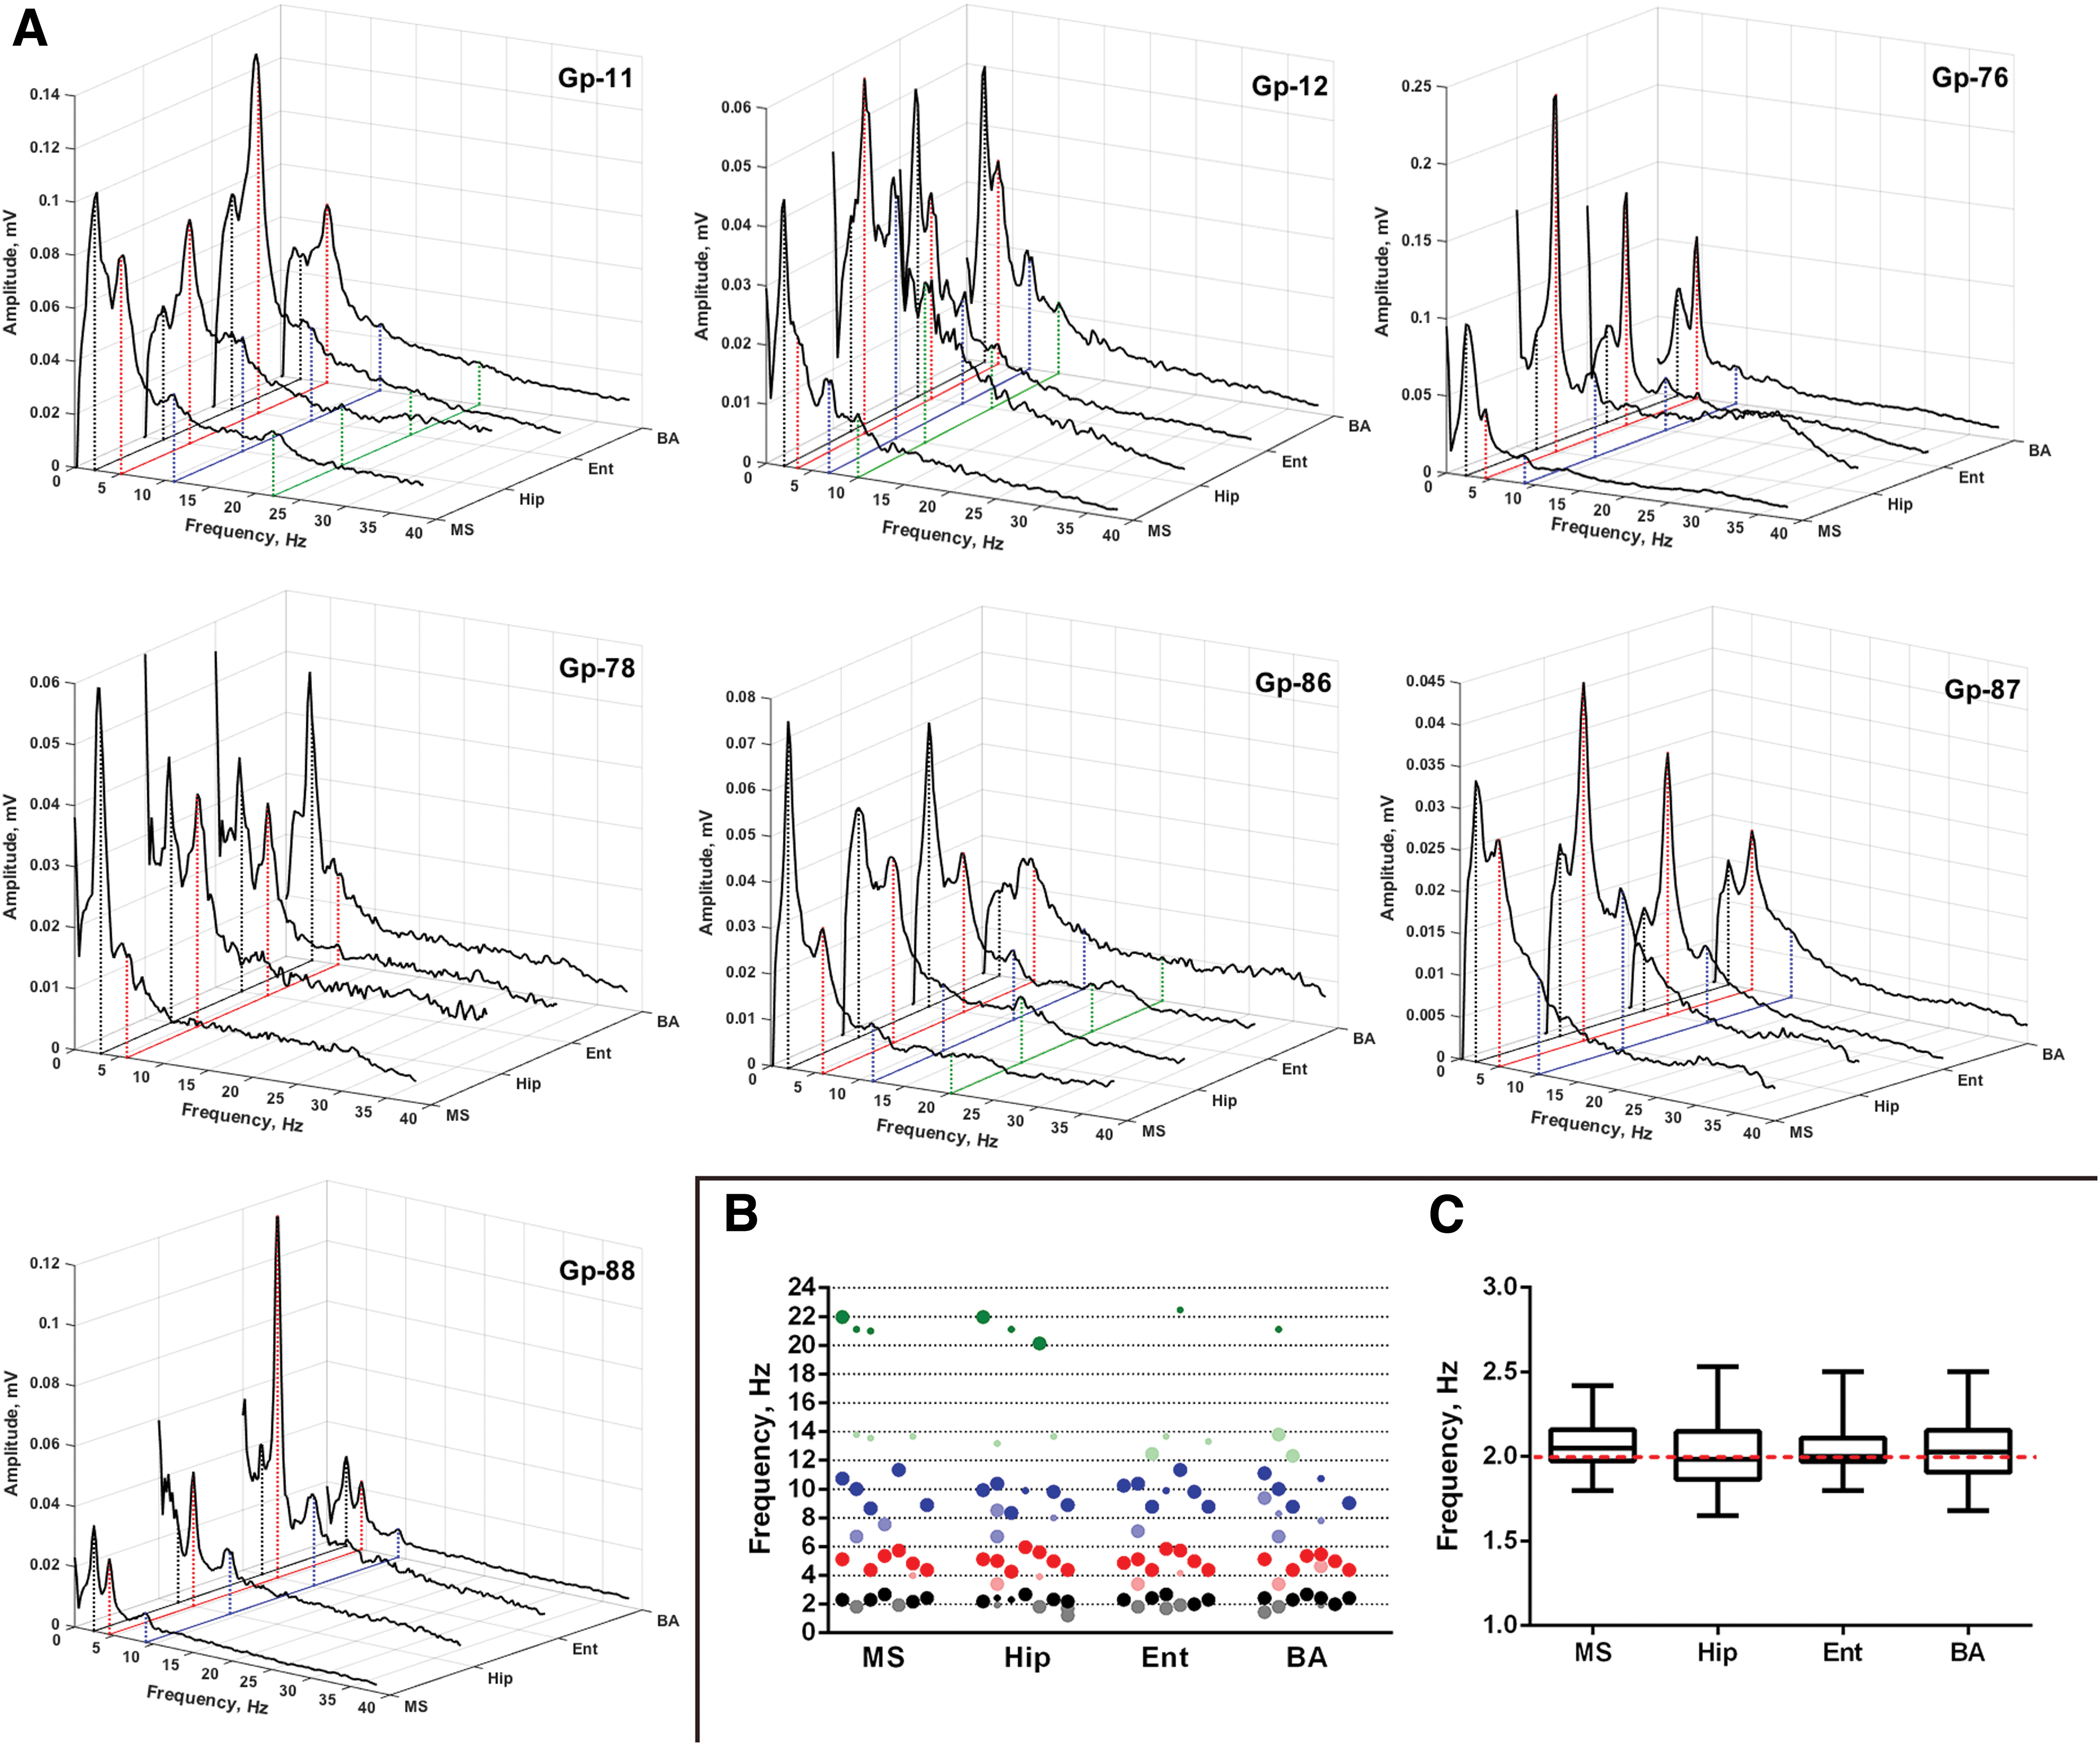
According to the goal of this study, the location of newly emerging spectral components and their relative position were of interest. The analysis showed that all of them were f 0 harmonics, but their “set” could vary in different animals (Fig. 4). It could be illustrated with an example of the LFP spectrum dynamics of one of the animals (Fig. 3). In the first 10 min there was only an increase in the amplitude of the background leading frequency (f 0, ∼2 Hz), then between the 10th and 20th minute double frequency (about 4 Hz) appeared in the spectra and significantly exceeded f 0 in amplitude. After the 30th minute, a new peak appeared in the LFP spectra, also doubling the frequency of the previous one (Fig. 3). This process of LFP spectrum structuring could affect also higher frequency bands (beta and gamma) in individual animals (Fig. 4A). In addition to doubling frequencies, simple harmonics could be presented in the LFP spectra of some animals, but they were expressed weakly (Fig. 4A).
Interdischarge LFP spectra
Thus, a cascade of doubling of the frequency of rhythmic activity in all investigated brain structures was observed during the development of SE. The interval between two tones whose frequencies (or fundamental frequencies) stand in the ratio of 2:1, according to American National Standard Acoustical Terminology, called “octave” (ASA S1.1-2013 American National Standard Acoustical Terminology Paperback—2013). The relationships between brain rhythms that we obtained in this study allow us to state the octave principle of the LFP structure. Each peak in the LFP spectrum represents the second harmonic of the previous rhythm (Fig. 4B, C). A Wilcoxon signed-rank test indicated that the medians of relationships between local maximums in the interdischarge LFP spectra in the phase of maximum development of spectral components (MS 2.05, Hip 1.99, Ent 2, BA 2.03) were not significantly different from two [MS (n = 13): Z = 1.49, p = 0.14; Hip (n = 19): Z = 0.44, p = 0.66; Ent (n = 15): Z = 0.60, p = 0.55; BA (n = 16): Z = 0.82, p = 0.41].
Our experimental data coincide with the theoretical ideas of Klimesch (2013) about the cascade of doubling of the basic rhythm. Therefore, the frequency of the n-th peak in the LFP spectrum can be determined by a power-law function with a base of 2:
where Fn is the frequency of the n-th peak in the LFP spectrum and f 0 is the basic frequency before the KA injection.
A frequency doubling cascade was observed in all studied structures; however, differences in the LFP spectra dynamics of laminar and nuclear structures could be observed after 30 min. A tendency toward a return to the initial background state was noted in the LFP spectra of the MS and BA, whereas the entorhinal cortex and hippocampus maintained a cascade of frequency doubling rhythms. Moreover, electrical activity in the entorhinal cortex and hippocampus remained at high amplitude and significantly exceeded that in the MS and BA during the entire observation time (Figs. 3 and 4).
The formation of the system of harmonic ratios in our experiment is the result of artificial conditioning of hypersynchronization and hyperactivation of the brain. In the normal state, these processes are concealed by significant desynchronization and modulation of rhythms. Under certain conditions they can appear in the spectra of electrical activity. For example, alpha is increased by inattention and eye closure, which is manifested by the appearance of a well-defined peak in the LFP spectrum (Nunez et al., 2001).
The octave principle of brain rhythms generation is also confirmed by the studies of steady-state visually evoked potentials (SSVEPs). A study of amplitude-frequency characteristics using SSVEPs demonstrated that repetitive stimulation of sensory pathways evokes synchronous responses at the cortical level with a gain that depends on frequency. The SSVEPs in response to some frequencies show resonance phenomena indicating a selective frequency preference of the neural oscillators. Resonance phenomena occurred in the 10-, 20-, 40-, and 80-Hz frequency range, that is, human visual cortex responds to flickering stimuli at these frequencies more strongly than to stimuli flickering at adjacent frequencies (Herrmann, 2001; Lea-Carnall et al., 2016). Since the time of Pythagoras, it is known that the auditory system is also built on an octave principle, because tones that differ in frequency two times are perceived as identical (Schulter, 1998). The octave is the main interval that determines the periodicity of the musical system. The range of frequencies perceived by humans is 20–20,000 Hz, it covers ∼10 octaves.
The operational model of the LFP spectrum formation
Based on the octave principle of the brain rhythms generation, we propose the following operational model of the guinea pig brain electrical activity structure. An “operational model” will be called a model based on a specific operation that performs a particular function. We will consider an elementary nonlinear operation of interaction between rhythms, amplitude modulation, as a fundamental operation, and the structure performing this operation will be called a nonlinear operator. From the mathematical point of view, amplitude modulation is the operation of multiplying two rhythms, so we will use these terms. The multiplication of processes in the nervous system is a basic operation of the formation of nonlinearity. Its mechanisms and role in the computational functions of the brain are discussed in detail in a review by Silver (2010). In this model, we would like to abstract from the specific mechanisms of the formation of the nonlinear operator and note only that one source of nonlinearity in the brain arises because the firing response of neural populations is not a linear function of the cell potential. Therefore, we expect to see nonlinear effects when strong population voltage oscillations are present. Nonlinear behavior in the brain has been investigated in studies examining seizures, in which high-amplitude oscillations lead to nonlinear features in the power spectrum (Breakspear et al., 2006; Robinson et al., 2002). Nonlinearity has also been observed when the alpha oscillation is strong (Abeysuriya et al., 2014; Freyer et al., 2009; Stam et al., 1999).
Nonlinear reactions in the perception of external harmonic signals are characteristic not only of the visual system structures but also of the limbic system (Bondar and Shubina, 2018). This nonlinearity was manifested in the presence of many harmonics of stimulation frequency in the LFP spectra. These harmonics had independent amplitude and phase behavior during the stimulation. Based on these results, a conclusion was made about the functional significance of nonlinearity in the nervous system (Bondar and Shubina, 2018). We believe that one of the most important functions of nonlinearity is the formation of the octave rhythmic structure of the brain, consisting of a cascade of doubling frequency of a certain basic generator. The frequency doubling mechanism can be built based on a recurrence system, which incorporates the simplest nonlinear operator capable of multiplying incoming harmonic processes. The function of the nonlinear operator can be performed by nerve networks of varying complexity, as well as individual neurons that have recurrent connections (Fig. 5). Such networks are common to all brain structures.
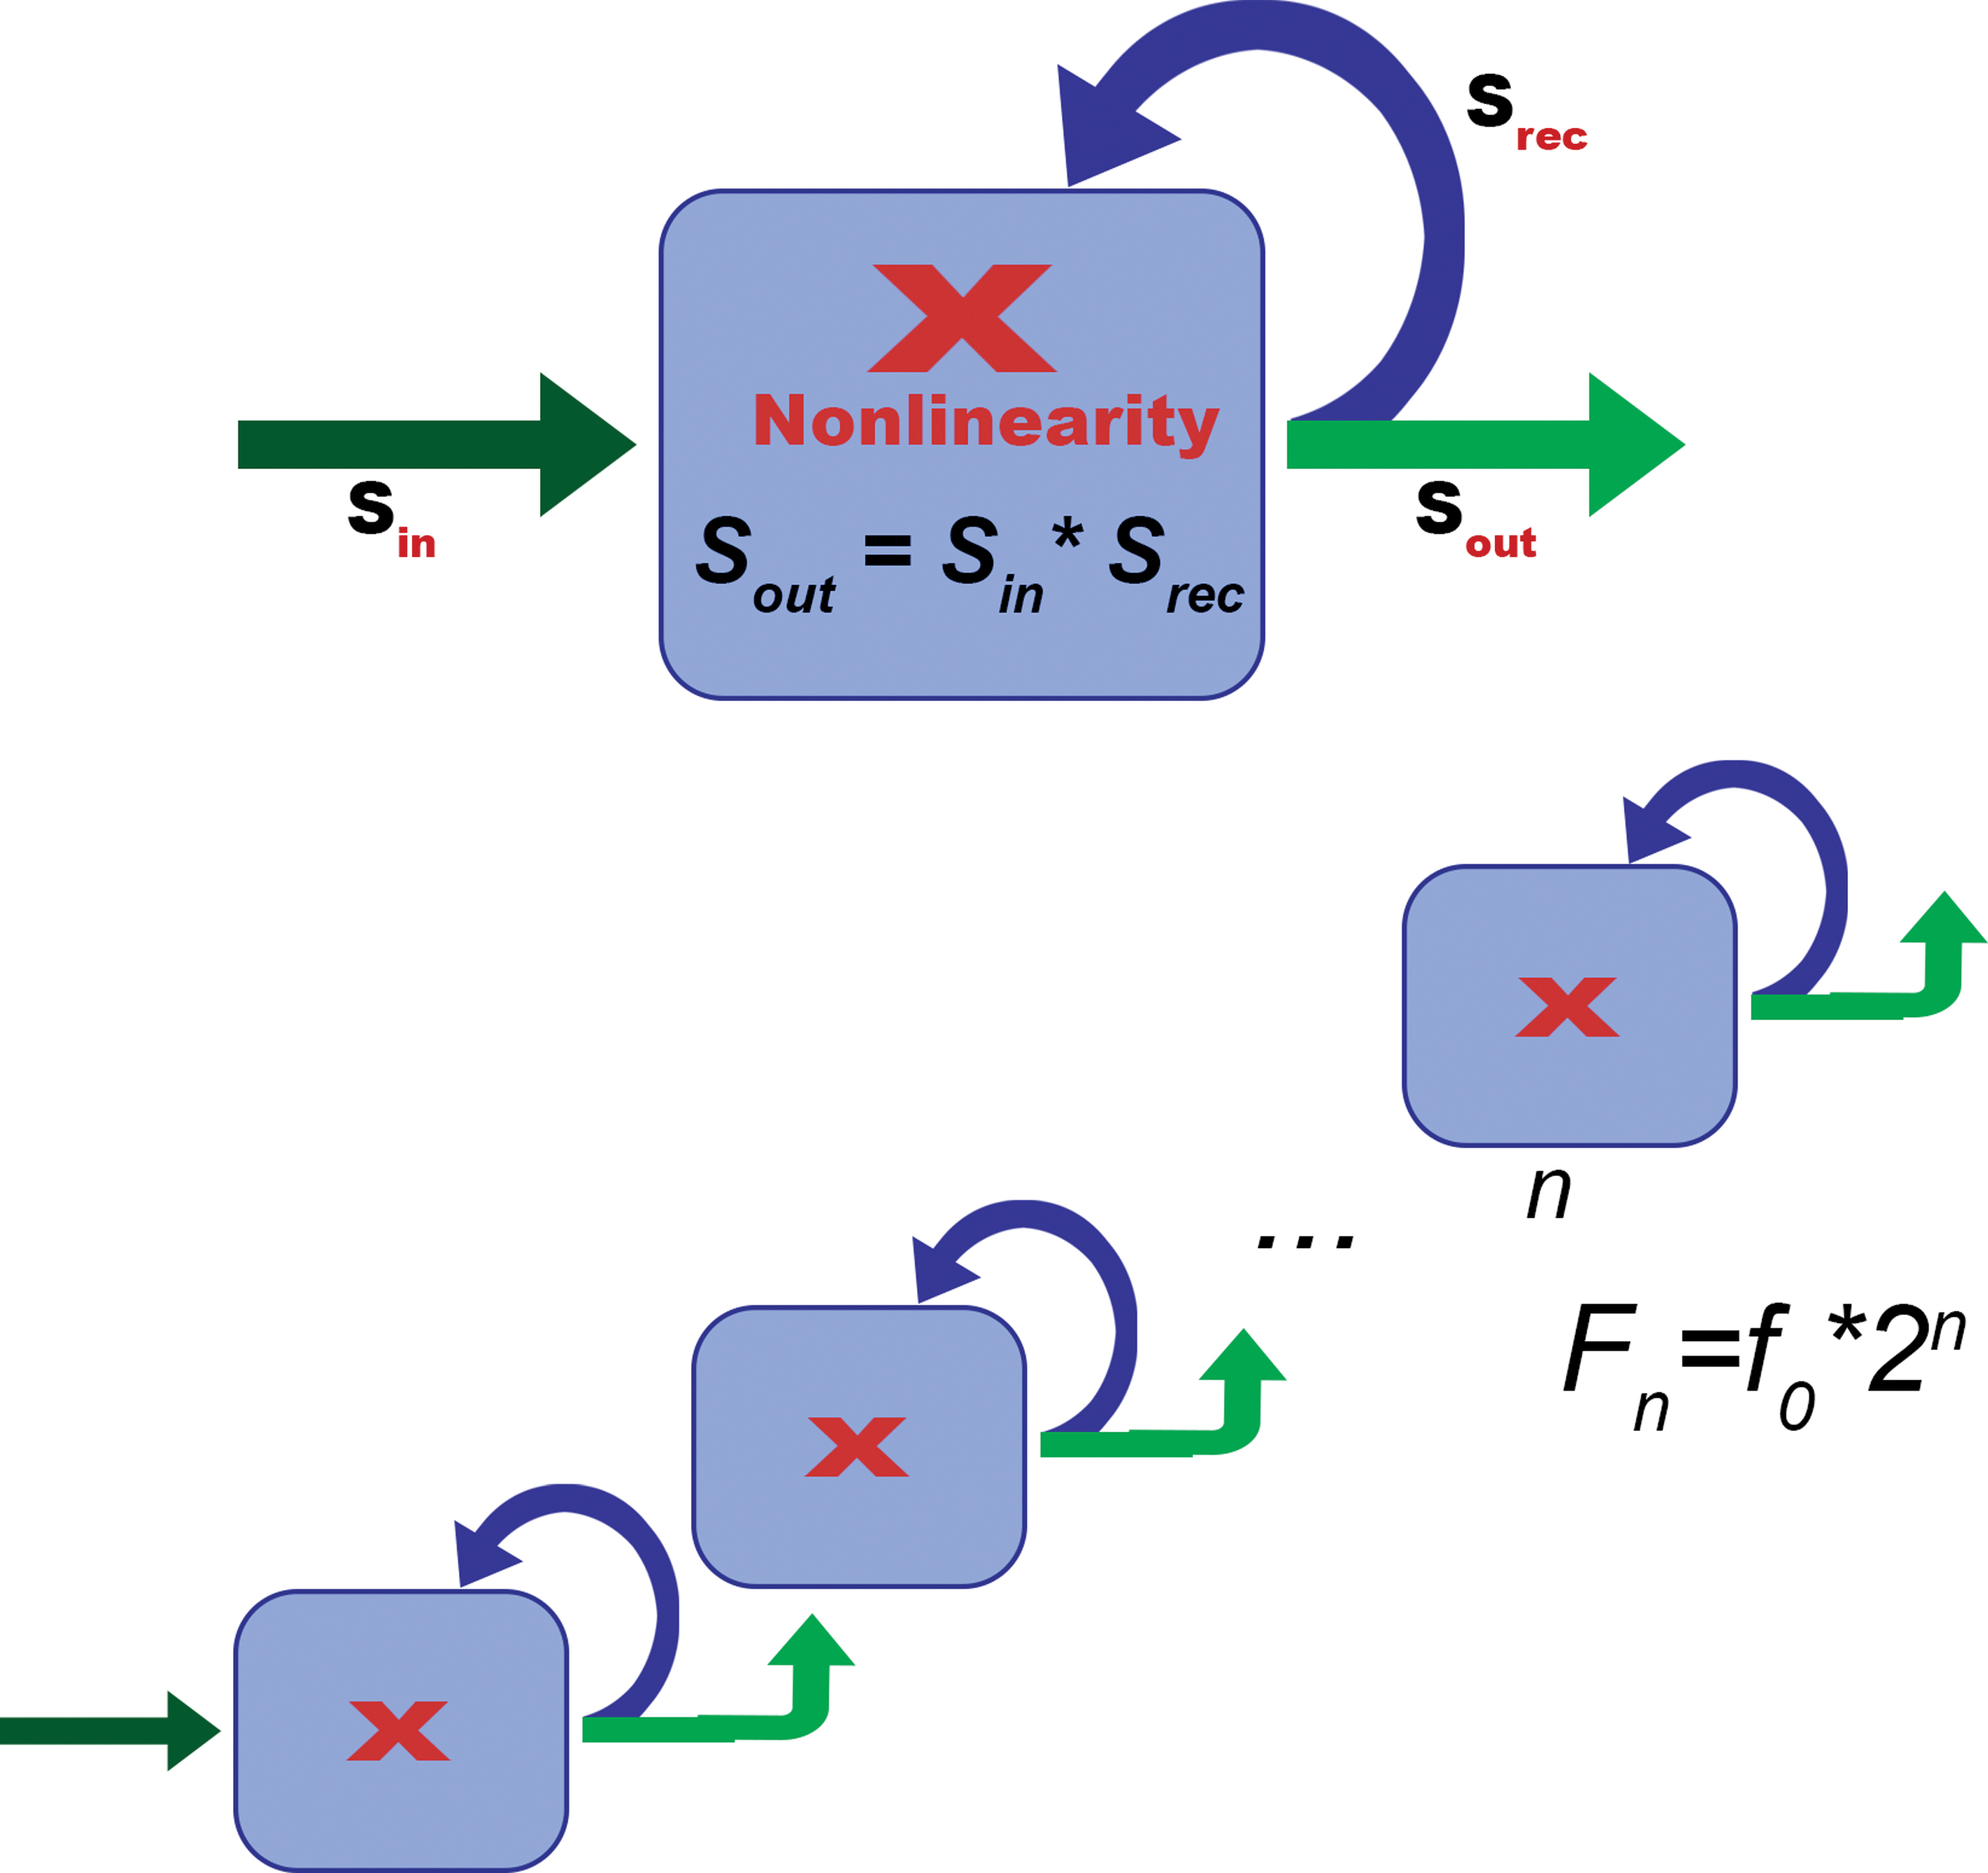
The operational model of the interdischarge LFP spectrum formation in the cascade of recurrent neural networks. Each element of the cascade (module) has two inputs and two outputs and perform the simplest and most elementary nonlinear operation: the amplitude modulation. The input signal S in is supplied to the first input of such a network, and the recursive feedback signal S rec from one of the network outputs is fed to the second input. The signal at the output (S out) of such a system is depended on the operator of the interaction of S in and S rec, which in our model is the operation of multiplication. An elementary nonlinear operation in the interaction of the input signals S in and S rec leads to the appearance of a complex signal at the module output, consisting of a component equal in frequency to the input signal and a component with a double frequency. Then the operation is repeated in the next network of the cascade, which leads to a doubling of the frequency at the output of the next element. There can be several such networks in the cascade (n), as a result of which the cascade will generate a number of rhythms (f 0, 2f 0, 4f 0…2nf 0, where f 0 is the basic frequency). Color images are available online.
Operators can combine in serial chains forming cascades of varying complexity. Each element of the cascade (module) is a recurrent network, which in the simplest case has two inputs and two outputs (Fig. 5). These recurrent networks perform the simplest and most elementary nonlinear operation: the amplitude modulation of incoming signals by recurrent feedback rhythms (Fig. 5). Feedbacks can be both inhibitory and excitatory. In both cases, they will modulate the amplitude of the input periodic signal realizing the multiplication of the rhythms. The neurodynamics of such networks is iterative, which determines their properties.
The input signal Sin is supplied to the first input of such a network, and the recursive feedback signal Srec from one of the network outputs is fed to the second input (Fig. 5). Functional recurrence may be based on the invariant property of the anatomy of the nervous system to form not only direct, but also reverse anatomical connections. Based on these connections the propagation of excitation processes along the circular nerve networks is formed. In the case of simple circulation in the network, we will deal with Hebbian reverberation (Hebb, 1949). However, another case is possible when a continuous signal at the input of the system interacts with a recurrent feedback signal. The signal at the output of such a system will depend on the operator of the interaction of rhythms, which in our case is the operation of multiplication.
We formalize our model as follows:
where S out is the output signal of the network module, S in is the input signal, and S rec is the feedback signal.
If S
in is a harmonic signal, Equation (1) will take on form:
Since
Equation (2) will take on form:
Thus, an elementary nonlinear operation in the interaction of the input signals S in and S rec during the first recursion leads to the appearance of a complex signal at the module output, consisting of a component equal in frequency to the input signal (first harmonic) and a component with a double frequency (second harmonic). However, both the input and output signals are continua, the duration of which can significantly exceed the characteristic feedback times, and accordingly, the number of recursions can be arbitrary. In this case, each recursion will enrich the spectrum of the output signal with additional harmonic, which can lead to the formation of sharp-wave pathological signals. The mechanism of avoiding the formation of pathological behavior can be based on the property of all functional elements of the nervous networks to have certain amplitude-frequency characteristics. All physical and other systems have their own oscillations, at the frequencies of which a resonant response to external periodic effects can be caused. We assume that the neural networks have a rather narrow range of frequencies to which they respond with resonance under different impacts. In other words, neural networks can be represented as narrow-band filters. This assumption is based on the following data. Numerous studies have demonstrated that various elements of neural networks from the retina to the cortex also have fairly narrow amplitude-frequency characteristics, which allows them to play the role of frequency filters (Gutfreund et al., 1995; Hughes and Maffei, 1966; Hutcheon et al., 1996; Jahnsen and Karnup, 1994; Llinás and Yarom, 1986; Motokawa and Ebe, 1952; Pike et al., 2000). In addition, we have mentioned previously experiments with SSVEPs that demonstrated resonance effects during photostimulation of the human retina.
From the second output, S
out is fed to the network input of the next stage element (Fig. 5). Because the network outputs can have certain amplitude-frequency characteristics, they can play the role of bandpass filters. The parameters of these filters are determined by the ratio of the excitatory and inhibitory bonds in these networks. The literature data on the multiple difference in the resonance properties of hippocampal neurons and interneurons were cited previously (Pike et al., 2000). With a certain narrowness of the passband of such filters, the recurrent output is tuned so that only the first harmonic can pass, and the direct output to the next network element can transmit only the second harmonic (with a double frequency) (Fig. 5). Then the operation is repeated in the next network of the cascade, which leads to a doubling of the frequency at the output of the next element. There can be several such networks in the cascade, as a result of which the cascade will generate a number of rhythms:
where n is the number of elements of doubling cascade.
According to the model, each frequency doubling is localized in a separate neural network module of the sequential cascade. This assertion may also be confirmed by studies demonstrating that the first and second harmonics in the reaction of visual neurons are realized in different neuronal populations. Moreover, it was shown that these populations are topographically segregated. Thus, SSVEPs in humans represented responses with at least two different cortical sources: the first harmonic components originating from primary visual cortex and the second harmonic components originating from the rostral portion of the calcarine sulcus but mostly from the inferior half of the parieto-occipital sulcus (Pastor et al., 2007). In another work, “the first harmonic responses” was maximal over the medial posterior scalp and “the second harmonic responses” was maximal over the contralateral posterior scalp (Kim et al., 2011). Investigation of pattern-evoked electroretinograms also showed that the first and second harmonics of visual-evoked potentials did not respond equally to spatiotemporal parameters of stimulus (Hess and Baker, 1984; Porciatti, 1987). Our studies also demonstrated different behavior of the first and second harmonics in the limbic system of guinea pig during photostimulation (Bondar and Shubina, 2018). It can be assumed that in the process of recording the total interdischarge electrical activity of the brain, our electrode works as an accumulator of activities of all the recurrent modules of the cascade, as a result of which we obtain a spectrum of frequencies with a doubled period.
The rhythmic structure of seizure events
The proposed operational model may also be useful for understanding the mechanisms of seizure activity generation. The LFP spectra of seizure events are complex. But “zoom” shows that signal consist of an alternation of periodic processes whose frequencies have a number of discrete levels. The first harmonics, or the base frequencies of these levels, usually coincide with the interdischarge frequencies from a series of doubling (Fig. 6). At the same time, in the LFP spectra of seizure events, in addition to the fundamental frequencies, many of their harmonics represent Fourier series (Fig. 7). These results can also be explained in terms of the proposed operating model.

Examples of the most frequent periodic patterns in the hippocampal LFP (left) during KA-induced acute seizure activity and their frequency spectra (right).

Frequency change within the epileptiform discharge complex in the Hip. Discharge complex divided into five sectors (limited by vertical lines)
An important role in the model is given to the narrowness of the amplitude-frequency characteristics of the network outputs. The resulting combination of low- and high-pass filtering behavior effectively creates a notch filter that is capable of rejecting inputs at frequencies outside the passband (Hutcheon and Yarom, 2000). This combination provides the dissociation of the output signal to the first and second harmonics. During the SE the inhibitory processes are altered in the first place. GABAergic inhibition has long been considered as the main brake in the neuronal networks that prevents generation and spread of paroxysmal activities (Trevelyan and Schevon, 2013). Considerable evidence indicates that inherent or acquired deficiency in GABAergic functions results in epilepsy (Lerche et al., 2013). Disturbance of inhibition may change the electrical properties of neuronal networks, which can lead to disruption of the high-pass filter. In turn, the abnormality of the high-pass filter can increase the bandwidth of the network outputs. In this case, the S rec feedback signal at the second iteration will contain not only the first harmonic but also higher order harmonics having a more complex character. According to Equation (3), nonlinear interaction (multiplication) with the input signal S in will lead to the appearance of the third harmonic in the system, which will further complicate the output signal. Each subsequent iteration will lead to the generation of a new harmonic, which will make the signal sharper, with all the rhythm energy concentrated in a certain phase, finally resulting in the development of sharp-wave paroxysmal activity (Fig. 6).
Therefore, acute paroxysmal signals may be considered as the result of multiple iterations of the signal within one of the recurrent modules with impaired amplitude-frequency characteristics of the outputs. In this case, the number of harmonics reflects the number of iterations in this system, and the harmonics themselves are not independent processes (Bondar and Shubina, 2018), as in the case of SSVEPs in a normal brain, but represent epiphenomena associated with the sharp-wave form of the signal (Fig. 6). The harmonics of paroxysmal signals, unlike those in SSVEPs, are amplitude and phase locked and localized in the same structures. Output filter disturbances may occur in any element of the network cascade, as a result of which pathological discharges may appear at any frequency corresponding to this element (Fig. 6). The probability of seizure event appearance is highest at the frequencies of one of the frequency doubling cascades. This means that the feedback impairment occurred at the corresponding level of the doubling cascade. In Figure 7, one can observe how seizure events occurred at a frequency of ≈1.7 Hz, after which the fundamental frequency (first harmonic) discretely doubled to a value of ≈3.4 Hz (seizure event moved to the next element of the cascade), and then abruptly returned to the previous state.
Thus, the fundamental frequencies (first harmonics) of epileptiform discharge also obey Equation (1). Hence, a change in the fundamental frequency of epileptiform discharge complex can occur abruptly, by doubling or, conversely, dividing into two (Fig. 7).
Conclusions
In the process of the development of SE induced by the injection of KA into the brain ventricles in guinea pigs, an almost periodic combination of epileptiform discharge complexes and relatively calm interdischarge periods is observed in the LFP. This process is not yet accompanied by neurodegeneration, therefore, it can be considered as a functional process of the sequential development of excitation and hypersynchronization in the brain.
The study of interdischarge LFP dynamics demonstrated a successive change in the LFP spectra, consisting of a sequential doubling of the frequency that initially dominated in the background activity. These results confirmed Klimesch's theory about the octave structure of the electrical activity of the brain (Klimesch, 2013). According to that theory, the octave principle of the brain rhythms structure reflects the common relationship of their genesis. Based on this principle, we propose an operational model of brain rhythms generation. The core of our model is the hypothesis that the LFP frequency profile in normal and pathological conditions is the result of iterative interaction of rhythms among themselves. The model is based on an elementary nonlinear operation of rhythm multiplication in a cascade of recurrent neural networks, leading to a sequential frequency doubling in each element of the cascade. Alteration of the passband between the elements of the cascade caused by the deficiency of inhibition processes during epileptogenesis leads to the formation of sharp-wave activity. The LFP spectra of this activity are Fourier series with many harmonics. In this case, harmonics are an epiphenomenon, they are not independent processes, but reflect the form of a periodic sharp-wave process.
Thus, fundamental principles such as nonlinearity and the presence of feedbacks (recurrence) may serve as a base for explaining the genesis and phenomenology of the electrical activity of brain structures in normal and pathological conditions.
Footnotes
Acknowledgment
The authors thank Anna Polevaya for comments and help in preparing the article.
Authors' Contributions
A.B. designed and conceptualized the study, analyzed and interpreted the data, wrote the article. L.S. carried out the experiments, analyzed the data and wrote the article.
Author Disclosure Statement
No competing financial interests exist.
Funding Information
This work was supported by the Russian Science Foundation (Grant No. 20-65-46035).