
Abstract
Background:
Aging affects the brain at the anatomical and functional levels, resulting in a decline in motor and cognitive performance. Functional magnetic resonance imaging (fMRI) studies documented lower connectivity within brain networks and higher connectivity between them, for older as compared with young adults. However, it is still unclear whether the reduced segregation between networks, as observed with fMRI, has neurophysiological underpinnings.
Methods:
We collected high-density electroencephalography (hdEEG) data in 24 young and 24 older adults at rest. Bimanual coordination performance was also measured in the same participants, using a computerized test. Using the hdEEG data, we reconstructed oscillatory power and functional connectivity for six large-scale brain networks, in delta, theta, alpha, beta and gamma frequency bands. We evaluated age-related differences in network power and connectivity between young and older participants, and their possible relationships with bimanual coordination performance.
Results:
We observed that the level of network segregation generally decreased with age, in line with fMRI findings. However, there was a relatively strong dependence on the frequency band and the brain network being considered. EEG connectivity in the sensorimotor network predicted motor performance differences across older individuals, particularly when neural oscillations in the beta frequency band were considered.
Discussion:
Our study provides electrophysiological evidence in support of the “de-differentiation hypothesis” for the aging brain, and for the existence of a clear link between the strength of EEG connectivity at rest and motor performance.
Impact statement
Using advanced analyses of high-density electroencephalographic data, we could show how band-limited network connectivity differs between young and older adults, and how these differences can predict motor performance. The analyses revealed a complex pattern of connectivity–behavior associations, which not only depended on the network considered, but also on the specific neural oscillations. This may provide novel targets for age-related interventions inducing neural entrainment, based for instance on transcranial alternating current stimulation.
Introduction
Aging is associated with changes in the peripheral and central nervous system. This process may have a direct impact on many common activities of daily life in which performance of complex actions is required. Both anatomical and functional alterations in the brain are primarily responsible for the decline in motor control typically observed in older adults (for reviews see Ferreira and Busatto, 2013; Minati et al., 2007).
Age-related anatomical changes include a decrease in the number of fiber tracts (Betzel et al., 2014) and increased diffusivity within the white matter (Marstaller et al., 2015), gray matter atrophy, reduced cortical thickness and volume (Ferreira and Busatto, 2013; Marstaller et al., 2015), decline in dopaminergic neurotransmission (Bäckman et al., 2010), and substantial amyloid accumulation in the brain (Rodrigue et al. 2012, for review see Damoiseaux, 2017). These structural and neurochemical changes correlate with sensorimotor as well as cognitive deficits in older adults (Adab et al., 2020; Chalavi et al., 2018; Marstaller et al., 2015; Onoda et al., 2012).
Several studies have recently focused on the assessment of age-related differences in brain activity and connectivity using functional neuroimaging techniques. Thanks to functional magnetic resonance imaging (fMRI), several resting state networks (RSNs) in the human brain have been mapped, such as the default mode (DMN), the dorsal (DAN) and the ventral attention (VAN), the language (LN), the sensorimotor (SMN) and the visual network (VN) (Cieri and Esposito, 2018; Gillebert and Mantini, 2013; Mantini et al., 2008). Those studies documented a decreased network segregation in the aging brain, consisting of lower connectivity within RSNs and higher connectivity between them (Betzel et al., 2014; Ferreira and Busatto, 2013; King et al., 2018; Monteiro et al., 2019).
However, age-related differences in network connectivity may be network dependent. Connectivity within nodes of DMN and DAN has been consistently found to decrease with age (Betzel et al., 2014; Ferreira and Busatto, 2013; Grady et al., 2016; Tomasi and Volkow, 2012), whereas results for the SMN have been inconsistent. Some studies documented an age-related decrease in SMN connectivity at rest (Wu et al., 2007), which correlated with longer reaction times in motor task performance. Other works, instead, found stronger functional connections between motor regions in older compared with young adults (Solesio-Jofre et al., 2014; Tomasi and Volkow, 2012).
Besides the network-specific differences, fMRI findings suggested that the functional specialization of large-scale networks decreases over the lifespan, possibly as a consequence of the brain structural decline (Goh, 2011). This age-dependent reduced functional specialization may be reflected in an increased inter-network connectivity rather than a decreased intra-network connectivity at rest (King et al., 2018; Monteiro et al., 2019). Likewise, the different brain responses, either in terms of regions involved or level of activity, measured in older participants compared with young adults have been ascribed to a compensatory mechanism (Cabeza et al., 2018; Cabeza, 2001). This aims at counterbalancing the decline by recruiting additional neuronal resources to preserve the participant's performance and it is therefore related to motor or cognitive tasks.
Activity and connectivity results from fMRI studies can be largely dependent on the analysis procedure, particularly on the regression of nuisance variables from fMRI data, that attenuates the contribution of non-neural physiological activity (Aquino et al., 2020). Also, it should be considered that the differences in fMRI activity and connectivity in older adults may be partially ascribed to variations in the brain hemodynamic response (Kumral et al., 2020). To address these limitations, techniques such as magnetoencephalography (MEG) and electroencephalography (EEG), which, respectively, measure macroscopic magnetic and electrical variations induced by neural activity, have being used. Despite their lower spatial resolution M/EEG higher temporal resolution permits to study the frequency-dependent variations in brain functioning, providing novel insights into the neural processes underlying aging.
MEG studies mostly reported an age-related decrease in neural power in delta (1–4 Hz), theta (4–8 Hz) and alpha (8–13 Hz), and an increase in beta (13–30 Hz) bands (Coquelet et al., 2017), which were largely replicated also using EEG (Hartikainen et al., 1992; Rossiter et al., 2014). In addition, differences in EEG connectivity in older adults were reported, but in all cases the analyses of functional interactions were conducted at the sensor level (Hartikainen et al., 1992; Moezzi et al., 2019; Rossiter et al., 2014). Sensor-based EEG connectivity analyses are commonly used; however, these are affected by the volume conductor problem (Schoffelen and Gross, 2009), which limits the interpretability of the findings (Van de Steen et al., 2019).
In this study, we aimed at examining whether: (1) the age-related changes in network connectivity, observed using fMRI, have an electrophysiological basis and can be replicated using source-reconstructed EEG data; (2) the aging process differently affects network power and connectivity in specific frequency bands.
To address these research goals, we performed a comparative analysis on high-density EEG (hdEEG) data collected in young and older adults. We reconstructed network activity and connectivity within the delta, theta, alpha, beta and gamma (30–80 Hz) bands using a recently developed automated hdEEG analysis workflow (Samogin et al., 2019, 2020), and tested the differences between age groups.
We also investigated brain–behavior relationships using bimanual coordination data collected in the same participants. We examined whether differences in RSN power and/or connectivity are related to impaired motor performance in older adults. We hypothesized the reduced motor ability observed in older adults to be associated with altered functional interactions in the SMN. In addition, we expected to find the strongest correspondence when considering neural oscillations in the beta (13–30 Hz) band, because these oscillations were previously found to be linked to SMN activity and connectivity (Rueda-Delgado et al., 2014).
Materials and Methods
Participants
The data used in this study were acquired within the framework of a bimanual coordination project, for which ethical approval was granted by the Ethics Committee of KU Leuven. The experiment was performed in accordance with the relevant guidelines and regulations, and informed consent was obtained from all participants. EEG data were collected in 24 young (age 26 ± 3 years, 13 women) and 24 older adults (age 67 ± 4 years, 10 women), all right-handed except for one older subject (young group: range 53–100; older group: range 24–100 of the Oldfield Handedness Questionnaire). All participants had no history of neurological disease and the Montreal Cognitive Assessment scores were >25 for any participant in the older group (average 28.08 ± 1.98).
Behavioral experiment
The participants performed a bimanual visuomotor task that consisted in controlling the movement of a red cursor, presented on a screen situated in front of them, by rotating two dials that they were holding with their thumb and index fingers (Fig. 1). The angular displacement of the dials was measured with a shaft encoder (250 Hz sampling frequency, accuracy 0.089°; Avago Technologies). The tempo and direction (clockwise/counterclockwise) of the rotation of the dials controlled the direction (horizontal/vertical) and the speed of the red dot. A white dot moving on the cue line was used for indicating the ideal tempo of the movement.

Bimanual coordination task. The participant sat in front of a screen holding two rotating dials. The rotation of the dials controlled the horizontal and vertical movements of a hidden cursor on the screen. The goal of the task was to move the hidden cursor along the light blue line, at the speed indicated by the white dot, which was automatically moving on the cue line. A detailed description of the setup and the experiment is given in Rueda-Delgado et al. (2019). Color images are available online.
To assess baseline motor capacity, and avoid the impact of learning a new skill, here we focused on the isofrequency condition, the synchronous and symmetric movement of the hands, at a cycling frequency of 1 Hz. This corresponded visually to a straight vertical cue line (Rueda-Delgado et al., 2019).
EEG experiment
EEG data were acquired shortly before the execution of the bimanual visuomotor task. During the EEG acquisition, each participant was asked to remain at rest for ∼3 min with eyes open, while fixating a cross in the center of a screen. HdEEG signals were recorded at 1024 Hz sampling rate using a 128-channel amplifier by ANT Neuro (Enschede, the Netherlands). Eye movements were acquired with two bipolar electro-oculography (EOG) channels. The positions of the EEG sensors were digitized using an Infrared Polaris Spectra (NDI, Ontario, Canada) in the neuronavigation Visor2 XT system (ANT).
A T1-weighted whole-head anatomical image of each participant's head was acquired using a Philips Ingenia 3T CX MR scanner with a standard head coil and a 3D-turbo field echo sequence. The scanning parameters were as follows: 182 contiguous coronal slices, in-plane resolution = 0.98 × 0.98 mm2, slice thickness = 1.2 mm, field of view = 250 × 250 mm2, TR = 9.7 ms, TE = 4.6 ms, TI = 1000 ms. Data from one older participant were excluded from the analysis because of technical issues during MR scanning.
Behavioral data analysis
The behavioral performance in the bimanual coordination task was quantified with the bimanual synchronization index (Rueda-Delgado et al., 2019), using scripts written in MATLAB® (The Mathworks). The rotation of the dials was calculated as the sine of their angular displacement, measured by the shaft encoder. The absolute power spectral density of the sinusoids was used to estimate the index, by projecting the phase differences between the dials onto the unit circle and calculating the absolute value of the mean phase difference across trials (Rueda-Delgado et al., 2019). The synchronization values range from 0 to 1, whereby perfect performance is indicated by 1.
EEG data processing and analysis
HdEEG recordings were processed using an automated analysis workflow (Fig. 2) (Liu et al., 2017; Marino et al., 2019; Samogin et al., 2019). The workflow consisted of the four steps briefly described hereunder.

Diagram showing the main analysis steps performed on the study data. The gray boxes represent the input data: hdEEG; MRI; electrode positions; behavioral performance of each participant; coordinates of the ROI in MNI space. The intermediate results are included in the white boxes, whereas the output data used for the group-level statistical analysis are in the black boxes. hdEEG, high-density electroencephalography; MNI, Montreal Neurological Institute; MRI, magnetic resonance image; ROI, regions of interest.
EEG preprocessing
To identify noisy channels in the EEG data, we calculated for each channel: (1) the variance of the signal in the frequency band (200–250 Hz), in which the contribution of neuronal activity is negligible; and (2) the minimum value of the Pearson's correlations calculated between its signal and the signals from all other channels. A given channel was classified as “noisy” if at least one of these two parameters was found to give rise to outliers according to the Tukey test. The signals of noisy channels were reconstructed by interpolating the signals of neighboring channels, as implemented in the FieldTrip toolbox.
After bandpass filtering the EEG data in 1–80 Hz, we performed a dimensionality reduction using the principal component analysis and retained the components explaining, together, at least 98% of the variance in the original data.
On this compressed dataset, we used the fast fixed-point Independent Component (IC) Analysis algorithm to identify artifactual ICs (Mantini et al., 2008). The ICs were automatically classified according to the following parameters: the correlation between the powers of the IC and of the EOG signals (ρ > 0.2); the coefficient of determination obtained by fitting the IC power with a 1/f function (R 2 > 0.95); the kurtosis of the IC time-course (kurtosis >20) (Liu et al., 2017). The ICs that were not classified as artifactual were linearly mixed to obtain the artifact-free EEG signals. Finally, the data were re-referenced by removing the mean value across channels (Liu et al., 2015).
Head model creation
A realistic head model is important for accurately projecting EEG data in the source space (Céspedes-Villar et al., 2020). To this aim, the individual MR head images were segmented in 12 compartments corresponding to brain and cerebellar gray and white matter, brainstem, cerebrospinal fluid, spongy bone, compact bone, muscles, fat, eyeballs and skin. The conductivity values of each layer were assigned based on previous literature (Haueisen et al., 1997). A 3D regular 6 mm grid, which overlapped the cortical, subcortical and cerebellar gray matter layers, was created to define the location of possible dipole sources.
EEG sensors positions were rigidly co-registered to the head contour (Liu et al., 2017; Samogin et al., 2020) and a finite element head volume conduction model was created using SimBio. This permitted the calculation of the leadfield matrix, describing the relationship between the recorded EEG signals and the cortical activity, while considering the shape and conductivity of 12 different tissues.
EEG source localization
Artifact-corrected EEG data were source reconstructed according to the head volume conduction model using the exact low-resolution brain electromagnetic tomography (eLORETA) algorithm (Pascual-Marqui et al., 2011). Source-space neural signals were estimated in a 6 mm homogeneous grid, constrained to the gray matter. The amplitude over time of each dipole was obtained as the first principal component of a single value decomposition applied to the three-dimensional vector (x, y, z) representing the dipole activity.
Power and connectivity analyses
We selected six commonly investigated RSNs: DMN, DAN, VAN, LN, SMN and VN. Based on previous studies, the coordinates of 21 core regions, in total (De Pasquale et al., 2012; Mantini et al., 2007; Samogin et al., 2020) (Fig. 3), were identified first in the Montreal National Institute (MNI) space and then projected to individual space. These center coordinates in individual space were used to define spherical regions of interest (ROI) of 6 mm radius.

Positions of the 21 seeds used for analysis. The seeds are grouped into six different networks. DMN (light blue): PCC, MPFC, lANG, rANG; DAN (yellow): lFEF, rFEF, lIPS, rIPS; VAN (dark blue): rTPJ, rIFG; LN (red): lTPJ, lIFG; SMN (green): lSMA, lS1, rS1, lS2, rS2; VN (pink): lV4v, rV4v, lV2d, rV2d. DAN, dorsal attention network; DMN, default mode network; lANG, left angular gyrus; lFEF, left frontal eye field; lIFG, left inferior frontal gyrus; lIPS, left inferior parietal sulcus; LN, language network; lS1, left primary somatosensory cortex; lS2, left secondary somatosensory cortex; lSMA, left supplementary motor area; lTPJ, left temporo-parietal junction; lV2d, left dorsal visual 2 area; lV4v, left human ventral visual 4 area; MPFC, medial prefrontal cortex; PCC, posterior cingulate cortex; rANG, right angular gyrus; rFEF, right frontal eye field; rIFG, right inferior frontal gyrus; rIPS, right inferior parietal sulcus; rS1, right primary somatosensory cortex; rS2, right secondary somatosensory cortex; rTPJ, right temporoparietal junction; rV2d, right dorsal visual 2 area; rV4v, right human ventral visual 4 area; SMN, sensorimotor network; VAN, ventral attention network; VN, visual network. Color images are available online.
The power of the six RSNs was reconstructed for each participant. We decomposed the ROI time-courses in the time-frequency domain, using the short-time Fourier transform, with Hamming window of 2 sec and 50% overlap between consecutive windows. We calculated their power spectra in the range of 1–80 Hz and reconstructed the “network power”, that is the power spectrum of each network (Vlahou et al., 2014), by averaging the power of the nodes within the same RSN.
As a next step, we analyzed the connectivity within and between RSNs. In the frequency domain, for each pair of ROIs, we removed the contribution of coherent zero-lag activity due to signal leakage, frequency-by-frequency. This procedure consisted in subtracting from one signal the part that could be instantaneously and linearly predicted by the other one (Hipp et al., 2012). Connectivity between two nodes was calculated as the Pearson correlation between their logarithmic-transformed signal-orthogonalized power envelopes. This correlation was then Fisher-transformed into z-values (De Pasquale et al., 2012; Hipp et al., 2012).
We defined the intra-network connectivity as the average connectivity value between nodes of the same network. Similarly, the inter-network connectivity was calculated as the average connectivity between all possible pairs of ROIs belonging to two different networks (Newton et al., 2011). The RSN power and connectivity analyses described previously were performed for the delta, theta, alpha, beta and gamma bands separately.
Statistical analysis
First, we compared the bimanual synchronization index obtained for young and older participants using a two-tailed Mann–Whitney U-test. The significance level was set to p < 0.05. Then, to analyze RSN power, we fitted a linear regression model to the data in order to estimate the effects of age (young; older), frequency band (delta; theta; alpha; beta; gamma) and RSN (DMN; DAN; VAN; LN; SMN; VN). Post hoc analyses, comparing the RSN power of young and older adults in each band, were performed using a two-tailed Mann–Whitney U-test with significance level set to p < 0.05. The false discovery rate (FDR) method (Benjamini and Hochberg, 1995) was used to account for multiple comparisons across bands and networks, with significance level set to p FDR <0.05.
We examined RSN connectivity using a linear regression model, testing the relative contribution of age (young; older), frequency band (delta; theta; alpha; beta; gamma), RSN (DMN; DAN; VAN; LN; SMN; VN) and connectivity type (intra-network; inter-network). For each network and frequency band, differences between intra- and inter-network connectivity were further investigated using a two-tailed Wilcoxon signed-rank test, for each group separately. For the linear model and the Wilcoxon signed-rank tests indicated previously, we averaged all the inter-network connectivity values of a given RSN. To assess differences in connectivity between the two groups, we applied a two-tailed Mann–Whitney U-test in each frequency band. For all the tests mentioned previously, the significance level was set to p < 0.05 (uncorrected) and to p FDR < 0.05 (FDR corrected).
To probe the existence of a relationship between motor ability and RSN power and connectivity, we computed the Spearman's correlation coefficients between the behavioral data and both the average network power and the intra- and average inter-network connectivity values of the SMN, in each frequency band and for the young and older adults separately. Differences between correlation values between groups were assessed using the Steiger's Z test. The correlation analysis was then extended to all the six RSNs to explore their relationships with bimanual synchronization ability. The significance level of the correlations was set to p < 0.05 (uncorrected) and to p FDR<0.05 (FDR corrected).
Results
Behavioral performance
Older adults' bimanual synchronization scores (median = 0.8587; IQR = 0.0827) showed higher variability compared with those of the young group (median = 0.896; IQR = 0.046). Furthermore, the scores were significantly lower in the older group, as revealed by a Wilcoxon signed-rank test (Fig. 4).

Bimanual synchronization values. Bimanual synchronization indices, for young (black shaded boxplot) and older (red shaded boxplot) adults, were extracted from the behavioral data. The higher the value, the higher the ability of the participant to perform the requested bimanual movement. Color images are available online.
Network power
The power spectra of the six RSNs under investigation presented common features, such as higher power in the delta band, a prominent peak in the alpha and a second one in the beta (Fig. 5). Accordingly, a linear regression model fitting the RSN power values evidenced a significant contribution of age and frequency band, but not of RSN (Supplementary Table S1).

Power spectra of the six RSNs. The amplitude of the power spectra is given for the young and older adults, separately. Average values are indicated with black and red lines, respectively, with surrounding shaded areas showing the standard error. Clockwise from top left: DMN, DAN, VAN, VN, SMN and LN. RSNs, resting state networks. Color images are available online.
A more detailed analysis of the frequency bands that mostly contributed to the differences between age groups (Fig. 6 and Supplementary Table S2) revealed increased power in the higher frequencies in the older participants, particularly for the DAN in the beta and the VN in the gamma band. Conversely, the power of these networks decreased with age in the theta for the DAN, and in the alpha band for the VN. However, none of those differences in RSN power remained significant after FDR correction. In general, young adults had higher RSN power in lower frequency bands. This effect was robust in the theta band for SMN and LN, and also in the delta band for the latter network. In addition, it was significant before FDR correction in the theta band for the VAN.
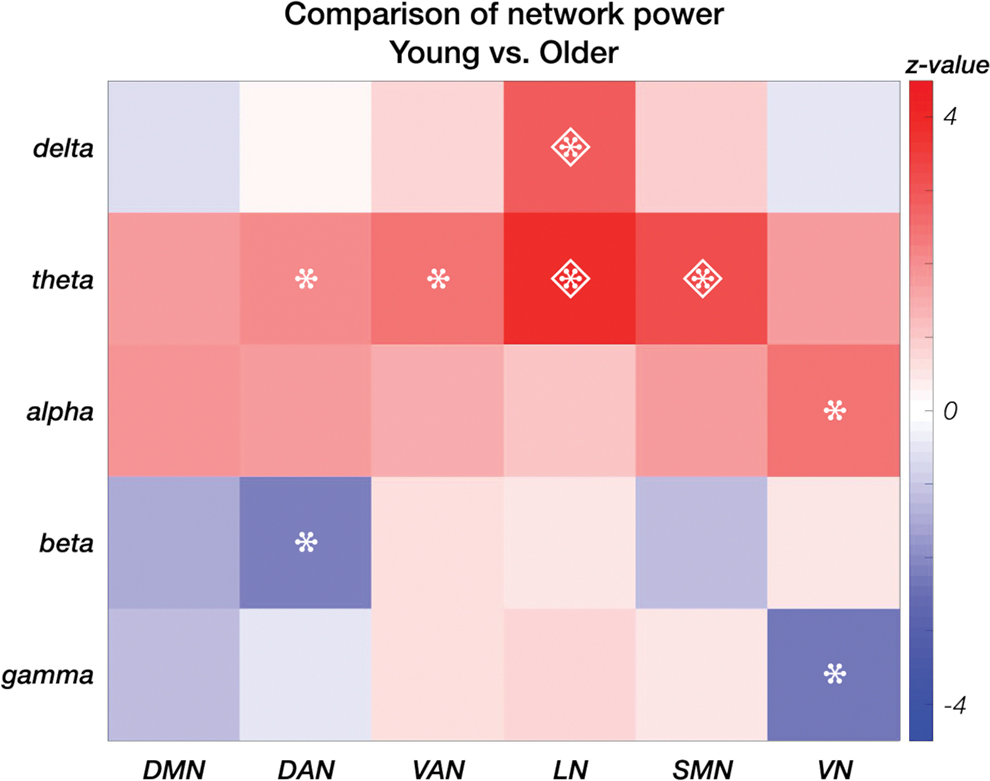
Difference in average network power between young and older adults. Power differences are presented in the delta, theta, alpha, beta and gamma bands for each network—DMN, DAN, VAN, LN, SMN and VN—separately. Significant power differences at p < 0.05 are marked with asterisks, those at p FDR<0.05 with a diamond. Color images are available online.
Network power and behavioral performance
The trends of correlations between bimanual coordination index and RSN power were different depending on the age group. For the young participants (Fig. 7A), we found that only VAN power in the delta band related to worse performance in the motor task (Supplementary Table S3). For the older participants (Fig. 7B), instead, we observed a dual trend: positive correlations in the alpha band for VN power and in the beta band for DMN and LN power, and negative correlations in the delta band for DAN and SMN power (Supplementary Table S4). It should be noted, however, that none of the correlations previously mentioned remained significant after correction for multiple comparisons.

Correlation values between bimanual synchronization and network power. Spearman's correlation coefficients were evaluated using average network power in the delta, theta, alpha, beta and gamma bands, and for the six networks—DMN, DAN, VAN, LN, SMN and VN.
RSN functional interactions
A linear regression model fitted to the connectivity values revealed a significant contribution of all the factors: frequency band, connectivity type, age and RSN (Supplementary Table S5).
Intra- and inter-network connectivity values showed different patterns across frequency bands and age groups (Fig. 8); in particular, older adults had generally higher connectivity in the delta and theta bands, whereas young adults had stronger connectivity in the alpha and gamma bands. Post hoc analyses conducted using the Wilcoxon signed-rank test highlighted that the conditions for which intra-network connectivity was stronger than inter-network connectivity were largely similar between the two groups; the only exceptions were the DMN in the alpha band and the LN in the theta band, where intra-network connectivity was stronger only in the young adults (Fig. 8A and Supplementary Table S6).

Functional connectivity values between all possible pairs of networks. In each frequency band—delta, theta, alpha, beta and gamma—the matrices represent the average values for the group of
Intra-network connectivity of VN in the beta band was larger than inter-network connectivity only for the young group (Fig. 8A and Supplementary Table S6), whereas intra-network connectivity of VAN in the gamma and of SMN in the beta band were significantly higher than the corresponding inter-network connectivity values only for the older adults (Fig. 8B and Supplementary Table S7). Finally, for both age groups, we found larger intra- than inter-network connectivity for the DAN in the alpha and the beta bands, for the SMN in the theta and alpha bands, and for the VN in the alpha band.
Significant differences in connectivity values between the young and older adults were found in all bands (Fig. 9 and Supplementary Table S8). In addition, inter-network connectivity was generally stronger in the older age group, although only very few differences remained significant after correction for multiple comparisons. In older adults, the significantly higher connectivity involved only interactions between networks. In particular, the stronger connections involved DMN and DAN in the gamma band; SMN and DAN in the delta, LN in the theta, and VN in the alpha band; VN and LN and VAN in the alpha band. The young adults, instead, showed stronger connectivity within the VN in the alpha and beta bands, and between the LN and DMN and SMN in the gamma band (Fig. 9 and Supplementary Table S8).

Differences in network connectivity values between young and older adults. In the delta, theta, alpha, beta and gamma frequency bands, the matrices represent the z-values obtained using a Mann–Whitney U-test on values of young and older adults, respectively, in the DMN, DAN, VAN, LN, SMN and VN. z-Values that are significant at p < 0.05 are indicated with asterisks, and those significant at p FDR <0.05 with diamonds. Color images are available online.
Network connectivity and behavioral performance
Band-specific SMN connectivity and bimanual coordination levels showed clear trends of (anti)correlations (Fig. 10). In particular, higher SMN connectivity in the beta band was significantly associated with higher synchronization scores (Supplementary Table S9) for the older adults, and with lower scores for the young group; however, the latter were not significant (Fig. 10 and Supplementary Fig. S1). For both the intra- and the inter-network SMN connectivity, we found a clearly different association with bimanual coordination ability, depending on the age group (Steiger's Z test, z intraSMN = −2.274, p intraSMN = 0.011 and z interSMN = −2.25, p interSMN = 0.012).
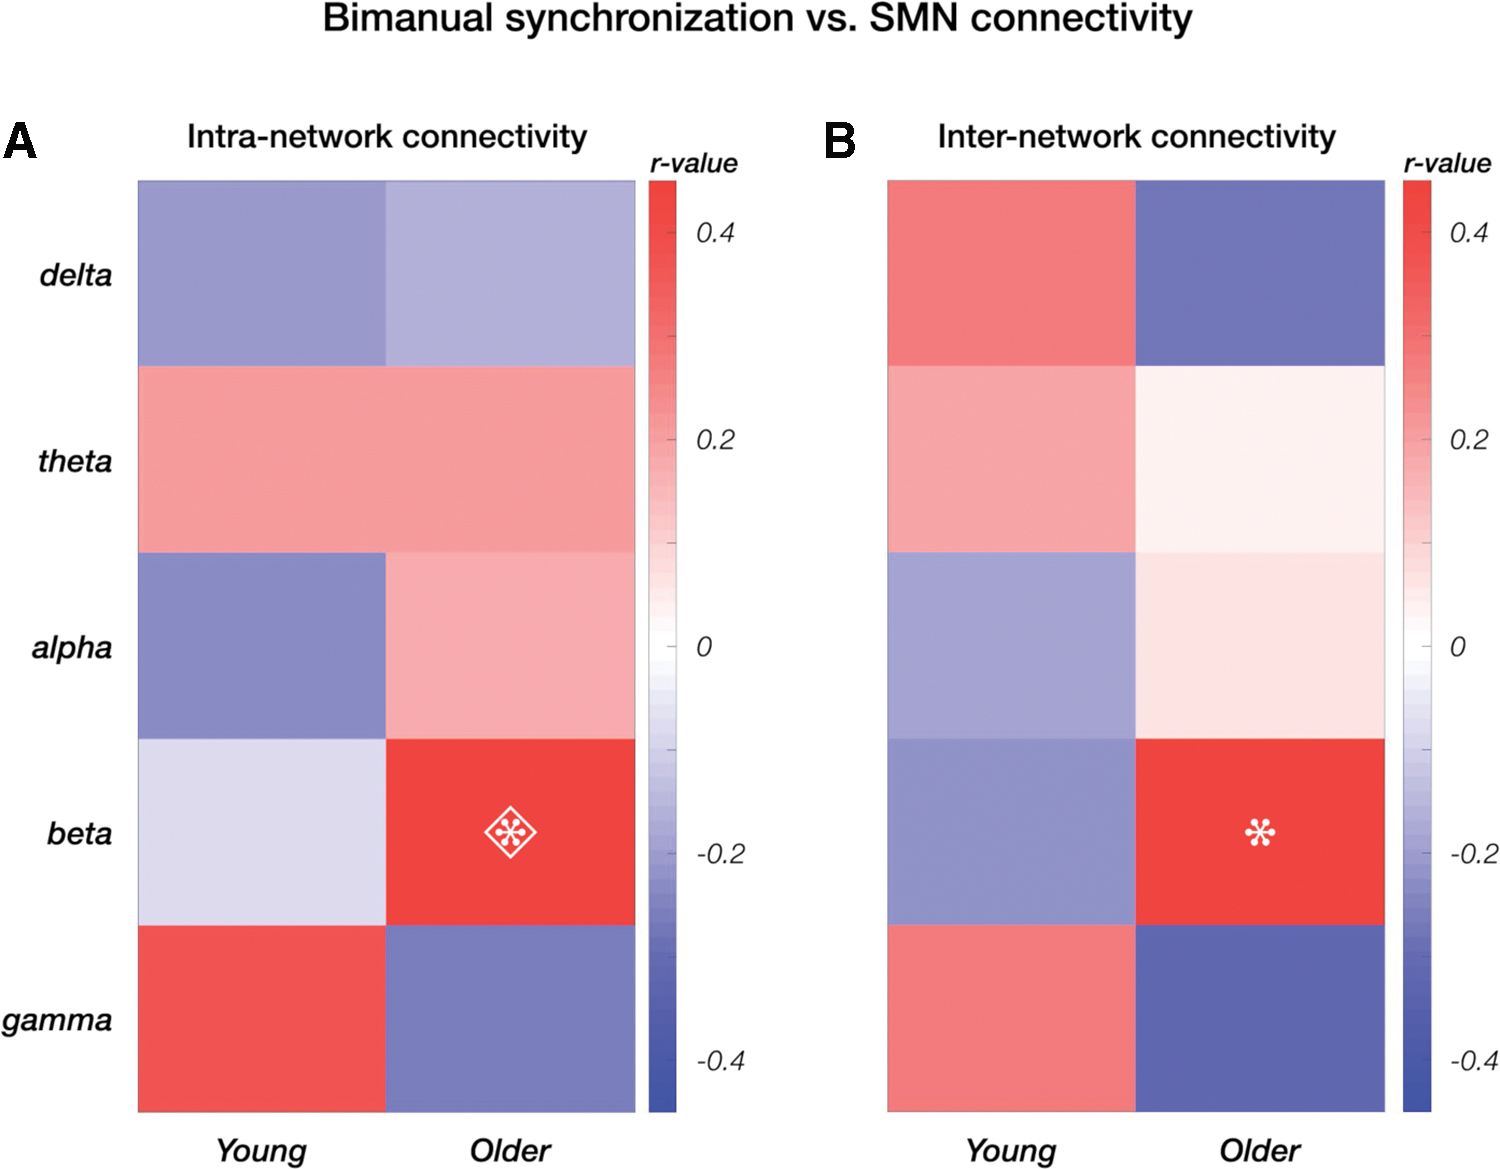
Correlation values between bimanual synchronization and connectivity of SMN nodes. The analysis was conducted for
We then extended the correlation analysis to the other RSNs. We considered first the beta band (Supplementary Fig. S2) and then included the other frequencies for exploratory reasons (Supplementary Figs. S3 and S4, Supplementary Tables S11 and S12). This additional analysis, although not remaining significant after FDR correction, confirmed that the strongest positive correlation values were found in the beta band. For older individuals (Supplementary Table S10), connectivity within DAN and SMN, as well as between DAN and DMN, VAN, LN and SMN, predicted more accurate motor performance, as did the connectivity between SMN and DMN and VAN. Furthermore, connectivity between SMN and VN in the delta band and between DAN and VAN and LN in the gamma band were related to less accurate motor performance.
Discussion
In this study we investigated age-related changes of power and connectivity in brain networks, and specifically tested whether the “de-differentiation hypothesis”, proposed in previous fMRI studies (King et al., 2018; Monteiro et al., 2019), is supported by electrophysiological evidence. Moreover, we examined to what extent altered band-limited power and/or connectivity in older adults is related to impaired motor performance. The main novelty of our study is the use of hdEEG to evaluate age-related differences in frequency-dependent functional connectivity within and between several RSNs, following a methodology previously applied to data from young adults (Samogin et al., 2020; Taberna et al., 2021).
Our results highlighted a general decrease of power in delta, theta and alpha bands for older as compared with young adults, and an increase of power in beta and gamma bands, only for specific brain networks. Our connectivity analysis provided evidence that the level of network segregation decreases with age. Although this result is in line with the “de-differentiation hypothesis” and is coherent with previous fMRI findings, it depended on the frequency band and, to some extent, on the brain networks considered. Variations in power amplitudes across participants did not show a clear pattern of correlation with the bimanual synchronization index, which was, instead, related to network connectivity, particularly in the beta band.
Network power in young and older adults
The power spectra of the RSNs under investigation showed a similar profile in the young and older age groups (Fig. 5), with differences mostly in theta, alpha and beta bands. Particularly, it was lower in theta and alpha and higher in beta and gamma bands in the older group, but only for some networks (Fig. 6). Previous resting-state M/EEG studies documented similar age-related differences in neural power for delta, theta (Hartikainen et al., 1992), alpha (Ishii et al., 2018) and beta bands (Barry and De Blasio, 2017) without clarifying to which networks these variations could be attributed.
Such power modulations were associated with age-related impairments, specifically higher power in the delta and theta bands predicted cognitive decline (Hartikainen et al., 1992) and lower power in the beta band reflected alertness deficit (Ishii et al., 2018). Considering that the aging brain often presents a loss of structural integrity in the white and gray matter (Marstaller et al., 2015), it has been argued that these power differences are a consequence of an overall structural decline (Martin et al., 2015). Few studies have so far investigated the influence of structural modifications on neural activity (Webb et al., 2020), therefore it is still unclear how they affect network power in specific frequency bands.
Age-related differences in network connectivity
fMRI studies suggested that RSNs are more interconnected in older than young individuals (King et al., 2018; Monteiro et al., 2019; Solesio-Jofre et al., 2014). Although the frequency bands supporting stronger intra-network connectivity were largely overlapping in young and older adults (Fig. 8), the direct comparison of their connectivity patterns (Fig. 9) revealed age-related differences mainly involving inter-network interactions. Besides the significantly lower connectivity within the VN, in the alpha and beta bands, older adults showed general stronger inter-network connectivity in the delta and theta bands (Vecchio et al., 2014), whereas the opposite trend was observed in the gamma band. In the alpha band, inter-network connectivity in older adults was generally reduced for most of the networks, with the exception of VN.
The network- and frequency-specific differences between young and older adults could be partially attributed to the structural decline in the anatomical pathways through which the neural signals reach the network nodes (Ferreira and Busatto, 2013). It has been suggested that functional reorganization may take place to counterbalance the anatomical decline (Marstaller et al., 2015), or as a consequence of the disruption in long- and short-range connections (Ferreira and Busatto, 2013). Future studies combining hdEEG measures with structural MRI may permit investigating the relation between frequency-specific functional and anatomical changes (Marstaller et al., 2015), aiming at clarifying whether a higher level of network differentiation is key to preserve the functionality of the aging brain.
Associations with behavioral performance
Correlations between bimanual synchronization and RSN power were generally stronger, significant for all networks (except VAN) and several frequency bands (delta, alpha and beta) for older adults (Fig. 7B), whereas only VAN power in the delta band was related to worse motor performance across young participants (Fig. 7A). This could possibly reflect a different level of activity in a resting condition, which then influences motor performance (Ishii et al., 2018).
For the SMN, it has been suggested that beta-band power at rest may relate to the inhibition–-excitation balance (Heise et al., 2013; Rossiter et al., 2014). The higher levels of intracortical GABAergic activity observed in the motor cortex of older adults may lead to higher resting beta power, and concurrently reduce task-dependent plasticity (Rossiter et al., 2014). A reduction in modulatory capacity has also been associated to lower GABAergic neurotransmission at rest, causing a decline in motor performance (Heise et al., 2013). Although the precise age modulation in the inhibitory mechanism is not yet fully understood, the balance between the two neurotransmitters is thought to determine the capacity for plasticity (Tatti et al., 2017) and consequently the motor ability throughout the lifespan.
Similar to the power measures, network connectivity values correlated differently with the bimanual synchronization measures (Fig. 10 and Supplementary Figs. S1–S4). Overall, our findings are in line with recent fMRI studies showing that connectivity at rest is related to motor performance, both in young and older participants (Babaeeghazvini et al., 2019; King et al., 2018; Mary et al., 2017). Most of those studies, however, focused on connectivity within SMN rather than between different networks. Motor performance was found to be correlated with connectivity in the beta band, both within DAN and SMN, and between these and other networks (Supplementary Figs. S2 and S3).
Our results lend support to the “compensation hypothesis” concerning the aging brain (Cabeza et al., 2018). Indeed, they suggest that a compensatory mechanism, involving task-relevant networks and frequencies, could have maintained the older participants' performance at a fairly high level (Fig. 4) and shaped the functional interactions at rest. Of note, the networks whose stronger functional connections correlated with better bimanual synchronization (Supplementary Fig. S2) did not show significant differences between the two groups (Fig. 9), which might reflect the fact that “de-differentiation” and “compensation” may involve different processes, rather than being mutually exclusive in the context of the aging brain.
Study limitations
First, we defined neural oscillations based on standard frequency intervals, from which we calculated RSN power and connectivity in the two age groups. It might be helpful to replicate the current findings using frequency bands defined according to the individual alpha peak, whose frequency decreases with age (Scally et al., 2018). This would help clarifying whether aging truly modulates network power and connectivity or rather shifts them towards slower frequencies.
Second, the limited cohort of participants we used, combined with the great variability of the age-induced brain modifications (Cabeza et al., 2018), might require a larger number of participants to ensure sufficient statistical power. Indeed, statistical results that did not remain significant after correction for multiple comparisons might be because of the relatively small sample size.
Finally, we investigated power and connectivity differences at group level using a cross-sectional study design. However, to properly detect age-related changes in cortical activity, longitudinal studies might be preferred (Damoiseaux, 2017), particularly when focusing on the resting state condition, where brain activity can easily vary within and between subjects.
Conclusion
We investigated electrophysiological differences in resting-state brain networks between young and older adults. We showed how these differences are network and, most importantly, frequency dependent. In line with the “de-differentiation hypothesis”, aging more strongly affected inter- rather than intra-network connectivity. Consistent with the “compensation hypothesis”, our results also suggested a relation between age-related alterations in motor performance and in the resting-state connectivity pattern of the SMN, specifically for the beta band. Future research is warranted to clarify to what extent and how the sensory and cognitive decline can be explained by alterations in network connectivity.
Footnotes
Authors' Contributions
J.S., L.R.D., G.T., S.S. and D.M. wrote and reviewed the article; L.R.D. performed the measurements; J.S., G.T., D.M. and S.S. conceived and implemented experimental procedures and scripts for analyses; D.M. and S.S. provided the financial support to the study.
Author Disclosure Statement
No competing financial interests exist.
Funding Information
The work was supported by the KU Leuven Special Research Fund (Grant No. C16/15/070); the Research Foundation Flanders (FWO) (Grant Nos. G0F76.16N, G0936.16N, and I0050.18N, excellence of science Grant No. EOS.30446199); and the Italian Ministry of Health (Grant No. RF-2018-12366899).
Supplementary Material
Supplementary Figure S1
Supplementary Figure S2
Supplementary Figure S3
Supplementary Figure S4
Supplementary Table S1
Supplementary Table S2
Supplementary Table S3
Supplementary Table S4
Supplementary Table S5
Supplementary Table S6
Supplementary Table S7
Supplementary Table S8
Supplementary Table S9
Supplementary Table S10
Supplementary Table S11
Supplementary Table S12
References
Supplementary Material
Please find the following supplemental material available below.
For Open Access articles published under a Creative Commons License, all supplemental material carries the same license as the article it is associated with.
For non-Open Access articles published, all supplemental material carries a non-exclusive license, and permission requests for re-use of supplemental material or any part of supplemental material shall be sent directly to the copyright owner as specified in the copyright notice associated with the article.