
Abstract
Introduction:
Structural alterations in cortical thickness and the microstructural organization of white matter are independently associated with non-dependent alcohol consumption and bipolar disorder (BD). Identifying their interactive and network-level effects on brain topology may identify the impact of alcohol on reward and emotion circuitry, and its contribution to relapse in BD.
Materials and Methods:
Thirty-four BD-I (DSM-IV-TR) and 38 healthy controls (HC) underwent T1 and diffusion-weighted magnetic resonance imaging scanning, and the Alcohol Use Disorders Identification Test-Consumption to assess alcohol use. Connectomes comprising 34 cortical and 9 subcortical nodes bilaterally (Freesurfer v5.3) connected by fractional anisotropy-weighted edges derived from non-tensor based deterministic constrained spherical deconvolution tractography (ExploreDTI v4.8.6) underwent permutation-based topological analysis (NBS v1.2) and were examined for the effects of alcohol use and diagnosis-by-alcohol use accounting for age, sex, and diagnosis.
Results:
Alcohol was significantly related to a subnetwork, encompassing connections between fronto-limbic, basal ganglia, and temporal nodes (F range = 5–8.4, p = 0.031) and it was not detected to have an effect on global brain integration or segregation. A portion of this network (18%), involving cortico-limbic and basal ganglia connections, was differentially impacted by alcohol in the BD relative to the control group (F range = 5–8.8, p = 0.033), despite the groups’ consuming similar amounts of alcohol (BD: mean ± standard deviation 4.95 ± 3.0; HC 3.62 ± 3.0, T = 1.88, p = 0.06).
Discussion:
Non-dependent alcohol use impacts brain architectural organization and connectivity within salience, reward, and affective circuitry. The relationship between alcohol use and topology of the network in BD suggests an interactive effect between specific biological vulnerability and alcohol use, which may explain the susceptibility to an increased risk of relapse in the disorder.
Impact statement
The association between non-dependent alcohol use and neural architecture in bipolar disorder (BD) is unknown, despite the poor clinical trajectory and increased likelihood of relapse associated with alcohol use in BD. We demonstrate that together alcohol and a diagnosis of BD is associated with a subnetwork involving nodes of the cortico-limbic and reward networks. This subnetwork, demonstrated in BD and absent in controls, differentially involves nodes that are specific to reward and emotion processes. This suggests a diagnosis-specific biological vulnerability for alcohol use and may be consistent with known mood lability and thus relapse associated with alcohol use in BD.
Introduction
Alcohol use is commonplace in Irish society; in a 12-month period, 77% of the population consumed alcohol: 6.9% of this figure reached criteria for alcohol dependence, in comparison to global 12-month prevalence rates of 2.2–5.1% (Glantz et al., 2020; O'Dwyer et al. 2021; Rehm and Shield, 2019). Alcohol use disorders (AUDs) and alcoholism are associated with negative impacts to the brain (Koob and Volkow, 2016); however, the topological impacts of non-dependent alcohol use on neuroanatomical organization remain unknown.
Structural alterations in cortical thickness and the microstructural organization of white matter are described independently after alcohol consumption (Lange et al., 2016; Topiwala et al., 2017) and bipolar disorder (BD) (Favre et al., 2019; Hibar et al., 2018). Moreover, alcohol use in BD is associated with impaired clinical progress and increased depressive and (hypo)manic episodes, suggesting a differential impact relative to healthy controls (HC) (Gordon-Smith et al., 2020).
We move beyond traditional locationist approaches to investigate the interactive effects of alcohol use with a diagnosis of BD on brain network topology. This may elucidate the relationships between alcohol use and relevant complex human behaviors such as reward seeking and emotion regulation. Using structural and diffusion-weighted magnetic resonance imaging (MRI), we examine whether non-dependent alcohol consumption impacts brain architectural organization, and whether the effects are different in BD relative to a group of HC.
Non-dependent alcohol use is associated with volumetric reduction of the hippocampus (Meda et al., 2019; Topiwala et al., 2017) and middle and inferior frontal gyri (Meda et al., 2017; Taki et al., 2006), and cortical thinning of medial and dorso-lateral prefrontal cortices as well as parieto-occipital areas (Lange et al., 2016; Morris et al., 2019) (Table 1). These structures have established roles within reward and limbic circuitry; imbalance within these networks may result in difficulty regulating the rewarding experience of alcohol, thus impacting emotional regulation (Koob and Volkow, 2016).
Alterations to Gray and White Matter Associated with Non-dependent Alcohol Use
Effect size not defined in literature.
Effect sizes not given in literature.
ACC, anterior cingulate cortex; AUDIT-(C), Alcohol Use Disorders Identification Test (Consumption); CAGE, Cut, Annoyed, Guilty and Eye-Opener; dlPFC, dorsolateral prefrontal cortex; FA, fractional anisotropy; L, left; MRI, magnetic resonance imaging; OFC, orbitofrontal cortex; R, right; R 2, percentage of variance attributable to non-dependent alcohol use; SCID, Structured Clinical Interview DSM-V; SSAGA, semi-structured assessment for the Genetics of Alcoholism; ΔR 2, change in R 2 or change in percentage of variance attributable to non-dependent alcohol use; SD, standard deviation; η 2, partial eta squared; ↓, reduction; ↔, no difference; TBSS, Tract Based Spatial Statistics.
College-age participants who engage in binge alcohol use (>6 unit of alcohol in one sitting) demonstrate differential impacts to white matter tracts for men and women; a number of these tracts are associated with reward and emotion regulation processes (Smith et al., 2008). Moreover, alterations in white matter microstructural organization have also been found within the corpus callosum in association with non-dependent alcohol use (Topiwala et al., 2017).
Despite Topiwala and associates (2017) and Meda and associates (2019) demonstrating that increasing yet non-dependent alcohol consumption was associated with a higher risk of hippocampal atrophy, Naglich and colleagues (2018) found no relationship between drinks per week and hippocampal volume in a large sample. However, post hoc investigations demonstrated that only participants who scored highly for depressive symptoms showed a reduction in hippocampal volume, suggesting that vulnerability toward mood dysregulation may interact with alcohol use.
However, these studies do not provide information on the topology of the brain's network in association with non-dependent alcohol use: Using a network neuroscience approach to guide this research can further our understanding on the interactive effects between brain and reward-related behavior.
The utility of network analysis has been demonstrated in BD studies, where findings of structural dysconnectivity and reductions in cortical thickness have been expanded on to encompass topological alterations associated with the disorder, which can be related to complex symptomology (Ajilore et al., 2015). The network in BD demonstrates reductions in the global efficiency of information relay (Collin et al., 2016), as well as local inefficiency of information transfer between nodes belonging to the limbic network (Donoghue et al., 2017).
At the mesoscale, a differentially connected subnetwork including structures involved in emotional regulation and reward, as well as divergent rich-club connectivity has been demonstrated (Nabulsi et al., 2019). Moreover, some of the variance in the structural connectome is explained by cognitive deficits in participants with BD (Ajilore et al., 2015); alterations in intelligence measures are likely to be associated with selective changes in global network structure (McPhilemy et al., 2020).
Changes in patterns of global, local, and mesoscale connectivity demonstrate how the interaction of topologies help us understand contributions to complex mental health diagnoses. Applying a network analysis to the brain topology in association with alcohol use may elucidate interactive effects that impact reward, or limbic circuitry as well as the observed increased vulnerability to relapse (Gordon-Smith et al., 2020).
Changes in network topology in association with environmental impacts such as alcohol use, or the biological influences of mood disorders such as BD, may identify disruptions to information segregation and integration across the network, thus increasing the cost of transition between brain states and potentially impacting behavior (Shine and Poldrack, 2018). The use of alcohol can impact behavior through induction of feelings of pleasure and liking for alcohol and promote a desire to consume more alcohol while intoxicated (Gilman et al., 2008).
Moreover, BD is also associated with heightened reward sensitivity and is associated with increased impulsivity, contributing to emotional symptomatology within the disorder (Whitton et al., 2016). Therefore, understanding the network topology associated with a diagnosis of BD and non-dependent alcohol use may potentially contribute to our mechanistic understanding of the vulnerability to relapse in BD.
We aim at identifying a subnetwork associated with alcohol use through the use of a permutation-based search of network connections, and at determining whether there is a different relationship in those with BD; moreover, we aim at investigating the effect of alcohol use overall on global network topology. We use the Alcohol Use Disorders Identification Test-Consumption (AUDIT-C): a tool validated to assess the frequency and amount of alcohol use (Bush et al., 1998), structural T1-weighted and high angular resolution diffusion-weighted MRI, and a constrained spherical deconvolution (CSD) technique to recreate white matter trajectories to provide more reliable fiber reconstruction (Tournier et al., 2008).
We expect that alcohol use will be associated with a subnetwork of the brain, involving reward and limbic nodes, which will be differently connected in those with BD in comparison to controls. In addition, we expect that independently, alcohol use will be associated with alterations in global network connectivity.
Materials and Methods
Participants
Participants are a subsample derived from a larger group identified in Nabulsi and colleagues (2019). All participants underwent a Structured Clinical Interview (SCID), patient or control edition, conducted by a registered psychiatrist. A diagnosis of BD (I or II) as determined by DSM-IV (American Psychiatric Association, 2000) criteria was confirmed for all BD participants. All participants were admitted to the study if they were aged 18–65 years, HC had no diagnosis of any Axis-I disorder, no first-degree relative with a diagnosed mental health condition, and no current or history of medication use for depression or anxiety. Ethical approval was granted by the Galway University Hospital Clinical Research Ethics Committee.
Exclusionary criteria for all participants were: a history of AUD or dependence, a loss of consciousness lasting more than 5 min, pregnancy or breastfeeding, any heart problems, or uncontrolled blood pressure. All participants gave written consent, and ethical approval was granted by the Galway University Hospital Clinical Research Ethics Committee.
Assessment of alcohol use
The AUDIT-C is a validated scale arising from the first three questions of the larger 10 question AUDIT (Bush et al., 1998). The scale quantifies frequency and amount of alcohol use, as well as frequency of binge drinking episodes (≥6 standard drinks in one episode). Each item is scaled from 0 to 4, with a maximum score of 12. According to the Irish government drinking guidelines, a standard drink contains 10 g of alcohol; within an Irish population, a score of ≥5 on the AUDIT-C indicates possible hazardous use (Long and Mongan, 2013). The AUDIT-C has been validated as a screening tool for a range of alcohol uses in a variety of settings (Kaarne et al., 2010).
Assessment of severity of signs and symptoms
The Hamilton Depression Rating Scale (HDRS) is used to objectively and reliably quantify depressive episodes (Hamilton, 1960; Trajkovi et al., 2011). The questions are clinician rated, with a range of 0–53; a score of ≤8 indicates the absence of depressive symptoms (Chengappa et al., 2003). The Young Mania Rating Scale (YMRS) has excellent reliability and validity indices for the identification of (hypo)manic symptoms (Young and Meyer, 1978). Scoring is based on ratings during a clinical interview; a score of <7 indicates euthymia in the BD participants (Chengappa et al., 2003).
MRI acquisition
All MRI scans were acquired by using a high-resolution 3T Achieva scanner (Philips Medical Systems, Netherlands) with an 8-channel head coil. A structural T1-weighted Magnetization Prepared Rapid Acquisition Gradient Echo (MPRAGE) sequence was acquired. The parameters for this image acquisition were as follows: echo time (TE) 3.9 msec; repetition time (TR) 8.5 msec; flip angle 8°; slice thickness of 1 mm, 180 slices.
A diffusion-weighted scan was performed by using high angular resolution (HARDI) with 61 diffusion directions. The acquisition parameters were: field of view (FOV): 198 × 259 × 125 mm, 66 slices, no gap, spatial resolution: 1.8 × 1.8 × 1.9 mm, matrix size: 144 × 144, TR/TE = 514/59 msec, flip angle = 90°, half k-space acquisition was used (half scan factor = 0.681), SENSE parallel imaging (factor = 2.5, b = 1200 s/mm2), and 1200 sec/mm2, with SPIR fat suppression and dynamic stabilization in an image acquisition time of 17 min and 34.5 sec.
Construction of network matrices
Diffusion-weighted images were corrected for eddy current distortions, motion artefacts, and susceptibility effects by using ExploreDTI (Leemans et al., 2009). All images were inspected for correct registration and quality; none were excluded based on quality inspection. White matter streamlines were reconstructed by using deterministic nontensor-based CSD (L max = 6) (Tournier et al., 2008). The RESTORE approach was used to perform diffusion eigenvector estimation (Chang et al., 2005). Fiber tracking began in each voxel and continued with a 1 mm step size and a 2 mm3 seed point resolution, >30° angle curvature threshold, and 20–200 mm length and was terminated at a minimum fractional anisotropy (FA) of 0.2.
The “edges” of the connectivity matrices were defined as the recreated fiber tracts. The T1-weighted images were processed to correct for motion, intensity normalization, removal of non-brain tissue, and transformation to Talairach image space (Dale et al., 1999). Images were then segmented into gray and white matter through tessellation of the boundaries of gray and white matter and surface deformation in subject-specific space by using Freesurfer (v5.3.0) (Fischl, 2012).
All images were inspected for accurate segmentation and parcellation at the gray/white matter boundaries. The cortex was parcellated into 34 cortical and 9 subcortical brain regions bilaterally in subject-specific space based on the Desikan-Killiany atlas: These labels defined the nodes of the network matrices (Desikan et al., 2006). Edge and node information were combined to create binary and FA-weighted connectivity matrices for each participant by using ExploreDTI (Leemans et al., 2009).
Analysis of subnetwork connectivity
An analysis of a connected component associated with an effect of alcohol across all participants on FA-weighted networks, and for an interactive effect of alcohol and diagnosis was undertaken through permutation testing of graph connections while controlling for the familywise error rate using Network Based Statistic (NBS) (Zalesky et al., 2010). A test statistic (regression model adjusting for age, sex, and diagnosis) was computed to test for the extent and intensity of connectivity strength differences associated with AUDIT-C score, and an interaction between diagnosis and AUDIT-C score (M = 5000, p = 0.05), threshold of F > 5 was used to obtain a set of suprathreshold connections (Zalesky et al., 2010). Images of the subnetwork were obtained by using NeuroMArVL.
Statistical analyses
Group differences in demographic, clinical data, and graph theory measures were assessed by using the Chi-squared test for categorical data (sex, education status, hazardous drinking, and frequency of binge drinking) or T-tests for normally distributed continuous data (AUDIT-C). Global and small world property measures derived from weighted and unweighted matrices included global efficiency (Eglobal), characteristic path length, density, clustering coefficient, strength, and small worldness and were generated from connectivity matrices by using Brain Connectivity Toolbox software (Rubinov and Sporns, 2010) accessed through MATLAB (v.R2015b; The MathWorks, 2015).
The Mann–Whitney U was used with non-normally distributed continuous data (age at MRI, HDRS, YMRS, and graph theory measures). Hierarchical multiple regression analyses were conducted to assess the relationship with AUDIT-C score and global graph metrics, controlling for age, sex, and diagnosis. An additional multiple regression was conducted with an interaction term between AUDIT-C and diagnosis. A post hoc analysis of covariance (ANCOVA) was undertaken to assess whether medication (lithium or anti-psychotic use), socioeconomic status, or mood scores explained the relationships found. Statistical analyses were performed by using SPSS software (v.24; IBM Corp., USA).
Results
Sample demographics and clinical characteristics
A total of 72 participants took part in this study: 38 HC and 34 BD (29 BD-I, 5 BD-II). There was no difference between the diagnostic groups with regard to age, sex, or smoking status; there was, however, a difference in socioeconomic status, with HC more likely to report a higher status (Table 2). There was a significant difference between the diagnostic groups for depressive symptoms on the HDRS (U = 258, p < 0.001). Of the 34 BD participants, the majority were euthymic at the time of scanning (n = 23, 68%). There was no difference found for (hypo)manic symptoms assessed by using the YMRS between the diagnostic groups.
Sample Demographics and Clinical Characteristics
SE was assessed by using the Hollingshead scale (Hollingshead, 2011): YMRS.
f, female; HC, healthy controls; HDRS, Hamilton Depression Rating Scale; m, male; SE, socio-economic status; YMRS, Young Mania Rating Scale.
Comparable alcohol use scores between HC and bipolar participants
There was no difference between the groups’ AUDIT-C scores (Fig. 1), demonstrating that HC and BD participants had comparable alcohol use scores. There was no difference in the likelihood of participants to consume alcohol at potentially hazardous amounts, scoring >5 (χ 2 = 2.299, p = 0.129). The groups reported a similar frequency of binge drinking episodes, defined as consuming six or more alcoholic drinks in one sitting.
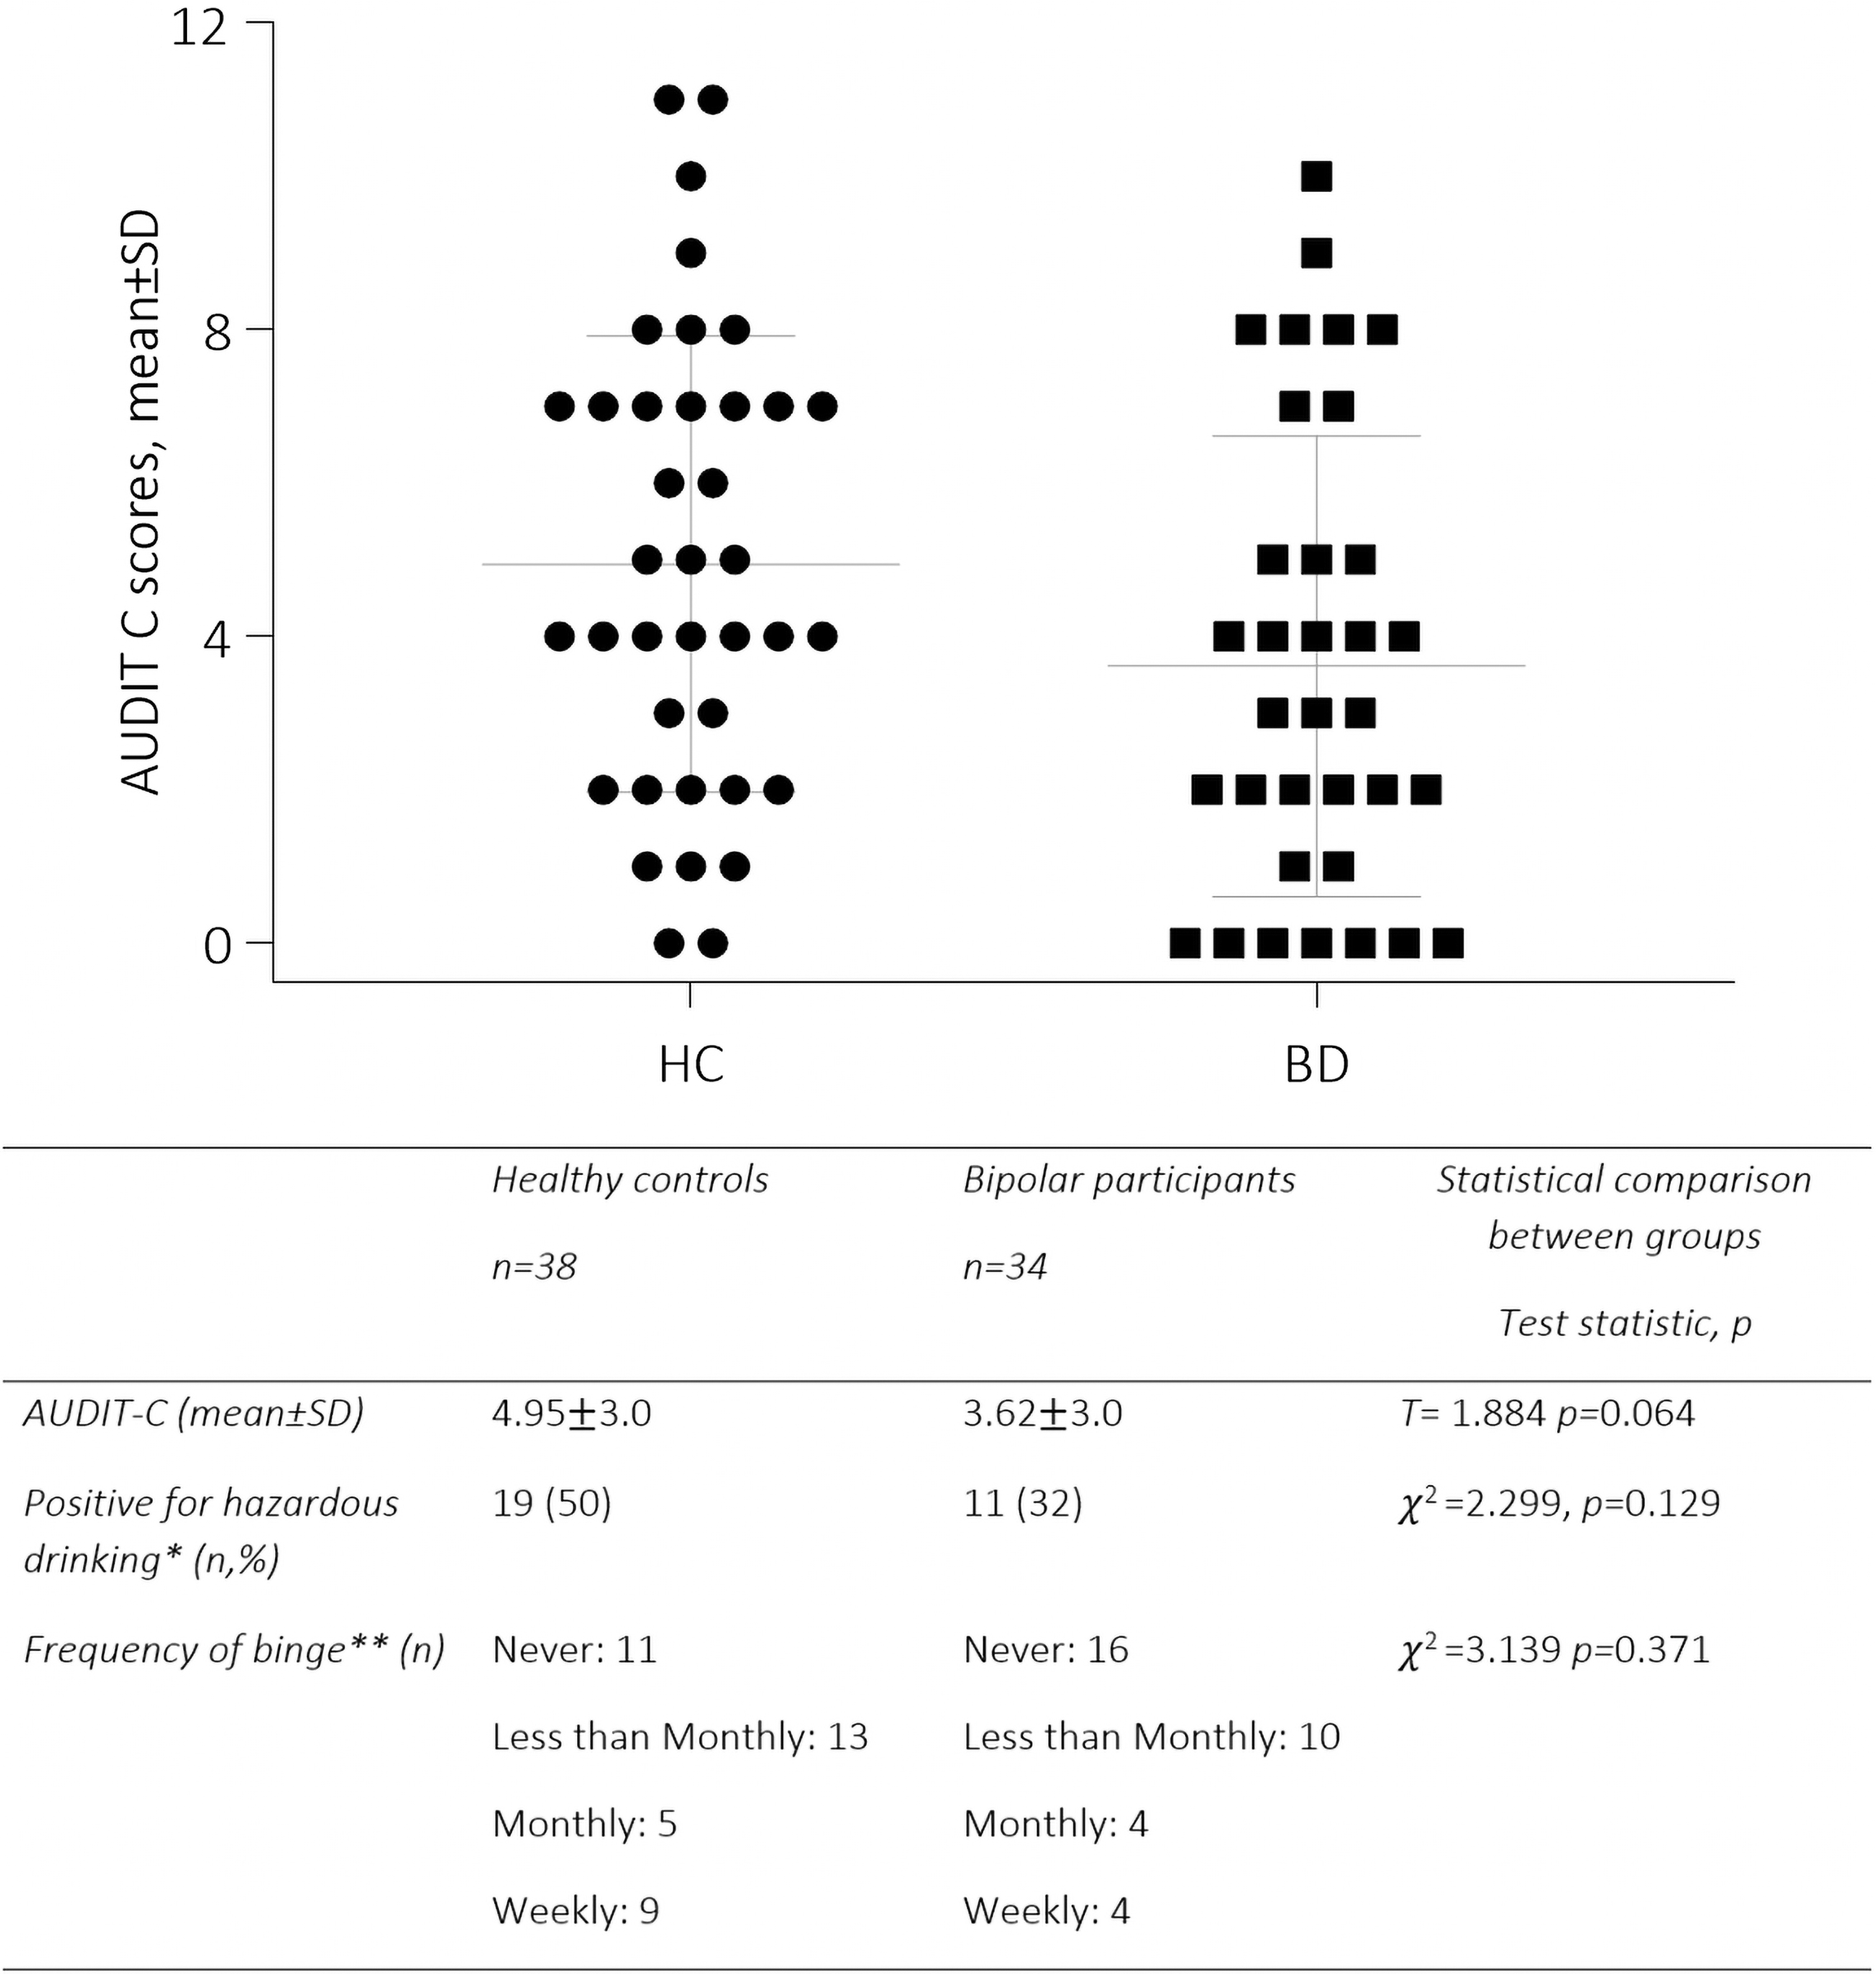
Comparable alcohol use scores between HC and bipolar participants. *Hazardous drinking is defined as scoring >5 in the AUDIT-C. **A binge is defined as drinking more than six standard drinks in one setting. AUDIT-C, Alcohol Use Disorders Identification Test-Consumption; BD, bipolar participants; HC, healthy controls; SD, standard deviation.
Alcohol use and subnetwork analysis
Edge-level analysis revealed a subnetwork of the brain associated with alcohol use that was significant at threshold F range 5–8.4, p = 0.031 (Supplementary Table S1 and Fig. 2). This network remained significant when examined by using extent or intensity, demonstrating that alcohol has a strong and distributed impact. Average connectivity strengths plotted against AUDIT-C score demonstrated that alcohol use was associated with an increase in connectivity strength within this network. Nodes involved in fronto-limbic, basal ganglia, and temporal circuitry were involved in this connected component, in particular the nucleus accumbens, caudate, putamen, amygdala, hippocampus, temporal pole, lateral, and medial frontal areas.
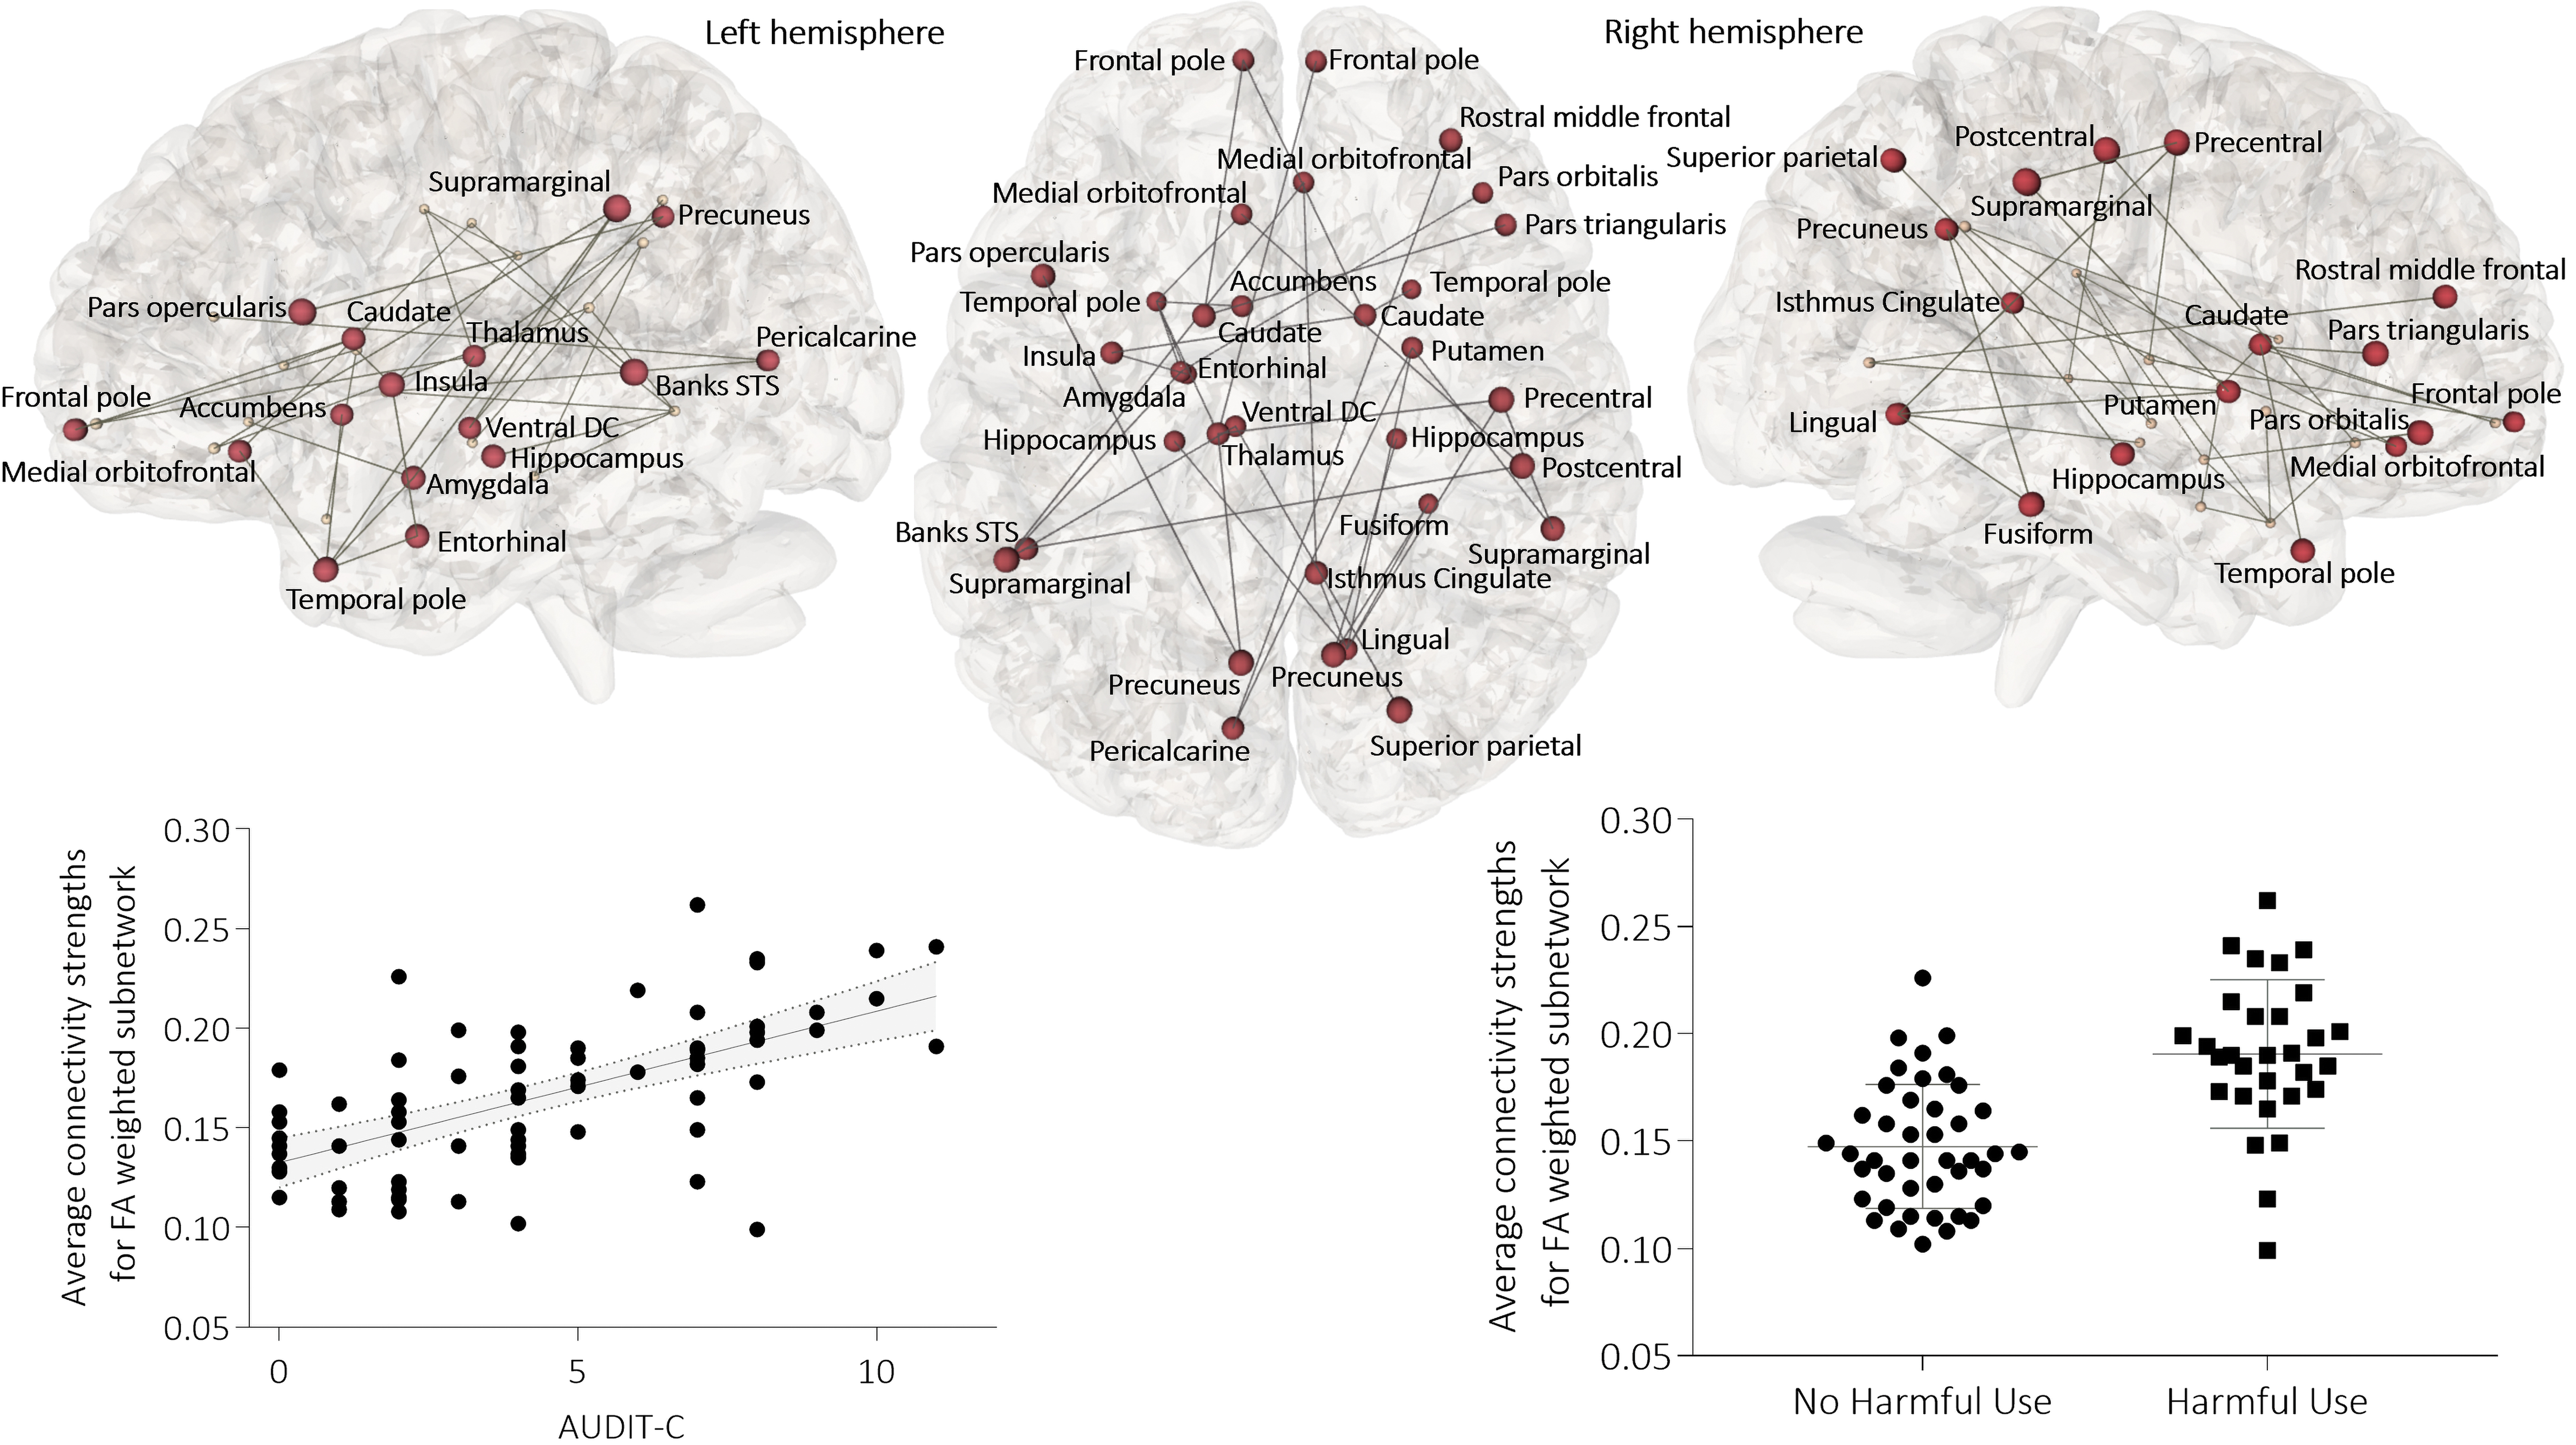
Alcohol use relates positively with connectivity in a fronto-limbic, basal ganglia, and temporal subnetwork. Subnetwork of the brain associated with AUDIT-C scores for all participants (F = 8.4, p = 0.031). Color images are available online.
Further permutation analysis revealed that alcohol use is associated with a subnetwork involving cortico-limbic, and basal ganglia connections, with differential connectivity strengths in BD participants relative to controls; the subnetwork was significant at threshold F range 5–8.8, p = 0.033 (Supplementary Table S1 and Fig. 3). This subnetwork included nodes involved in reward and emotion processes, including caudate, hippocampus, anterior cingulate, and orbitofrontal cortices, and superior and middle temporal gyri (Fig. 3).

In bipolar participants relative to controls, connectivity negatively relates to alcohol use in a cortico-limbic, basal ganglia subnetwork. Subnetwork of the brain associated with an interaction between diagnosis and AUDIT-C score (F = 8.8, p = 0.033). Color images are available online.
The interaction appears to be driven by the BD groups, as increasing alcohol use scores were associated with lesser connectivity strengths for BD participants; this relationship is absent in the HC group. Potential confounds to these results found in BD participants related to medication, mood ratings, and socioeconomic status (SES) scores were investigated. Connectivity strength of the subnetwork was not associated with the use of lithium [F(4,34) = 0.458, p = 0.504] or antipsychotics [F(4,34) = 2.061, p = 0.162], mood rating scores using the HMRS [F(4,34) = 1.854, p = 0.184] or the YMRS [F(4,34) = 3.704, p = 0.064], or with SES scores [F(4,34) = 1.614, p = 0.214].
Alcohol use and global network topology
Global topological organization was not associated with alcohol use, which was reflected in a lack of alteration in information integration and segregation measures. There was no main effect of alcohol detected for any measure of the overall integration or segregation across the whole brain after correction for multiple comparisons. Similarly, a diagnosis of BD and non-dependent alcohol use did not appear to interact at the global brain level to impact overall pathlength, clustering, or efficacy (Table 3).
Alcohol Use Does Not Predict Alterations in Information Integration and Segregation in the Global Network
Binary, referring to presence or absence of connection; CC, clustering coefficient; CCNormalised:
Discussion
We sought to determine the association between the topological organization of the brain and non-dependent alcohol use, and whether there was a differential relationship for people with a diagnosis of BD. Alcohol was significantly related to subnetwork topology when weighted by the microstructural organization of the fiber bundle, encompassing connections between fronto-limbic, basal ganglia, and temporal nodes, and it was not detected to have an effect globally on brain connectivity. In addition, together alcohol and diagnosis were associated with a second subnetwork comprising cortico-limbic and basal ganglia connections; the strength of connectivity of this second subnetwork was negatively related to alcohol use in BD, and this relationship was absent in controls.
There was no difference in alcohol use scores between the diagnostic groups, demonstrating that for our sample, people with a diagnosis of BD were not more likely to drink alcohol, or engage in binge alcohol use compared with HC. Our data are limited, as alcohol use is assessed in a self-report measure and may reflect an underestimation of our participant's alcohol use, which could have implications for the results in both groups. However, our alcohol use scores are in line with those reported in a larger European study, suggesting that these figures may be a reasonable and expected reflection of alcohol use within the groups (Lange et al., 2016). Moreover, the clinical assessment of alcohol use is undertaken via self-report, lending some clinical relevance to our findings.
We demonstrate that alcohol use is associated with a differently connected subnetwork of the brain involving regions responsible for reward, emotion regulation, and cognitive control processes, which are not lateralized. The network elements (nodes and edges) are topologically arranged in a manner that changes with increasing alcohol use for all participants, resulting in greater connectivity strength of the subnetwork.
Previous studies have demonstrated widespread lower cortical thickness and changes in subcortical volumes (Lange et al., 2016; Topiwala et al., 2017). We support these findings by providing evidence for subnetwork topology involving the areas implicated in these studies. As the AUDIT-C assesses alcohol use over a 12-month period, the topological organization of the subnetwork is not likely to be related to the initial impacts of alcohol, and it may reflect cumulative long-term use. These findings suggest that at a network level non-dependent alcohol use is associated with subnetwork alteration.
Alcohol initially acts on reward circuitry, stimulating an increase in the influence or salience of alcohol-related clues and can, therefore, reinforce the likelihood of future alcohol consumption (Koob and Volkow, 2016). Nodes in the connected component associated with reward and salience processes are the caudate, putamen, and nucleus accumbens, and the insula (Koob and Volkow, 2016). These areas are proposed to be active during intoxication and interact with circuits involved in emotional regulation, such as amygdala and hippocampus, to disrupt typical processing and regulation of emotions (Koob and Volkow, 2016).
In addition, circuits involved in goal-directed behavior through the regulation of the salience of environmental clues, and promotion of cognitive control are also impacted by alcohol use and are found in this subnetwork, with these being prefrontal areas, hippocampus, and amygdala (Koob and Volkow, 2016). The transition from non-dependent alcohol use to habitual use involves repeated activation of circuitry, heightening the salience and rewarding effects of alcohol, and disrupts processes associated with cognitive control (Naqvi and Bechara, 2010).
For BD participants there was an effect of alcohol on the topological configuration of an anatomical subnetwork involving the collective arrangement of nodes involved in cortico-limbic and reward networks, which was not evidenced in controls. The absence of a relationship between alcohol use and connectivity strength of the network in the control group suggests a diagnosis-specific biological vulnerability for non-dependent alcohol use and may be consistent with the observed deleterious illness course associated with alcohol use in BD (Gordon-Smith et al., 2020).
Differential connectivity within reward and emotional circuitry related to BD diagnosis has been demonstrated (Nabulsi et al., 2019), suggesting that preexisting topological alterations may be driving the association with alcohol use within the BD group. Reductions in interhemispheric connectivity have been demonstrated in BD and are associated with alterations in cognition (Ajilore et al., 2015; Collin et al., 2016); we demonstrate reductions in connectivity strength in specific interhemispheric connections with alcohol use in BD.
Moreover, alterations in white matter microstructural organization within the cingulum have been demonstrated in a large-scale, multisite study in BD in comparison to controls (Favre et al., 2019). This white matter tract connects cortico-limbic nodes and is involved in emotional regulation and salience detection (Favre et al., 2019). Taken together, this suggests that a preexisting features of the disorder may interact with alcohol use to place further stress on the network.
There was an overlap of eight nodes (18%) between our two subnetworks: the hippocampus, caudate, pre- and post-central, entorhinal, lingual and supramarginal gyri, and the pars opercularis; a number of these nodes are involved in reward and emotion processes. Dysfunction within reward circuitry in BD contributes to mood lability and depressive episodes within the disorder. Dysconnectivity between frontal and temporal areas is believed to underlie this aberrant functionality (Phillips and Swartz, 2014; Redlich et al., 2015).
This may be reflected by the reductions in connectivity strength within cortico-limbic circuitry demonstrated in this study, in particular between the hippocampus, precentral, and pars opercularis nodes that overlap between subnetworks. The connections between nodes and edges identify some of the mesoscale subnetworks driving the emergence of complex behavior, which are capable of responding effectively and efficiently to environmental stimuli (Bassett and Gazzaniga, 2011).
The structure of these subnetworks will not define the function of the system; however, the adaption of the system to an environmental impact is likely to shape emergent complex behavior going forward (Sporns, 2018). This suggests that the environmental stimulus of non-dependent alcohol use may place additional stress on reward and emotion network interactions, thus contributing to a biological vulnerability to relapse within the disorder.
We did not find any association between alcohol use and global connectivity measures, suggesting that alcohol does not impact the brains’ global topology. Previous connectivity research in AUD has demonstrated heterogenous findings, with some studies demonstrating reductions in global efficiency in association with increased duration of chronic alcohol use, and others reporting no difference between AUD and HC (Sjoerds et al., 2015; Zhu et al., 2018; Zorlu et al., 2017).
An electroencephalographic study has demonstrated increased global efficiency and density of a resting-state network, and reduced path length in association with acute alcohol use in social drinkers (Lithari et al., 2012). These alterations are suggested to facilitate communication, thus allowing the effects of alcohol to spread more efficiently around the brain (Lithari et al., 2012). Conversely, this increase in efficiency is suggested to lead to reductions in global efficiency in chronic use due to damage associated with alcohol use (Lithari et al., 2012).
This study can neither confirm nor deny these findings; however, it is worth noting that an efficient network can facilitate disease progression, and the same processes could also aid in damage to the architecture of the brain due to the toxic effects of alcohol use.
Network topology as well as the modular organization of the network into intrinsic functional networks are found to support the optimization of signal propagation through a network, thus influencing behavioral outcomes (Suárez et al., 2020). The interaction of network topology and dynamics support the flexibility of the network, allowing for a rich behavioral repertoire that is capable of responding rapidly to environmental demands (Suárez et al., 2020). Providing initial descriptions of alterations to intrinsic functional networks in association with BD and non-dependent alcohol use may provide further insight into an imbalance in between network connectivity, pointing to vulnerability to relapse in the disorder.
A further exploration into the functional deviations arising from changes to topological organization of the brain may then be useful to identify possible compound impact to reward and emotion processing both independently in alcohol use and BD, and the interactive network effects.
We demonstrate, in a first endeavor, to understand the topological impacts of non-dependent alcohol use, subnetwork patterns of connectivity involving fronto-limbic, cortico-limbic, reward, and temporal connections. Both control and BD participants demonstrated alcohol-related differences in brain structural connectivity, and even though there was no statistically significant difference in alcohol consumption scores between the groups, BD-specific patterns of changes were also detected with functional relevance to reward and cognitive processes.
The results suggest that preexisting subnetwork alterations may be placed at additional vulnerability to the impact of alcohol use, which is reflected in connectivity alterations between cortico-limbic and basal ganglia structures. This altered pattern of connectivity may impact reward expectancies and emotion processing, thus influencing emotional lability within the disorder. These findings also suggest that alcohol use may have an effect on MRI studies that is not being adequately controlled for. Moreover, these results indicate that clinical guidelines should reflect the impact that alcohol use may have on illness trajectory for people with a diagnosis of BD.
Authors’ Contributions
D.M.C. designed, obtained funding for, and supervised data collection, analysis, and interpretation; B.H. and C.M.D. contributed to recruitment and intellectual content; L.N. and G.M.P. recruited and collected data, performed MRI data quality checks; S.O.D. and L.K. contributed matlab scripts; F.M.M. contributed to recruitment and data collection, conducted all analyses, and wrote the article; all authors reviewed the findings and their interpretation.
Footnotes
Author Disclosure Statement
No competing financial interests exist.
Funding Information
This research was funded by the Health Research Board (HRA-POR-324) awarded to D.M.C., and the College of Arts, Social Sciences, and Celtic Studies, School of Psychology, Galway Doctoral Scholarship awarded to F.M.M.
Supplementary Material
Supplementary Table S1
References
Supplementary Material
Please find the following supplemental material available below.
For Open Access articles published under a Creative Commons License, all supplemental material carries the same license as the article it is associated with.
For non-Open Access articles published, all supplemental material carries a non-exclusive license, and permission requests for re-use of supplemental material or any part of supplemental material shall be sent directly to the copyright owner as specified in the copyright notice associated with the article.